Embed Size (px)
Citation preview

Measuring walking and running dynamics using skin
mounted accelerometersSurjo Dutta and David Friedman
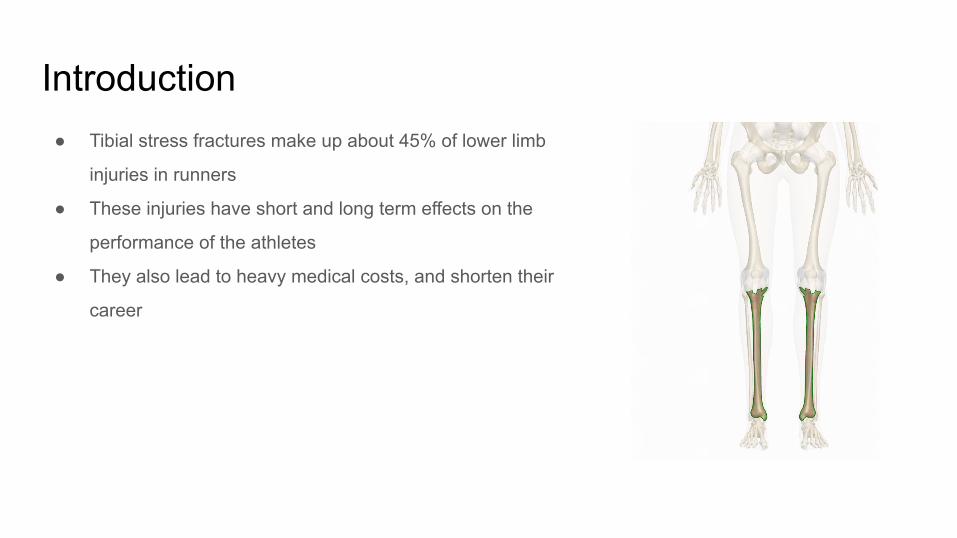
Introduction● Tibial stress fractures make up about 45% of lower limb
injuries in runners
● These injuries have short and long term effects on the
performance of the athletes
● They also lead to heavy medical costs, and shorten their
career

Introduction
● The number of runners in the US has steadily
increased over the decade
● We must find methods to study the form and
technique of runners

Previous Attempts
● Brayne et al. used a
consumer-grade wireless
accelerometer called RunScribe
● Sensor was skin mounted, sampled
at 1kHz

Previous Attempts● Milner et al. used the six camera
Vicon 512 system
● Runners ran on a force-measuring
platform while wearing reflective
trackers
Previous Attempts ● Lafortune et al. used bone mounted
transducers (BMTs) to do the job
● Accelerometers were attached onto
the tibia using a 4.7mm diameter
Steinmann intracortical pin
Trust us, you don’t want a picture here

Our Method● To our Arduino Mega, we connected three 9-axis
Accelerometer-Gyroscope-Magnetometer sensors
● We had to use a I2C multiplexer because the sensors are identical, and
hence have the same I2C address
● The bottlenecks to our sample rate were the address switching by the
multiplexer and the writing of the data to the SD card
● Which meant we could read 3-axis accelerometer and 3-axis gyroscope from
each sensor at 110Hz

Our device (one big pedometer)
LSM9DS1 x3(waterproofed)
Ankle strap
Thigh/ calf strap
DAQ (input/output)
Additional accelerometerinput sockets

Track running/walking setup● The arduino, PCB and 9V battery supply were kept in a backpack with the
wires to the sensors coming out of it
● A sensor was attached to each ankle using tight velcro straps
● Another one was attached to the belt buckle
● We used velcro straps at the thighs to guide the wires and keep them from
dangling

Treadmill running/walking setup● The setup on the treadmill was simpler since we could simply keep the device
in the cup holder
● And this meant we could take a video of each of our running techniques

Running and walking gait characterization● Two main phases:
○ Stance phase (A-B): ■ Begins with contact with ground, ends with leaving ground■ Contact phase (A) - contact with ground■ Propulsion phase (B) - push off from ground
○ Swing phase (C-D) - foot moving through the air:■ Begins with lift off from ground, ends with contact.
A B C D

Measuring the accelerations of walking and running● Used a force pad to measure the “vertical ground reaction force” (VGRF) of walkers and
runners● Sample rate was 2500 Hz
Walking Running Walking-Running transition
[8] Anthony Tongen, and Roshna Wunderlich.

Data Analysis: Outline
● All analysis was done offline in Python○ Step one: Calibration of raw accelerometer/gyroscope data○ Step two: Correction of accelerometer data using gyroscope○ Step three: Partition of data to define individual steps
■ Partition algorithm problems and pitfalls○ Step four: Optimization○ Step five: Generate average step○ Step six: Error analysis

Calibration● Based off of the calibration
algorithm implemented in the Sparkfun library
● Input:○ Acceleration and gyroscope data○ Axis oriented in direction of “g”○ Calibration data range (for bias
determination)
● Output:○ Acceleration/gyro data with bias
subtracted○ Axis in direction of “g” reads
approximately 1.0 g
Calibration data
Bias subtraction

Subtraction of “g” using gyroscope● Problem: orientation of sensor changes constantly during motion● Solution: use gyroscope data to calculate ∆𝛳 of the accelerometer
○ Numerically integrate angular velocity to obtain angles○ What about drift? → use scipy “filtfilt” with scipy butterworth filter○ Project g onto constantly changing accelerometer reference frame using euler angles
Filter
∆𝛳
(rad)
Count Count

Partitioning of Data into ‘Steps’ (pedometer algo)
● What feature(s) of the acceleration data can be used to define a step?
Acceleration magnitude data
Vertical acceleration data
Acc
eler
atio
n (g
)
Time (sec)

● Peak finding works OK for both types of data...● Using peaks to partition data into steps:
Partitioning of Data into ‘Steps’ (pedometer algo)
● Find clusters of peaks○ Can measure the distances between them, want to treat a cluster as one feature
Acc
eler
atio
n (g
)
Time (sec)

● Split data between clusters of peaks○ Make a partition if [distance b/w peak i and peak i+1] > average distance between peaks○ Partition start and end halfway between peak clusters
Partitioning of Data into ‘Steps’ (pedometer algo)A
ccel
erat
ion
(g)
Time (sec)

Problems and Pitfalls● Jolts and stumbles in the middle of a data set
○ Can cause the partitions to be defined inconsistently
Glitch!Before glitch
After glitch

Problems and Pitfalls● Natural, slow changes in the subject’s gait
○ Significant changes in step duration over a particular data set○ Need a different analysis to characterize this○ Unexplored avenue of gait characterization!
Time duration of steps often change slowly (over 10s - 100s of steps).
Step count Step count
Tim
e
Tim
e

Optimization of Partitions● The partition algorithm can be tuned in the following ways:
○ Threshold value for acceptable peaks■ Decrease variance in partition sizes and beginning/end points
○ Orientation of data set■ In acceleration data, some of the “trough” features are more consistent then peaks
○ Correction of inconsistent partition formation■ Identify inconsistent partition formation, discard problem data, correct inconsistencies
Peakthresholdoptimization
Tim
e
Step count

Generate Average step● Input: acceleration data set, partitions generated by partition algo.
○ Use 10 ms bins for data points○ Plot average of each bin
● Output: Average bin values, uncertainty (acceleration), uncertainty (step duration)
Time (sec)A
ccel
erat
ion
(g)

Optimization and average step outputOptimized peak threshold (increased from average)Default peak thresholds (the
average value of the data set)
● Raising the peak threshold generally increases the sharpness of the highest peaks● However, it can muddy peaks that fall below the threshold

Results: How well does the averaging model the data?
● Very obvious asymmetry b/w orange and blue data sets in raw data (blue > orange)● Problem: in averaged data, the difference appears less significant● Averaging tends to smear sharp, low resolution peaks. These peaks account for much of the
apparent difference b/w the two data sets.
0.2 0.4 0.6 0.8

Interpreting walking data
B C DA
A
B
C
D

Left and Right leg Time ShiftA
ccel
erat
ion
(g)
Acc
eler
atio
n (g
)
Time (sec) Time (sec)
Left
Right

Subject one: walking
Right Leg Left Leg
Step duration (ms) 926.0 +/- 7.8 927.9 +/- 6.9
Contact acc max (g) 2.172 +/- 0.075 1.567 +/- 0.032
Propulsion acc max (g) 2.757 +/- 0.143 2.483 +/- 0.068
Acc
eler
atio
n (g
)
Time (sec)
Time (sec)
Acc
eler
atio
n (g
)
Left
Right
Left
Right

Subject two: walking
Right Leg Left Leg
Step duration (ms) 854.4 +/- 4.51 854.5 +/- 4.5
Contact acc max (g) 1.870 +/- 0.032 1.911 +/- 0.031
Propulsion acc max (g) 3.283 +/- 0.065 2.976 +/- 0.073
Acc
eler
atio
n (g
)
Time (sec)
Acc
eler
atio
n (g
)
Time (sec)
Left
Right
Left
Right

Centre of Mass
● Centre of mass magnitude data is periodic, but complicated.
● It is better to look at the individual components of acceleration
forward
hip
vertical
Acc. mag.
Acc.

Centre of Mass Averages (walking)A
ccel
erat
ion
(g)
Time (sec)
Subject two
Subject one
a.) b.) c.)
a.) vertical
b.) forward
c.) hip

Interpreting running data
B C DA
A
B
C
D

Subject one: Running
Right Leg Left Leg
Step duration (ms) 711.2 +/- 58.1 708.3 +/- 55.3
Contact acc max (g) N/A 3.488 +/- 0.032
Propulsion acc max (g) 8.511 +/- 0.482 6.769 +/- 0.339
Acc
eler
atio
n (g
)
Time (sec)
Time (sec)
Acc
eler
atio
n (g
)
Left
Right
Left
Right

Subject two: Running
Right Leg Left Leg
Step duration (ms) 623.2 +/- 48.1 623.4 +/- 48.0
Contact acc max (g) 4.156 +/- 0.063 4.089 +/- 0.043
Propulsion acc max (g) 3.284 +/- 0.148 3.427 +/- 0.131
Acc
eler
atio
n (g
)
Time (sec)
Acc
eler
atio
n (g
)
Time (sec)
Left
Right
Left
Right

Discussion: Asymmetries● It is clear from the graphs, the accelerations experienced by the right ankle of
subject one are significantly greater than the left ankle
● Could be a sign of pronation, supination or “leg length discrepancy”
● We have shown it is possible to observe such discrepancies using our
method

Discussion: Heel strike vs. Toe strike
● Subject one’s graph exhibits a shoulder pattern right before the large
peak
● Subject two’s graph instead shows another smaller peak right after the
large peak
● The majority of these differences are probably because subject one uses
the Toe Strike technique, where subject two uses the heel strike
technique

Conclusions● Our study demonstrated how, through the collection of raw accelerometer and
gyro data we can obtain accurate values of acceleration for an average step
of a subject
● Hence, this method can be used for future studies into the techniques used by
runners, whether for diagnostic purposes or to improve and perfect a
technique
● Such accurate data could also be a useful tool for rehabilitation for patients
trying to regain full motion of the lower limbs

References1. Bennell, Kim L., et al. “The Incidence and Distribution of Stress Fractures in Competitive Track and Field Athletes: A Twelve-Month Prospective Study.” The
American Journal of Sports Medicine, vol. 24, no. 2, Mar. 1996, pp. 211–217, doi:10.1177/036354659602400217.
2. Hreljac, Alan. “Impact and Overuse Injuries in Runners.” Medicine & Science in Sports & Exercise, 1 May 2004,
insights.ovid.com/crossref?an=00005768-200405000-00017.
3. Aschwanden, Christie. “Age Matters.” Runner's World, 31 Aug. 2018, www.runnersworld.com/advanced/a20848096/age-matters-for-marathoning/.
4. “Running/Jogging Participants US 2006-2017 | Survey.” Statista, 2017, www.statista.com/statistics/190303/running-participants-in-the-us-since-2006/.
5. Brayne, L., Barnes, A., Heller, B. et al. Sports Eng (2018) 21: 487. https://doi-org.proxy2.library.illinois.edu/10.1007/s12283-018-0271-4
6. Milner, Clare. “Are Knee Mechanics during Early Stance Related to Tibial Stress Fracture in Runners?” Redirecting, July 2017,
doi.org/10.1016/j.clinbiomech.2007.03.003.
7. Lafortune, Mario. “Tibial Shock Measured with Bone and Skin Mounted Transducers.” Redirecting, 1995, doi.org/10.1016/0021-9290(94)00150-3.
8. Tongen, Anthony et al.. Clinics in Sports Medicine (1994). https://www.researchgate.net/publication/15394317_The_biomechanics_of_walking_and_running