Embed Size (px)
DESCRIPTION
Run 9 polarized proton Log 9 Jan begin 45 degree cool down from room temp (3 MW- NEW ) 2 Feb, Cool-down to 4.5 degrees begins 5 Feb, Blue ring cold but still stabilizing 7 Feb, beam injected into Blue ring, 8 Feb, Yellow cold but still stabilizing - PowerPoint PPT Presentation
Citation preview

Run 9 polarized proton Log
• 9 Jan begin 45 degree cool down from room temp (3 MW-NEW)• 2 Feb, Cool-down to 4.5 degrees begins• 5 Feb, Blue ring cold but still stabilizing• 7 Feb, beam injected into Blue ring, • 8 Feb, Yellow cold but still stabilizing• 9 Feb, 2 week “Setup” mode begins (0.5 weeks early)• 13 Feb, Beam injected into Yellow ring • 14 Feb, STAR magnet on, ramp development begins• 17 Feb Nov, First collisions @ s = 500 GeV (2.3 weeks into run – a record!)• 24 Feb, “Ramp-Up” mode begins, overnight stores for experiments• 6 Mar, Machine in “Physics” mode, integrated lumi begins• 16 Mar, Spin rotator ramps established, longitudal polarization available• 17 Mar Experiments in Physics mode• 13 April (1200), end s = 500 GeV physics (3.9 weeks), begin last s = 500 GeV beam
development followed by new low level RF setup• 15 April (0800), Maintenance and s = 200 GeV ramp setup• 15 April (2100), begin setup with beam for s = 200 GeV • 20 April (2341), s = 200 GeV physics begins (8 days early) with further ramp-up• 21 April (1802), PHENIX physics begins• 23 April , STAR physics begins• 29 June (0800), end s = 200 GeV main physics run (10 weeks)• 29 June (0800), setup for pp2pp at STAR run begins, PHENIX remains on• 30 June (0009), pp2pp Physics on but beam tune-up continues• 4 July (1000), pp2pp ends (0.6 weeks), beam studies at s = 500 GeV begin• 6 July (1000), RHIC beam studies end, cryo warmup begins• 8 Jul, cryo warm-up ~complete, 22.3 weeks cryo operation

Run 9 s = 500 GeV Physics Goals
• PHENIX~75 pb-1 delivered, ~25 pb-1 recorded
~50% polarization, quality factor is P2L = 19 pb-1 delivered
• STAR~ 30 pb-1 delivered, ~ 10 pb-1 recorded
~ 50% polarization, quality factor is P2L = 7.5 pb-1 delivered

0
10
20
30
40
50
60
70
80
90
100
5-Mar 12-Mar 19-Mar 26-Mar 2-Apr 9-Apr
Inte
gra
ted
Lu
min
osit
y (
pb
-1)
Run 9 250 x 250 GeV polarized protons
Integrated Luminosity - Final
Machine
STAR-Physics
PHENIX-Physics~Phenix goal (25 pb-1 recorded)With 50% longitudal polarization P2L QF
~Star goal (10 pb-1 sampled)with 50% longitudal polarization P2L QF
Experiments start physics with longitudal polarization
Blue average polarization (preliminary Jet target) = 33.1 ± 0.8 %Yellow average polarization (preliminary Jet target) = 35.1 ± 0.9 %

0.0
5.0
10.0
15.0
20.0
25.0
03
/05
/09
03
/12
/09
03
/19
/09
03
/26
/09
04
/02
/09
04
/09
/09
L*P
2
date
Run9 (√s=500 GeV) -- STAR / PHENIX Figure of Merit Jet Target Average (Longitudinal Polarization)
Lmin*P 2̂ <P>=0.5 in 8 wks
Lmax*P 2̂ <P>=0.6
STAR (NOT singles corrected)
Phenix (singles corrected)PHENIX goal
STAR goal

0
5
10
15
20
25
30
35
40
45
50
55
60
65
70
10380 10400 10420 10440 10460 10480 10500 10520 10540 10560
Po
lari
zati
on
(%
)
Run Number
Run 9 250 x 250 GeV Jet Target, final preliminary results
Bule Jet
Yellow Jet
Blue Average
Yellow Average
Blue average = 33.1 ± 0.8 %Yellow average = 35.1 ± 0.9 %

0
5
10
15
20
25
30
35
40
45
50
55
60
10380 10400 10420 10440 10460 10480 10500 10520 10540 10560
Po
lari
zati
on
(%)
Run Number
Run 9 250 x 250 GeV Jet Target, final preliminary resultseach point (except last) is average over 5 stores
Blue Jet
Yellow Jet
Blue Average
Yellow Average
Blue average = 33.1 ± 0.8 %Yellow average = 35.1 ± 0.9 %

0
10
20
30
40
50
60
70
10330
10340
10350
10360
10370
10380
10390
10400
10410
10420
10430
10440
10450
10460
10470
10480
10490
10500
10510
10520
10530
10540P
ola
riza
tio
n (%
)
RHIC Store Number
Jet Target Measurements in RHIC after 10 MarchAGS measurement from AGS eLog close in time to RHIC store AGS
Y-Jet
B-Jet

0
10
20
30
40
50
60
70
10330
10340
10350
10360
10370
10380
10390
10400
10410
10420
10430
10440
10450
10460
10470
10480
10490
10500
10510
10520
10530
10540
Po
lari
zati
on
(%)
RHIC Store Number
CNI (Yellow-1) Measurements in RHIC after 10 Marchaverages for each physics store
Y-1 Average (23.7)
Y-1 Average for store (249.7)
Y-Jet

0
10
20
30
40
50
60
70
10330
10340
10350
10360
10370
10380
10390
10400
10410
10420
10430
10440
10450
10460
10470
10480
10490
10500
10510
10520
10530
10540P
ola
riza
tio
n (%
)
RHIC Store Number
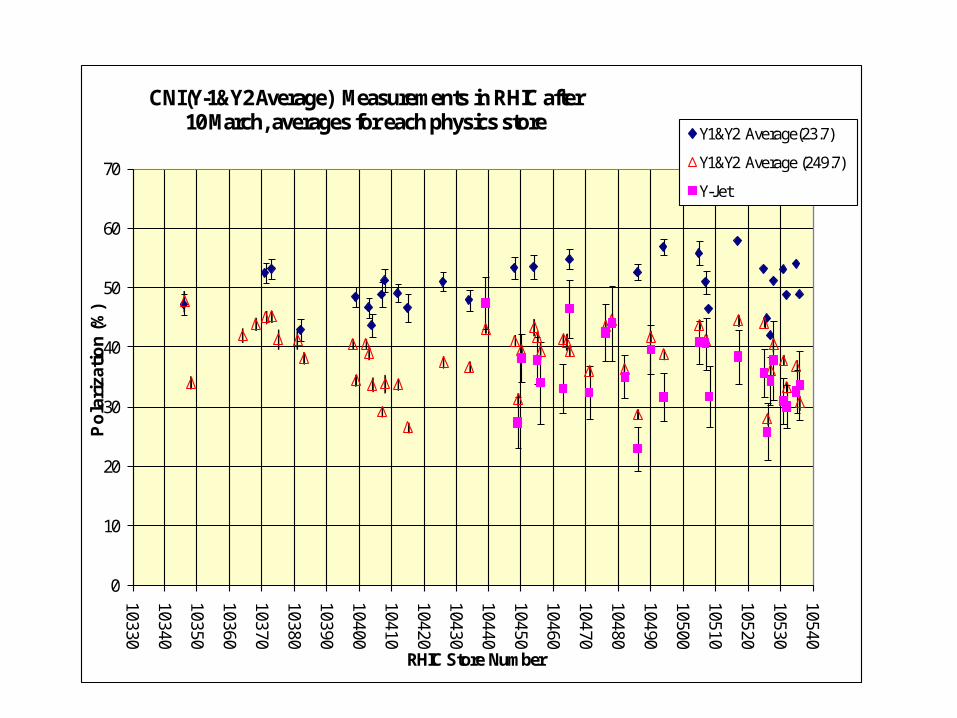
CNI (Yellow-2) Measurements in RHIC after 10 Marchaverages for each physics store
Y-2 Average (23.7)
Y-2 Average for store (249.7)
Y-Jet
0
10
20
30
40
50
60
70
10330
10340
10350
10360
10370
10380
10390
10400
10410
10420
10430
10440
10450
10460
10470
10480
10490
10500
10510
10520
10530
10540
Po
lari
zati
on
(%)
RHIC Store Number
CNI (Y-1&Y2 Average) Measurements in RHIC after 10 March, averages for each physics store
Y1&Y2 Average(23.7)
Y1&Y2 Average (249.7)
Y-Jet


Archive

UNCALIBRATED
CNI (Yellow-1) Measurements in RHIC after 10 Marchaverages for each physics store
0
10
20
30
40
50
60
70
10330
10340
10350
10360
10370
10380
10390
10400
10410
10420
10430
10440
10450
10460
10470
10480
10490
10500
10510
10520
10530
10540
RHIC Store Number
Pola
riza
tion (%
) 1
Y-1 Average (23.7)
Y-1 Average for store (249.7)
Y-Jet
Linear (Y-1 Average for store(249.7))Linear (Y-Jet)

UNCALIBRATED
CNI (Y2/Y1 Average) Measurements in RHIC after 10 March, averages for each physics store
0
0.2
0.4
0.6
0.8
1
1.2
1.4
1.6
1.8
2
10330
10340
10350
10360
10370
10380
10390
10400
10410
10420
10430
10440
10450
10460
10470
10480
10490
10500
10510
10520
10530
10540
RHIC Store Number
Y2/
Y1
1
Y2/Y1 (23.7)
Y2/Y1 (249.7)
Linear (Y2/Y1 (249.7))
Linear (Y2/Y1 (23.7))


Run 9 Physics stores, 10 March – 13 April - Final
Y2 vs Y1 CNI at Store
20
25
30
35
40
45
50
55
60
65
70
75
80
20 25 30 35 40 45 50 55 60 65 70 75 80
Y1 (uncalibrated polarization %)
Y2
(unca
libra
ted p
ola
riza
tion %
) 1
Y2 vs Y1 CNI at Injection
20
25
30
35
40
45
50
55
60
65
70
75
80
20 25 30 35 40 45 50 55 60 65 70 75 80
Y1 (uncalibrated polarization %)
Y2
(unca
libra
ted p
ola
riza
tion %
) 1

UNCALIBRATED
CNI (Yellow-2) Measurements in RHIC after 10 Marchaverages for each physics store
AGS measurement close in time to RHIC store
0
10
20
30
40
50
60
70
10330
10340
10350
10360
10370
10380
10390
10400
10410
10420
10430
10440
10450
10460
10470
10480
10490
10500
10510
10520
10530
10540
RHIC Store Number
Pola
riza
tion (%
) 1
Y-2 Average (23.7)
AGS

UNCALIBRATED
CNI (Yellow-1) Measurements in RHIC after 10 Marchaverages for each physics store
AGS measurement close in time to RHIC store
0
10
20
30
40
50
60
70
10330
10340
10350
10360
10370
10380
10390
10400
10410
10420
10430
10440
10450
10460
10470
10480
10490
10500
10510
10520
10530
10540
RHIC Store Number
Pola
riza
tion (%
) 1
Y-1 Average (23.7)
AGS
UNCALIBRATED
CNI (Yellow-2) Measurements in RHIC after 10 Marchaverages for each physics store
0
10
20
30
40
50
60
70
10330
10340
10350
10360
10370
10380
10390
10400
10410
10420
10430
10440
10450
10460
10470
10480
10490
10500
10510
10520
10530
10540
RHIC Store Number
Pola
riza
tion (%
) 1
Y-2 Average (23.7)
Y-2 Average for store (249.7)
Y-Jet
Linear (Y-2 Average for store(249.7))Linear (Y-Jet)

FY 2007-9 Power Bill
$(20)
$-
$20
$40
$60
$80
$100
$120
$140
12-A
ug-0
7
11-O
ct-0
7
10-D
ec-
07
08-F
eb-0
8
08-A
pr-
08
07-J
un-0
8
06-A
ug-0
8
05-O
ct-0
8
04-D
ec-
08
02-F
eb-0
9
03-A
pr-
09
02-J
un-0
9
01-A
ug-0
9
30-S
ep-0
9
$/M
Whr 1
With Balanced Billing
Without BalancedBillingBalanced BillingProjectionRHIC ON

CNI (Yellow-2) Measurements in RHIC after 10 Marchfor each physics store
0
10
20
30
40
50
60
70
5 6 7 8 9 10 11 12 13 14 15 16 17 18 19 20 21 22 23 24 25 26 27 28 29 30 31 32 33 34 35
Days since 5 March
Pola
riza
tion (%
) 1
Y-2 (23.7)
Y-2 (249.7)
CNI (Yellow-1) Measurements in RHIC after 10 Marchfor each physics store
0
10
20
30
40
50
60
70
5 6 7 8 9 10 11 12 13 14 15 16 17 18 19 20 21 22 23 24 25 26 27 28 29 30 31 32 33 34 35
Days since 5 March
Pola
riza
tion (%
) 1
Yellow-1 (23.7)
Y1 (249.7)

AGS pp log, 23 Feb 09, 00:26

P2 x I2/(average emitx,y)
0.00
0.20
0.40
0.60
0.80
1.00
1.20
1.40
0 0.5 1 1.5 2 2.5
AGS bunch intensity
Fig
ure
of m
erit 1
nt Data from 25 Feb 09 AGS Log Book00:14 Summary, Emit with RF ON P2 x I2/(average emitx,y)
0.00
0.20
0.40
0.60
0.80
1.00
1.20
1.40
1.60
0 0.5 1 1.5 2 2.5
AGS bunch intensity
Fig
ure
of m
erit 1
nt Data from 25 Feb 09 AGS Log Book00:14 Summary, Emit with RF Off
AGS Polarization and Emittance vs Bunch Intensity
0
10
20
30
40
50
60
70
80
0 0.5 1 1.5 2 2.5
Intensity (1E11)
Pola
riza
tion (%
) or
Em
itta
nce
(m
mm
r) 9
5% N
)
Pol
ExRfOFF
EyRfOFF
Data from 25 Feb 09 AGS Log Book00:14 Summary
AGS Polarization and Emittance vs Bunch Intensity
0
10
20
30
40
50
60
70
80
0 0.5 1 1.5 2 2.5
Intensity (1E11)
Pola
riza
tion (%
) or
Em
itta
nce
(m
mm
r) 9
5% N
)
Pol
ExRfON
EyRfON
Data from 25 Feb 09 AGS Log Book00:14 Summary
AGS Polarization and emittance, p2L estimate into RHIC


![Configuration Manual Polarized Proton Collider at RHIC · colliding nuclei. RHIC will also collide intense beams of polarized protons[2], reaching transverse energies where the protons](https://img.dokumen.tips/doc/110x75/5e6bfa7f4a9ff14e3c4630d1/configuration-manual-polarized-proton-collider-at-rhic-colliding-nuclei-rhic-will.jpg)