Embed Size (px)
Citation preview
Proceedings of the 28th EARSeL Symposium „Remote Sensing for a Changing Europe” 2-5 June 2008, Istanbul, Turkey
Rule-based classification of SPOT imagery using object-oriented approach for detailed land cover mapping
St. Lewinski & Z. Bochenek Institute of Geodesy and Cartography, Warsaw, Poland [email protected]; [email protected]
Keywords: object-oriented classification, SPOT, land cover, land use
ABSTRACT: Preparation of land cover / land use maps for large areas, based on automatic clas-sification of high-resolution satellite data is the objective of many application programmes, e.g. GSE Land Monitoring Services. The crucial point for this kind of activity is to apply optimal classification approach, which will ensure high class recognition accuracy and classification re-peatability. Among different approaches object-oriented approach seems to give the best results, as it allows to use various spectral and non-spectral features in the classification process and en-ables to have more control of the final map accuracy. The presented paper demonstrates the method, developed within object-oriented approach, called rule-based classification. In this method SPOT satellite image with 20-meter resolution was ana-lyzed in eCognition environment, assuming that Standard Nearest Neighbour classifier, based on selected sample objects, will not be applied. Instead of it, contents of SPOT satellite image was characterized by various spectral / texture parameters describing directly particular land cover / land use classes, as well as by pre-defined functions, determined on the basis of graphical analy-sis of feature space constructed for particular terrain objects. The classification process begins with recognition of water class, whose objects were delineated using multi-resolution segmentation. For the remaining land cover classes new segmentation is prepared. In turn, general forest class and urban class are discriminated; in the next stage both classes are divided into more specified categories. Consequently, broad agricultural and grass-land classes are determined, being next divided into more detailed information classes. In total 13 land cover / land use categories were discriminated in the presented work. Final classification map has been prepared using aggregation procedure, in order to obtain map resolution fulfilling 4ha size of Minimum Mapping Unit. Overall accuracy of all classes checked through verification process reached 89.1% with Kappa statistic 0.87.
INTRODUCTION
Concept of division of image contents into so-called objects is not new (Gonzalez & Wintz, 1977). However, only 8 years ago, when new eCognition software appeared, rapid development of object-oriented methods of image classification can be observed. New possibilities of object recognition are clearly visible, while observing improvement of tools offered to users in subsequent software versions. In many scientific centers research works aimed at preparation of optimal object-oriented methods for classification of satellite data were undertaken. These works were concentrated on two principal aspects: multi-resolution image segmentation, which would allow to delineate homo-geneous land cover classes, and on comprehensive class characteristics, taking into account both spectral and textural features, as well as relation between objects. Authors of the works used multi-

Proceedings of the 28th EARSeL Symposium „Remote Sensing for a Changing Europe” 2-5 June 2008, Istanbul, Turkey
source satellite data (Whiteside, 2005), as well as high-resolution images (QuickBird, Ikonos), which enable to apply texture and shape features more effectively (Wei et al., 2005, Kressler et al., 2005). Standard Nearest Neighbour classifier, which is based on using training areas for particular land cover classes, was the most commonly applied method of classification (Yuan & Bauer, 2006, Hajek, 2005). Recently, taking advantage of development of eCognition software, research works on new object-oriented approach were undertaken. This approach is based on using paramet-ric spectral / texture values for the determined classes and hierarchical classification. which applies decision tree method. Mostly these works were concentrated on the selected urban or natural land cover categories (Ehlers et al., 2006, Lucas et al., 2007). The presented work is a new proposal for preparing land cover map based on satellite data with 10 –30 meter resolution, using parametric approach for object-oriented classification.
STUDY AREA AND SATELLITE DATA
Methods of object-oriented classification were studied using multispectral SPOT 4 satellite image characterized by 20 meter spatial resolution. The image was collected on July 16, 2007. It covers area in central-north Poland, comprising Kujawy region.
Arable land is predominant type of land cover within this region; large areas of grasslands, as well coniferous and deciduous forests also appear here. There is also quite extensive drainage sys-tem (canals, lakes, Notec and Vistula rivers), as well as large urban agglomeration (Bydgoszcz).
SPOT satellite image prior to object-oriented classification was pre-processed. This stage includ-ed image rectification and atmospheric correction of raw satellite data. While rectifying Nearest Neighbour algorithm was used, whereas for atmospheric correction ATCOR module working with-in PCI software environment was applied.
METHODICAL APPROACH
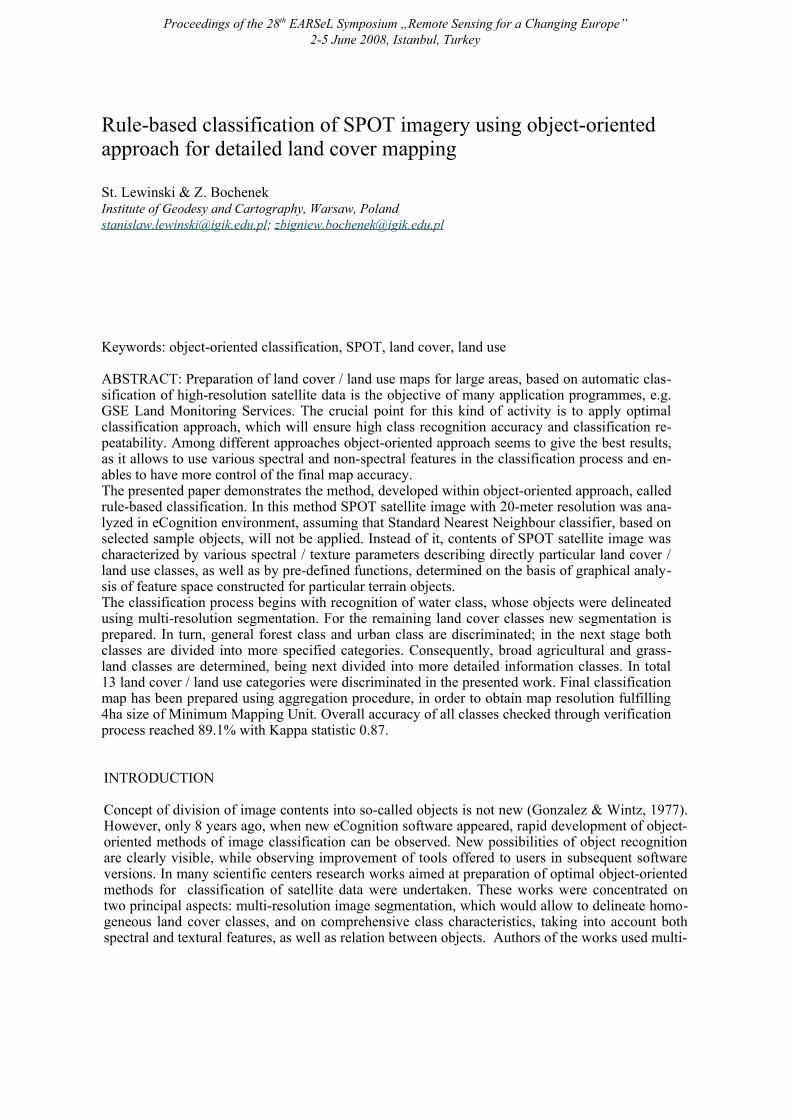
The assumed scheme of classification is presented in figure 1. Hierarchical process starts with rec-ognition of objects representing land cover class “water”. Next, general classes of forest, built-up land, meadows and agricultural land are discriminated. These general land cover categories are di-vided into subclasses in subsequent stages of classification. Then the objects, which are recognized through relations with previously discriminated classes, are classified. These are the following sub-categories: green urban areas, construction sites and deforestations. Classification flowchart starts, as usually in object-oriented approach, with segmentation. The aim of first segmentation is to create objects representing solely class “water”. This segmentation, based only on SPOT 3 band, is multistage; in the course of subsequent five cycles scale coefficient changes from 5 to 25. The assumed approach enables to delineate objects, which describe ade-quately shapes of lakes and rivers with various lengths and sizes. Next class “water” is recognized using threshold values in SPOT 3 and SPOT 4 bands, taking into account shape parameters, which help in identification of elongated river beds.
While recognizing class “water” image area represented by all non-classified objects was seg-mented once again; this segmentation was used in discrimination of the remaining classes. All four SPOT bands were applied in segmentation process; scale parameter was set to 10.
At the next stage on the basis of segmented image general forest class is delineated. (without di-vision into sub-classes). In order to do that, non-typical solution was applied; it is based on defin-ing equation of straight line, which separates forest objects from the remaining objects in two-di-mensional space formed by SPOT 3 and SPOT 4 reflectance values. Coefficients of equation were determined on the basis of graphical analysis of scatterplot formed by SPOT 3 and SPOT 4 bands. This approach is not complicated but it requires to select appropriately not large subset of image, which includes forest areas and their surroundings. The example of above mentioned scatterplot with the defined straight line is presented in figure 2; forest areas are represented by points located
Proceedings of the 28th EARSeL Symposium „Remote Sensing for a Changing Europe” 2-5 June 2008, Istanbul, Turkey
above the line. In addition, in order to limit number of objects threshold values in SPOT 1, SPOT 3 and SPOT 4 bands were applied. At the next phase forest class was divided into 3 sub-classes: de-ciduous, coniferous and mixed forests To do that brightness parameter, representing mean values of objects in all four SPOT bands was utilized. Such an approach is similar to that presented in de Kok et al. works (2000) and Lewinski work (2006), where forest sub-classes were discriminated on the basis of analysis of reflectance values in panchromatic band.
Figure 1. Classification flowchart of SPOT satellite image�

Proceedings of the 28th EARSeL Symposium „Remote Sensing for a Changing Europe” 2-5 June 2008, Istanbul, Turkey
Figure 2. Principle of recognizing forest class with the use of straight line equation
At the next stage of classification non-classified objects are analyzed in order to recognize class-es of built-up land . As in case of forests first general class of built-up land is defined and next it is divided into sub-classes. It was found as a result of analyses, that Haralick texture measure GLCM Contrast (Haralick et al., 1973) will be the basic classifier. However, texture values were not calculated on the basis of original spectral bands, but using specially transformed image, name-ly SPOT 2 band filtered with the use of Laplacian Edge Detector (Type 1) offered by PCI Geomati-ca software. This approach is similar to that proposed for forest recognition at de Kok et al. work (2005) . The applied transformation enhanced edges of objects representing built-up land; the trans-formed image is shown in figure 3. In addition, in order to increase accuracy of class recognition the following class parameters were utilized: GLCM Homogeneity texture measure based on SPOT 2 band, ratio SPOT 3 / SPOT 2 as well as threshold values in SPOT2, SPOT3 and SPOT 4 bands. Next, general class of built-up land was divided into 3 sub-classes: continuous built-up land, dis-continuous built-up land, industrial or commercial units. The division was done using ZABUD2 criterion, which is based on combination of SPOT 1, SPOT 2 and SPOT 4 bands; ZABUD2 = 10*(SPOT 2 –2*SPOT 3 + SPOT 4).
After recognizing classes of built-up land grasslands and arable land are classified. In order to do that, as in case of forests, equation of straight line was applied. The line was determined in a fea-ture space formed by SPOT 4 reflectance values and NDVI values. Objects located above this line were attributed to general class “grasslands”, while below it to general class “arable land”. In turn, grasslands were divided into 2 sub-classes: mown grasslands + fields and non-mown grasslands + fields; SPOT 3 / SPOT 4 ratio was the basis of this division. At next step, from subclass “mown grasslands + fields” final subclasses “mown grasslands” and” bare fields” were discriminated, us-ing threshold values in SPOT 4 band. Second subclass “non-mown grasslands” was delineated ap-plying difference of mean reflectance values in SPOT 2 and SPOT 1 bands, as well as threshold value in SPOT 4 band. The remaining objects existing within subclass “non-mown grasslands + fields” were divided into vegetated fields and bare fields, utilizing threshold value in SPOT 4 band.
Objects classified preliminarily as arable land were attributed to sub-classes “bare fields” and “vegetated fields”, applying threshold values in SPOT 1 and SPOT 4 bands.
At this stage of classification all objects existing on satellite image were already classified. Fur-ther action was aimed at re-classification on the basis of direct object properties and relations among particular classes.
Class “gardens” was derived from sub-class “vegetated fields”. The following parameters were used for its delineation: texture measure GLCM Contrast based on SPOT 1 band, SPOT3 / SPOT 4 ratio, mean reflectance value in SPOT 4 band, standard deviation in SPOT 3 band. Also informa-

Proceedings of the 28th EARSeL Symposium „Remote Sensing for a Changing Europe” 2-5 June 2008, Istanbul, Turkey
tion on distance from straight line dividing SPOT 4 / NDVI feature space into grasslands and ara-ble land was here utilized Application of quite a large number of parameters was indispensable due to spectral heterogeneity of the class and its diversified texture. In Poland class “gardens” includes clusters of small plots, ca 300 m2 in size, incorporating holiday cottages, garden houses or out-buildings. Vegetation within these plots can be very diversified, mainly composed from fruit trees and shrubs.
Figure 3. Example of applying Laplacian Edge Detector (Type 1) for filtering SPOT image with built-up land.
“Green urban areas” were the next class defined on the basis of already classified objects. For-ests, grasslands and vegetated fields were taken here into analysis. Degree of adjacency to built-up land was the basis classification criterion in this analysis. Similar criterion was applied in case of delineating class “construction sites”, which was initially classified as bare fields.
According to classification flowchart deforestations were the last class taken into consideration. Its recognition is quite complex process, which implies application of additional segmentation of satellite image. It is created below the main classification level in such a way, to be able to obtain small objects, which potentially could be clear-cuts. This segmentation was done on the basis of SPOT 4 band, using small scale coefficient. Clear-cuts were identified assuming, that they have higher reflectance values in SPOT 3 and SPOT 4 bands than the surrounding objects. Next re-clas-sification of forest class was performed, using relation with layer where clear-cuts and small ob-jects surrounded with forest were identified
Classes recognized separately, but representing the same (or similar) land cover category, were joined. Class “grasslands” was created from joining mown and non-mown grasslands. Similarly, in case of arable land this class was formed through joining objects representing vegetated and bare fields. In total 13 classes were discriminated; they were presented in table 1.
FINAL MAP PREPARATION AND DISCUSSION OF THE RESULTS
Getting information about land cover / land use with a pre-determined degree of spatial resolution was one of the assumptions of the presented work. To achieve this goal area of 4 ha was assumed as a Minimum Mapping Unit (MMU); it corresponds to 100 SPOT pixels. Size of MMU was carefully justified. While making visual interpretation 4 ha, i.e. square 200 x 200 m is practically the smallest area, which can be delineated at a scale of 1:50 000; at this scale 4 ha corresponds to 2 x 2 mm. Size of minimum mapping unit is also justified by classification principles, which in-

Proceedings of the 28th EARSeL Symposium „Remote Sensing for a Changing Europe” 2-5 June 2008, Istanbul, Turkey
clude information derived from Haralick texture measures. These measures are reliable, when cal-culations are based on high enough number of pixels. De Kok (2002) found, that objects, which will be analyzed through texture measures, should have at least 30 pixels.
In order to achieve the assumed spatial resolution the classification raster image was general-ized. Standard PCI Geomatica functions were used for this purpose. It was assumed, that group of pixels with the same values smaller than minimum mapping unit is incorporated into adjacent, the largest homogeneous group of pixels. Analysis of size of pixel groups was done in multi-stage pro-cess, owing to this approach number of possible “non-logical” changes of classification was mini-mized. Table 1 includes areas of particular land cover classes and their percentage contribution to total classified area.
Table 1. Class areas after generalizing process with the use of 4ha MMU. Class No class name ha %
1 continuous built-up land 1 432.3 0.40 2 discontinuous built-up land 4 772.8 1.32 3 industrial or commercial units 4.6 0.001 4 construction sites 71.9 0.02 5 green urban areas 561.9 0.16 6 arable land 206 097.8 57.01 7 grasslands 52 633.7 14.56 8 gardens 1 857.3 0.51 9 coniferous forests 49 899.1 13.80 10 deciduous forests 13 487.8 3.73 11 mixed forests 23 548.1 6.51 12 deforestations 487.6 0.13 13 water 6 674.6 1.85
total 361 529.5 100
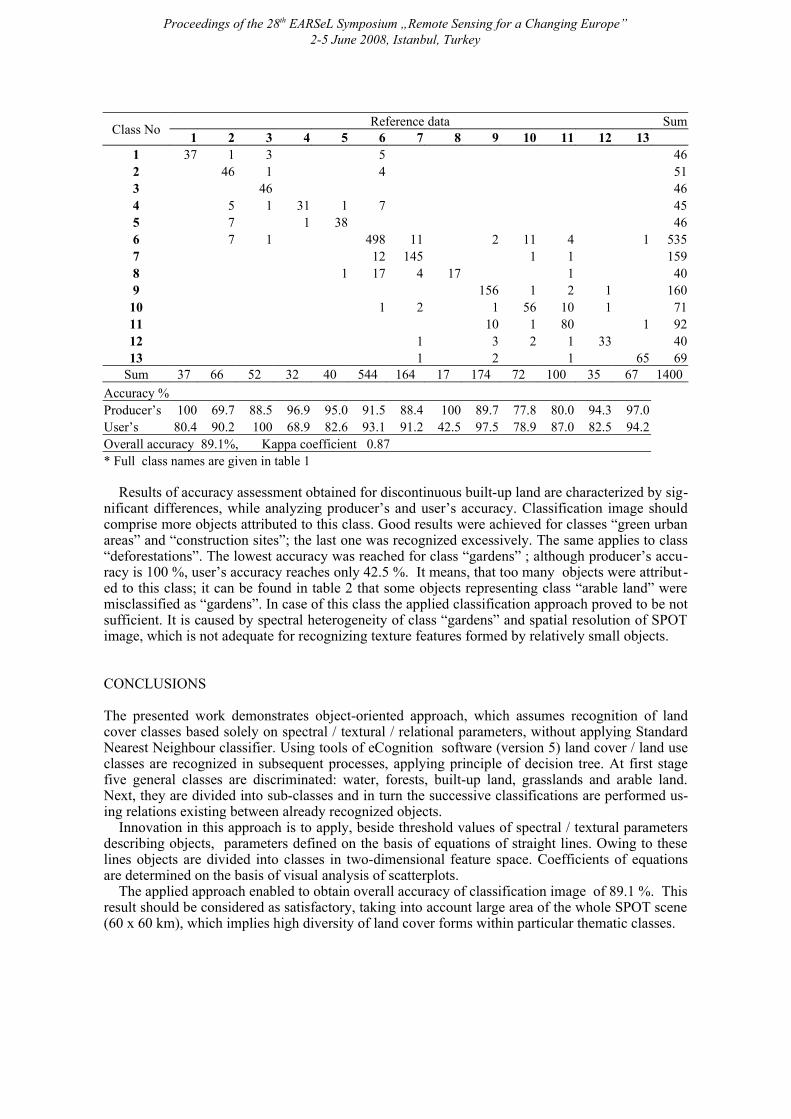
At the next stage accuracy assessment of the obtained classification was carried out. 1400 points were distributed randomly within the classification image, proportionally to the area of the recog-nized classes. Results of accuracy assessment in the form of error matrix, including producer’s and user’s accuracy, are presented in table 2.
Overall accuracy of classification was 89.1 %. Taking into account number of classes and total area covered with classification (over 3600 km2 ) the obtained result can be found as satisfactory. This conclusion is supported by high Kappa coefficient (0.87).
The best results were achieved for class “water”. Accuracy of the largest class “arable land” reached over 90 %; similar result was achieved for class “grasslands”. Analyzing forest classes, co-niferous forests were classified with the highest accuracy, influenced by precision of classifying mixed forests. Some objections one can have for classification of deciduous forests, reaching ca. 80 %. Main misclassifications are due to confusion with two classes: mixed forests and arable land. In first case accuracy is dependent on precise definition of mixed forests, while arable land cov-ered with vegetation is sometimes mixed with deciduous forests due to spectral similarity of both classes.
Quite good results were obtained for three classes of built-up land. However, it must be consid-ered, that after generalization class “industrial or commercial units” is represented only by one ob-ject having area over 4 ha. Smaller objects were incorporated to two remaining classes of built-up land.
Table 2. Accuracy assessment of classification of SPOT image.
Proceedings of the 28th EARSeL Symposium „Remote Sensing for a Changing Europe” 2-5 June 2008, Istanbul, Turkey
Class No 1 2 3 4 5 Reference data 6 7 8 9 10 11 12 13
Sum
1 37 1 3 5 46 2 46 1 4 51 3 46 46 4 5 1 31 1 7 45 5 7 1 38 46 6 7 1 498 11 2 11 4 1 535 7 12 145 1 1 159 8 1 17 4 17 1 40 9 156 1 2 1 160 10 1 2 1 56 10 1 71 11 10 1 80 1 92 12 1 3 2 1 33 40 13 1 2 1 65 69
Sum 37 66 52 32 40 544 164 17 174 72 100 35 67 1400 Accuracy % Producer’s 100 69.7 88.5 96.9 95.0 91.5 88.4 100 89.7 77.8 80.0 94.3 97.0 User’s 80.4 90.2 100 68.9 82.6 93.1 91.2 42.5 97.5 78.9 87.0 82.5 94.2 Overall accuracy 89.1%, Kappa coefficient 0.87 * Full class names are given in table 1
Results of accuracy assessment obtained for discontinuous built-up land are characterized by sig-nificant differences, while analyzing producer’s and user’s accuracy. Classification image should comprise more objects attributed to this class. Good results were achieved for classes “green urban areas” and “construction sites”; the last one was recognized excessively. The same applies to class “deforestations”. The lowest accuracy was reached for class “gardens” ; although producer’s accu-racy is 100 %, user’s accuracy reaches only 42.5 %. It means, that too many objects were attribut-ed to this class; it can be found in table 2 that some objects representing class “arable land” were misclassified as “gardens”. In case of this class the applied classification approach proved to be not sufficient. It is caused by spectral heterogeneity of class “gardens” and spatial resolution of SPOT image, which is not adequate for recognizing texture features formed by relatively small objects.
CONCLUSIONS
The presented work demonstrates object-oriented approach, which assumes recognition of land cover classes based solely on spectral / textural / relational parameters, without applying Standard Nearest Neighbour classifier. Using tools of eCognition software (version 5) land cover / land use classes are recognized in subsequent processes, applying principle of decision tree. At first stage five general classes are discriminated: water, forests, built-up land, grasslands and arable land. Next, they are divided into sub-classes and in turn the successive classifications are performed us-ing relations existing between already recognized objects.
Innovation in this approach is to apply, beside threshold values of spectral / textural parameters describing objects, parameters defined on the basis of equations of straight lines. Owing to these lines objects are divided into classes in two-dimensional feature space. Coefficients of equations are determined on the basis of visual analysis of scatterplots.
The applied approach enabled to obtain overall accuracy of classification image of 89.1 %. This result should be considered as satisfactory, taking into account large area of the whole SPOT scene (60 x 60 km), which implies high diversity of land cover forms within particular thematic classes.

Proceedings of the 28th EARSeL Symposium „Remote Sensing for a Changing Europe” 2-5 June 2008, Istanbul, Turkey
The presented approach was verified through its application for two other SPOT satellite scenes. They covered eastern and western part of Poland, different in fragmentation of land cover forms. In each case, in order to achieve high classification accuracy, modification of parameters used for identification of particular classes, was necessary. However, it did not change the principles of the proposed method. In all three cases the achieved classification accuracy was ca. 90 %; it confirms the correctness of the applied approach.
ACKNOWLEDGEMENT
The study has been funded by Polish Ministry of Science and Higher Education, project N520 016 31/2481.
REFERENCES
De Kok R., Buck A., Schneider T., Ammer U., 2000. Analysis of image objects from VHR imagery for forest GIS updating in the Bavarian Alps. Proceedings of the ISPRS, Amsterdam, July 2000, Working Group III/5.
De Kok R., Koziol K., Wezyk P., 2005. Zastosowanie klasyfikacji obiektowej wysokorozdzielczych obrazow teledetekcyjnych oraz analiz przestrzennych GIS w kartowaniu drzewostanow. Roczniki Geomatyki, t. 3, z. 4: 99-108.
Ehlers, M., U. Michel, G. Bohmann and D. Tomowski, 2006. Decision based data fusion techniques for the analysis of settlement areas from multisensor satellite data. Proceedings of ASPRS 2006 Annual Confer-ence, Reno, Nevada; May 1-5, 2006.
Gonzalez R. C., Wintz P., 1977. Digital image processing. Addison-Wesley Publishing Company. Hajek, F. 2005. Object-oriented classification of remote sensing data for the identification of tree species
composition. Proceedings of ForestSat 2005 conference, May 31 - June 3, 2005, Boras, Sweden. Haralick R. M., Shanmugan K., Dinstein I., 1973. Textural Features for Image Classification. IEEE Transac-
tions on Systems, Man and Cybernetics, Vol. SMC-3, No.6: 610-621. Kressler, F.P., K. Steinnocher and Y.S. Kim, 2005. Enhanced Semi-Automatic Image Classification of High-
Resolution Data. Proceedings of the IGARSS 2005 Symposium. Seoul, Korea. July 25-29, 2005. Lewinski St., 2006. Land use classification of ASTER image – Legionowo test site. Proceedings of the 25th
Symposium of the European Association of Remote Sensing Laboratories, Porto, Portugal, 6-9 June 2005: 441-447.
Lucas R , Rowlands A, Brown A, Keyworth S, Bunting P., 2007. Rule-based classification of multi-temporal satellite imagery for habitat and agricultural land cover mapping. ISPRS Journal of Photogrammetry and Remote Sensing, Volume 62, Issue 3, August 2007: 165-185
Wei, W., X. Chen and A. Ma , 2005. Object-oriented Information Extraction and Application in High-resolu-tion Remote Sensing Image. Proceedings of the IGARSS 2005 Symposium. Seoul, Korea. July 25-29, 2005.
Whiteside, T., 2005. A multi-scale object-oriented approach to the classification of multi-sensor imagery for mapping land cover in the top end. Proceedings of NARGIS 2005 – Application in Tropical Spatial Sci-ence. 4th - 7th July 2005 Charles Darwin University, Darwin, NT, Australia.
Yuan, F., 2006. Mapping impervious surface area using high resolution imagery: A comparison of object-based and per pixel classification. Proceedings of ASPRS 2006 Annual Conference, Reno, Nevada; May 1-5, 2006.