Embed Size (px)
Citation preview
18
R&S ® TSMx Radio Network Analyzers
HSPA measurements with all the bells and whistles
HSPA technologies in UMTS networks
not only significantly increase data
throughput in the uplink and down-
link but also complexity. This makes
achieving the targeted network quality
in these “turbo networks” even
more critical. And this is where the
R&S ® TSMx radio network analyzers
(FIG 1) and the R&S ® ROMES coverage
measurement software come into
their own.
The many sides to network quality
HSPA technologies for UMTS networks increase the data throughput in the downlink up to 14.4 Mbit/s and in the uplink up to 5.74 Mbit/s (see opposite page for HSPA details). However, the attainable data throughput is only one characteristic of a network – and differ-ent situations might place completely different requirements on the network. For example, while an FTP download requires the highest possible data rate, for voice over IP it is the maximum round trip time (RTT) that makes a difference.
To ensure that the targeted network quality is met, measurement systems are needed that allow the available quality of service (QoS) to be precisely viewed and analyzed, while at the same time making all relevant technical measure-ment values – e. g. layers 1 through 3, Internet protocol, etc. – available in a format that can be used in real-life sce-narios for error analysis or optimization.
R&S ® ROMES: sophisticated measurement methods for HSPA
Measurement systems must use sophis-ticated methods of data collection, prep-aration, and visualization if measure-ments in HSPA networks are to be meaningful. However, since the rele-vant measurement data can change dur-ing each transmission time interval (TTI), enormous amounts of data have to be processed. The mobile phone device drivers included in the R&S ® ROMES coverage measurement software col-lect this data and input it into the soft-ware in blocks of 200 ms each (100 TTIs for HSDPA). This block size ensures that the generated load for the measurement system stays within limits, while also maintaining a continuous flow of mea-surement results on the screen for the user.
4494
1/1
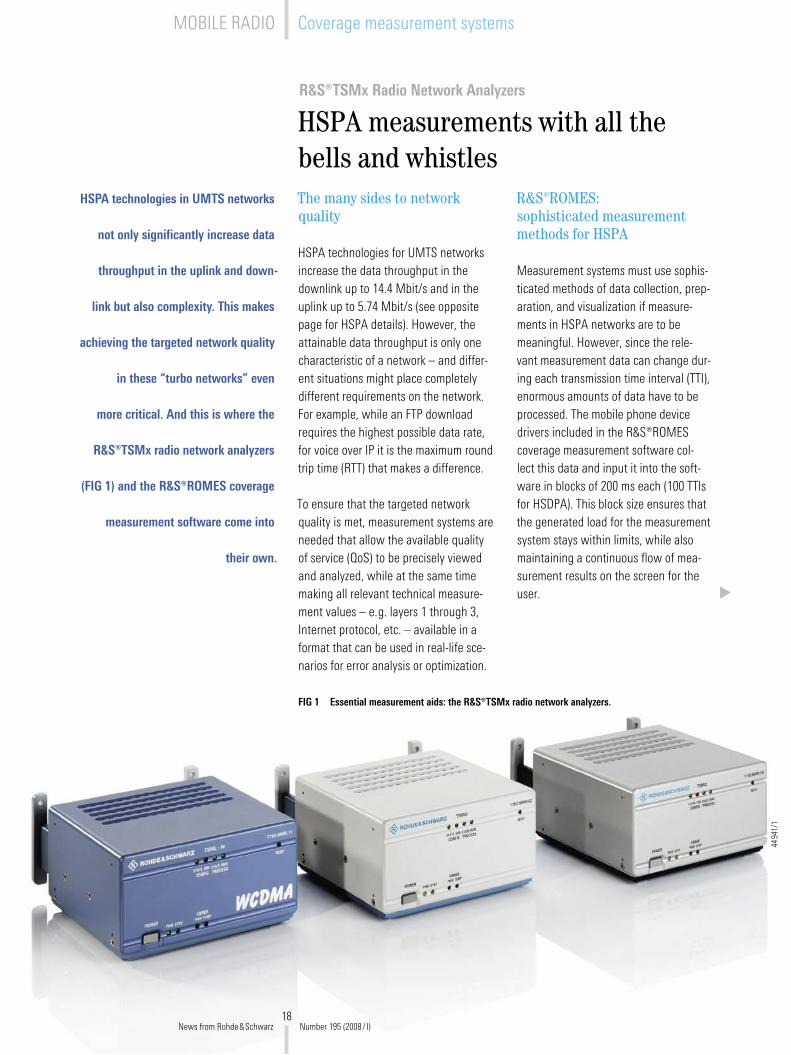
FIG 1 Essential measurement aids: the R&S ® TSMx radio network analyzers.
News from Rohde&Schwarz Number 195 (2008/ I)
MOBILE RADIO Coverage measurement systems
19
Adaptive modulation and coding (AMC)
During modulation and coding of the data, high payload data through-puts are associated with less robust transmission. Therefore, the opti-mum parameters are continually being sought for the current trans-mission conditions so as to ensure secure transmission with the high-est possible throughput.
HSDPA allows a choice between modulation modes (QPSK and 16QAM). Various options are also available for coding the data. Modu-lation and coding can be adapted per TTI, permitting a rapid response to changes in the radio field. The same applies analogously to HSUPA.
Hybrid automatic repeat request (HARQ)
Multiple HARQ processes allow effi-cient use of the transmit and pro-cessing time for data packets. After a data packet has been sent for a process, the sender does not have to wait for an acknowledgement, but rather can immediately send a packet for another process. The sender does not expect a successful or failed receipt to be acknowledged for the packet until some time later.
This method also increases effi-ciency because it does not com-pletely discard failed transmissions, but rather uses intelligent algo-rithms to combine them with addi-tional transmissions of the same (payload) data block. This increases the likelihood of successful decoding of the packet.
HSPA – a brief overview
HSDPA (release 5)HSDPA was introduced with the objective of using the radio channels as efficiently as possi-ble as well as to achieve a significant increase in data rates in the downlink as compared to UMTS. It was also intended as the first step toward reducing the round trip time (RTT).
These objectives were achieved as a result of many changes to the physical layer and the MAC layer. Parallel HARQ processes and AMC ensure both higher data throughput and a more efficient use of the RF resources. To reduce the RTT, it was necessary to move parts of the MAC layer from the radio network controller (RNC) to the 3G base station. This was the only way to achieve a transmission time interface (TTI) of 2 ms. As a result, every 2 ms the pro-cess transmits data blocks for which the transmission parameters can then be adapted to the current radio field conditions (AMC). To do this, the mobile phone must report the successful or failed receipt of a data packet to the base station every 2 ms. The base station adapts the transmission parameters using the channel quality indicator (CQI), which the mobile phone determines based on the receive quality of the pilot signal and periodically reports to the base station (every n TTI).
Three new channels were introduced to implement these requirements. In the downlink, the high speed downlink shared channel (HS-DSCH) handles the data transport. The mobile phone detects the configuration of the HS-DSCH via the high speed shared control chan-nel (HS-SCCH). As the names of these two channels indicate, they are not reserved for a sin-gle mobile phone, but instead are used by the base station to serve multiple mobile phones in parallel. In the uplink, the high speed dedicated physical control channel (HS-DPCCH) ensures the rapid transmission of the CQI values and the acknowledgement signals for the data packets.
HSUPA (release 6)All improvements that HSDPA provides in the downlink are to be provided by HSUPA in the uplink. It therefore makes sense to use similar methods. As a result, efficient data transmis-sion is provided by means of HARQ processes here as well, and the TTI was reduced to 10 ms or 2 ms, respectively. To achieve the rapid response times required, a part of the MAC layer had to be moved to the base station.
While the factor that limits throughput for HSDPA is the CQI of the radio field as determined by the mobile phone, in the uplink it is the maximum transmit power that the base station can allot to a mobile phone. Although the maximum transmit power that can be allotted is limited by the maximum transmit power of each mobile phone, the base station must in general limit the transmit power for a given mobile phone so that it does not overpower the other phones. The base station regulates the transmit power using grants it assigns to the mobile phones. The serving cell can set this power to a defined initial value by assigning an absolute grant. Moreover, any base station that is disrupted by a transmitting mobile phone can use a relative grant to stepwise reduce in the phone’s allotted transmit power.
The objective was achieved by introducing five new channels. The E-DCH dedicated phys-ical data channel (E-DPDCH) and the E-DCH dedicated physical control channel (E-DPCCH) together serve to transmit the data in the uplink. The data is sent to the base station via the E-DPDCH and the format via the E-DPCCH. In the downlink, the E-DCH absolute grant chan-nel (E-AGCH) and the E-DCH relative grant channel (E-RGCH) regulate the permitted transmit power. Finally, the acknowledgements from the base station to the mobile phone needed for the HARQ processes are forwarded via the E-DCH hybrid ARQ indicator channel (E-HICH).
News from Rohde&Schwarz Number 195 (2008/ I)
20
Aggregated values are usually more use-ful than a number of individual raw mea-surement values in gaining an overview of the network status. This is why, dur-ing the measurements, the R&S ® ROMES mobile phone drivers prepare additional statistics and analyses from the raw data provided by the phone. All mea-sured values can be viewed and ana-lyzed as standard R&S ® ROMES signals shown as 2D chart, alphanumeric view, or route track view, and then linked with other signals from R&S ® ROMES for further analysis.
If a problem area is identified, R&S ® ROMES has special views where it can provide full access to all avail-able measured values for a TTI to allow detailed analysis.
Views in R&S ® ROMES: clear and detailed
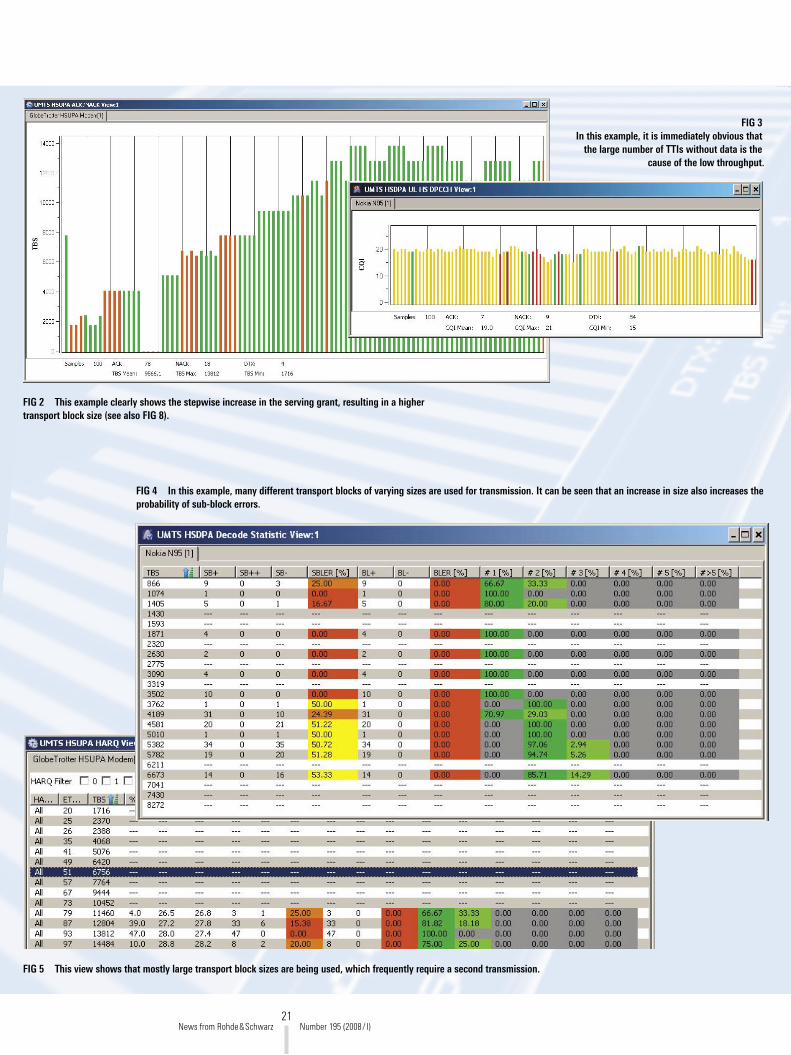
HSUPA / HSDPA: How good is the data transmission right now?The HSUPA view (FIG 2) and the HSDPA view (FIG 3) provide an initial impression of the quality of the current data trans-mission. Both views include a bargraph using colors to indicate the success of the transmission. Green bars show suc-cessfully transmitted packets or TTIs, and red bars represent faulty packet or TTI transmissions. Yellow bars indicate TTIs in which no data transmission took place (discontinuous transmission, DTX).
The y-axis in the HSUPA view represents the number of bits transmitted by the mobile phone (transport block size, TBS) and defined for each TTI based on the permissible transmit power. This allows the relationship between the block size and the transmission success to be read immediately.
In the HSDPA view, the bar size rep-resents the CQI. This value, which the mobile phone calculates from the pilot
signal of the base station, reflects the required data rate.
Decode statistic views: How large are the transmission blocks?The software generates statistics for both transmission directions describ-ing the transmission quality of the HARQ processes. A distinction is made between (data) blocks and (data) sub-blocks. Blocks that have to be resent are called sub-blocks. Here is an example of a transmission process:
In a first transmission attempt, a block is sent within a TTI. If the receiver can decode the contents, the transmission is ended successfully (the number of blocks and sub-blocks is equal in this case, i. e. it is 1). If the transmission fails – because the receiver cannot decode the data – a sub-block error (SBLE) results and the transmission must be repeated. To initi-ate this, the receiver sends an error mes-sage (NACK – not acknowledged) to the
sender, which then reattempts the trans-mission. If the receiver is able to decode this second sub-block, one sub-block error and one sub-block success will be counted, resulting in a sub-block error rate (SBLER) of 50 %. The (data) block itself was transmitted successfully, how-ever, so the resulting block error rate (BLER) is 0 %. A block error is present if the sender exceeds the maximum per-missible number of send attempts for a block. When this happens, the sender reports this block to the higher layers as not transmitted.
The spread is also calculated to show how many attempts were necessary to successfully transmit of a block. Because the block size affects the level of pro-tection for the data to be transmitted, R&S ® ROMES breaks down the statistics accordingly. This means that the user can clearly see the relationship between block size and transmission probability (FIGs 4 and 5).
R&S ® TSMx radio network analyzers from Rohde & Schwarz
Third-generation mobile radio networks require measurement methods that iden-tify potential problem spots and offer solu-tions in the easiest way possible. The R&S ® TSMx radio network analyzers from Rohde & Schwarz meet exactly these needs, because in combination with the R&S ® ROMES software they offer sophis-ticated algorithms for neighborhood anal-ysis. They are an indispensable aid in all cycles of a mobile radio network and deliver measurement results much faster and more precisely than test mobile phones. Their broadband RF frontend and the simple and modular option concept offer utmost flexibility for network opera-tors, service providers, regulatory authori-ties, and hardware manufacturers.
AbbreviationsAMC Adaptive modulation and
coding
BLER Block error rate
CQI Channel quality iIndicator
DTX Discontinuous transmission
HARQ Hybrid automatic repeat request
HSDPA High speed downlink packet access
HSPA High speed packet access
HSUPA High speed uplink packet access
NACK Not acknowledged
RNC Radio network controller
RTT Round trip time
SBLE Sub-block error
SBLER Sub-block error rate
TBS Transport block size
TTI Transmission time interval
News from Rohde&Schwarz Number 195 (2008/ I)
MOBILE RADIO Coverage measurement systems
21
FIG 5 This view shows that mostly large transport block sizes are being used, which frequently require a second transmission.
FIG 4 In this example, many different transport blocks of varying sizes are used for transmission. It can be seen that an increase in size also increases the probability of sub-block errors.
FIG 2 This example clearly shows the stepwise increase in the serving grant, resulting in a higher transport block size (see also FIG 8).
FIG 3 In this example, it is immediately obvious that
the large number of TTIs without data is the cause of the low throughput.
News from Rohde&Schwarz Number 195 (2008/ I)
22
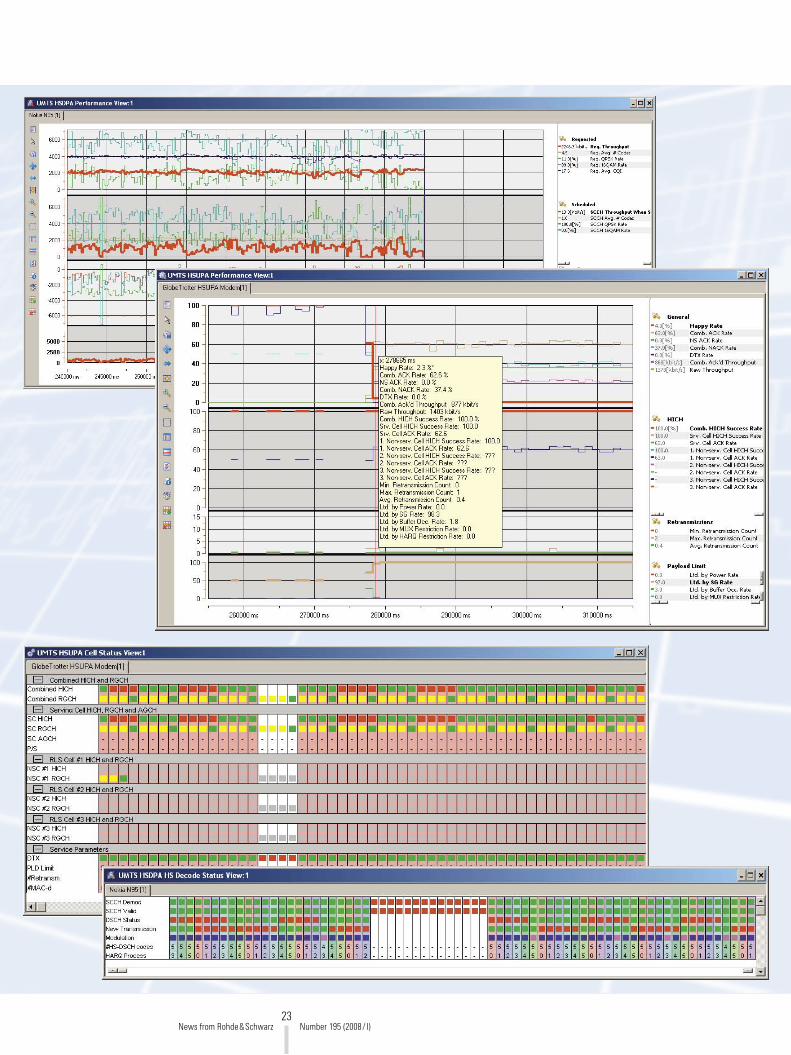
Performance views – throughputBoth views show the change over time for the most important HSPA parame-ters. The HSDPA view (FIG 6) includes sections for the transmission parameters required by the mobile phone and those set by the network, as well as the delta between the two. It also shows the data throughput in both the MAC layer and the RLC layer.
The HSUPA view (FIG 7) displays the suc-cess rates and the throughput of the data transmission. The software shows the corresponding values both in com-bination as well as listed out for the individual base stations involved in the transmission. The payload limit sec-tion also shows the factors limiting the throughput. This method of combin-ing the success rates and the payload limit makes efficient analysis possible in those cases where the data rates are low.
Progress views – packet tracking in R&S ® ROMESThese views (FIGs 8 and 9) allow easy tracking of the transmission parameter control over time. For each TTI, the soft-ware displays the corresponding param-eters in the form of colored squares. This type of display makes it possible to eval-uate the status of the data transmission at a glance. Analysis of HARQ processes is thus easy with the HSDPA view. The HSUPA view, however, permits a rapid analysis of how the serving grant is reg-ulated in the serving and non-serving cells.
FIG 7 A typical start of transmission. First comes the “buffer” as the limiting element because it still has to be filled by the application (e. g. by the FTP client). But shortly after that the serving grant limits the maximum data
throughput.
FIG 6 The upper graph shows the throughput desired by the mobile phone based on the radio field conditions. The
remaining graphs show the throughput assigned by the network, as well as the delta between the two.
More information on the radio network analyzers and the R&S ® ROMES coverage
measurement software at www.rohde-schwarz.com
(search term: TSM or Romes)
REFERENCESR&S ® TSMx Radio Network Analyzers – Radio network analyzers for all tasks and any budget. News from Rohde & Schwarz (2007) No. 192, pp 5–8
The data quality analyzer handles data trafficThe test data traffic is generated with the R&S ® ROMES data quality analyzer option. This option is continually being improved to reflect new technologies. It now allows, for example, adaptation of the buffers in use, which ensures opti-mum throughput. Even next-genera-tion HSPA data cards that register in the operating system exclusively as network cards can be used.
The IP tracer makes it all crystal clearThe IP tracer rounds out the software functionality. This tool can be used to record and analyze the entire IP data traffic (optionally without payload) on a specific data link. Combining the IP data traffic with the layer 3 messages from the mobile phone creates the layer 3 view as a powerful tool for analyzing all protocols involved.
Unparalleled interworking
Of course, all described modules can be operated in parallel with other R&S ® ROMES modules, including the UMTS PN scanner or the GSM network scanner. As a result, just one drive test is needed to prepare a quality of ser-vice report, identify problem spots, and at the same time collect all conceivable measurement values for optimization.
Andreas Spachtholz
FIG 9 The progress of the HARQ process is clearly displayed.
The red square in the third line shows a faulty transmis-sion in HARQ process 3 (first column). HARQ process 3 is continued in column 7. The new transmission indica-
tor (line 4) shows that this is a retransmission that fails again (line 3). Finally, the green square in column 13
and line 3 shows a successful data transmission. New (payload) data can now be transmitted. The green
square in column 19 shows the new transmission indi-cator set in the next TTI of process 3.
FIG 8 The green squares in the second line (RGCH) very nicely
show the stepwise increase of the serving grant in every fourth TTI (see also FIG 2).
News from Rohde&Schwarz Number 195 (2008/ I)
MOBILE RADIO Coverage measurement systems
23News from Rohde&Schwarz Number 195 (2008/ I)