Embed Size (px)
Citation preview

•!1
Ed Jackson Co-Chair – MRI Quantitative Committee
May 25, 2010
RSNA QIBA DCE-MRI Technical Committee MR Phantom Development / Data Efforts
RSNA QIBA Meeting – May 25-26, 2010
1
2
RSNA QIBA DCE-MRI Phantom v1 Studies
•! MR phantom based on the Imaging Response Assessment Team (IRAT) DCE-MRI phantom
•! Acquisition and phantom designed to mimic typical Phase I / II applications to liver using phased array receive coils
•! Phantoms distributed to multiple sites to obtain multicenter (N=5), multivendor (N=3) data
http://qibawiki.rsna.org/index.php?title=DCE-MRI Phantom purchase funded by NCI Contract 27XS112
Modified ADNI MagPhan “Cuboid”

•!2
3
RSNA QIBA DCE-MRI Phantom v1
•! Modified version of the ADNI MagPhan, as previously modified by IRAT MR Committee
•! 1-cm fiducial spheres for spatial accuracy assessment unchanged •! Eight 3-cm contrast response spheres (same as IRAT modified version) •! T1 modifier: CuSO4
•! Flood fill solution of phantom and cuboid changed to 30 mM NaCl
http://qibawiki.rsna.org/index.php?title=DCE-MRI
Two matched phantoms were manufactured by The Phantom Laboratory (Salem, NY)
(Phantom purchase funded by NCI Contract 27XS112)
4
•! Phantom measurements (overview): –! Phased array acquisition –! Body coil acquisition –! SNR acquisition –! Variable flip angle T1 measurement acquisition –! DCE acquisition
•! Each of the above acquisitions repeated with phantom rotated by 90, 180, 270, and 360o
•! All acquisitions repeated one week later
•! Sites / vendors –! MDACC GE (new) Site 1 / Vendor A –! UPenn Siemens (2) Site 2 / Vendor B –! Univ Chicago Philips Site 3 / Vendor C –! Duke Univ Philips Site 4 / Vendor C –! Univ CA Davis GE (older) Site 5 / Vendor A
Ratio map correction for RF coil sensitivity characteristics
RSNA QIBA DCE-MRI Phantom v1 Studies
•!3
5
•! Rotations C and D same as Rotation B •! Rotation A’ same as Rotation A
RSNA QIBA DCE-MRI Phantom v1 Studies
6
•! Ratio data acquired once with body coil and repeated with phased array coil •! Same two sets of data acquired at each rotation •! Phased array acquisition repeated at each rotation for SNR, but 8 separate acqs
RSNA QIBA DCE-MRI Phantom v1 Studies
•!4
7
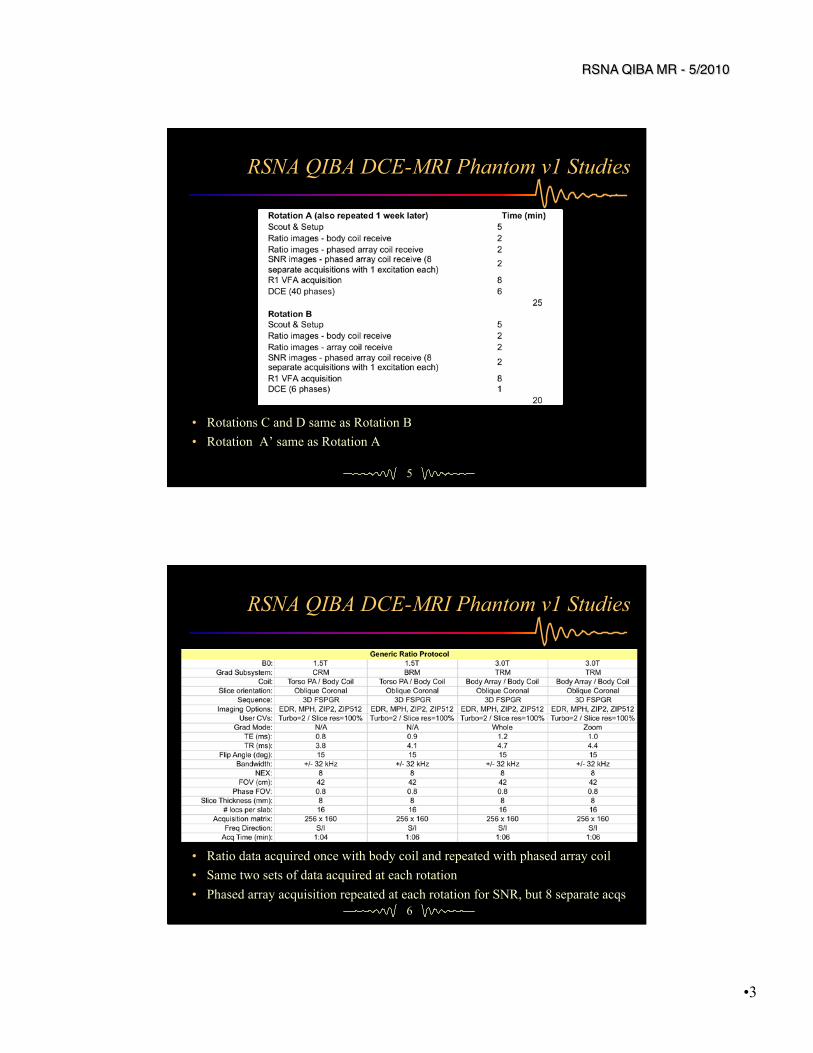
•! VFA T1 data acquired at each rotation
RSNA QIBA DCE-MRI Phantom v1 Studies
8
•! DCE data acquired at each rotation •! 5:40 min acquisitions at Rotation A and A’; 51 sec acqs at Rotations B-C
RSNA QIBA DCE-MRI Phantom v1 Studies

•!5
9
Typical images showing the eight T1 contrast spheres
RSNA QIBA DCE-MRI Phantom v1 Studies
Axial Coronal
10
Initial phantom inter-comparison tests and IR-based T1 measures (MDACC only)
RSNA QIBA DCE-MRI Phantom v1 Studies

•!6
11
•! Data Analysis: The raw data analysis was carried out using software developed by VirtualScopics, Inc. (Ed Ashton, PhD)
•! From the DCE-MRI acquisition data, signal intensity, SNR, and CNR measures were computed from each of the eight contrast spheres.
•! T1 measures were computed from the VFA data from each sphere. These measures were obtained both before and after correction of the phased array coil data for spatial variations in coil sensitivity.
•! Coil sensitivity corrections were carried out as follows: 1.! Import the body coil and phased array ratio images 2.! Normalize the range of the two images 3.! Calculate signal intensity ratios (body coil:phased array) for each pixel 4.! Apply 21x21 pixel kernel median filter 5.! Multiply each pixel in the source image by the ratio map pixel data
RSNA QIBA DCE-MRI Phantom v1 Studies
12
•! Analysis of the signal characteristics in the DCE scans was accomplished by placing a uniform spherical 2-cm diameter region of interest (ROI) in the center of each phantom compartment.
•! Mean and median pixel values within each ROI were calculated, along with SNR and CNR values.
–! Noise in each compartment was defined as the standard deviation of the differences at each pixel between one phase and the next divided by !2.
–! Signal was defined as the mean signal value within each ROI.
–! Contrast was defined as the absolute difference between the mean signal in an ROI and that of the central 6-cm sphere.
•! The raw data thus obtained were provided to the QIBA DCE-MRI Technical Committee for further analysis (Ed Jackson, PhD).
RSNA QIBA DCE-MRI Phantom v1 Studies
•!7
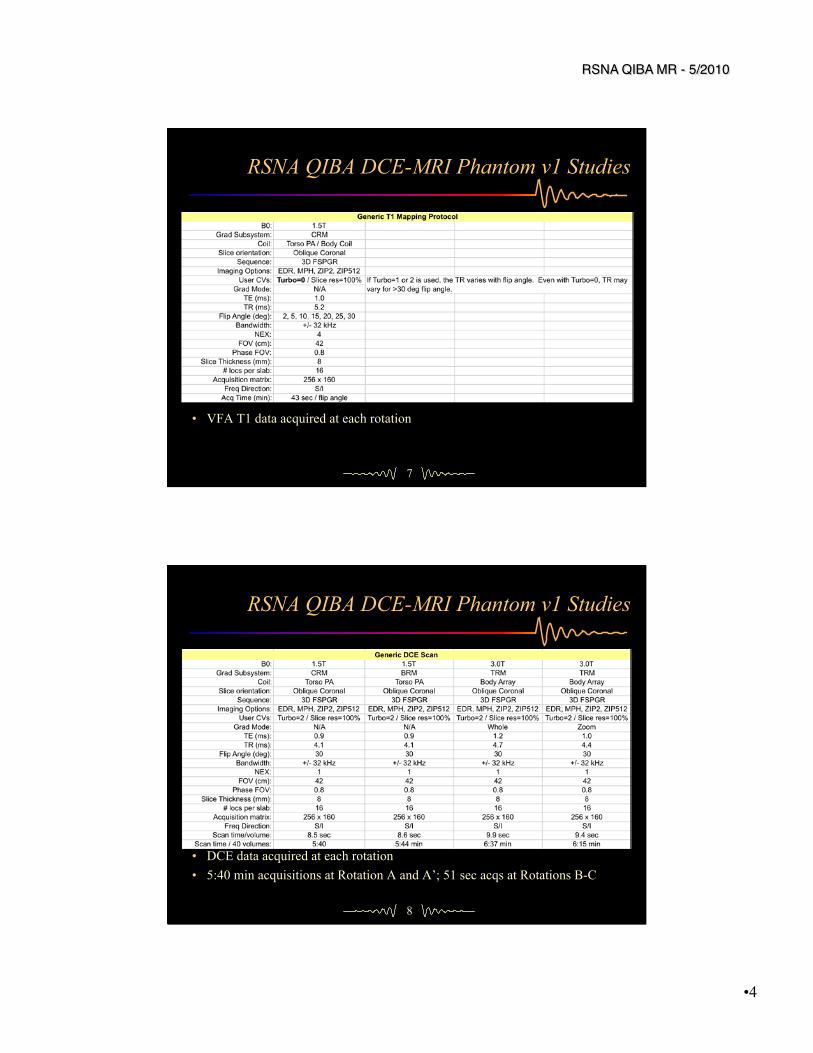
Variable flip angle relaxation rates vs. IR (gold standard) values (Site 2 / Vendor B)
y = 1.2049x + 0.0832 R" = 0.99131
0.5
1.0
1.5
2.0
2.5
3.0
3.5
0.5 1.0 1.5 2.0 2.5 3.0 3.5
IR R
1 M
easu
res (
1/s)
VFA R1 Measures (1/s)
VFA R1 vs IR R1 – Site 2 / Vendor B
y = 1.1027x + 0.0047 R" = 0.99746
0.5
1.0
1.5
2.0
2.5
3.0
3.5
0.5 1.0 1.5 2.0 2.5 3.0 3.5
IR R
1 M
easu
res (
1/s)
VFA R1 Measures (1/s)
VFA R1 vs IR R1 – Site 1 / Vendor A
Variable flip angle relaxation rates vs. IR (gold standard) values (Site 1 / Vendor A)
IR measures acquired on Vendor A at Site 1
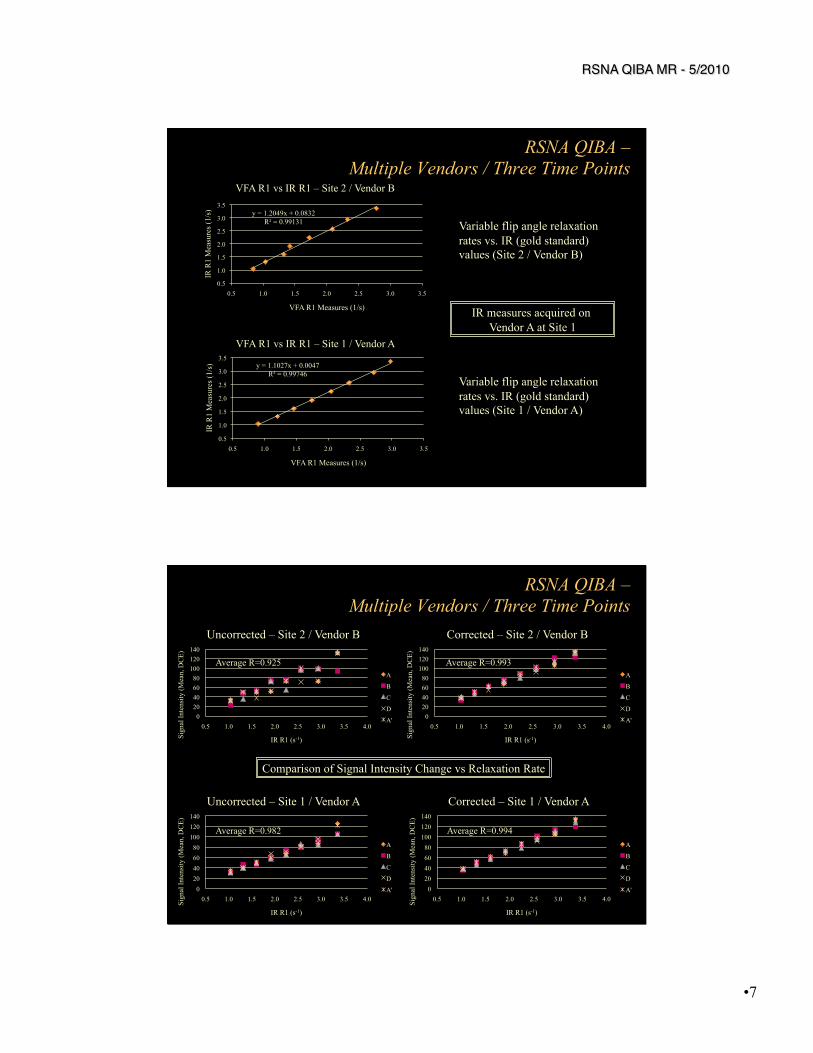
RSNA QIBA – Multiple Vendors / Three Time Points
Comparison of Signal Intensity Change vs Relaxation Rate
0 20 40 60 80
100 120 140
0.5 1.0 1.5 2.0 2.5 3.0 3.5 4.0
Sign
al In
tens
ity (M
ean,
DC
E)
IR R1 (s-1)
Uncorrected – Site 2 / Vendor B
A
B
C
D
A' 0 20 40 60 80
100 120 140
0.5 1.0 1.5 2.0 2.5 3.0 3.5 4.0
Sign
al In
tens
ity (M
ean,
DC
E)
IR R1 (s-1)
Corrected – Site 2 / Vendor B
A
B
C
D
A'
0 20 40 60 80
100 120 140
0.5 1.0 1.5 2.0 2.5 3.0 3.5 4.0 Sign
al In
tens
ity (M
ean,
DC
E)
IR R1 (s-1)
Uncorrected – Site 1 / Vendor A
A
B
C
D
A' 0 20 40 60 80
100 120 140
0.5 1.0 1.5 2.0 2.5 3.0 3.5 4.0 Sign
al In
tens
ity (M
ean,
DC
E)
IR R1 (s-1)
Corrected – Site 1 / Vendor A
A
B
C
D
A'
Average R=0.982 Average R=0.994
Average R=0.925 Average R=0.993
RSNA QIBA – Multiple Vendors / Three Time Points

•!8
Comparison of Signal Intensity Change vs. Relaxation Rate
RSNA QIBA – Site 1 / Vendor A Correlation Coefficient - Uncorrected Correlation Coefficient - Corrected
A B C D A' A B C D A' 0.9714 0.9937 0.9888 0.9919 0.9796 0.9918 0.9936 0.9970 0.9935 0.9943
Mean: 0.9851 Mean: 0.9940 Slope - Uncorrected Slope - Corrected
A B C D A' A B C D A' 35.4555 31.5497 30.9754 32.0993 34.7666 38.5062 37.3991 38.9269 38.3421 38.3138
Mean: 32.97 CV%: 6.10 Mean: 38.30 CV%: 1.46 Intercept - Uncorrected Intercept - Corrected
A B C D A' A B C D A' -6.6755 -0.2397 -1.3036 -0.9638 -5.9848 -1.0992 -0.1563 -4.6193 -2.3849 -1.1261
Mean: -3.03 CV%: -100.34 Mean: -1.88 CV%: -91.91
Correlation Coefficient - Uncorrected Correlation Coefficient - Corrected A B C D A' A B C D A'
0.9692 0.9922 0.9810 0.9874 0.9784 0.9929 0.9939 0.9966 0.9931 0.9935 Mean: 0.9816 Mean: 0.9940
Slope - Uncorrected Slope - Corrected A B C D A' A B C D A'
35.5064 30.3643 31.7126 33.8272 34.2843 38.5615 31.8471 39.6217 40.4038 37.6590 Mean: 33.14 CV%: 6.24 Mean: 37.62 CV%: 9.01
Intercept - Uncorrected Intercept - Corrected A B C D A' A B C D A'
-6.8297 1.4830 -0.2094 -4.1020 -6.1966 0.0705 0.0760 -2.9446 -5.4970 -0.6708 Mean: -3.17 CV%: -115.70 Mean: -1.79 CV%: -134.51
Week 0
Week 1
Correlation Coefficient - Uncorrected Correlation Coefficient - Corrected A B C D A' A B C D A'
0.8995 0.9272 0.9518 0.9435 0.9015 0.9925 0.9898 0.9962 0.9942 0.9917 Mean: 0.9247 Mean: 0.9929
Slope - Uncorrected Slope - Corrected A B C D A' A B C D A'
35.8478 31.4245 41.5087 37.7724 35.8782 39.3105 40.2707 39.9166 40.5411 39.8852 Mean: 36.49 CV%: 10.00 Mean: 39.98 CV%: 1.16
Intercept - Uncorrected Intercept - Corrected A B C D A' A B C D A'
-6.5579 3.5212 -15.6972 -9.7263 -6.1318 -2.5304 -4.0917 -4.6574 -5.8299 -4.2140 Mean: -6.92 CV%: -100.84 Mean: -4.26 CV%: -27.85
Comparison of Signal Intensity Change vs. Relaxation Rate
RSNA QIBA – Site 2 / Vendor B
Week 0
Week 1
Correlation Coefficient - Uncorrected Correlation Coefficient - Corrected A B C D A' A B C D A'
0.8796 0.9040 0.9476 0.9289 0.8870 0.9916 0.9909 0.9960 0.9945 0.9934 Mean: 0.9094 Mean: 0.9933
Slope - Uncorrected Slope - Corrected A B C D A' A B C D A'
31.9288 29.9869 38.5522 37.8572 32.0270 36.5484 40.1997 38.3974 40.3200 37.1238 Mean: 34.07 CV%: 11.35 Mean: 38.52 CV%: 4.48
Intercept - Uncorrected Intercept - Corrected A B C D A' A B C D A'
-1.7959 2.8835 -14.8472 -13.2291 -2.4637 -2.9824 -4.9947 -6.1627 -7.2638 -2.5046 Mean: -5.89 CV%: -131.38 Mean: -4.78 CV%: -42.52
•!9
-100 -80 -60 -40 -20
0 20 40 60 80
100
200 400 600 800 1000 1200
Diff
eren
ce in
T1
(ms)
Average T1 (ms)
All Rotations - 06/15,22/09 Site 1
A-A
B-B
C-C
D-D
A'-A
-0.4
-0.3
-0.2
-0.1
0.0
0.1
0.2
0.3
0.4
0.5 1.0 1.5 2.0 2.5 3.0 3.5
Diff
eren
ce in
R1
(s-1
)
Average R1 (s-1)
All Rotations - 06/15,22/09 Site 1
A-A
B-B
C-C
D-D
A'-A
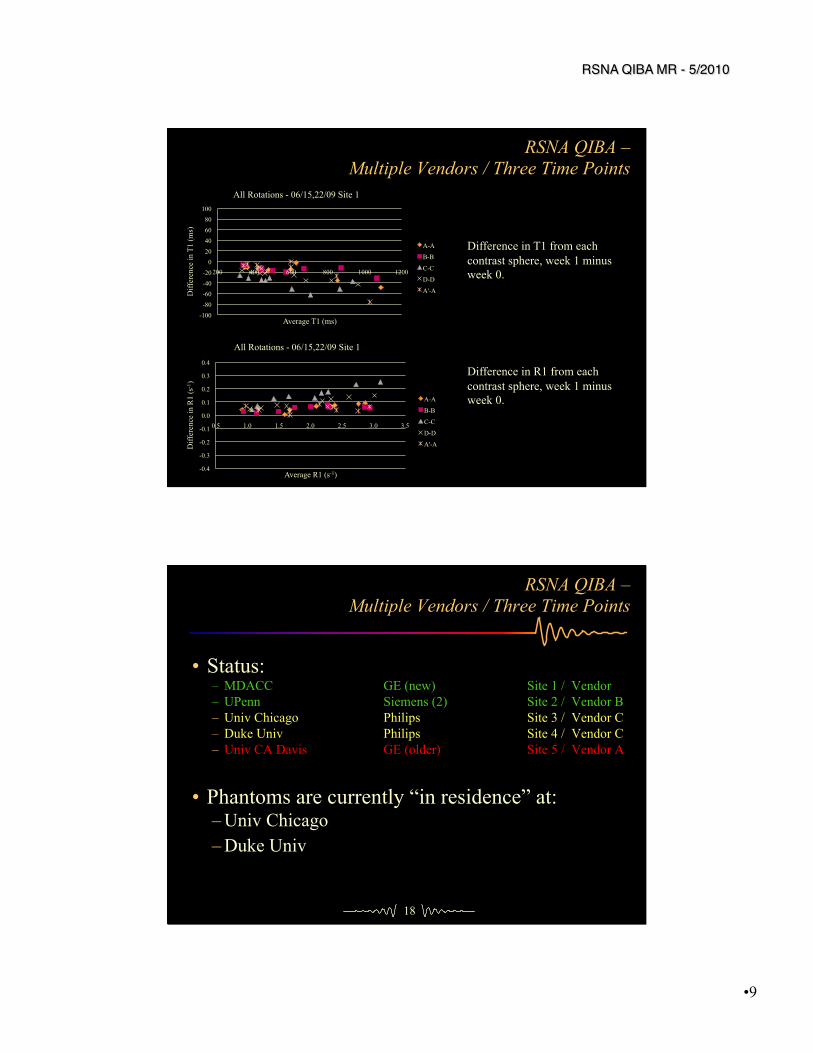
Difference in T1 from each contrast sphere, week 1 minus week 0.
Difference in R1 from each contrast sphere, week 1 minus week 0.
RSNA QIBA – Multiple Vendors / Three Time Points
18
RSNA QIBA – Multiple Vendors / Three Time Points
•! Status: –! MDACC GE (new) Site 1 / Vendor –! UPenn Siemens (2) Site 2 / Vendor B –! Univ Chicago Philips Site 3 / Vendor C –! Duke Univ Philips Site 4 / Vendor C –! Univ CA Davis GE (older) Site 5 / Vendor A
•! Phantoms are currently “in residence” at: –!Univ Chicago –!Duke Univ
•!10
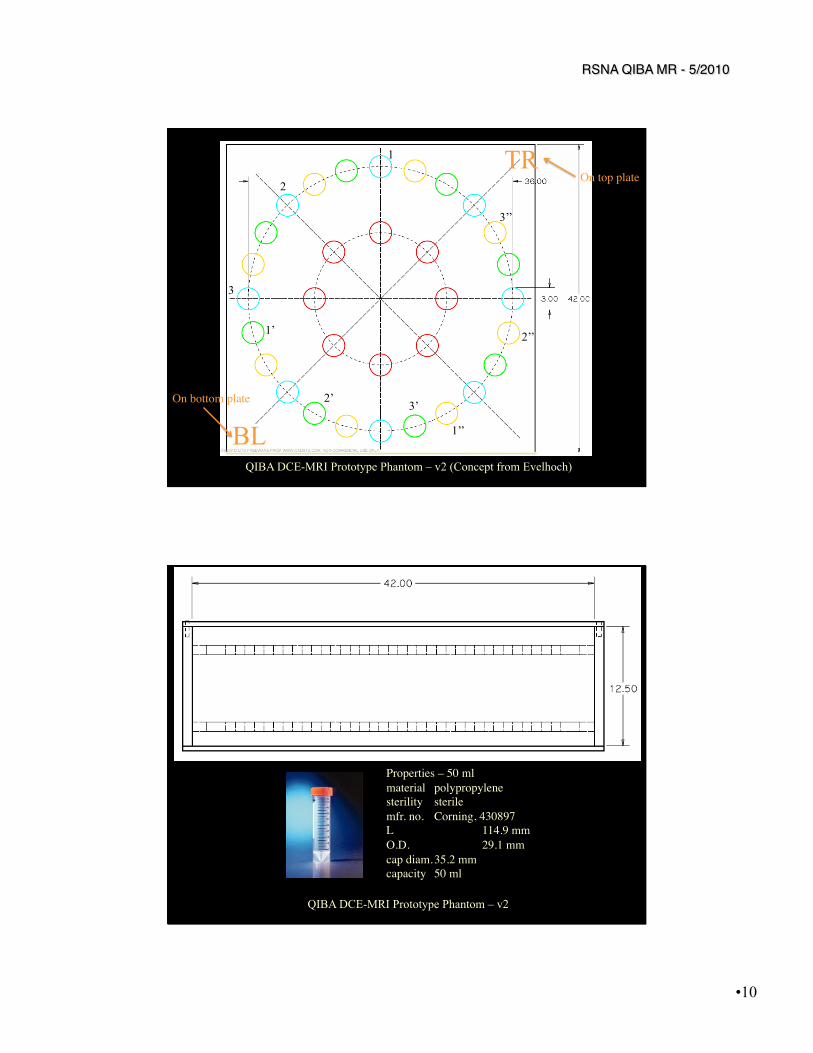
QIBA DCE-MRI Prototype Phantom – v2 (Concept from Evelhoch)
TR
BL
On top plate!
On bottom plate!
1
2
3
1’
2’ 3’
1’’
2’’
3’’
QIBA DCE-MRI Prototype Phantom – v2
Properties – 50 ml!material !polypropylene !!sterility !sterile ! !!mfr. no. !Corning, 430897 !!L ! !114.9"mm !!O.D. ! !29.1"mm !!cap diam.!35.2"mm !!capacity !50"ml !!
•!11
21
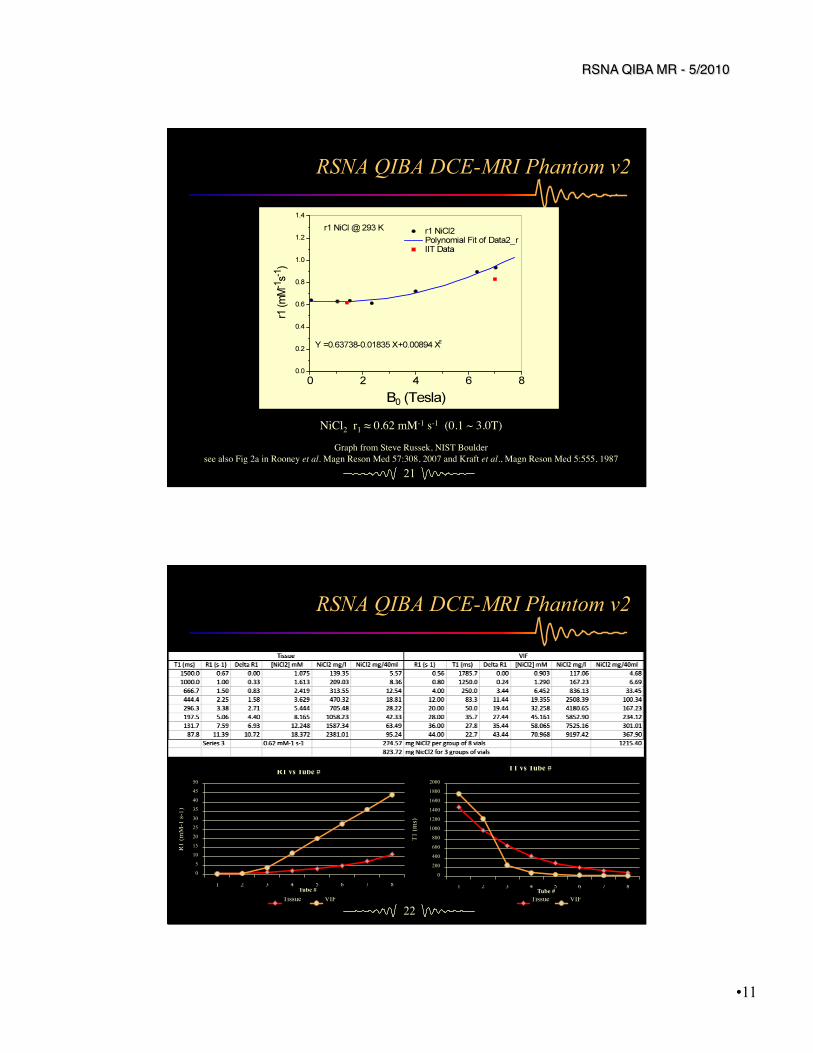
NiCl2 r1 # 0.62 mM-1 s-1 (0.1 ~ 3.0T)!
Graph from Steve Russek, NIST Boulder !see also Fig 2a in Rooney et al. Magn Reson Med 57:308, 2007 and Kraft et al., Magn Reson Med 5:555, 1987!
RSNA QIBA DCE-MRI Phantom v2
22
RSNA QIBA DCE-MRI Phantom v2
0
5
10
15
20
25
30
35
40
45
50
1 2 3 4 5 6 7 8
R1
(mM
-1 s-
1)
Tube #
R1 vs Tube #
Tissue VIF
0
200
400
600
800
1000
1200
1400
1600
1800
2000
1 2 3 4 5 6 7 8
T1 (m
s)
Tube #
T1 vs Tube #
Tissue VIF

•!12
QIBA DCE-MRI Prototype Phantom – v2
24
RSNA QIBA DCE-MRI Phantom v2
VFA Data (!=20o) R1 Map (0 – 25 s-1)
FSE-IR Data - MDACC
•!13
25
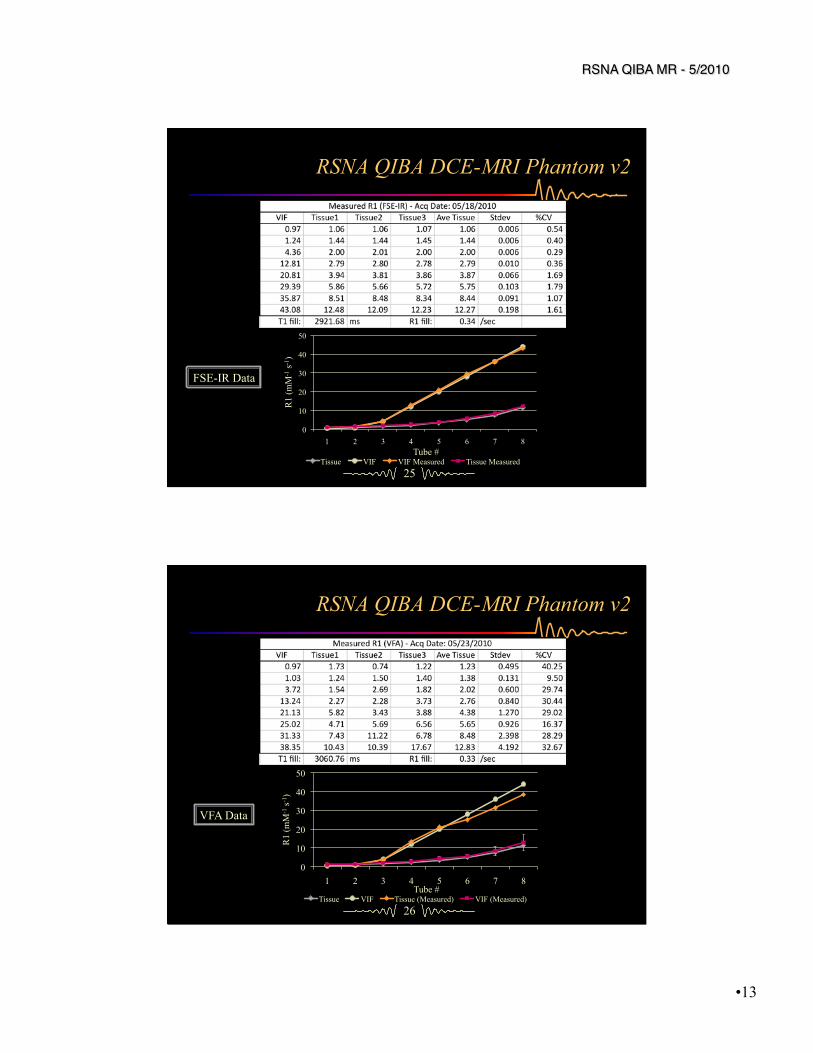
RSNA QIBA DCE-MRI Phantom v2
FSE-IR Data
0
10
20
30
40
50
1 2 3 4 5 6 7 8
R1
(mM
-1 s-1
)
Tube #
R1 vs Tube #
Tissue VIF VIF Measured Tissue Measured
26
RSNA QIBA DCE-MRI Phantom v2
0
10
20
30
40
50
1 2 3 4 5 6 7 8
R1
(mM
-1 s-1
)
Tube #
R1 vs Tube # - VFA
Tissue VIF Tissue (Measured) VIF (Measured)
VFA Data

•!14
27
RSNA QIBA DCE-MRI Phantom v2
DCE Signal Signal Intensity Data
y = 74.322x + 15.235 R" = 0.99177
0
200
400
600
800
1000
1200
0 2 4 6 8 10 12 14
Sign
al In
tens
ity (a
u)
R1 (/sec)
“Tissue” Signal Intensity
"Mean DCE" Linear("Mean DCE")
y = 50.838x + 82.655 R" = 0.98402
0
500
1000
1500
2000
2500
0 10 20 30 40 50
Sign
al In
tens
ity (a
u)
R1 (/sec)
“VIF” Signal Intensity
DCE Signal DCE w/o High R1 Linear(DCE w/o High R1)
28
RSNA QIBA DCE-MRI Phantom v2
Theoretical Response (ignoring R2*)
y = 1.1515x + 0.6371 R" = 0.99269
y = 0.8822x + 0.2148 R" = 0.99847
0
2
4
6
8
10
12
14
16
18
0 2 4 6 8 10 12 14
Sign
al In
tens
ity (a
.u.)
R1 (/sec)
FSPGR Ideal Response
15 deg 30 deg 45 deg Linear(30 deg) Linear(45 deg)
0
5
10
15
20
25
30
35
0 10 20 30 40 50
Sign
al In
tens
ity (a
.u.)
R1 (/sec)
FSPGR Ideal Response
15 deg 30 deg 45 deg
•!15
29
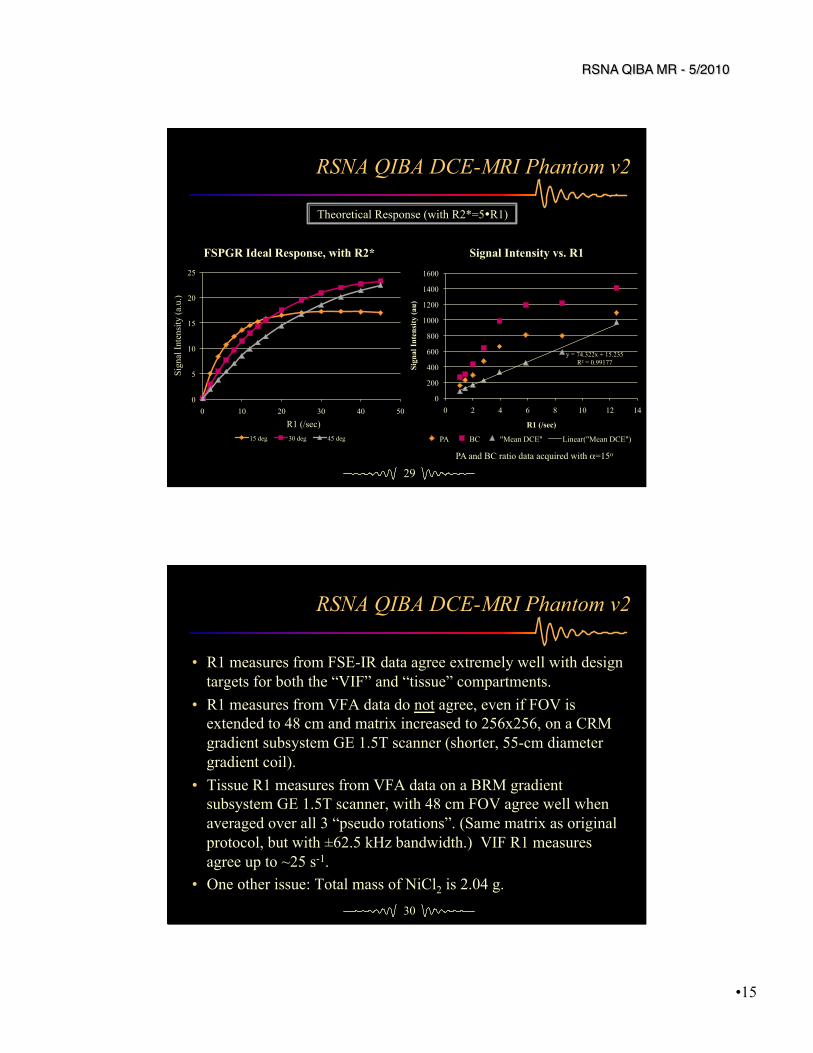
RSNA QIBA DCE-MRI Phantom v2
Theoretical Response (with R2*=5!R1)
0
5
10
15
20
25
0 10 20 30 40 50
Sign
al In
tens
ity (a
.u.)
R1 (/sec)
FSPGR Ideal Response, with R2*
15 deg 30 deg 45 deg
y = 74.322x + 15.235 R" = 0.99177
0
200
400
600
800
1000
1200
1400
1600
0 2 4 6 8 10 12 14 Si
gnal
Inte
nsity
(au)
R1 (/sec)
Signal Intensity vs. R1
PA BC "Mean DCE" Linear("Mean DCE")
PA and BC ratio data acquired with !=15o
30
RSNA QIBA DCE-MRI Phantom v2
•! R1 measures from FSE-IR data agree extremely well with design targets for both the “VIF” and “tissue” compartments.
•! R1 measures from VFA data do not agree, even if FOV is extended to 48 cm and matrix increased to 256x256, on a CRM gradient subsystem GE 1.5T scanner (shorter, 55-cm diameter gradient coil).
•! Tissue R1 measures from VFA data on a BRM gradient subsystem GE 1.5T scanner, with 48 cm FOV agree well when averaged over all 3 “pseudo rotations”. (Same matrix as original protocol, but with ±62.5 kHz bandwidth.) VIF R1 measures agree up to ~25 s-1.
•! One other issue: Total mass of NiCl2 is 2.04 g.

•!16
31
RSNA QIBA DCE-MRI Phantom v2
Acquisition Parameters Modified for BRM Gradient Scanner w/48-cm FOV
±62.5 kHz
1.16 ms 4.21 ms
48 cm 0.85
6:18 9.45 sec
BRM
32
RSNA QIBA DCE-MRI Phantom v2
•! To keep the original acquisition protocol parameters, particularly FOV, the diameter of the “tissue” compartments will likely need to be decreased, which will require either: –! reducing the number of “pseudo rotations” from 3 to 2, or –! reducing the number of samples per rotation from 8 to 7
•! Otherwise, the FOV will need to be increased and systems with smaller diameter bores (55 cm) and shorter gradient coils (e.g., GE CRM) will be problematic.
•! One other issue relevant to shipping the phantom: The total mass of NiCl2 is 2.04 g.
•!17
33
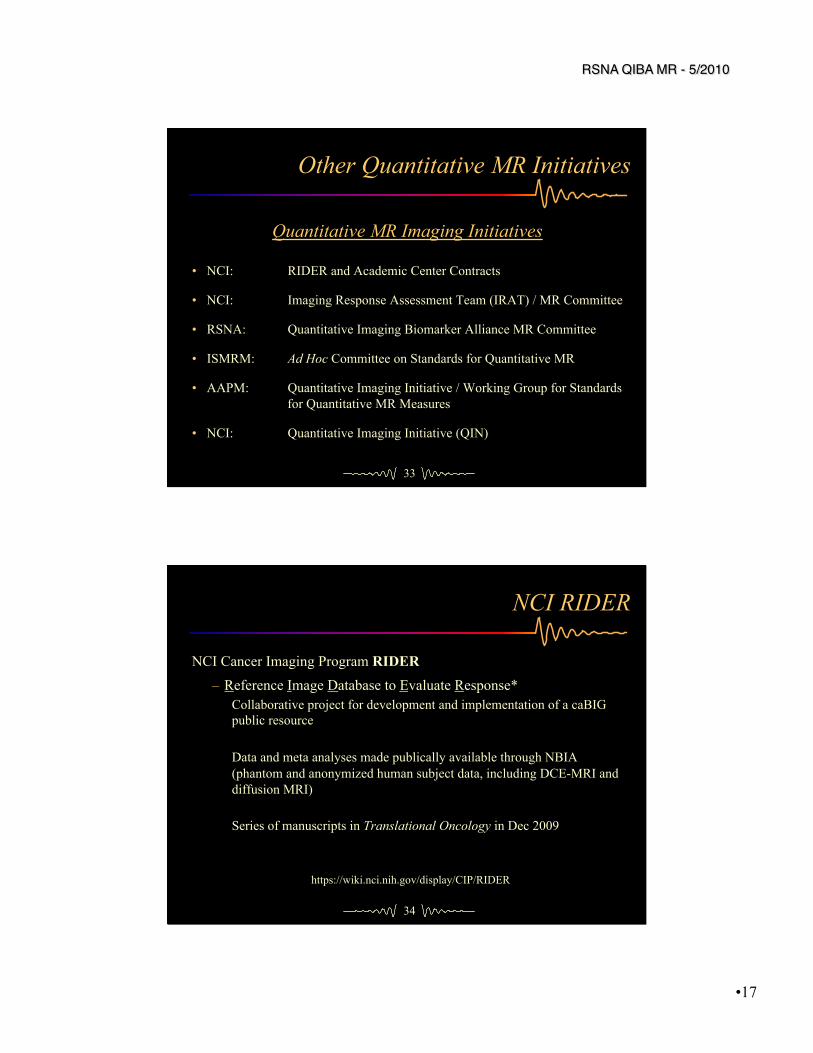
Other Quantitative MR Initiatives
•! NCI: RIDER and Academic Center Contracts
•! NCI: Imaging Response Assessment Team (IRAT) / MR Committee
•! RSNA: Quantitative Imaging Biomarker Alliance MR Committee
•! ISMRM: Ad Hoc Committee on Standards for Quantitative MR
•! AAPM: Quantitative Imaging Initiative / Working Group for Standards for Quantitative MR Measures
•! NCI: Quantitative Imaging Initiative (QIN)
Quantitative MR Imaging Initiatives
34
NCI RIDER
NCI Cancer Imaging Program RIDER –! Reference Image Database to Evaluate Response*
Collaborative project for development and implementation of a caBIG public resource
Data and meta analyses made publically available through NBIA (phantom and anonymized human subject data, including DCE-MRI and diffusion MRI)
Series of manuscripts in Translational Oncology in Dec 2009
https://wiki.nci.nih.gov/display/CIP/RIDER
•!18
35
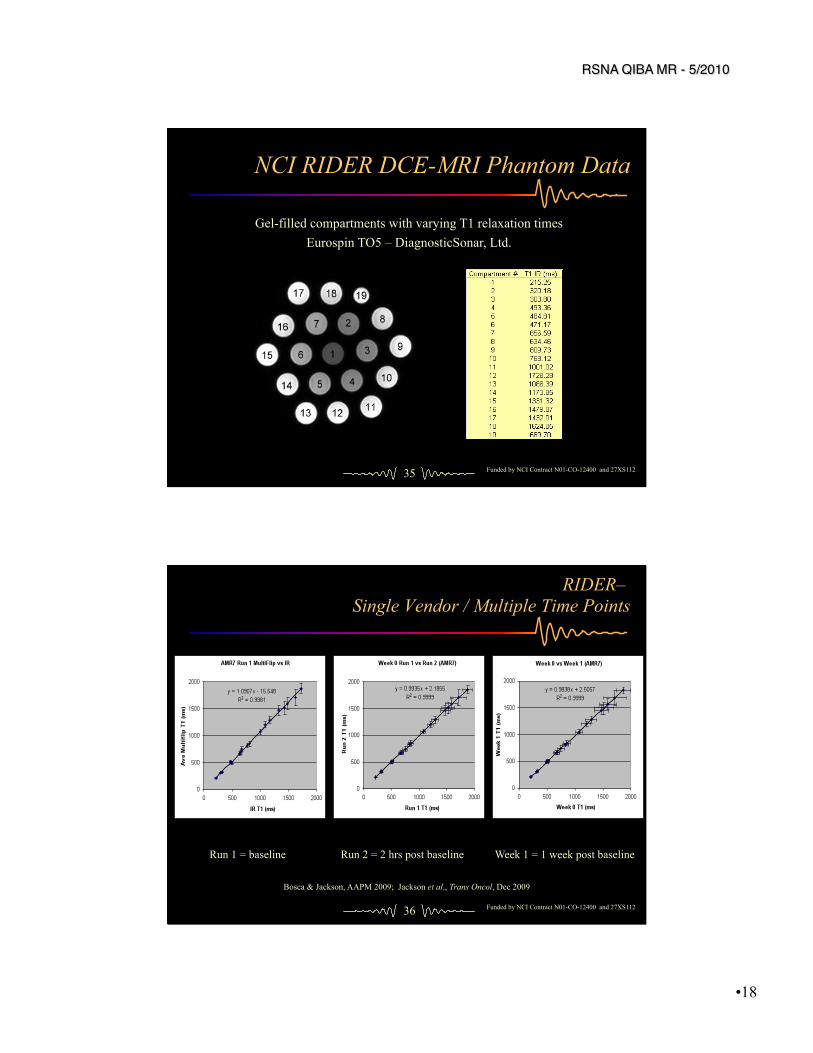
NCI RIDER DCE-MRI Phantom Data
Gel-filled compartments with varying T1 relaxation times Eurospin TO5 – DiagnosticSonar, Ltd.
Funded by NCI Contract N01-CO-12400 and 27XS112
36
RIDER – Single Vendor / Multiple Time Points
Run 1 = baseline Run 2 = 2 hrs post baseline Week 1 = 1 week post baseline
Bosca & Jackson, AAPM 2009; Jackson et al., Trans Oncol, Dec 2009
Funded by NCI Contract N01-CO-12400 and 27XS112

•!19
37
ISMRM Ad Hoc Committee
ISMRM: Ad Hoc Committee on Standards for Quantitative MR (SQMR)
–! Membership includes MR physicists, technologists, radiologists, NIST staff, NCI/CIP staff, vendors, and pharma. Expertise in research trials using quantitative MR.
–! Current status: •! White paper on quantitative MR •! Design specifications & construction of an “open source” MR system
phantom (collaboration with and funding by NIST) •! Initial multicenter / multivendor phantom pilot studies to begin in May
2010.
http://wiki.ismrm.org/twiki/bin/view/QuantitativeMR/
ISMRM SQMR System Phantom Spatial accuracy
Contrast response
Section thickness
High contrast resolution
0.6 0.7, 0.8, 0.9, 1.0 mm
All materials characterized by
NIST
ISMRM/NIST MR System Phantom
•!20
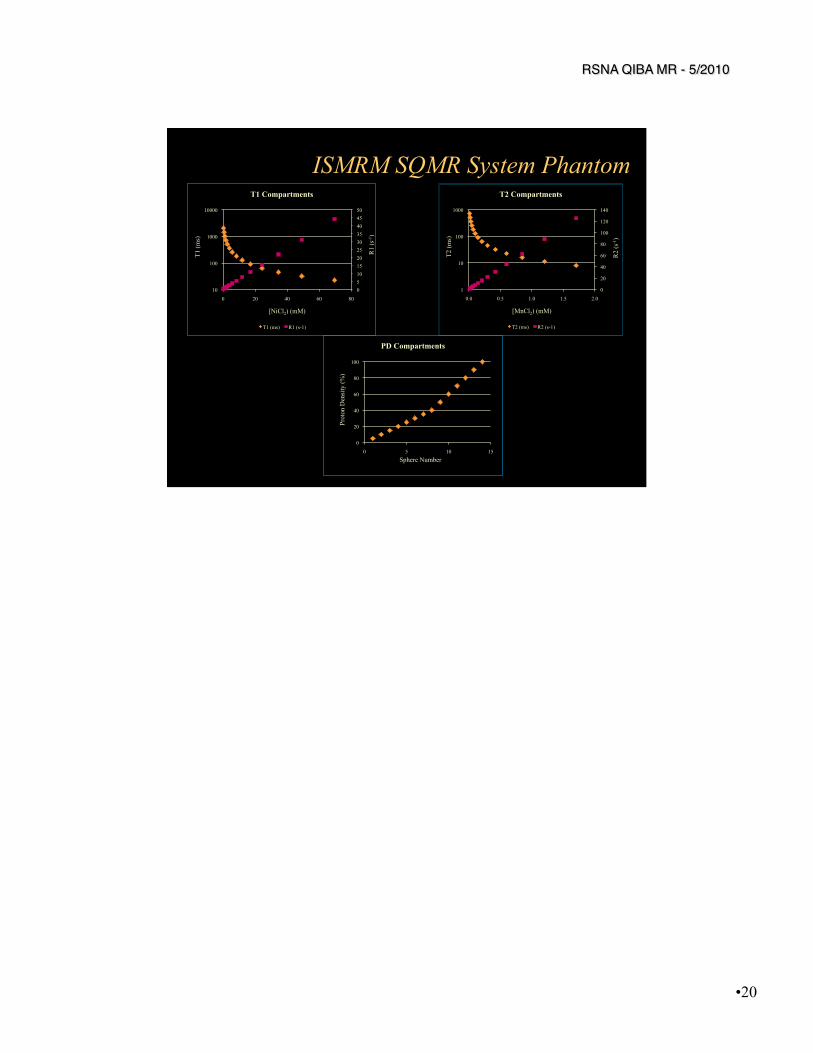
ISMRM SQMR System Phantom
0
20
40
60
80
100
120
140
1
10
100
1000
0.0 0.5 1.0 1.5 2.0
R2
(s-1
)
T2 (m
s)
[MnCl2) (mM)
T2 Compartments
T2 (ms) R2 (s-1)
0 5 10 15 20 25 30 35 40 45 50
10
100
1000
10000
0 20 40 60 80
R1
(s-1
)
T1 (m
s)
[NiCl2) (mM)
T1 Compartments
T1 (ms) R1 (s-1)
0
20
40
60
80
100
0 5 10 15
Prot
on D
ensi
ty (%
)
Sphere Number
PD Compartments