Embed Size (px)
Citation preview

1 | P a g e
ICICIdirect | Equity Research
Analysts’ Name
Supriya Khedkar [email protected] Rajni Mahadevan [email protected] Sales & EPS trend
2,500
3,000
3,500
4,000
FY08 FY09E FY10E FY11E
45
60
75
90
Sales (LHS) EPS (RHS)
Stock Metrics
Bloomberg Code CCRI INReuters Code CCRI.BOFace value (Rs) 10Promoters Holding 63%Market Cap (Rs cr) 13,15452 week H/L 1090 / 540Sensex 15,062Average volumes 45,013 Comparative return metrics
Stock return (%) 1M 3M 6M 12MContainer Corporation 5 33 57 30Allcargo Global Logistics 0 5 22 3Gateway Distriparks Ltd -5 41 101 15Transport Corporation 5 45 76 -16 Price Trend
0200400600800
100012001400
Jul-0
7
Oct-0
7
Jan-
08
Apr-0
8
Jul-0
8
Oct-0
8
Jan-
09
Apr-0
9
Jul-0
9
Shar
e Pr
ice
(Rs)
Closing Price Target Price Absolute Buy Absolute Sell
July 22, 2009 | Logistics
Initiating Coverage
Container Corporation of India (CONCOR)
Hauling well amid turbulence… Container Corporation of India (Concor), a miniratna company, is a market leader with 85% market share in moving containerized cargo by rail. The company has massive expansion plans of Rs 3,000 crore for next five years which will enhance the container handling capacity and garner larger volumes. Considering the global slowdown, we expect Concor’s topline to grow by 9.2% CAGR in FY09-FY11E. We initiate coverage on the stock with a HOLD rating.
Continues to enjoy leadership position Concor is the major player among rail operators. Concor’s strength lies in its large network of terminals, expertise in operating rail and dominance in Northern region. With more than 200 trains and 61 terminals, Concor has built a strong infrastructure giving it a competitive edge over its peers in the industry. Concor has lined up a capital expenditure (capex) of Rs 3,000 crore in next five years of which 80% will be spent on rolling stock, 10% on terminals and 10% on handling equipments and IT, which will lead to incremental growth in the topline from FY11E.
Maintaining the spurt in realisations We believe realisation per TEU to further grow by 2% CAGR in FY09-FY11E on account of rationalization of rail tariff both on exim and domestic front. We believe the dwell time to normalize in FY10E. However, Concor is planning to increase the handling charges along with high rail freight charges. This will help in maintaining high realisation per TEU. Concor’s volumes have grown by 7.5% CAGR over past five years but in sluggish volume scenario high realisations will aid falling volumes.
Valuation Concor is the market leader with zero debt and cash per share of Rs 147.6 in its balance sheet. Considering the impressive expansion plans we believe Concor to maintain its market share. Given the long term earning visibility we have valued the company on DCF based methodology. We rate the stock as HOLD with a price target of Rs 1,059.
Current Price Rs. 1012
Target Price Rs. 1059
Potential upside 5 %
Time Frame 12 months
HOLD
Exhibit 1: Key Financials
Year to March FY08 FY09E FY10E FY11ENet Profit (Rs crore) 752.4 818.7 851.1 970.9Shares in issue (crore) 13.0 13.0 13.0 13.0EPS (Rs) 57.9 63.0 65.5 74.7P/E (x) 16.4 15.1 14.5 12.7Price/Book (x) 4.1 2.7 3.0 2.5EV/EBIDTA 12.9 8.5 10.8 9.2RoNW (%) 23.6 21.6 19.1 18.5RoCE (%) 28.2 26.5 23.6 23.0 Source: Company, ICICIdirect.com Research

2 | P a g e
Company Background
Container Corporation of India, a subsidiary of the Ministry of Railways is the largest player in rail logistics. Concor was formed with an objective to promote containerization and to give boost to Indian International trade and commerce by offering multi-model logistic support. It is the major player in India moving containerized cargo by rail. It operates Container Freight Stations (CFS) / Inland Container Depots (ICD). Concor has a Pan India network of 61 terminals which facilitates access to different players in the logistics chain like customs, railways, ports and road transporters. The company also organizes rail/road transport for domestic containers and provides consultancy in the field of multi-modal transport. Its EBITDA margins of 28.6% in FY09 are much higher than that of other players in the logistics business. Having lost its monopoly over the rail haulage of cargo containers, Concor is looking at entering the container shipping business in order to fully integrate in the logistics chain and fetch more volumes. In FY09 containerized cargo accounted for 17.6% of the total exim traffic at 12 major ports in India, compared to 70% - 80 % in developed countries. Of the total exim container traffic in India, 32% is carried by rail. Concor is a market leader with 85% market share in rail logistics. This is an impressive opportunity for Concor, as it is the major player in a growing containerized cargo market. (Refer annexure – exhibit 38) Exhibit 2: Business Model
Source: Company, ICICIdirect.com Research
CFS – Container Freight Station ICD – Inland Container depot DCT – Domestic Container Terminal
CONCOR
EXIM Domestic
Exports
Imports
DCT Rail DCT
Other Business
Cold Chain (FHEL)
JVs / Strategic Investments
- Air cargo - CFS at Dadri - Operating Container Terminals - O&M of CFS at Nepal - Others Logistics
CFS / ICD Rail
Ports Rail CFS / ICD
Ports
Share holding pattern (Q4FY09)
Shareholder % holdingPromoters 63.1Institutional investors 34.4Other investors 1.0General public 1.5
Promoter & Institutional holding trend (%)
63.1 63.1 63.1 63.1
34.434.534.233.9
0.0
20.0
40.0
60.0
80.0
100.0
Q1 Q2 Q3 Q4
Promoter Holding Institutional Holding

3 | P a g e
Exhibit 3: Strong network of terminals
Source: Company
Concor has a network of 61 terminals which are strategically located all over the country. These terminals are well equipped with modern handling equipment and facilities. Of the volumes handled, 42% comes from the Northern region with the Tughlakabad ICD being the focal terminal.

4 | P a g e
Exhibit 4: Region-wise traffic in FY07
16%
14%
3%
43%
8%
12%
1%5%
Exim
Source: Company, ICICIdirect.com Research
5%
16%
2%4%
40%
9%
18%
6%Central Region
Eastern Region
North Central Region
North Western Region
Northern Region
South Central Region
Southern Region
Western Region
Domestic
Concor has a strong presence in northern region for both exim as well as domestic traffic.
Concor’s key terminal at Tughlakabad contributes around 19% to the total volume with 100% concentration on Exim traffic. Top 5 terminals (Tughalakabad, Dadri, Ludhiana, Sabarmati and Dronagiri) also dedicatedly contribute 43% to the core Exim business. Top 20 terminals handle 83% of total volumes. So the balance 65% of terminals handled only 17% of the total volumes. Consequently there is large portion of capacity not being optimally utilized. But the construction of Dedicated Rail Freight Corridor (DRFC) will boost the requirement for pan India presence. (Refer annexure – exhibit 39)
Top 5 terminals contributing 43% to total volume
Exhibit 5: Volumes contributed by Concor’s top terminals in FY07
0 10 20 30 40 50 60 70 80 90
Top
Top 5
Top 10
Top 20
Rank
ing
of te
rmin
als
% To Total Volumes Handled and Volume Mix
Exim Domestic
Source: Company, ICICIdirect.com Research

5 | P a g e
Exhibit 6: Consolidated revenue mix
1,899.42,459.9 2,646.7 2,725.4
526.9
597.5700.6 687.9
44.016.24.8
0
500
1,000
1,500
2,000
2,500
3,000
3,500
FY06 FY07 FY08 FY09
Rs C
rore
Exim Domestic Cold Chain
Source: Company, ICICIdirect.com Research
Note – Income from joint ventures / strategic investments is included in the standalone business divisions of exim and domestic.
Exhibit 7: Break-up of standalone revenue into major heads (Rs crore) FY08 FY09 Growth (%)
Rail Freight 2,615.8 2,565.0 -1.9% of total sales 78.1 75.1Terminal Handling 347.0 347.3 0.1% of total sales 10.4 10.2Ground Rent 188.9 273.0 44.5% of total sales 5.6 8.0Road Freight 108.0 127.0 17.6% of total sales 3.2 3.7Others 87.6 101.0 15.3% of total sales 2.6 3.0Total Revenue 3,347.3 3,413.3 2.0
Source: Company, ICICIdirect.com Research
Dwell time* was unusually high in FY09. Average dwell time hovers around 8-10 days but in Q3FY09 it had peaked to 19-20 days. An average dwell time of around 16 days in FY09 led to 44.5% YoY growth in ground rent income. Income from the core rail freight business fell by 1.9% to Rs 2,565.0 crore in FY09 from Rs 2,615.8 crore in FY08 on account of 6.2% fall in exim volumes and 3.6% fall in domestic volumes. Higher road freight rate in FY09 led to 17.6% increase in income from road freight.
_____________________________________________________________________________________
* Dwell time - No. of days containers stay at CFS / ICDs (Refer Annexure)
Income from core rail freight business shrunk on account of 5.7% fall in volumes led by 6.2% and 3.6% drop in exim and domestic volumes respectively
6 | P a g e
INVESTMENT RATIONALE
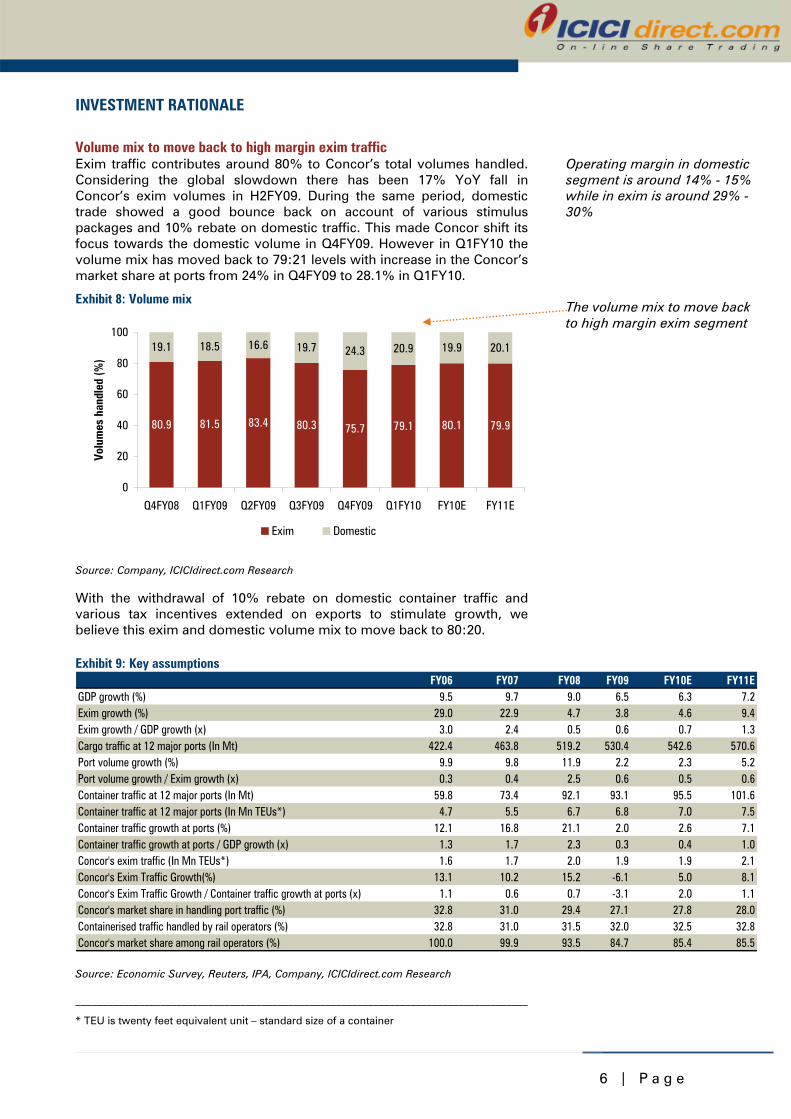
Volume mix to move back to high margin exim traffic Exim traffic contributes around 80% to Concor’s total volumes handled. Considering the global slowdown there has been 17% YoY fall in Concor’s exim volumes in H2FY09. During the same period, domestic trade showed a good bounce back on account of various stimulus packages and 10% rebate on domestic traffic. This made Concor shift its focus towards the domestic volume in Q4FY09. However in Q1FY10 the volume mix has moved back to 79:21 levels with increase in the Concor’s market share at ports from 24% in Q4FY09 to 28.1% in Q1FY10.
With the withdrawal of 10% rebate on domestic container traffic and various tax incentives extended on exports to stimulate growth, we believe this exim and domestic volume mix to move back to 80:20. Exhibit 9: Key assumptions
FY06 FY07 FY08 FY09 FY10E FY11EGDP growth (%) 9.5 9.7 9.0 6.5 6.3 7.2Exim growth (%) 29.0 22.9 4.7 3.8 4.6 9.4Exim growth / GDP growth (x) 3.0 2.4 0.5 0.6 0.7 1.3Cargo traffic at 12 major ports (In Mt) 422.4 463.8 519.2 530.4 542.6 570.6Port volume growth (%) 9.9 9.8 11.9 2.2 2.3 5.2Port volume growth / Exim growth (x) 0.3 0.4 2.5 0.6 0.5 0.6Container traffic at 12 major ports (In Mt) 59.8 73.4 92.1 93.1 95.5 101.6Container traffic at 12 major ports (In Mn TEUs*) 4.7 5.5 6.7 6.8 7.0 7.5Container traffic growth at ports (%) 12.1 16.8 21.1 2.0 2.6 7.1Container traffic growth at ports / GDP growth (x) 1.3 1.7 2.3 0.3 0.4 1.0Concor's exim traffic (In Mn TEUs*) 1.6 1.7 2.0 1.9 1.9 2.1Concor's Exim Traffic Growth(%) 13.1 10.2 15.2 -6.1 5.0 8.1Concor's Exim Traffic Growth / Container traffic growth at ports (x) 1.1 0.6 0.7 -3.1 2.0 1.1Concor's market share in handling port traffic (%) 32.8 31.0 29.4 27.1 27.8 28.0Containerised traffic handled by rail operators (%) 32.8 31.0 31.5 32.0 32.5 32.8Concor's market share among rail operators (%) 100.0 99.9 93.5 84.7 85.4 85.5
Source: Economic Survey, Reuters, IPA, Company, ICICIdirect.com Research
_____________________________________________________________________________________
* TEU is twenty feet equivalent unit – standard size of a container
The volume mix to move back to high margin exim segment
Operating margin in domestic segment is around 14% - 15% while in exim is around 29% - 30%
Exhibit 8: Volume mix
80.9 81.5 83.4 80.3 75.7 79.1 80.1 79.9
19.1 18.5 16.6 19.7 24.3 20.9 19.9 20.1
0
20
40
60
80
100
Q4FY08 Q1FY09 Q2FY09 Q3FY09 Q4FY09 Q1FY10 FY10E FY11E
Volu
mes
han
dled
(%)
Exim Domestic
Source: Company, ICICIdirect.com Research

7 | P a g e
Core exim business to recover from H2FY10E Concor’s exim business contributes around 80% to the total revenues. We expect Concor’s exim volume to grow by 5% in FY10E and 8.1% in FY11E. With global slowdown, the company had witnessed a volume de-growth of 6.2% in FY09. With recovery in Indian and global economy, we believe the exim container traffic will pick up from H2FY10E. Concor has outperformed the markets in Q1FY10, where container volumes at ports fell by 5.4% QoQ but Concor’s exim volumes grew by 10.8% QoQ by increasing the market share. Exhibit 10: Exim volume growth
10.213.1
10.0
15.3
-6.2
5.08.1
0
500,000
1,000,000
1,500,000
2,000,000
FY05 FY06 FY07 FY08 FY09 FY10E FY11E
TEU
s
-10
-5
0
5
10
15
20
Exim Volume (LHS) % Growth (RHS)
Source: Company, ICICIdirect.com Research
Domestic business showing faster recovery Concor’s domestic business contributes around 20% to the total revenues. With introduction of various stimulus packages in H2FY09 to boost domestic trade, we expect the domestic volume growth of 8% in FY10E and 9% in FY11E. Exhibit 11: Domestic volume growth
-3.6
9.08.0
0.3
6.44.2
20.7
0
100,000
200,000
300,000
400,000
500,000
FY05 FY06 FY07 FY08 FY09 FY10E FY11E
TEU
s
-5
0
5
10
15
20
25
Domestic Volume (LHS) % Growth (RHS)
Source: Company, ICICIdirect.com Research
Outperforms port volume growth trend in Q1FY10
Exim volumes took a hit in slowdown…..expected to recover from H2FY10E
Domestic volumes to gain momentum with introduction of various stimulus packages

8 | P a g e
Concor’s Exim traffic has grown at a much higher pace than domestic till FY07 but with the entry of private players (focusing on domestic routes); domestic traffic has also gained momentum. Exhibit 12: QoQ volume growth (%)
-7.6
10.8
-8.7
-0.7
-9.1
-14.7
8.4
5.5
13.9
0.7
-4.7
-12.6
21.0
4.8
8.2
1.2
-2.4-2.9
-20
-15
-10
-5
0
5
10
15
20
25
Q1FY08 Q2FY08 Q3FY08 Q4FY08 Q1FY09 Q2FY09 Q3FY09 Q4FY09 Q1FY10
Exim Domestic
Source: Company, ICICIdirect.com Research
Indian Railways (IR) had increased the haulage charges* on heavy weight freight by 14% - 16% in August 2008 (for both exim and domestic) and later declared 10 % rebate on the domestic traffic in November 2008 to boost the domestic trade. After this reduction, domestic traffic which de-grew in first two quarters of FY09 showed a QoQ growth of 4.8% in Q3FY09 and 21% in Q4FY09 while the exim segment de-grew by 14.7% in Q3FY09 and 7.6% in Q4FY09. Domestic volumes grew by 10.4% YoY in Q1FY10, which is a decent growth considering the current sluggish trade in the country and fell by 8.7% QoQ in Q1FY10 as volumes are always low in first quarter compared to fourth quarter previous year. Maintaining the spurt in realisation
We expect realisation per TEU to further grow by 2% CAGR in FY09-FY11E. We believe the rationalization of tariff and increase in handling charges to keep to realisation per TEU at higher levels. Exhibit 13: Blended realisation per TEU
1154612568
14522 1367514788 15264 15417
0
3,000
6,000
9,000
12,000
15,000
18,000
FY05 FY06 FY07 FY08 FY09 FY10E FY11E
Rs
-10
-5
0
5
10
15
20
Realisation Per TEU (LHS) YoY % Growth (RHS)
Source: Company, ICICIdirect.com Research
_____________________________________________________________________________________
* Haulage charges are paid to IR for using tracks, locomotives and other railway assets
Exim volumes are recovering with increase in Concor’s market share
Domestic volumes grew faster on back of freight rate cuts

9 | P a g e
Exim realisation to stabilise... Exim realisation is largely driven by three major factors i.e. rail haulage charges, ground rent income and handling charges. Though the dwell time has normalized from its unusual highs in FY09, we believe realisation per TEU to further grow by 3% in FY10E on account of increase in exim rail haulage charges from August 2008 and increasing import-export volumes mismatch. Realisations are 6-7% higher in case of import traffic compared to export traffic. This leads to higher realisation per TEU but will keep the margins under pressure as the empty running expenses increase with the rising volume mismatch. We believe this scenario to improve once export traffic gains momentum. Concor has also decided to increase the handling charges which contribute around 10% to the topline. Exhibit 15: Quarterly Growth in Exim Realization per TEU
0
4,000
8,000
12,000
16,000
20,000
Q1FY08 Q2FY08 Q3FY08 Q4FY08 Q1FY09 Q2FY09 Q3FY09 Q4FY09 Q1FY10
Rs
-15
-10
-5
0
5
10
15
20
Realisation Per TEU (LHS) YoY % Growth (RHS) QoQ % Growth (RHS)
Source: Company, ICICIdirect.com Research
In FY09, Concor’s container volumes (exim + domestic) fell by 5.7% but revenue from rail freight declined by 1.9%. This was on account of increase in rail haulage charges in H2FY09, leading to 3.8% growth in realisation per TEU. Realisation per TEU from ground rent income increased by 54.1% from Rs 955.3 per TEU in FY08 to Rs 1471.7 per TEU in FY09. This was on account of increase in dwell time. Dwell time had risen from an average of 8-10 days to 19-20 days in Q3FY09. However this situation will not persist for long. Dwell time gradually comes down once demand – supply imbalance moves towards equilibrium. Dwell time has come down to 12-14 days in Q4FY09 and is expected to come down to its average levels in FY10E.
Topline to grow by 9.2% CAGR in FY09-FY11E backed by 6.9% CAGR in volume and 2.1% CAGR in realisation during the same period
Exhibit 14: Assumptions per TEU (In Rs) FY08 FY09 FY10E FY11E CAGR (%)
TEUs Handled 2,447,769 2,308,232 2,438,144 2,640,159 6.9Blended realisation / TEU 13,675 14,788 15,264 15,417 2.1EBITDA / TEU 3,637 4,227 4,226 4,435 2.4PBT / TEU 3,875 4,563 4,487 4,727 1.8PAT / TEU 3,074 3,547 3,491 3,677 1.8 Source: Company, ICICIdirect.com Research
Continuous improvement in realization due to rationalization of tariff and export – import volume mismatch

1 0 | P a g e
Exhibit 16: Annual Growth in Exim Realization per TEU
-
2,000
4,000
6,000
8,000
10,000
12,000
14,000
16,000
FY05 FY06 FY07 FY08 FY09 FY10E FY11E
Rs
-10
-5
0
5
10
15
20
Realisation Per TEU (LHS) YoY % Growth (RHS)
Source: Company, ICICIdirect.com Research
Along with the high rail freight charges, Concor is further planning to increase the handling charges. This will help in maintaining high realisation per TEU but may adversely impact the volume side. …and domestic realisation to pick up Realisation per TEU is always higher in case of domestic traffic on account of longer lead distances and after the withdrawal of 10% rebate on domestic traffic we believe the realisation per TEU to go up in case of domestic traffic. Indian Railways has decided to withdraw the rebate of 10% given on domestic traffic from 1st July 2009. This will increase the rail freight expense to be paid to railways. Concor passes on the increase in freight charges in the same proportion and therefore we expect the realisation per TEU to increase. However this will not contribute at the EBITDA level and may further impede the demand for carrying domestic containers by rail. Exhibit 17: Annual growth in domestic realisation per TEU
-
2,000
4,000
6,000
8,000
10,000
12,000
14,000
16,000
FY05 FY06 FY07 FY08 FY09 FY10E FY11E
Rs
-4
-2
0
2
4
6
8
10
12
Realisation Per TEU (LHS) YoY % Growth (RHS)
Source: Company, ICICIdirect.com Research
Normalization of dwell time to drop down the growth in realisation but rise in handling charges to help maintain the realisation per TEU in FY10E and FY11E
Withdrawal of 10% rebate on domestic volumes to boost the realisation per TEU

1 1 | P a g e
Continues to enjoy leadership position
Opening up of rail transport for private players in FY07 has brought an end to Concor’s monopoly. However we expect Concor to hold a major market share on the basis of amplifying handling capacity along with capacity expansion at ports. (Refer annexure – exhibit 35) Exhibit 18: Concor’s market share among rail operators (%)
100.0 99.9
93.5
84.7 85.4 85.5
75
80
85
90
95
100
105
FY06 FY07 FY08 FY09 FY10E FY11E
Source: Company, ICICIdirect.com Research
Rail business is a capital intensive business and it will take time for private players to establish a strong network. Concor has massive expansion plans with zero debt and huge cash on books. Concor has started cutting rates at some locations where private players are coming up. With this step Concor has hedged its market share and it will take longer time for private players to breakeven. We believe that currently most private players are incurring losses and are not able to fully utilize their rakes. All this makes their survival difficult. Strong Infrastructure to play key role
We strongly believe, Concor to hold its dominant position in this market on back of vast terminal network and frequency of service. From past 21 years Concor has been eager on building a strong infrastructure. With more than 200 trains and 61 terminals, it is the largest player in the logistics space in India. Concor’s strength lies in its large network of terminals, expertise in this field and dominance in northern region where most of the private players are coming up. Private players are mainly leaping towards the North-West belt which is the busiest route by rail. Concor runs 16-18 trains per day on JNPT-NCR route while competitors run around 2 trains per day on the same route. Concor has a major presence in the Northern region with around 42% of volumes coming from this region. (Refer annexure – exhibit 32) Massive expansion lined up
When other players are deferring their expansion plans Concor has lined up a capex of Rs 3,000 crore in next five years of which 80% will be spent on procuring wagons, 10% terminal expansion and 10% handling equipments and IT. To procure such assets it requires a lead time of 1.5 - 2 years and with the planned capex Concor would be all set to reap the benefits of economic revival and handle large volumes. Here Concor will have an edge over other players. Moreover, Concor will also gain on recent 5% decline in wagon prices.
Increasing competition from private players to be tackled by massive expansion plans
Difficult to replace its networking, expertise and frequency
Lined up capex of Rs 3,000 crore in next 5 years

1 2 | P a g e
Concor had an asset base of 6,722 high speed wagons, 13,517 containers, 1,357 container flats, 342 other wagons, reach stackers and 57 terminals in FY08. Concor has added 1,079 wagons ie around 24 rakes (each rake consists of 45 wagons each), 2 terminals and expanded capacity of existing terminals at a capex of Rs 500 crore in FY09. Exhibit 19: Trend in capex spending and capacity addition
510 815 7951,079
1,4001,400
02,0004,0006,0008,000
10,00012,00014,00016,000
FY06 FY07 FY08 FY09 FY10E FY11E
In N
umbe
rs
0
100
200
300
400
500
600
700
Rs C
rore
Total No. of wagons (LHS) No. of wagons added (LHS) Capex (RHS)
Source: Company, ICICIdirect.com Research
Concor has planned a capex of Rs 600 crore for FY10E of which Rs 100 crore will be spent on joint ventures. With the balance Rs 500 crore capex Concor is to take a delivery of 1,400 wagons with which it will add around 30 rakes to its existing fleet of 226 rakes as on FY09. Of this planned 30 rakes, Concor has added 6 rakes in Q1FY10 taking the total fleet size to 232 rakes. Also 3 terminals will be added and 64 terminals will be operational by end of FY10E. Concor will be incurring a similar amount of capex in FY11E as well. Cost efficient as compared to road transport
Rail transport is generally 30% cheaper than road transport. Rail transport is useful for heavy weight and long distance freight. Haulage charge depends on lead distance and weight and Concor runs 80% of the trains above 1000 kms. Exhibit 20: Comparison of rail and road freight rates Routes Distance (kms) Rail (Rs / TEU) Road (Rs / TEU) Road/ Rail (x)Delhi - JNPT / Mumbai 1,400 - 1,450 20,830 27,400 1.3Delhi - Mundra 950 - 1,000 14,851 23,400 1.6Delhi - Kolkata 1,450 - 1,500 21,494 45,507 2.1Delhi - Chennai 2,100 - 2,150 29,461 52,000 1.8 Source: Indian Railways, CRISIL, ICICIdirect.com Research
Construction of DRFC
Indian railways have planned to build dedicated rail freight corridors (DRFC) which will exclusively cater to freight trains. These corridors will greatly improve the freight transportation across India. Freight trains currently run at 25-30kmph and are expected to run at 100kmph with the upcoming project. Road transport enjoys 68% market share of containerized traffic solely on account of inefficiency in rail operations. Once this project is completed rail operators will grab a large market share from the truck operators. If everything turns out well the project is expected to be completed by 2015-16. (Refer annexure – exhibit 39)
Reaping the benefits of fall in raw material prices
DRFC will increase the proportion of rail in the rail-road pie

1 3 | P a g e
Shipping business – the next step ahead
After making a presence in air cargo and cold chain logistics, Concor has plans to enter the shipping business. But considering the current slowdown and low day rates in shipping business, Concor is expected to enter the segment when the market conditions turns favorable. Initially they would start with joint ventures and would infuse equity after gaining adequate expertise. Shipping lines such as APL and Maersk and terminal operators such as DP World have entered the business of running container trains. Concor will do the same by entering the container shipping business. It has also proposed to open offices abroad as part of the integration strategy. This will help them to capture volumes right from the point of origin. It would also compensate for the volume loss due to entry of shipping companies into container rail business.
Integrating into shipping business to capture volumes from point of origin

1 4 | P a g e
FINANCIALS
Sales growth slows down…. We expect revenues to grow by 9.2% CAGR from FY09 – FY11E after a high growth of 14.4% CAGR in past five years. This is primarily on account of sluggish growth in exim volumes, however aided by higher realisation. We expect a growth of 5% in exim volumes and 8% in domestic volumes in FY10E. We expect exim realisation to grow by 3% even after fall in dwell time considering the increase in haulage charges and handling charges. We expect domestic realisation to grow by 4% on back of withdrawal of rebate. We expect revenues to grow by 9% in FY10E and 9.4% in FY11E on back of improvement in volumes.
Exhibit 21: Sales Growth
0
1,000
2,000
3,000
4,000
FY05 FY06 FY07 FY08 FY09 FY10E FY11E
Rs C
rore
-10
0
10
20
30
Sales Growth (%)
14.4% CAGR9.2% CAGR
Source: Company, ICICIdirect.com Research
….but maintaining high margins Concor is committed on buying more handling equipments which in turn has reduced the handling expenses of the company at the terminals. Moreover, increase in the freight rates are usually passed on to the customers. So it does not affect the margins of the company. All these factors contributed to higher profit margins in FY09. Exhibit 22: Profit Margins (%)
28.827.7
28.626.6
29.228.5
31.529.0
23.922.9
24.022.523.0
21.721.421.2
15
19
23
27
31
35
FY04 FY05 FY06 FY07 FY08 FY09 FY10E FY11E
EBITDA Margin PAT Margin
Source: Company, ICICIdirect.com Research
Higher realisation cushions lower volumes
Maintaining EBITDA margin above 26% since past 6 years and even in bad times

1 5 | P a g e
However, the proportion of empty running containers had increased to 15% in FY09. And it has further increased to 17.6% in Q1FY10. With increase in empty running expenses, we believe profit margins to fall in FY10E. With recovery of volumes from H2FY10E and lower handling expenses we believe the profit margins to improve in FY11E. But the full benefit will not be passed on to net profit level considering higher depreciation on account of higher capex. Strong balance sheet assists in bad times
Concor has a cash balance of Rs 1,907 crore as on July 2009. Cash and bank balance accounts for more than 40% of Concor’s total assets. A few months back when companies in various industries were struggling hard with liquidity crunch and high interest rate scenario, Concor had an edge over others with no debt in its books. Concor has huge cash reserve which helps them fund their future capex plans without raising debt.
Low Tax Rate Concor enjoys a tax benefit under section 80 IA and accordingly effective the tax rate for the company is around 21-22%. Concor gains this benefit for infrastructure development by building CFS & ICDs. In union budget 2009, government has announced investment linked tax incentives for companies investing in cold chain warehouse and Concor is already into cold chain logistics from FY07. Therefore will enjoy tax incentive on future investment in this segment.
Regular dividend payout Concor shells out dividend on a regular basis. In FY09 it has paid an interim dividend at 60% and declared a final dividend at 80% for FY09. We expect the same trend to continue as the company is expected to generate sufficient cash even after funding their capex plans.
Exhibit 23: Trend in dividend payout
0
2
4
6
8
10
12
14
16
18
FY04 FY05 FY06 FY07 FY08 FY09
Rs
0
5
10
15
20
25
30
35
DPS (LHS) Dividend Payout (%) (RHS)
Source: Company, ICICIdirect.com Research
High margins, huge cash reserves, massive expansion plan and zero debt to aid till sales growth comes back on track.
Least financial risk during unforeseen market conditions

1 6 | P a g e
RISKS & CONCERNS
Sluggish volume growth Container traffic has been growing at 16.6% CAGR in the past four years. But in FY09 it has grown by meagre 2%. In Q1FY10 port volumes have declined by 8.4% YoY and 5.4% QoQ. Concor deals purely in containerized cargo and the business is volume driven. 80% of volumes come from Exim business. The overall trade in the country has taken a hit. The sharp fall in the volume of container cargo is mainly on account of the slowing down of export orders from India’s largest trading partners like the United States and the European Union, following the global credit crisis. Exhibit 24: Growth in Containerized Traffic
2.0
21.1
16.8
12.18.5
01,0002,0003,0004,0005,0006,0007,0008,000
FY05 FY06 FY07 FY08 FY09
TEU
(In
000'
s)
0
5
10
15
20
25
Container traffic (LHS) % Growth (RHS)
Source: IPA, ICICIdirect.com Research
During the past 16 years growth in containerized traffic has outperformed the growth in total port traffic but has got hit the most during the slowdown. In FY09 container volumes have seen a steep fall in growth. With export-import sliding on the back of global economic slowdown, India’s container rail trade is also facing the heat. Exhibit 25: Growth in container traffic v/s Growth in total port traffic
-10
0
10
20
30
40
1990
-91
1991
-92
1992
-93
1993
-94
1994
-95
1995
-96
1996
-97
1997
-98
1998
-99
1999
-00
2000
-01
2001
-02
2002
-03
2003
-04
2004
-05
2005
-06
2006
-07
2007
-08
2008
-09
Grow
th (%
)
Growth in Total Cargo Growth in Containerized Cargo
Congestion Problem at
Global Slowdow
Series of bomb blast in Mumbai ie political
Source: IPA, ICICIdirect.com Research
Container traffic has grown by 16.6% CAGR from FY05-FY08 but grown by 2.0% in FY09
Container traffic has been hit more compared to total traffic in FY09

1 7 | P a g e
Factors such as the announcement of fiscal stimulus package, lower interest rate regime and comfortable liquidity situation, and the effect of the Sixth Pay Commission (leading to increased domestic consumption) would spur economic activity. We do not see much improvement in the container volumes in FY10E. However we expect recovery in FY11 with large volumes. Increasing presence of private players
Opening up of rail transport for private players has brought an end to Concor’s monopoly. Entry of private players in FY07 has slowed down Concor’s exim volume growth. But considering the capital intensive nature of rail business and the required expertise in this field, we believe Concor would continue to have an edge over private players. Exhibit 26: Trend in Concor's exim volume growth
-10
-5
0
5
10
15
20
25
FY05 FY06 FY07 FY08 FY09
Grow
th (%
)
Container Traffic at Major Ports Concor Exim Traffic
Concor's exim volume growth slowed down after entry of private players in FY07
Source: Company, ICICIdirect.com Research
Exhibit 27: Positioning of private players
Private Players Current Status Growth PlansInnovative B2B 8 rakes - JNPT to Loni 40 rakes till FY11APL IndiaLinx 1 rake - JNPT to Loni 1 ICD at PanipatHind Terminals 4 rakes - Sabarmati, kota, Mundra, Pipavav to JNPT NA
Uses Concor's ICDs and CWC's CFS at Mumbai & Mundra -Boxtrans Logistics 12 rakes - NCR to Mundra & Vishakapatnam, Pipavav, 3 CFS at Nagpur
Cochin, Chennai and 2 CFS at Gurgaon & Chennai Orissa & AhmedabadContainer Rail Road Services 7 rakes - NCR - Mundra & NSCIT - NCR NAAdani Logistics 6 rakes - Rajasthan, Gurgaon to Mundra Port, JNPT 11 rakes till FY10Emirates Trading Agency 6 rakes 25 rakes and 2 CFS till FY10Central Warehousing Corp 1 rake - Loni to JNPT & 1 logistics park 22 logistics parkSical Multimodal and Rail 3 rakes - Mumbai to Rajasthan, Jharkahnd, Delhi, chennai 10 rakes and 3 CFS till FY10 Gateway Rail Freight 15 rakes - Mumbai, Mundra, Pipavav, NCR, Rajasthan, Orissa, 17 rakes till FY10
Jharkhand, West Bengal & Punjab -Arshiya Rail Infrastructure 2 rakes - Orissa to Vizag 30 rakes till FY10 Source: ICICIdirect.com Research
There are 65 private rakes currently operating in the country of which 12-15 rakes are laying idle. Considering the current market conditions we expect that private players would not be able to meet their expansion target on time. However, we believe Concor to execute their expansion plans as per schedule.
Decelerated growth in Concor’s exim traffic but maintaining 85% utilisation of rakes even in the present choppy market

1 8 | P a g e
Competition from truck operators Concor faces high competition from truck operators offering transportation by road. Road transport has market share of 68% in total container traffic. After losing its monopoly in rail logistics, Concor will also have to grab market share from road transport operators. Competition with truck operators is primarily on the basis of last mile connectivity and dependability. Concor competes favorably with road transport operators on heavy cargo and long distance routes. Volvo trucks, with highly reduced transit times as compared to conventional trucks, are challenging the rail transit times of Concor. Considering the competition from truck operators, Concor has entered into a tactical partnership with Transport Corporation of India (largest player in road transport), which would aid improving its performance in road segment. Spurt in empty running expenses Proportion of empty running containers had increased to 15% in FY09. And it has further increased to 17.6% in Q1FY10. Rail haulage charges have to be paid on such empty containers which do not contribute to the topline. This will have an adverse impact on the profit margins in FY10E. This increase in empty running expenses is on account of export – import volume mismatch. The gap has increased from 45,077 TEUs in Q1FY09 to 95,421 TEUs in Q1FY10. Subsequently the company has decided to increase the handling charges to minimize the impact of empty running expenses on margins. However we believe handling charges which are an important source of income through terminals will decline in long term due to increasing competition. This will reduce the realization per container for the company in the long run.

1 9 | P a g e
VALUATIONS
Concor has a healthy cash flow cycle and will generate surplus cash going forward. This will be utilized for buying assets and to stay ahead in competition by widening the gap. We believe container volumes to come back on track by FY11. At that point of time Concor will have the capacity to handle large volumes. Even in the current sluggish volume scenario, Concor is maintaining high profit margins. Considering the sluggish volumes cushioned by higher realisation, we expect Concor’s topline to grow by 9.2% CAGR in FY09-FY11E. We believe the major benefit of large expansion plans to flow in from FY11E onwards. The company enjoys the benefits of vast terminal network, outstanding client base and excellent frequency of trains running all the country with major share in the busiest routes. Given the impressive expansion plans and long term cash visibility we have valued the company on discounted cash flow (DCF) methodology. Our DCF valuation gives a value of Rs 1059 to the stock. Exhibit 28: Assumptions Risk free rate (%) 6.9Beta (2 years Adj Beta) 0.6Market return (%) 12.5Cost of equity (%) 10.3 Source: ICICIdirect.com Research
Exhibit 29: Valuation Based on DCF Model In Rs crore (except per share data)WACC (%) 10.3Revenue CAGR over FY10-19E (%) 9.9Present Value of Cash Flow till FY18E 4,732.0Terminal Growth (%) 2.0Present Value of terminal cash flow 7,112.9Total present value of the firm 11,845.0Less: Current Debt 0.0Total present value of the Equity (excluding current cash) 11,845.0Number of Equity Shares outstanding 13.0Per Share Value (excluding current cash) 911.3Add Current Cash and Cash equivalent Per Share 147.6DCF - Target price (Rs) 1,058.9 Source: ICICIdirect.com Research
Exhibit 30: Sensitivity Analysis of DCF Value
8 9.5 10.3 11.5 121 1,354 1,096 995 828 8712 1,495 1,178 1,059 867 9153 1,692 1,285 1,140 914 9704 1,988 1,431 1,247 973 1,0405 2,481 1,642 1,395 1,050 1,131
WACC (%)
Terminal Growth Rate
(%)
Source: ICICIdirect.com Research

2 0 | P a g e
At the current price of Rs 1012, the stock is trading at a P/E multiple of 15.5x its FY10E EPS of Rs 65.5 and 13.6x its FY11E EPS of Rs 74.7. The stock is available at 10.8x FY10E EV/EBIDTA and 9.2x FY11E EV/EBIDTA. At the target price of 1059, the stock is expected to trade at a P/E multiple of 16.2x FY10E EPS of Rs 65.5 and 14.2x FY11E EPS of Rs 74.7. Exhibit 31: PE Chart
0200400
600800
10001200
140016001800
Jul-0
7
Oct-0
7
Jan-
08
Apr-0
8
Jul-0
8
Oct-0
8
Jan-
09
Apr-0
9
Jul-0
9
Shar
e Pr
ice
(Rs)
Closing Price 26x 22x 18x 14x 10x
Source: Company, ICICIdirect.com Research

2 1 | P a g e
Profit and Loss Account Year Ended 31 March FY08 FY09E FY10E FY11ENet Sales 3,347.3 3,413.3 3,721.6 4,070.5% Growth 9.5 2.0 9.0 9.4Less: Terminal and Other Service Charges 2,292.4 2,259.6 2,493.5 2,686.5% of total cost 93.3 92.7 92.7 92.7Employees Remuneration & Benefits 55.0 65.4 74.9 78.8% of total cost 2.2 2.7 2.8 2.7Administrative & Other Expenses 109.5 112.6 122.8 134.3% of total cost 4.5 4.6 4.6 4.6Total Expense 2,456.9 2,437.6 2,691.2 2,899.6% of sales 73.4 71.4 72.3 71.2EBITDA 890.4 975.7 1,030.4 1,170.8EBITDA Margin (%) 26.6 28.6 27.7 28.8Other Income 164.5 192.1 200.2 240.1Depreciation 106.3 114.6 136.6 163.0PBIT 948.5 1,053.2 1,094.0 1,247.9PBIT Margin (%) 28.3 30.9 29.4 30.7Interest 0.0 0.0 0.0 0.0PBT 948.5 1,053.2 1,094.0 1,247.9Taxes 196.1 234.5 242.9 277.0PAT 752.4 818.7 851.1 970.9Add: Exceptional Items 0.0 0.0 0.0 0.0Add / (Less): Prior Period Adjustments (0.2) 0.0 0.0 0.0Net Profit 752.2 818.7 851.1 970.9Net Profit Margin (%) 22.5 24.0 22.9 23.9 Source: Company, ICICIdirect.com Research
Balance Sheet Year Ended March 31 FY08 FY09E FY10E FY11ESources of FundsEquity Share Capital 65.0 130.0 130.0 130.0Reserves & Surplus 3,118.9 3,664.9 4,334.3 5,123.5Shareholder's Funds (A) 3,183.9 3,794.9 4,464.3 5,253.5Secured Loans 0.0 0.0 0.0 0.0Unsecured Loans 0.0 0.0 0.0 0.0Loan Funds (B) 0.0 0.0 0.0 0.0Deferred Tax Liability (C) 173.7 173.7 173.7 173.7Total Liabilities (A+B+C) 3,357.6 3,968.6 4,638.0 5,427.2Application of FundsGross Block 2,244.2 2,645.2 3,145.2 3,745.2Less: Accumalated Depreciation 579.1 693.7 830.3 993.3Net Block (A) 1,665.2 1,951.5 2,314.9 2,752.0Capital WIP (B) 172.1 275.0 375.0 375.0Investments (C) 155.4 155.4 155.4 155.4Cash 1,521.5 1,777.1 2,002.2 2,332.6Inventories 4.8 5.1 5.7 6.1Sundry Debtors 13.7 16.8 16.3 16.7Loans & Advances 300.2 307.2 334.9 366.3Other Current Assets 61.8 61.4 60.3 58.6Current Assets 1,902.1 2,167.7 2,419.4 2,780.4Current Liabilities & Provisions 537.1 581.0 626.7 635.5Net Current Assets (D) 1,365.0 1,586.7 1,792.7 2,144.8Miscellaneous Expenditure (E) 0.0 0.0 0.0 0.0Total Assets (A+B+C+D+E) 3,357.6 3,968.6 4,638.0 5,427.2 Source: Company, ICICIdirect.com Research
Maintaining high operating margins even in difficult market conditions
Debt free company

2 2 | P a g e
Cash Flow Statement
(Rs crore)FY08 FY09E FY10E FY11E
Profit before Tax 948.5 1,053.2 1,094.0 1,247.9Misc exp w/o 0.0 0.0 0.0 0.0Dividend Paid (167.3) (207.7) (181.7) (181.7)Depreciation 106.3 114.6 136.6 163.0Provision for deferred tax 0.5 0.0 0.0 0.0Prior Period Adjustment (0.2) 0.0 0.0 0.0Less:Tax Paid (191.3) (234.5) (242.9) (277.0)CF before change in WC 696.6 725.6 806.0 952.2Inc./(Dec.) in Current Liab. 49.1 43.9 45.7 8.8(Inc.)/Dec. in Current Assets (54.3) (10.0) (26.6) (30.6)CF from operations 691.5 759.5 825.1 930.4Purchase of Fixed Assets (189.4) (503.9) (600.0) (600.0)(Inc.)/Dec. in Investment (43.1) 0.0 0.0 0.0CF from Investing (232.5) (503.9) (600.0) (600.0)Inc./(Dec.) in Debt 0.0 0.0 0.0 0.0Inc./(Dec.) in Net worth 0.0 0.0 0.0 0.0CF from Financing 0.0 0.0 0.0 0.0Opening Cash balance 1,062.6 1,521.5 1,777.1 2,002.2Closing Cash balance 1,521.5 1,777.1 2,002.2 2,332.6 Source: Company, ICICIdirect.com Research
Ratios
FY08 FY09E FY10E FY11EEBITDAM (%) 26.6 28.6 27.7 28.8PBITM (%) 28.3 30.9 29.4 30.7PBTM (%) 28.3 30.9 29.4 30.7PATM (%) 22.5 24.0 22.9 23.9ROCE (%) 28.2 26.5 23.6 23.0ROE (%) 23.6 21.6 19.1 18.5ROA (%) 19.3 18.0 16.2 16.0Debt/Equity (x) 0.0 0.0 0.0 0.0Adjusted EPS (Rs) 57.9 63.0 65.5 74.7EV/EBIDTA (x) 12.9 8.5 10.8 9.2P/E (x) 17.3 12.3 15.5 13.5BV / Share (Rs) 241.0 288.3 340.2 401.3P/BV (x) 4.1 2.7 3.0 2.5Realisation / TEU (Rs) 13,674.9 14,787.7 15,263.9 15,417.5EBITDA / TEU (Rs) 3,637.5 4,227.1 4,226.0 4,434.7PBT / TEU (Rs) 3,875.0 4,562.6 4,486.9 4,726.8PAT / TEU (Rs) 3,073.9 3,546.8 3,490.8 3,677.4
Du Pont Analysis (%)
FY08 FY09E FY10E FY11EPAT / PBT 79.3 77.7 77.8 77.8PBT / EBIT 28.3 30.9 29.4 30.7EBIT / Sales 28.3 30.9 29.4 30.7Sales / Assets 99.7 86.0 80.2 75.0Assets / Equity 105.5 104.6 103.9 103.3ROE 23.6 21.6 19.1 18.5 Source: Company, ICICIdirect.com Research
Planned a capex of Rs 500 –Rs 600 crore pa
Return ratios are declining from FY09 - FY11E as the company is on the investment mode

2 3 | P a g e
ANNEXURE Exhibit 32: Comparison with top 20 global ports (In thousand TEUs) Port Name Trade Region CY08 CY07 CY06 CY05 CY04Singapore South East Asia 29,918 27,932 24,792 23,192 21,329Growth (%) 7.1 12.7 6.9 8.7 -Shanghai East Asia 27,980 26,150 21,710 18,084 14,557Growth (%) 7.0 20.5 20.1 24.2 -Hong Kong East Asia 24,248 23,881 23,539 22,427 21,984Growth (%) 1.5 1.5 5.0 2.0 -Shenzhen East Asia 21,414 21,099 18,469 16,197 13,615Growth (%) 1.5 14.2 14.0 19.0 -Busan North East Asia 13,425 13,270 12,039 11,843 11,430Growth (%) 1.2 10.2 1.7 3.6 -Dubai Mid-East 11,827 10,653 8,923 7,619 6,429Growth (%) 11.0 19.4 17.1 18.5 -Ningbo East Asia 11,226 9,349 7,068 5,208 4,006Growth (%) 20.1 32.3 35.7 30.0 -Guangzhou East Asia 11,001 9,200 6,600 4,685 3,308Growth (%) 19.6 39.4 40.9 41.6 -Rotterdam Northern Europe 10,800 10,791 9,655 9,287 8,281Growth (%) 0.1 11.8 4.0 12.1 -Qingdao East Asia 10,320 9,462 7,702 6,307 5,140Growth (%) 9.1 22.9 22.1 22.7 -Hamburg Northern Europe 9,700 9,890 8,862 8,088 7,003Growth (%) -1.9 11.6 9.6 15.5 -Kaohsiung East Asia 9,677 10,257 9,775 9,471 9,714Growth (%) -5.7 4.9 3.2 -2.5 -Antwerp Northern Europe 8,664 8,176 7,019 6,482 6,064Growth (%) 6.0 16.5 8.3 6.9 -Tianjin East Asia 8,500 7,103 5,950 4,801 3,814Growth (%) 19.7 19.4 23.9 25.9 -Port Klang South East Asia 7,970 7,120 6,326 5,544 5,244Growth (%) 11.9 12.6 14.1 5.7 -Los Angeles North America West Coast 7,850 8,355 8,470 7,485 7,321Growth (%) -6.0 -1.4 13.2 2.2 -Long Beach North America West Coast 6,488 7,316 7,289 6,710 5,780Growth (%) -11.3 0.4 8.6 16.1 -Tanjung Pelepas South East Asia 5,600 5,500 4,770 4,177 4,020Growth (%) 1.8 15.3 14.2 3.9 -Bremen/Bremerhaven Northern Europe 5,501 4,912 4,450 3,736 3,469Growth (%) 12.0 10.4 19.1 7.7 -New York/New Jersey North America East Coast 5,265 5,299 5,093 4,785 4,478Growth (%) -0.6 4.0 6.4 6.9 -JNPT Asia - India 3,953 4,060 3,298 2,667 2,361Growth (%) -2.6 23.1 23.7 13.0 -India (12 Major ports) Asia 6,846 6,712 5,541 4,744 4,233Growth (%) 2.0 21.1 16.8 12.1 - Source: Containerization International, Wikipedia, ICICIdirect.com Research
JNPT was ranked 24th busiest port in the world in FY08. JNPT handles around 60% of total traffic at 12 major ports.

2 4 | P a g e
Exhibit 34: Capacity and Traffic handled at 12 major ports
0
100
200
300
400
500
600
FY02 FY03 FY04 FY05 FY06 FY07 FY08
Mill
ion
Tonn
es P
er A
nnum
Gap between capacity & traffic handled Traffic handled
Source: IPA, ICICIdirect.com Research
Exhibit 35: Capacity details Indian Ports in FY08
Total Cargo Handled 704 mt YoY Gr of 11.9%12 Major Ports 519 mt189 Minor Ports 185 mtCurrent Capacity 765 mt Capacity Utilisation 92%Planned Capacity addition 1,575 mt 19.8% CAGR by FY12 Source: Mundra port, ICICIdirect.com Research
Mt – Million tonnes
Exhibit 33: Growth in world's busiest container port v/s growth in India's busiest container port
7.18.76.9
12.713.0
23.723.1
-2.6-5
0
5
10
15
20
25
30
2005 2006 2007 2008
% Growth in Singapore port traffic % Growth in JNPT traffic
Source: Containerization International, IPA, ICICIdirect.com Research

2 5 | P a g e
Exhibit 36: Volumes handled at 12 major ports
0
100
200
300
400
500
FY90
FY91
FY92
FY93
FY94
FY95
FY96
FY97
FY98
FY99
FY00
FY01
FY02
FY03
FY04
FY05
FY06
FY07
FY08
FY09
Carg
o M
ix (M
n To
nnes
)
Liquid Bulk Containerised Others
7.7% CAGR in past 10 years
Source: IPA, ICICIdirect.com Research
Exhibit 37: Proportion of Containerized cargo
36.6 37.0 36.4 32.5 33.1
37.1 36.0 34.633.4 34.6
14.3 14.6 15.8 17.7 17.6
12.1 12.4 13.2 16.4 14.7
0102030405060708090
100
FY05
FY06
FY07
FY08
FY09
Carg
o M
ix (%
)
Liquid Bulk Containerised Others
Source: IPA, ICICIdirect.com Research
Exhibit 38: Movement of exim cargo within India in FY09
Source: IPA, Company, ICICIdirect.com Research
Exim traffic at 12 major Indian ports
Liquid cargo 33.1 %
Bulk cargo 34.6 %
Containerized cargo 17.6 %
Others 14.7 %
Road Transport 68 %
Rail Transport 32 %
CONCOR 85 %
Private Players 15 %

2 6 | P a g e
Exhibit 39: Salient Features of DRFC
These corridors will greatly improve the freight transportation across India leading to faster development of the country.
Exclusively for running freight trains at speed upto 100 kmph Ensure guaranteed transit time thus provide quicker and reliable
service Accelerated industrial development in the region around the DRFC Improving the moving dimensions for the use of double stack
containers. Presently single stack containers are used Increasing the train length from 700 meters to 1500 meters Increasing the train load capacity from 4000 ton to 15000 ton Both corridors will be constructed simultaneously. The corridors
are expected to be fully operational over their entire length by 2017. The following table indicates the tentative schedule of construction:- Western Corridor (WDFC) Route Approx. distance (Kms) YearPhase I Rewari - Vadodara 920 2009- 2016Phase II Vadodara - JNPT 430 2010-2017Phase III Rewari - Dadri 140 2010-2017Eastern Corridor (EDFC) Route Approx. distance (Kms) YearPhase Ia Sonnagar - Mugalsarai 127 2009-2016Phase Ib Mughalsarai - Khurja 744 2010-2016Phase II Khurja - Ludhiana 426 2011-2017
The project cost for constructing both the corridors is estimated
around Rs 40,000 crore. WDFC will be funded partly by a loan raised from Government of
Japan and partly through equity infusion by Ministry of Railways in the ratio of 2:1 respectively.
EDFC will be funded partly by a loan raised from World Bank and Asian Development Bank and partly through equity infusion by Ministry of Railways.
Work has started on Sonnagar – Mughalsarai section – EDFC
Source: DFCCIL

2 7 | P a g e
Dwell time Number of days the containers stay at the ICD /CFS is known as dwell time. The inventory of containers at various ICDs had gone up in FY09. The clearance of imports had become sluggish due to liquidity problems being faced by importers. At the same time, the demand for empty containers for stuffing of export cargoes had come down due to the problems faced by exporters. Consequently, dwell time had increased in FY09. This has increased the ground rent income by 44.5% YoY. So initially during slowdown realizations are high, which cushions the loss faced due to falling volumes.

2 8 | P a g e
RATING RATIONALE ICICIdirect endeavours to provide objective opinions and recommendations. ICICIdirect assigns ratings to its stocks according to their notional target price vs current market price and then categorises them as Outperformer, Performer, Hold, and Underperformer. The performance horizon is 2 years unless specified and the notional target price is defined as the analysts' valuation for a stock. Outperformer: 20% or more; Performer: Between 10% and 20%; Hold: +10% return; UnderPerformer: -10% or more; Pankaj Pandey Head – Research [email protected]
ICICIdirect Research Desk, ICICI Securities Limited, 7th Floor, Akruti Centre Point, MIDC Main Road, Marol Naka, Andheri (E)
Mumbai – 400 093
ANALYST CERTIFICATION We /I, Supriya Khedkar PGDBM, B.Com Rajni Mahadevan MBA, B.Com research analysts, authors and the names subscribed to this report, hereby certify that all of the views expressed in this research report accurately reflect our personal views about any and all of the subject issuer(s) or securities. We also certify that no part of our compensation was, is, or will be directly or indirectly related to the specific recommendation(s) or view(s) in this report. Analysts aren't registered as research analysts by FINRA and might not be an associated person of the ICICI Securities Inc.
Disclosures: ICICI Securities Limited (ICICI Securities) and its affiliates are a full-service, integrated investment banking, investment management and brokerage and financing group. We along with affiliates are leading underwriter of securities and participate in virtually all securities trading markets in India. We and our affiliates have investment banking and other business relationship with a significant percentage of companies covered by our Investment Research Department. Our research professionals provide important input into our investment banking and other business selection processes. ICICI Securities generally prohibits its analysts, persons reporting to analysts and their dependent family members from maintaining a financial interest in the securities or derivatives of any companies that the analysts cover.
The information and opinions in this report have been prepared by ICICI Securities and are subject to change without any notice. The report and information contained herein is strictly confidential and meant solely for the selected recipient and may not be altered in any way, transmitted to, copied or distributed, in part or in whole, to any other person or to the media or reproduced in any form, without prior written consent of ICICI Securities. While we would endeavour to update the information herein on reasonable basis, ICICI Securities, its subsidiaries and associated companies, their directors and employees (“ICICI Securities and affiliates”) are under no obligation to update or keep the information current. Also, there may be regulatory, compliance or other reasons that may prevent ICICI Securities from doing so. Non-rated securities indicate that rating on a particular security has been suspended temporarily and such suspension is in compliance with applicable regulations and/or ICICI Securities policies, in circumstances where ICICI Securities is acting in an advisory capacity to this company, or in certain other circumstances.
This report is based on information obtained from public sources and sources believed to be reliable, but no independent verification has been made nor is its accuracy or completeness guaranteed. This report and information herein is solely for informational purpose and may not be used or considered as an offer document or solicitation of offer to buy or sell or subscribe for securities or other financial instruments. Though disseminated to all the customers simultaneously, not all customers may receive this report at the same time. ICICI Securities will not treat recipients as customers by virtue of their receiving this report. Nothing in this report constitutes investment, legal, accounting and tax advice or a representation that any investment or strategy is suitable or appropriate to your specific circumstances. The securities discussed and opinions expressed in this report may not be suitable for all investors, who must make their own investment decisions, based on their own investment objectives, financial positions and needs of specific recipient. This may not be taken in substitution for the exercise of independent judgment by any recipient. The recipient should independently evaluate the investment risks. The value and return of investment may vary because of changes in interest rates, foreign exchange rates or any other reason. ICICI Securities and affiliates accept no liabilities for any loss or damage of any kind arising out of the use of this report. Past performance is not necessarily a guide to future performance. Investors are advised to see Risk Disclosure Document to understand the risks associated before investing in the securities markets. Actual results may differ materially from those set forth in projections. Forward-looking statements are not predictions and may be subject to change without notice.
ICICI Securities and its affiliates might have managed or co-managed a public offering for the subject company in the preceding twelve months. ICICI Securities and affiliates might have received compensation from the companies mentioned in the report during the period preceding twelve months from the date of this report for services in respect of public offerings, corporate finance, investment banking or other advisory services in a merger or specific transaction. ICICI Securities and affiliates expect to receive compensation from the companies mentioned in the report within a period of three months following the date of publication of the research report for services in respect of public offerings, corporate finance, investment banking or other advisory services in a merger or specific transaction. It is confirmed that , Supriya Khedkar PGDBM, B.Com Rajni Mahadevan MBA, B.Com research analysts and the authors of this report have not received any compensation from the companies mentioned in the report in the preceding twelve months. Our research professionals are paid in part based on the profitability of ICICI Securities, which include earnings from Investment Banking and other business.
ICICI Securities or its subsidiaries collectively do not own 1% or more of the equity securities of the Company mentioned in the report as of the last day of the month preceding the publication of the research report.
It is confirmed that , Supriya Khedkar PGDBM, B.Com,Rajni Mahadevan MBA, B.Com research analysts and the authors of this report or any of their family members does not serve as an officer, director or advisory board member of the companies mentioned in the report.
ICICI Securities may have issued other reports that are inconsistent with and reach different conclusion from the information presented in this report. ICICI Securities and affiliates may act upon or make use of information contained in the report prior to the publication thereof.
This report is not directed or intended for distribution to, or use by, any person or entity who is a citizen or resident of or located in any locality, state, country or other jurisdiction, where such distribution, publication, availability or use would be contrary to law, regulation or which would subject ICICI Securities and affiliates to any registration or licensing requirement within such jurisdiction. The securities described herein may or may not be eligible for sale in all jurisdictions or to certain category of investors. Persons in whose possession this document may come are required to inform themselves of and to observe such restriction.
This report has not been prepared by ICICI Securities, Inc. However, ICICI Securities, Inc. has reviewed the report and, in so far as it includes current or historical information, it is believed to be reliable, although its accuracy and completeness cannot be guaranteed.