Embed Size (px)
Citation preview

RR 18-01
Dennis WestProfessor, Department of Plant Sciences
David KincerResearch Associate, Department of Plant Sciences Ryan BlairUT Extension Area Grains and Cotton Specialist
Tyson Raper Assistant Professor, UT Extension Cotton and Wheat Specialist
Agronomic Crop Variety Testing and Demonstrations, Department of Plant Sciences UT Institute of Agriculture
Telephone: 865-974-8821 • Fax: 865-974-1947 Email: [email protected]
Variety test results are posted online at varietytrials.tennessee.edu, utcrops.com, and extension.tennessee.edu/publications
Wheat Variety Performance Tests in Tennessee 2017
1
Acknowledgments
This research was funded by UT AgResearch and UT Extension with partial funding from participating companies.
We gratefully acknowledge the assistance of the following individuals in conducting these experiments:
AgResearch and Education Centers: East Tennessee AgResearch and Education Center, Knoxville Robert Simpson, Center Director BJ DeLozier, Farm Manager, Plant Sciences Unit Derick Hopkins, Agricultural Service Supervisor
Plateau AgResearch and Education Center, Crossville Walt Hitch, Center Director Greg Blaylock, Light Farm Equipment Operator Sam Simmons, Light Farm Equipment Operator
Highland Rim AgResearch and Education Center, Springfield Robert Ellis, Center Director Brad S. Fisher, Research Associate
AgResearch and Education Center at Milan, Milan Blake Brown, Center Director Jason Williams, Research Associate James McClure, Research Associate Chris Bridges, Research Associate
West Tennessee AgResearch and Education Center, Jackson Robert Hayes, Center Director Randi Dunagan, Research Associate
Agricenter International, Memphis Bruce Kirksey, Director

2
County Standard Wheat Test:
Coordinator: Ryan Blair, Extension Area Specialist, Grain Crops
Chester County Steve Rickman, Extension Agent Frank Van Nes Farm
Dyer County Tim Campbell, Extension Director Alan/Keith Sims Farm
Fayette County Jeff Via, Extension Agent Ames Plantation
Franklin County Ed Burns, Extension Agent Myron/David Denton Farm Bobby Woodall Farm
Gibson County Philip Shelby, Extension Director Andrew Steele Farm
Henry County Ranson Goodman, Extension Agent Edwin and Brenda Ables Farm
Lake County Greg Allen, Extension Director Jon Dickey Farm
Madison County Jake Mallard, Extension Agent Matt Griggs Farm
Moore County Larry Moorehead, Extension Director Jerry Ray Farm
Weakley County Jeff Lannom, Extension Director Gary Hall Farm
3
Table of Contents
page
General Information…………………………………………………………………………………... 4
Interpretation of Data…………………………………………………………………………………. 5
Wheat Tests Results ................................................................................................................5
Location information from AgResearch and Education Centers (REC) where the Wheat Variety
Tests were Conducted in 2015-2016……………………………………………………………… 6
AgResearch and Education Center Wheat Performance Data 2016…………………..……… 7
County Standard (CST) Wheat Performance Data 2016 .......................................................... 13
Combined REC & CST Wheat Performance Data 2016 ........................................................... 14
Two-year AgResearch and Education Center Wheat Performance Data 2015 - 2016……... 15
Three-year AgResearch and Education Center Wheat Performance Data 2014 - 2016….….. 17
Seed Company Contact Information………………………………………………………………...19
4
General Information
AgResearch and Education Center Tests: The 2016-17 variety performance tests were conducted on 69 soft red winter wheat varieties in each of the physiographic regions of the state. Tests were conducted at the East TN (Knoxville), Plateau (Crossville), Highland Rim (Springfield), Milan (Milan), and West TN (Jackson) AgResearch and Education Centers (REC). A test at the Agricenter in Memphis was lost due to damage from deer.
All varieties were seeded at rates of 35 seed per square foot (1.5 million seed per acre) (Table 1). Plots were seeded with drills using 7–7.5 inch row spacing. The plot size was six, seven, nine or ten rows, 20 to 25 feet in length depending on location equipment. Plots were replicated three times at each location. Seed of all varieties were treated with a fungicide. County Standard Tests: The County Standard Wheat Test was conducted on 26 soft red winter wheat varieties across ten counties in Middle and West Tennessee (Chester, Dyer, Fayette, Franklin, Gibson, Henry, Lake, Madison, Moore, and Weakley). Each variety was evaluated in a large strip-plot at each location, thus each county test was considered as one replication of the test in calculating the overall average yield and in conducting the statistical analysis to determine significant differences. At each location, plots were planted, sprayed, fertilized, and harvested with the equipment used by the cooperating producer in their farming operation. The width and length of strip-plots were different in each county; however, within a location in a county, the strips were trimmed so that the lengths were the same for each variety, or if the lengths were different then the harvested length was measured for each variety and appropriate harvested area adjustments were made to determine the yield per acre.
Growing Season: Planting of the winter wheat crop proceeded in a timely manner in 2016 at all locations except Knoxville. Planting at Knoxville was delayed due to extremely dry fall conditions. The growing season was normal for winter wheat and the crop progressed in a timely manner up to harvest. Disease pressure was light across most of Tennessee, with leaf blight caused by Septoria tritici being the most widespread problem.
According to the Tennessee Agricultural Statistics Service (TASS), Estimated state yield average is 72 bu/a in 2017. Tennessee producers planted approximately 380,000 acres of wheat in the fall of 2016. Approximately 285,000 acres are estimated to be harvested for grain. According to TASS, the total wheat production in Tennessee for 2017 is projected to be 20.5 million bushels, a decrease of 26 percent from 2016 production.
5
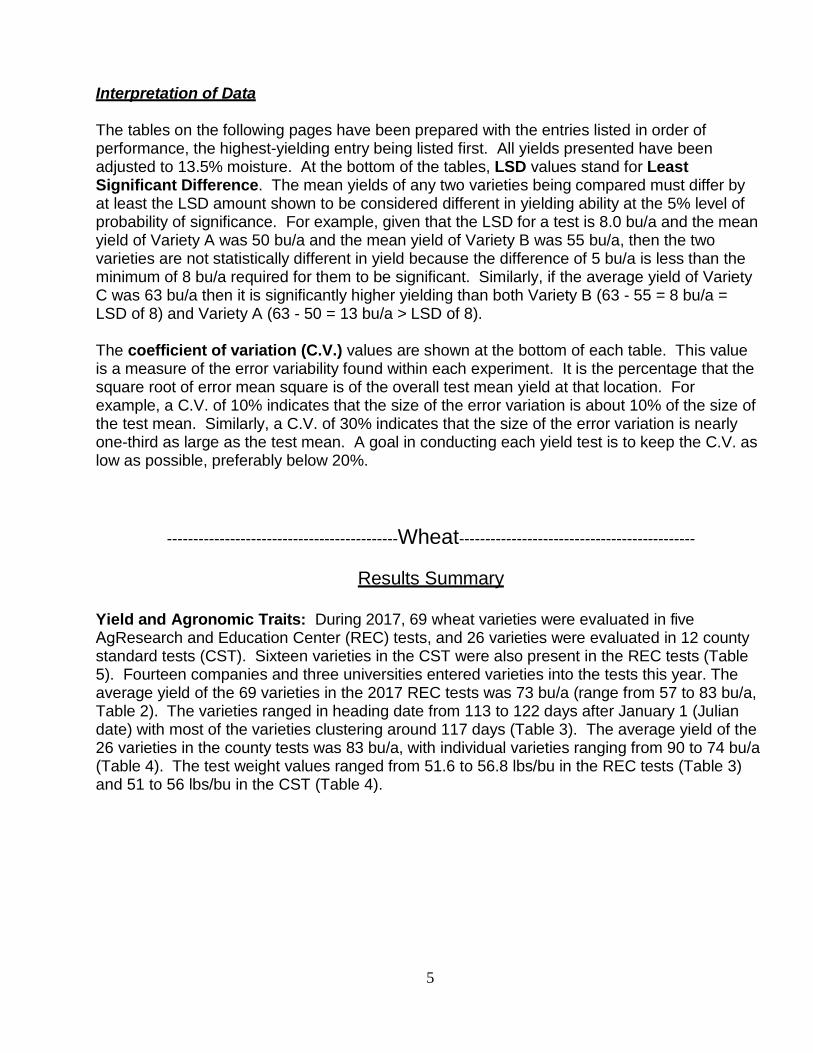
Interpretation of Data
The tables on the following pages have been prepared with the entries listed in order of performance, the highest-yielding entry being listed first. All yields presented have been adjusted to 13.5% moisture. At the bottom of the tables, LSD values stand for Least Significant Difference. The mean yields of any two varieties being compared must differ by at least the LSD amount shown to be considered different in yielding ability at the 5% level of probability of significance. For example, given that the LSD for a test is 8.0 bu/a and the mean yield of Variety A was 50 bu/a and the mean yield of Variety B was 55 bu/a, then the two varieties are not statistically different in yield because the difference of 5 bu/a is less than the minimum of 8 bu/a required for them to be significant. Similarly, if the average yield of Variety C was 63 bu/a then it is significantly higher yielding than both Variety B (63 - 55 = 8 bu/a = LSD of 8) and Variety A (63 - 50 = 13 bu/a > LSD of 8).
The coefficient of variation (C.V.) values are shown at the bottom of each table. This value is a measure of the error variability found within each experiment. It is the percentage that the square root of error mean square is of the overall test mean yield at that location. For example, a C.V. of 10% indicates that the size of the error variation is about 10% of the size of the test mean. Similarly, a C.V. of 30% indicates that the size of the error variation is nearly one-third as large as the test mean. A goal in conducting each yield test is to keep the C.V. as low as possible, preferably below 20%.
--------------------------------------------Wheat---------------------------------------------
Results Summary
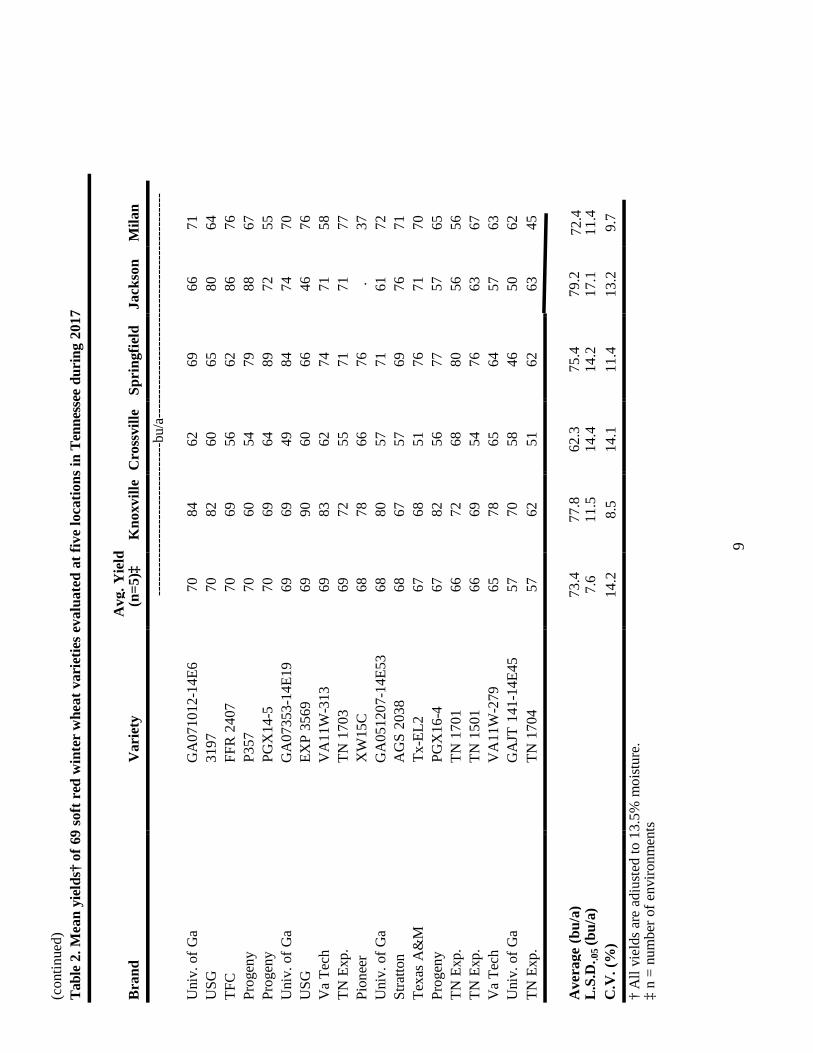
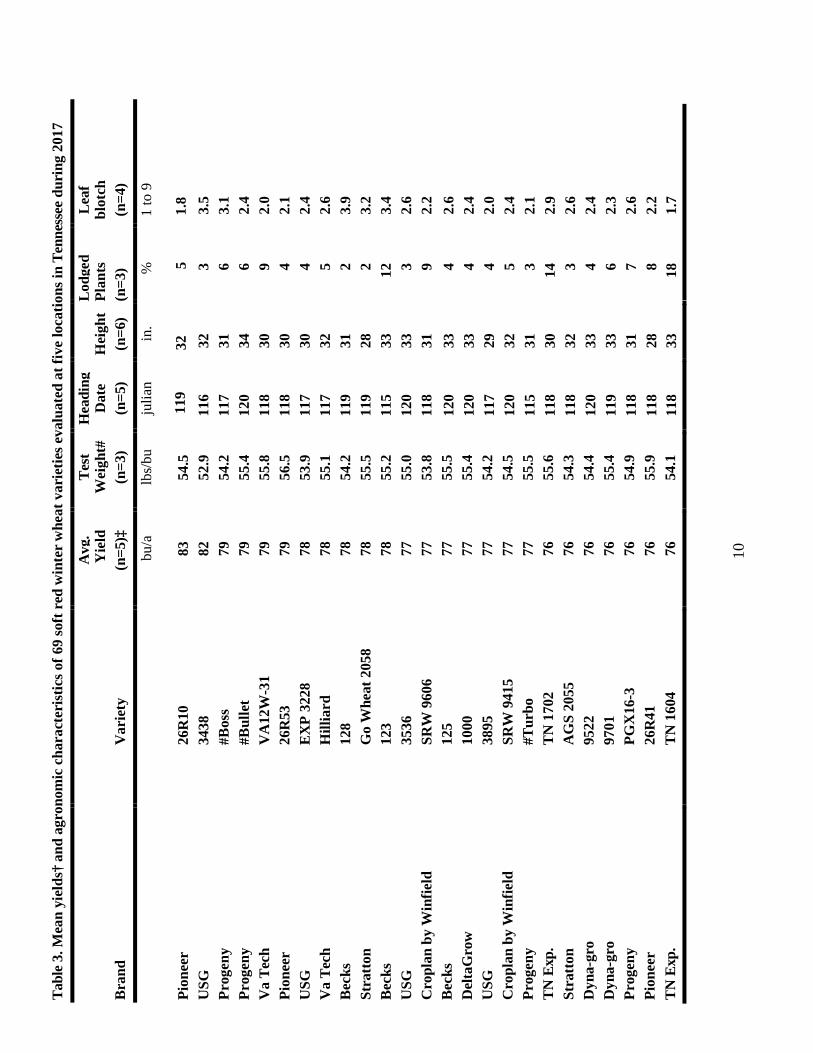
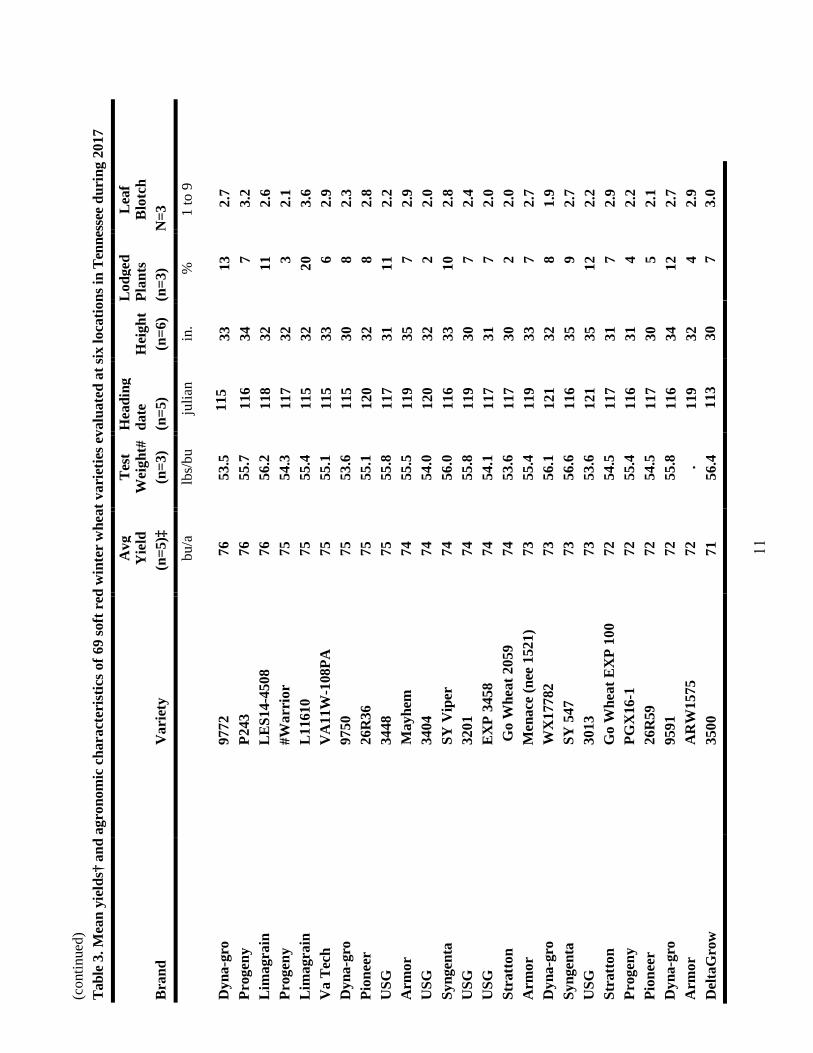
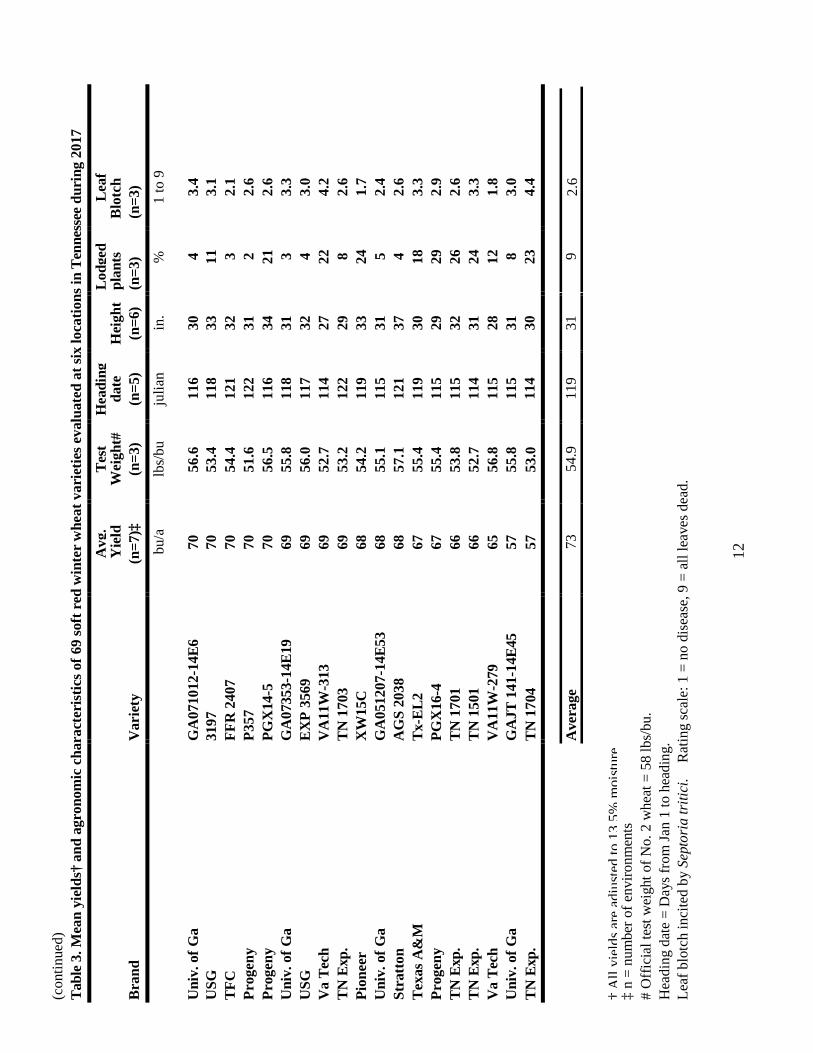
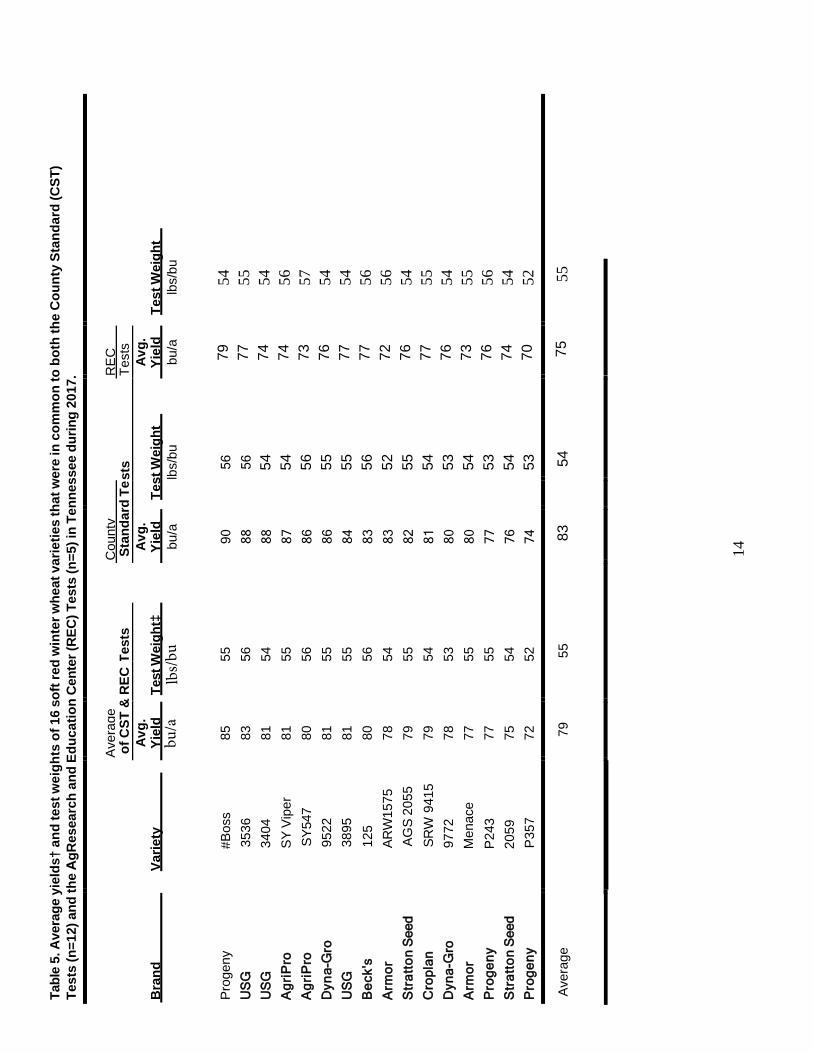
Yield and Agronomic Traits: During 2017, 69 wheat varieties were evaluated in five AgResearch and Education Center (REC) tests, and 26 varieties were evaluated in 12 county standard tests (CST). Sixteen varieties in the CST were also present in the REC tests (Table 5). Fourteen companies and three universities entered varieties into the tests this year. The average yield of the 69 varieties in the 2017 REC tests was 73 bu/a (range from 57 to 83 bu/a, Table 2). The varieties ranged in heading date from 113 to 122 days after January 1 (Julian date) with most of the varieties clustering around 117 days (Table 3). The average yield of the 26 varieties in the county tests was 83 bu/a, with individual varieties ranging from 90 to 74 bu/a (Table 4). The test weight values ranged from 51.6 to 56.8 lbs/bu in the REC tests (Table 3) and 51 to 56 lbs/bu in the CST (Table 4).
6
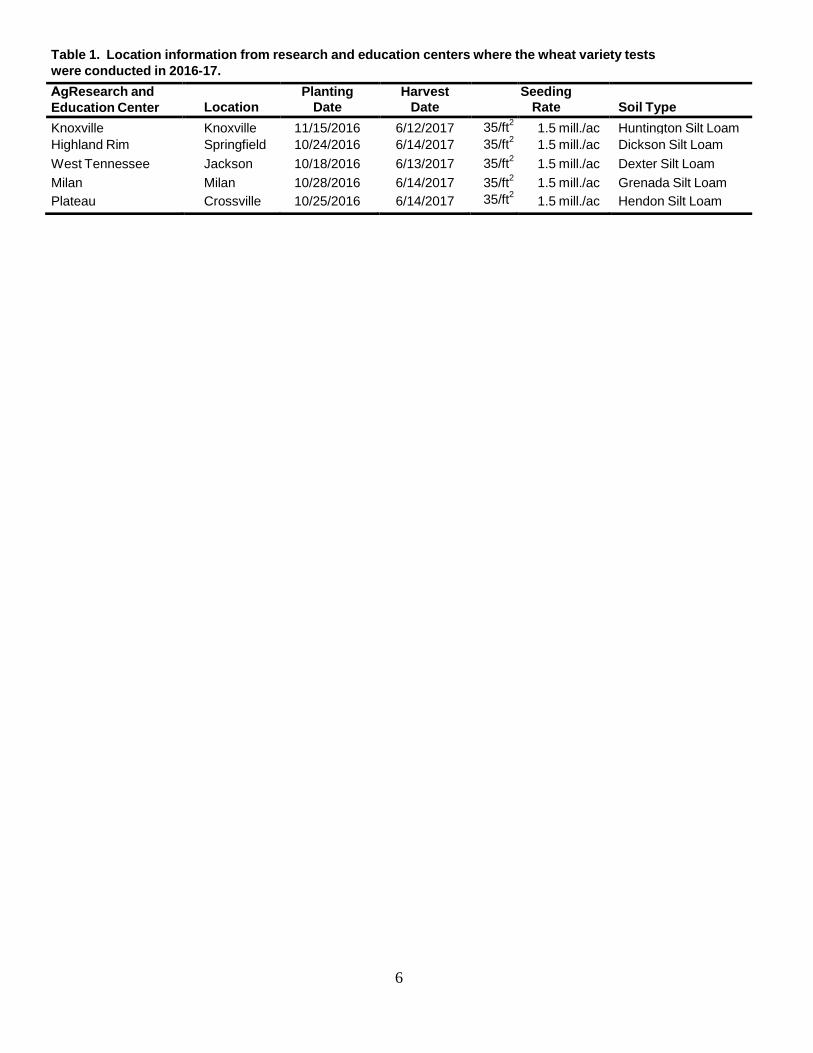
Table 1. Location information from research and education centers where the wheat variety tests were conducted in 2016-17. AgResearch and Education Center Location
Planting Date
Harvest Date
Seeding Rate Soil Type
Knoxville Knoxville 11/15/2016 6/12/2017 35/ft2 1.5 mill./ac Huntington Silt LoamHighland Rim Springfield 10/24/2016 6/14/2017 35/ft2 1.5 mill./ac Dickson Silt Loam West Tennessee Jackson 10/18/2016 6/13/2017 35/ft2 1.5 mill./ac Dexter Silt Loam Milan Milan 10/28/2016 6/14/2017 35/ft2 1.5 mill./ac Grenada Silt Loam Plateau Crossville 10/25/2016 6/14/2017 35/ft2 1.5 mill./ac Hendon Silt Loam

7
Tabl
e 2.
Mea
n yi
elds
† of
69
soft
red
win
ter
whe
at v
arie
ties
eval
uate
d at
five
loca
tions
in T
enne
ssee
dur
ing
2017
Avg
. Yie
ld
Bra
nd
Var
iety
(n
=5)‡
K
noxv
ille
Cro
ssvi
lle
Spri
ngfie
ld
Jack
son
Mila
n ---
------
------
------
------
------
-bu/
a----
------
------
---------------
------
------
---
Pion
eer
26R
10
83
77
72
85
98
83
USG
34
38
82
89
72
81
87
80
Prog
eny
#Bos
s 79
77
63
81
94
82
Pr
ogen
y #B
ulle
t 79
78
66
87
90
73
V
a Te
ch
VA
12W
-31
79
80
70
80
86
77
Pion
eer
26R
53
79
76
69
79
88
81
USG
EX
P 32
28
78
97
66
78
80
71
Va
Tech
H
illia
rd
78
82
64
78
89
79
Bec
ks
128
78
66
61
79
102
82
Stra
tton
Go
Whe
at 2
058
78
82
69
70
84
85
Bec
ks
123
78
87
64
71
87
79
USG
35
36
77
85
66
73
84
77
Cro
plan
by
Win
field
SR
W 9
606
77
76
61
81
87
81
Bec
ks
125
77
81
68
71
88
78
Del
taG
row
10
00
77
74
63
77
101
71
USG
38
95
77
75
70
72
93
73
Cro
plan
by
Win
field
SR
W 9
415
77
67
63
78
90
85
Prog
eny
#Tur
bo
77
103
73
68
76
64
TN E
xp.
TN 1
702
76
73
67
85
81
76
Stra
tton
AG
S 20
55
76
78
65
71
91
77
Dyn
a-gr
o 95
22
76
68
60
83
89
82
Dyn
a-gr
o 97
01
76
79
62
79
86
75
Prog
eny
PGX
16-3
76
75
61
76
90
79
Pi
onee
r 26
R41
76
74
66
80
84
76
TN
Exp
. TN
160
4 76
68
71
99
73
68

8
(con
tinue
d)
Tabl
e 2.
Mea
n yi
elds
† of
69
soft
red
win
ter
whe
at v
arie
ties
eval
uate
d at
five
loca
tions
in T
enne
ssee
dur
ing
2017
Avg
. Yie
ld
Bra
nd
Var
iety
(n
=5)‡
K
noxv
ille
Cro
ssvi
lle
Spri
ngfie
ld
Jack
son
Mila
n ---
------
------
------
------
------
-bu/
a----
------
------
------
---------------
------
Dyn
a-gr
o 97
72
76
86
63
84
75
72
Prog
eny
P243
76
85
61
75
76
82
Li
mag
rain
LE
S14-
4508
76
75
70
71
86
76
Pr
ogen
y #W
arrio
r 75
85
64
75
74
76
Li
mag
rain
L1
1610
75
83
64
73
81
75
V
a Te
ch
VA
11W
-108
PA
75
82
61
82
77
74
Dyn
a-gr
o 97
50
75
97
72
69
63
74
Pion
eer
26R
36
75
76
49
72
95
84
USG
34
48
75
80
59
70
87
79
Arm
or
May
hem
74
80
66
75
87
66
U
SG
3404
74
71
63
79
81
77
Sy
ngen
ta
SY V
iper
74
82
62
81
72
69
U
SG
3201
74
73
59
71
93
76
U
SG
EXP
3458
74
80
70
83
56
74
St
ratto
n G
o W
heat
205
9 74
10
0 62
70
79
59
A
rmor
M
enac
e 73
77
60
66
89
72
D
yna-
gro
WX
1778
2 73
71
59
78
.
79
Syng
enta
SY
547
73
87
70
79
64
65
U
SG
3013
73
69
58
82
78
77
St
ratto
n G
o W
heat
EX
P 10
0 72
75
50
74
92
71
Pr
ogen
y PG
X16
-1
72
86
65
80
62
67
Pion
eer
26R
59
72
62
71
77
72
78
Dyn
a-gr
o 95
91
72
77
61
74
84
65
Arm
or
AR
W15
75
72
92
49
73
72
75
Del
taG
row
35
00
71
66
61
73
81
72
9
(con
tinue
d)
Tabl
e 2.
Mea
n yi
elds
† of
69
soft
red
win
ter
whe
at v
arie
ties
eval
uate
d at
five
loca
tions
in T
enne
ssee
dur
ing
2017
Avg
. Yie
ld
Bra
nd
Var
iety
(n
=5)‡
K
noxv
ille
Cro
ssvi
lle
Spri
ngfie
ld
Jack
son
Mila
n ---
------
------
------
------
-----b
u/a-
------
------
------
------
------
------
------
----
Uni
v. o
f Ga
GA
0710
12-1
4E6
70
84
62
69
66
71
USG
31
97
70
82
60
65
80
64
TFC
FFR
240
7 70
69
56
62
86
76
Pr
ogen
y P3
57
70
60
54
79
88
67
Prog
eny
PGX
14-5
70
69
64
89
72
55
U
niv.
of G
a G
A07
353-
14E1
9 69
69
49
84
74
70
U
SG
EXP
3569
69
90
60
66
46
76
V
a Te
ch
VA
11W
-313
69
83
62
74
71
58
TN
Exp
. TN
170
3 69
72
55
71
71
77
Pi
onee
r X
W15
C
68
78
66
76
. 37
U
niv.
of G
a G
A05
1207
-14E
53
68
80
57
71
61
72
Stra
tton
AG
S 20
38
68
67
57
69
76
71
Texa
s A
&M
Tx
-EL2
67
68
51
76
71
70
Pr
ogen
y PG
X16
-4
67
82
56
77
57
65
TN E
xp.
TN 1
701
66
72
68
80
56
56
TN E
xp.
TN 1
501
66
69
54
76
63
67
Va
Tech
V
A11
W-2
79
65
78
65
64
57
63
Uni
v. o
f Ga
GA
JT 1
41-1
4E45
57
70
58
46
50
62
TN
Exp
. TN
170
4 57
62
51
62
63
45
Ave
rage
(bu/
a)
73.4
77
.8
62.3
75
.4
79.2
72
.4
L.S
.D. .0
5 (b
u/a)
7.
6 11
.5
14.4
14
.2
17.1
11
.4
C.V
. (%
) 14
.2
8.5
14.1
11
.4
13.2
9.
7 †
All
yiel
ds a
re a
djus
ted
to 1
3.5%
moi
sture
.‡
n =
num
ber o
f env
ironm
ents
10
Tabl
e 3.
Mea
n yi
elds
† an
d ag
rono
mic
cha
ract
eris
tics o
f 69
soft
red
win
ter w
heat
var
ietie
s eva
luat
ed a
t fiv
e lo
catio
ns in
Ten
ness
ee d
urin
g 20
17
Avg
. T
est
Hea
ding
L
odge
d L
eaf
Yie
ld
Wei
ght#
D
ate
Hei
ght
Plan
ts
blot
ch
Bra
nd
Var
iety
(n
=5)‡
(n
=3)
(n=5
) (n
=6)
(n=3
) (n
=4)
bu/a
lb
s/bu
ju
lian
in.
%
1 to
9
Pion
eer
26R
10
83
54.5
11
9 32
5
1.8
USG
34
38
82
52.9
11
6 32
3
3.5
Prog
eny
#Bos
s 79
54
.2
117
31
6 3.
1 Pr
ogen
y #B
ulle
t 79
55
.4
120
34
6 2.
4 V
a Te
ch
VA
12W
-31
79
55.8
11
8 30
9
2.0
Pion
eer
26R
53
79
56.5
11
8 30
4
2.1
USG
E
XP
3228
78
53
.9
117
30
4 2.
4 V
a Te
ch
Hill
iard
78
55
.1
117
32
5 2.
6 B
ecks
12
8 78
54
.2
119
31
2 3.
9 St
ratt
on
Go
Whe
at 2
058
78
55.5
11
9 28
2
3.2
Bec
ks
123
78
55.2
11
5 33
12
3.
4 U
SG
3536
77
55
.0
120
33
3 2.
6 C
ropl
an b
y W
infie
ld
SRW
960
6 77
53
.8
118
31
9 2.
2 B
ecks
12
5 77
55
.5
120
33
4 2.
6 D
elta
Gro
w
1000
77
55
.4
120
33
4 2.
4 U
SG
3895
77
54
.2
117
29
4 2.
0 C
ropl
an b
y W
infie
ld
SRW
941
5 77
54
.5
120
32
5 2.
4 Pr
ogen
y #T
urbo
77
55
.5
115
31
3 2.
1 T
N E
xp.
TN
170
2 76
55
.6
118
30
14
2.9
Stra
tton
A
GS
2055
76
54
.3
118
32
3 2.
6 D
yna-
gro
9522
76
54
.4
120
33
4 2.
4 D
yna-
gro
9701
76
55
.4
119
33
6 2.
3 Pr
ogen
y PG
X16
-3
76
54.9
11
8 31
7
2.6
Pion
eer
26R
41
76
55.9
11
8 28
8
2.2
TN
Exp
. T
N 1
604
76
54.1
11
8 33
18
1.
7
11
(con
tinue
d)
Tabl
e 3.
Mea
n yi
elds
† an
d ag
rono
mic
cha
ract
eris
tics o
f 69
soft
red
win
ter w
heat
var
ietie
s eva
luat
ed a
t six
loca
tions
in T
enne
ssee
dur
ing
2017
Avg
T
est
Hea
ding
L
odge
d L
eaf
Yie
ld
Wei
ght#
dat
e H
eigh
t Pl
ants
B
lotc
h B
rand
V
arie
ty
(n=5
)‡
(n=3
) (n
=5)
(n=6
) (n
=3)
N=3
bu
/a
lbs/
bu
julia
n in
. %
1
to 9
Dyn
a-gr
o 97
72
76
53.5
11
5 33
13
2.
7 Pr
ogen
y P2
43
76
55.7
11
6 34
7
3.2
Lim
agra
in
LE
S14-
4508
76
56
.2
118
32
11
2.6
Prog
eny
#War
rior
75
54
.3
117
32
3 2.
1 L
imag
rain
L
1161
0 75
55
.4
115
32
20
3.6
Va
Tech
V
A11
W-1
08PA
75
55
.1
115
33
6 2.
9 D
yna-
gro
9750
75
53
.6
115
30
8 2.
3 Pi
onee
r 26
R36
75
55
.1
120
32
8 2.
8 U
SG
3448
75
55
.8
117
31
11
2.2
Arm
or
May
hem
74
55
.5
119
35
7 2.
9 U
SG
3404
74
54
.0
120
32
2 2.
0 Sy
ngen
ta
SY V
iper
74
56
.0
116
33
10
2.8
USG
32
01
74
55.8
11
9 30
7
2.4
USG
E
XP
3458
74
54
.1
117
31
7 2.
0 St
ratt
on
Go
Whe
at 2
059
74
53.6
11
7 30
2
2.0
Arm
or
Men
ace
(nee
152
1)
73
55.4
11
9 33
7
2.7
Dyn
a-gr
o W
X17
782
73
56.1
12
1 32
8
1.9
Syng
enta
SY
547
73
56
.6
116
35
9 2.
7 U
SG
3013
73
53
.6
121
35
12
2.2
Stra
tton
G
o W
heat
EX
P 10
0 72
54
.5
117
31
7 2.
9 Pr
ogen
y PG
X16
-1
72
55.4
11
6 31
4
2.2
Pion
eer
26R
59
72
54.5
11
7 30
5
2.1
Dyn
a-gr
o 95
91
72
55.8
11
6 34
12
2.
7 A
rmor
A
RW
1575
72
.
119
32
4 2.
9 D
elta
Gro
w
3500
71
56
.4
113
30
7 3.
0
12
(con
tinue
d)
Tabl
e 3.
Mea
n yi
elds
† an
d ag
rono
mic
cha
ract
eris
tics o
f 69
soft
red
win
ter w
heat
var
ietie
s eva
luat
ed a
t six
loca
tions
in T
enne
ssee
dur
ing
2017
A
vg.
Tes
tH
eadi
ngL
odge
dL
eaf
Yie
ld
Wei
ght#
da
te
Hei
ght
plan
ts
Blo
tch
Bra
nd
Var
iety
(n
=7)‡
(n
=3)
(n=5
) (n
=6)
(n=3
) (n
=3)
bu/a
lb
s/bu
ju
lian
in.
%
1 to
9
Uni
v. o
f Ga
GA
0710
12-1
4E6
70
56.6
11
6 30
4
3.4
USG
31
97
70
53.4
11
8 33
11
3.
1 T
FC
FFR
240
7 70
54
.4
121
32
3 2.
1 Pr
ogen
y P3
57
70
51.6
12
2 31
2
2.6
Prog
eny
PGX
14-5
70
56
.5
116
34
21
2.6
Uni
v. o
f Ga
GA
0735
3-14
E19
69
55
.8
118
31
3 3.
3 U
SG
EX
P 35
69
69
56.0
11
7 32
4
3.0
Va
Tech
V
A11
W-3
13
69
52.7
11
4 27
22
4.
2 T
N E
xp.
TN
170
3 69
53
.2
122
29
8 2.
6 Pi
onee
r X
W15
C
68
54.2
11
9 33
24
1.
7 U
niv.
of G
a G
A05
1207
-14E
53
68
55.1
11
5 31
5
2.4
Stra
tton
A
GS
2038
68
57
.1
121
37
4 2.
6 T
exas
A&
M
Tx-E
L2
67
55.4
11
9 30
18
3.
3 Pr
ogen
y PG
X16
-4
67
55.4
11
5 29
29
2.
9 T
N E
xp.
TN
170
1 66
53
.8
115
32
26
2.6
TN
Exp
. T
N 1
501
66
52.7
11
4 31
24
3.
3 V
a Te
ch
VA
11W
-279
65
56
.8
115
28
12
1.8
Uni
v. o
f Ga
GA
JT 1
41-1
4E45
57
55
.8
115
31
8 3.
0 T
N E
xp.
TN
170
4 57
53
.0
114
30
23
4.4
Ave
rage
73
54
.9
119
31
9 2.
6
† A
ll yi
elds
are
adj
uste
d to
13.
5% m
oistu
re.
‡ n
= nu
mbe
r of e
nviro
nmen
ts
# O
ffic
ial t
est w
eigh
t of N
o. 2
whe
at =
58
lbs/
bu.
Hea
ding
dat
e =
Day
s fro
m Ja
n 1
to h
eadi
ng.
Leaf
blo
tch
inci
ted
by S
epto
ria
triti
ci.
Rat
ing
scal
e: 1
= n
o di
seas
e, 9
= a
ll le
aves
dea
d.

13
Tab
le 4
. Yi
elds
† of
26
soft
red
win
ter w
heat
var
ietie
s ev
alua
ted
in 1
1 C
ount
y St
anda
rd T
est i
n Te
nnes
see
durin
g 20
17.
AvgY
ld
MO
IST
TWT
Ches
ter
Dye
r Fa
yett
e Fr
ankl
in 1
5 Fr
ankl
in 7
.5
Gib
son
Henr
y La
ke
Mad
ison
Moo
re
Wea
kley
M
S Br
and/
Varie
ty
bu/a
%
lb
s/bu
11
/3
11/1
11/1
1 11
/21
11/1
0 11
/7
11/2
11/9
10/2
6 11
/2
10/1
8 A
Pro
geny
#B
oss
90.2
12.2
56
86
92
92
78
131
69
96
76
103
85
85
AB
US
G 3
536
87.7
12.9
56
80
94
85
83
122
70
90
63
98
93
89
AB
**U
SG
340
4 87
.6
12.9
54
89
96
91
70
133
61
82
76
104
88
74
AB
**W
arre
n S
eed
McK
ay 1
20
86.9
12.9
56
93
93
92
71
124
74
87
63
104
76
79
AB
C
Agr
iPro
SY
Vip
er
86.6
13.2
54
83
96
73
81
123
66
94
80
107
77
71
AB
CD
Agr
iPro
SY
547
86
.3
13.5
56
84
90
79
78
125
68
92
70
101
77
85
AB
CD
Arm
or M
ayhe
m
85.6
13.0
55
85
96
92
87
102
72
93
66
99
62
88
AB
CD
**D
yna-
Gro
952
2 85
.6
13.2
55
83
97
103
71
126
62
93
64
100
77
66
AB
CD
E
Cro
plan
SR
W 9
606
85.0
12.9
53
85
102
72
75
123
69
77
71
103
84
74
AB
CD
E
Dyn
a-G
ro 9
750
84.2
12.8
54
75
100
72
85
101
65
82
79
105
92
70
AB
CD
EF
*US
G 3
895
84.1
12.8
55
85
100
70
72
123
65
92
66
99
73
79
BC
DE
FG
Bec
k's
125
83.3
13.1
56
81
98
79
78
126
58
88
71
104
63
69
BC
DE
FG
War
ren
See
d M
cKen
na 3
15
83.1
12.5
53
80
95
83
70
115
57
81
61
103
92
78
BC
DE
FGH
Bec
k's
120
82.9
12.8
55
84
96
87
67
115
70
79
67
102
75
71
BC
DE
FGH
Arm
or A
RW
157
5 82
.7
13.2
52
79
95
64
69
113
66
98
73
97
76
82
BC
DE
FGH
Str
atto
n S
eed
AG
S 2
055
81.7
12.8
55
82
92
91
60
109
59
80
70
98
85
72
BC
DE
FGH
Cro
plan
SR
W 9
415
81.3
13.1
54
80
95
85
65
123
63
88
59
101
68
68
CD
EFG
HI
Dyn
a-G
ro 9
772
80.1
12.5
53
77
89
78
84
119
57
89
71
95
58
65
CD
EFG
HI
Arm
or M
enac
e 80
.1
13.5
54
81
94
82
66
114
74
68
71
94
77
62
DE
FGH
I U
SG
319
7 80
.0
13.0
53
74
92
82
77
105
67
82
72
102
77
52
EFG
HI
Dyn
a-G
ro 9
600
78.9
13.0
52
70
88
70
83
106
59
73
89
89
92
50
EFG
HI
Dyn
a-G
ro 9
223
78.9
13.2
54
90
93
80
54
112
71
73
58
96
88
51
FGH
I W
arre
n S
eed
McK
enna
325
77
.6
12.4
51
86
97
83
56
110
63
77
58
103
82
39
GH
I P
roge
ny P
243
77.3
12.7
53
76
89
79
69
116
67
81
64
93
75
42
HI
Str
atto
n S
eed
2059
76
.4
12.7
54
73
91
63
80
116
57
80
57
102
66
55
I P
roge
ny P
357
73.7
12.4
53
86
86
80
49
106
51
76
45
103
75
53
Aver
age
82.6
12.9
54.1
81.8
94.0
81.0
72.2
116.
9 64
.6
84.3
67.7
100.
1 78
.1
68.0
Yiel
ds h
ave
been
adj
uste
d to
13.
5% m
oist
ure.
Eac
h va
riety
was
eva
luat
ed in
a la
rge
strip
-plo
t at e
ach
loca
tion,
thus
eac
h co
unty
test
was
cons
ider
ed a
s one
repl
icat
ion
of th
e te
st
in c
alcu
latin
g th
e av
erag
e yi
eld
and
in c
ondu
ctin
g th
e st
atis
tical
ana
lysi
s to
det
erm
ine
sign
ifica
nt d
iffer
ence
s (M
S)
MS=
Varie
ties t
hat h
ave
any
MS
lett
er in
com
mon
are
not
stat
istic
ally
diff
eren
t in
yiel
d at
the
5% le
vel o
f pro
babi
lity.
Varie
ties d
enot
ed w
ith a
n as
teris
k (*
), or
(**)
, wer
e in
the
top
perf
orm
ing
grou
p in
201
7 an
d 20
16, o
r 201
7- 2
015,
resp
ectiv
ely.
Offi
cial
test
wei
ght o
f No.
2 w
heat
=58
lbs/
bu. T
WT
= Av
g. T
est W
t. lb
s./b
u @
10
loca
tions
. Fr
ankl
in C
o. h
ad tw
o se
para
te lo
catio
ns w
ith d
iffer
ent r
ow s
paci
ngs.
15i
n., a
nd 7
.5 in
.
14
Tabl
e 5.
Ave
rage
yie
lds†
and
test
wei
ghts
of 1
6 so
ft re
d w
inte
r whe
at v
arie
ties
that
wer
e in
com
mon
to b
oth
the
Cou
nty
Stan
dard
(CST
) Te
sts
(n=1
2) a
nd th
e AgR
esea
rch
and
Educ
atio
n C
ente
r (R
EC) T
ests
(n=5
) in
Tenn
esse
e du
ring
2017
.
Aver
age
Cou
nty
REC
of
CST
& R
EC T
ests
St
anda
rd T
e sts
Te
sts
Avg.
Avg.
Avg.
Bra
nd
Varie
ty
Yie
ld
Test
Wei
ght‡
Y
ield
Te
st W
eigh
t Y
ield
Te
st W
eigh
t bu
/a
lbs/
bu
bu/a
lb
s/bu
Prog
eny
#Bos
s 85
55
90
5679
54
U
SG
3536
83
56
88
5677
55
U
SG
3404
81
54
88
54
74
54
Agr
iPro
SY V
iper
81
55
87
54
74
56
Agr
iPro
SY
547
80
56
8656
73
57
D
yna-
Gro
95
22
81
55
8655
76
54
U
SG
3895
81
55
84
55
77
54
Bec
k's
125
80
56
8356
77
56
A
rmor
ARW
1575
78
54
83
52
72
56
Str
atto
n S
eed
AGS
2055
79
55
82
55
76
54
Cro
plan
SRW
941
5 79
54
81
54
77
55
Dyn
a-G
ro97
72
78
53
8053
76
54
A
rmor
Men
ace
77
55
8054
73
55
P
roge
nyP2
43
77
55
7753
76
56
S
trat
ton
See
d20
59
75
54
7654
74
54
P
roge
nyP3
57
72
52
7453
70
52
Aver
age
79
55
83
54
75
55
bu/a
lbs/bu

15
Tabl
e 6.
Mea
n yi
elds
† of
27
soft
red
win
ter w
heat
var
ietie
s eva
luat
ed a
t fiv
e lo
catio
ns (n
=10)
in T
enne
ssee
for
two
year
s, 20
16 a
nd 2
017
Avg
. Yie
ld
Bra
nd
Var
iety
(n
=10)
‡ K
noxv
ille
Spri
ngfie
ld
Mila
n C
ross
ville
Ja
ckso
n ---
------
------
------
------
------
----b
u/a-
------
------
------
------------------
------
- Pi
onee
r 26
R10
83
86
79
90
66
96
U
SG
3895
82
87
78
88
67
92
Pi
onee
r 26
R41
82
92
76
92
66
84
U
SG
3536
81
98
80
89
59
80
Pr
ogen
y #B
ulle
t 80
94
82
83
59
85
V
a Te
ch
Hill
iard
80
92
80
94
54
78
U
SG
3438
80
87
76
87
62
88
St
ratt
on
Go
Whe
at 2
058
80
92
75
89
57
86
USG
31
97
79
96
76
87
55
84
USG
32
01
79
88
73
87
57
92
Stra
tton
79
10
9 74
81
54
78
Pi
onee
r 79
90
70
91
56
88
Pr
ogen
y 78
94
74
90
55
78
T
N E
xp.
78
78
86
81
64
83
Syng
enta
Go
Whe
at 2
059
26R
53
#War
rior
T
N 1
604
SY V
iper
78
83
78
85
60
85
B
ecks
12
3 78
95
66
89
56
84
Pr
ogen
y #T
urbo
78
10
6 69
79
62
73
U
SG
3404
78
82
74
94
55
82
U
SG
3013
77
82
73
93
59
80
Pi
onee
r 26
R59
77
72
76
94
64
79
D
yna-
gro
9591
76
84
73
81
57
85
D
yna-
gro
9522
76
79
70
93
54
82
C
ropl
an b
y W
infie
ld
SRW
941
5 75
80
68
91
54
84
T
N E
xp.
TN
150
1 75
87
78
80
55
74
Pr
ogen
y P2
43
75
93
67
92
51
70
TFC
FF
R 2
407
73
81
59
89
51
86
Prog
eny
P357
71
73
69
84
52
77
Ave
rage
(bu/
a)
78
88
74
88
58
83
L.S
.D. .0
5 (b
u/a)
6
10
13
10
10
14
C.V
. (%
) 14
10
15
10
15
15
†
All
yiel
ds a
re a
djus
ted
to 1
3.5%
moi
sture
. ‡
n =
num
ber o
f env
ironm
ents
16
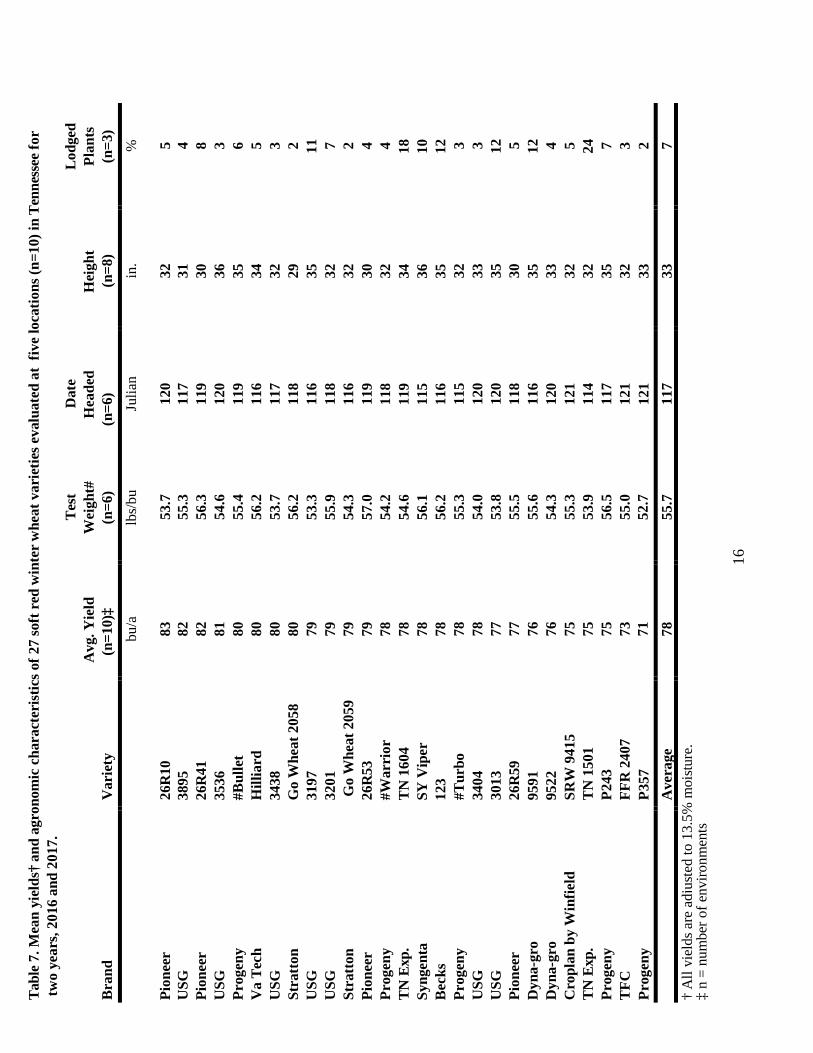
Tabl
e 7.
Mea
n yi
elds
† an
d ag
rono
mic
cha
ract
eris
tics o
f 27
soft
red
win
ter w
heat
var
ietie
s eva
luat
ed a
t fiv
e lo
catio
ns (n
=10)
in T
enne
ssee
for
two
year
s, 20
16 a
nd 2
017.
T
est
Dat
e L
odge
d A
vg. Y
ield
W
eigh
t#
Hea
ded
Hei
ght
Plan
ts
Bra
nd
Var
iety
(n
=10)
‡ (n
=6)
(n=6
) (n
=8)
(n=3
) bu
/a
lbs/
bu
Julia
n in
. %
Pion
eer
26R
10
83
53.7
12
0 32
5
USG
38
95
82
55.3
11
7 31
4
Pion
eer
26R
41
82
56.3
11
9 30
8
USG
35
36
81
54.6
12
0 36
3
Prog
eny
#Bul
let
80
55.4
11
9 35
6
Va
Tech
H
illia
rd
80
56.2
11
6 34
5
USG
34
38
80
53.7
11
7 32
3
Stra
tton
G
o W
heat
205
8 80
56
.2
118
29
2 U
SG
3197
79
53
.3
116
35
11
USG
32
01
79
55.9
11
8 32
7
Stra
tton
G
o W
heat
205
9 79
54
.3
116
32
2 Pi
onee
r 26
R53
79
57
.0
119
30
4 Pr
ogen
y #W
arri
or
78
54.2
11
8 32
4
TN
Exp
. T
N 1
604
78
54.6
11
9 34
18
Sy
ngen
ta
SY V
iper
78
56
.1
115
36
10
Bec
ks
123
78
56.2
11
6 35
12
Pr
ogen
y #T
urbo
78
55
.3
115
32
3 U
SG
3404
78
54
.0
120
33
3 U
SG
3013
77
53
.8
120
35
12
Pion
eer
26R
59
77
55.5
11
8 30
5
Dyn
a-gr
o 95
91
76
55.6
11
6 35
12
D
yna-
gro
9522
76
54
.3
120
33
4 C
ropl
an b
y W
infie
ld
SRW
941
5 75
55
.3
121
32
5 T
N E
xp.
TN
150
1 75
53
.9
114
32
24
Prog
eny
P243
75
56
.5
117
35
7 T
FC
FFR
240
7 73
55
.0
121
32
3 Pr
ogen
y P3
57
71
52.7
12
1 33
2
Ave
rage
78
55
.7
117
33
7 †
All
yiel
ds a
re a
djus
ted
to 1
3.5%
moi
sture
.‡
n =
num
ber o
f env
ironm
ents

17
Tabl
e 8.
Mea
n yi
elds
† of
16
soft
red
win
ter w
heat
var
ietie
s ev
alua
ted
at fi
ve lo
catio
ns (n
=15)
in T
enne
ssee
fo
r thr
ee y
ears
, 201
5 - 2
017.
Avg.
Yie
ld
Sprin
g-
Bra
nd
Varie
ty
(n=1
5)‡
Kno
xvill
e fie
ld
Jack
son
Mila
n C
ross
ville
---
------
------
------
------
------
----b
u/a-
------
------
------
------
------
------
------
----
USG
38
95
77
85
80
79
83
60
Pion
eer
26R
10
77
86
76
82
85
55
Va
Tec
h H
illia
rd
75
85
77
71
87
54
USG
34
38
75
86
75
76
80
57
Pion
eer
26R
41
74
84
72
75
85
55
USG
30
13
74
83
73
71
87
56
Stra
tton
Go
Whe
at 2
058
74
87
73
77
82
51
USG
34
04
74
79
74
73
91
52
Pion
eer
26R
59
73
78
78
71
87
52
Pion
eer
26R
53
73
85
68
76
88
49
Cro
plan
by
Win
field
SR
W 9
415
72
78
69
77
87
50
Dyn
a-gr
o 95
22
72
80
74
76
86
45
Dyn
a-gr
o 95
91
72
83
72
75
79
49
TN
Exp
. T
N 1
501
71
82
76
64
78
53
TFC
FF
R 2
407
69
82
63
74
82
46
Prog
eny
P357
68
73
69
67
81
51
Aver
age
(bu/
a)
7382
7374
8452
L.S.
D. .0
5 (b
u/a)
5 9
9 11
8
9 C
.V. (
%)
13.2
11
13
.4
14.9
9.
9 17
.5
† A
ll yi
elds
are
adj
uste
d to
13.
5% m
oist
ure.
‡
n =
num
ber o
f env
ironm
ents

18
Tabl
e 9.
Mea
n yi
elds
† an
d ag
rono
mic
cha
ract
eris
tics
of 1
6 so
ft re
d w
inte
r whe
at v
arie
ties
eval
uate
d at
five
loca
tions
(n=1
5) fo
r thr
ee
year
s, 2
015
- 201
7.
Test
Av
g. Y
ield
W
eigh
t D
ate
Hei
ght
Lodg
ed
Bra
nd
Varie
ty
(n=1
5)‡
(n=9
) H
eade
d (n
=12)
Pl
ants
bu
/a
lbs/
bu
julia
n in
. %
USG
38
95
77
57.3
11
4 32
2
Pion
eer
26R
10
77
57.0
11
7 32
2
Va
Tec
h H
illia
rd
75
57.6
11
3 34
2
USG
34
38
75
55.7
11
3 32
1
Pion
eer
26R
41
74
57.6
11
5 31
2
USG
30
13
74
54.7
11
7 35
5
Stra
tton
Go
Whe
at 2
058
74
57.7
11
4 30
1
USG
34
04
74
56.8
11
7 33
2
Pion
eer
26R
59
73
55.9
11
4 30
3
Pion
eer
26R
53
73
56.0
11
5 31
2
Cro
plan
by
Win
field
SR
W 9
415
72
57.3
11
7 32
3
Dyn
a-gr
o 95
22
72
57.0
11
7 33
2
Dyn
a-gr
o 95
91
72
58.4
11
3 34
5
TN
Exp
. T
N 1
501
71
53.4
11
0 33
10
TF
C
FFR
240
7 69
57
.0
118
32
2 Pr
ogen
y P3
57
68
55.4
11
7 33
1
Aver
age
73
57.0
11
7 32
3.
0 †
All
yiel
ds a
re a
djus
ted
to 1
3.5%
moi
stur
e.
‡ n
= nu
mbe
r of e
nviro
nmen
ts
Dat
e he
aded
= n
o. o
f day
s af
ter J
anua
ry 1
.
19
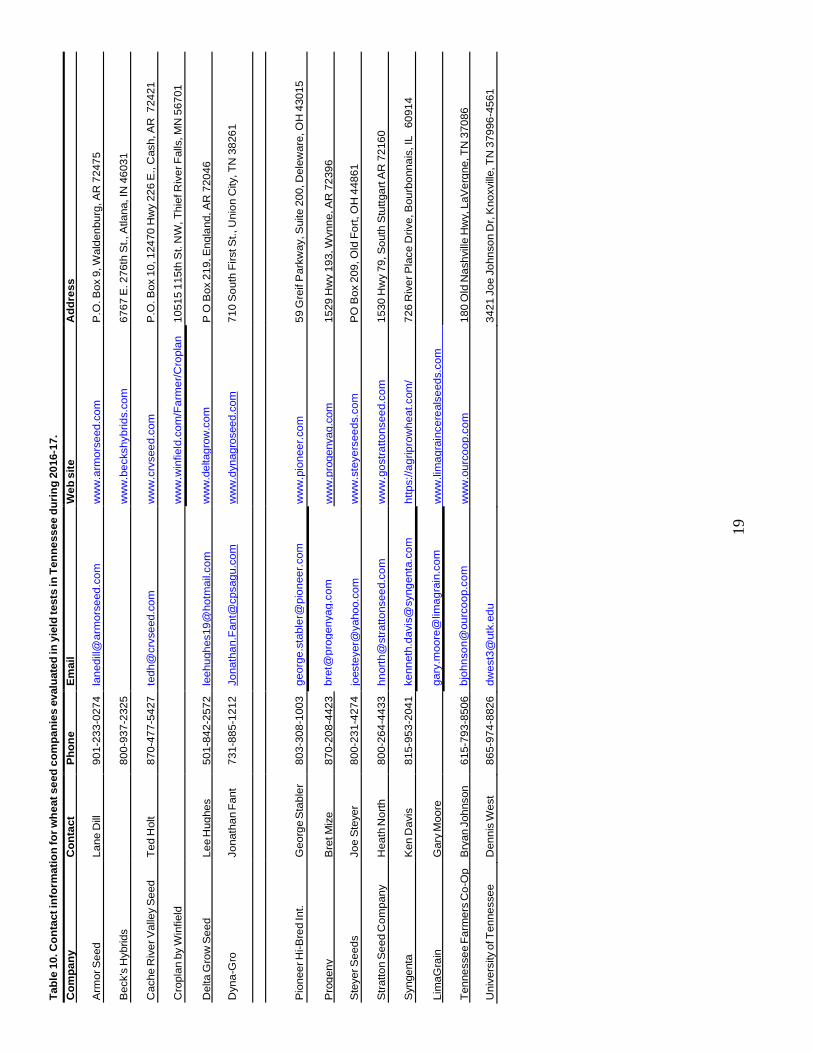
Tabl
e 10
. Con
tact
info
rmat
ion
for w
heat
see
d co
mpa
nies
eva
luat
ed in
yie
ld te
sts
in T
enne
ssee
dur
ing
2016
-17.
C
ompa
nyC
onta
ctPh
one
Emai
lW
eb s
iteA
ddre
ss
Arm
or S
eed
Lane
Dill
901-
233-
0274
lan
edill
@ar
mor
seed
.com
ww
w.a
rmor
seed
.com
P.O
. Box
9, W
alde
nbur
g, A
R 7
2475
Bec
k's
Hyb
rids
800-
937-
2325
ww
w.b
ecks
hybr
ids.
com
6767
E. 2
76th
St.,
Atla
na, I
N 4
6031
Cac
he R
iver
Val
ley
See
dTe
d H
olt
870-
477-
5427
ted
h@cr
vsee
d.co
mw
ww
.crv
seed
.com
P.O
. Box
10,
124
70 H
wy
226
E.,
Cas
h, A
R 7
2421
Cro
plan
by
Win
field
ww
w.w
infie
ld.c
om/F
arm
er/C
ropl
an
1051
5 11
5th
St.
NW
, Thi
ef R
iver
Fal
ls, M
N 5
6701
Del
ta G
row
See
d Le
e H
ughe
s 50
1-84
2-25
72 l
eehu
ghes
19@
hotm
ail.c
om
ww
w.d
elta
grow
.com
P O
Box
219
, Eng
land
, AR
720
46
Dyn
a-G
roJo
nath
an F
ant
731-
885-
1212
Jon
atha
n.Fa
nt@
cpsa
gu.c
omw
ww
.dyn
agro
seed
.com
710
Sou
th F
irst S
t., U
nion
City
, TN
382
61
Pio
neer
Hi-B
red
Int.
Geo
rge
Sta
bler
80
3-30
8-10
03 g
eorg
e.st
able
r@pi
onee
r.com
ww
w.p
ione
er.c
om59
Gre
if P
arkw
ay, S
uite
200
, Del
ewar
e, O
H 4
3015
Pro
geny
B
ret M
ize
870-
208-
4423
bre
t@pr
ogen
yag.
com
w
ww
.pro
geny
ag.c
om
1529
Hw
y 19
3, W
ynne
, AR
723
96
Ste
yer S
eeds
Joe
Ste
yer
800-
231-
4274
joe
stey
er@
yaho
o.co
mw
ww
.ste
yers
eeds
.com
PO
Box
209
, Old
For
t, O
H 4
4861
Stra
tton
See
d C
ompa
nyH
eath
Nor
th
800-
264-
4433
hno
rth@
stra
ttons
eed.
com
ww
w.g
ostra
ttons
eed.
com
1530
Hw
y 79
, Sou
th S
tuttg
art A
R 7
2160
Syn
gent
aK
en D
avis
81
5-95
3-20
41 k
enne
th.d
avis
@sy
ngen
ta.c
omht
tps:
//agr
ipro
whe
at.c
om/
726
Riv
er P
lace
Driv
e, B
ourb
onna
is, I
L 6
0914
Lim
aGra
in
Gar
y M
oore
ga
ry.m
oore
@lim
agra
in.c
omw
ww
.lim
agra
ince
real
seed
s.co
m
Tenn
esse
e Fa
rmer
s C
o-O
p B
ryan
Joh
nson
61
5-79
3-85
06 b
john
son@
ourc
oop.
com
w
ww
.our
coop
.com
18
0 O
ld N
ashv
ille
Hw
y, L
aVer
gne,
TN
370
86
Uni
vers
ity o
f Ten
ness
ee
Den
nis
Wes
t 86
5-97
4-88
26 d
wes
t3@
utk.
edu
3421
Joe
Joh
nson
Dr,
Kno
xvill
e, T
N 3
7996
-456
1
20
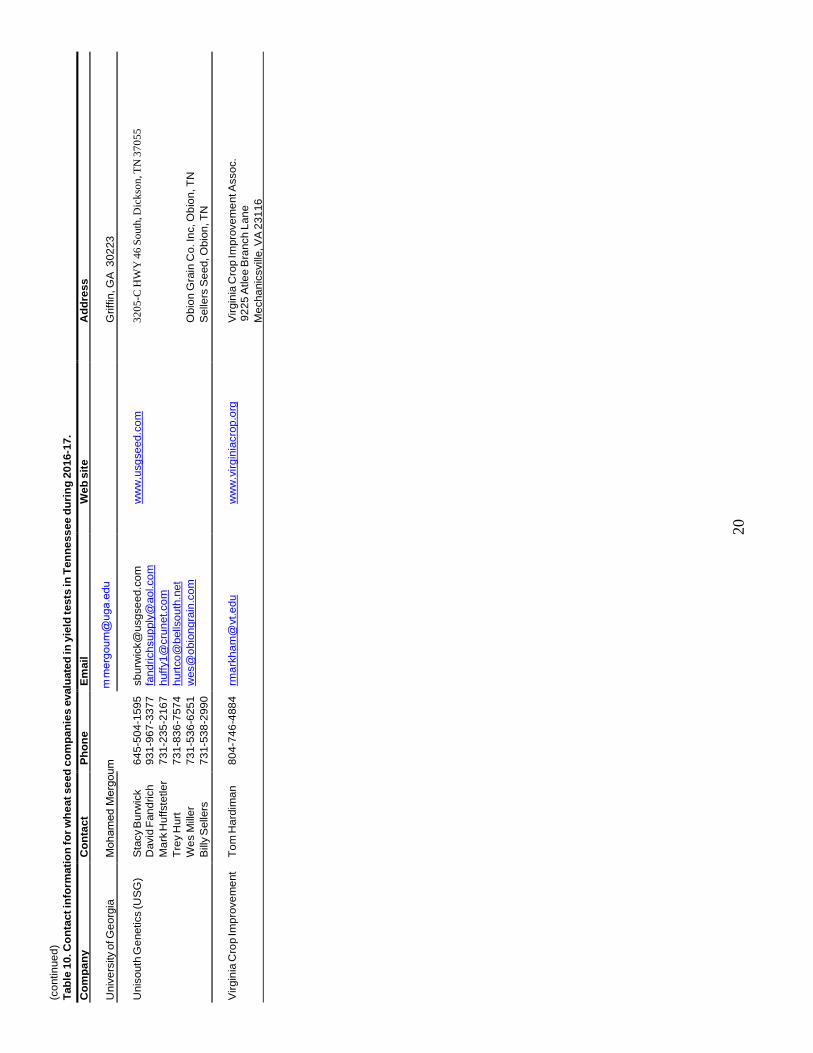
(con
tinue
d)
Tabl
e 10
. Con
tact
info
rmat
ion
for w
heat
see
d co
mpa
nies
eva
luat
ed in
yie
ld te
sts
in T
enne
ssee
dur
ing
2016
-17.
C
ompa
nyC
onta
ctPh
one
Emai
lW
eb s
iteA
ddre
ss
Uni
vers
ity o
f Geo
rgia
Moh
amed
Mer
goum
m
mer
goum
@ug
a.ed
uG
riffin
, GA
302
23
Uni
sout
h G
enet
ics
(US
G)
Sta
cy B
urw
ick
645-
504-
1595
sbu
rwic
k@us
gsee
d.co
mw
ww
.usg
seed
.com
3205
-C H
WY
46
Sout
h, D
icks
on, T
N 3
7055
Dav
id F
andr
ich
931-
967-
3377
fan
dric
hsup
ply@
aol.c
om
Mar
k Huf
fste
tler
731-
235-
2167
huf
fy1@
crun
et.c
om
Trey
Hur
t 73
1-83
6-75
74 h
urtc
o@be
llsou
th.n
et
Wes
Mill
er
731-
536-
6251
wes
@ob
iong
rain
.com
O
bion
Gra
in C
o. In
c, O
bion
, TN
B
illy
Sel
lers
73
1-53
8-29
90
Sel
lers
See
d, O
bion
, TN
Virg
inia
Cro
p Im
prov
emen
t To
m H
ardi
man
80
4-74
6-48
84 r
mar
kham
@vt
.edu
ww
w.v
irgin
iacr
op.o
rgV
irgin
ia C
rop
Impr
ovem
ent A
ssoc
.92
25 A
tlee
Bra
nch
Lane
M
echa
nics
ville
, VA
231
16

E11-2646-02-18 1.5M 9/17 18-0025Programs in agriculture and natural resources, 4-H youth development, family and consumer sciences, and resource development.
University of Tennessee Institute of Agriculture, U.S. Department of Agriculture and county governments cooperating. UT Extension provides equal opportunities in programs and employment.