Embed Size (px)
Citation preview
RP- HPLC METHOD DEVELOPMENT AND VALIDATION FOR
ESTIMATION OF ISONIAZID AND RIFAMPICIN IN TABLET
DOSAGE FORM
Dissertation
Submitted to
The Tamilnadu Dr. M. G. R. Medical University,
CHENNAI
In partial fulfilment for the award of the degree of
MASTER OF PHARMACY
IN
PHARMACEUTICAL ANALYSIS
DEPARTMENT OF PHARMACEUTICAL ANALYSIS
K. M. COLLEGE OF PHARMACY
MELUR ROAD, UTHANGUDI
MADURAI - 625107
APRIL -2014
CERTIFICATE
This is to certify that the dissertation entitled “RP-HPLC METHOD
DEVELOPMENT AND VALIDATION FOR ESTIMATION OF ISONIAZID AND
RIFAMPICIN IN TABLET DOSAGE FORM” submitted by Mr. YELLE SUDHEER
KUMAR (Reg. No: 261230055) in partial fulfilment of the degree of Master of
Pharmacy in Pharmaceutical analysis under The Tamilnadu Dr.M.G.R Medical
University, Chennai, done at K. M. COLLEGE OF PHARMACY, MADURAI - 625107,
is a bonafide work carried out by him under my guidance and supervision during the academic
year April - 2013-2014. The dissertation partially or fully has not been submitted for any other
degree or diploma of this university or other universities.
GUIDE& HOD PRINCIPAL
Dr. M. Sundarapandian, M. Pharm., Ph.D., Dr.S. Venkataraman, M.Pharm., Ph.D.,
Professor and Head, Professor and Head,
Dept. of Pharmaceutical Analysis, Dept. of Pharmaceutical Chemistry,
K.M.College of Pharmacy, K.M.College of Pharmacy,
Uthangudi, Madurai-625107, Uthangudi, Madurai-625107,
Tamilnadu. Tamilnadu.
CERTIFICATE
This is to certify that the dissertation entitled “RP-HPLC METHOD
DEVELOPMENT AND VALIDATION FOR ESTIMATION OF ISONIAZID AND
RIFAMPICIN IN TABLET DOSAGE FORM” submitted by Mr. YELLE SUDHEER
KUMAR (Reg. No: 261230055) K. M. COLLEGE OF PHARMACY, MADURAI -
625107, in partial fulfilment of the University rules and regulations for award of Master of
Pharmacy in Pharmaceutical Analysis under my guidance and supervision during the
academic year APRIL 2013-2014.
HOD PRINCIPAL
Dr.M. Sundarapandian, M. Pharm., Ph.D., Dr. S. Venkataraman, M.Pharm., Ph.D.,
Professor and Head, Professor and Head,
Dept. of Pharmaceutical Analysis, Dept. of Pharmaceutical Chemistry,
K.M.College of Pharmacy, K.M.College of Pharmacy,
Uthangudi, Madurai-625107, Uthangudi, Madurai-625107,
Tamilnadu. Tamilnadu.
AN EXPRESION OF GRATITUDE
“With God All Things Are Possible”
Milestones in life are achieved, not by individual efforts but by blessings and
guidance of elders, near and dear one of collective wisdom and experience of all those who
have shared their views far this project is the product beyond those found within the covers of
book. I therefore take this opportunity to express my acknowledgements to all of them.
Let me first thank almighty for giving me life and my parents for educating me and
keeping my requirements in priority at all situations. Without their unconditional support and
encouragement it would have been impossible to pursue my interest.
It gives me immense pleasure to express my deepest thanks, heartfelt, indebtness and
regards to my respected guide, Dr. M.SUNDARAPANDIAN.,M.Pharm.,Ph.D., professor
and HOD., Dept. of Pharmaceutical Analysis, K.M.College of Pharmacy, Madurai, for
providing much of the stimuli in the form of suggestions, guidance and encouragements at all
stages of my work.
I owe my great debt of gratitude and heartfelt thanks to Prof. M. Nagarajan.,
M.Pharm.,M.B.A., DMS (IM)., DMS (BM).,chairman, K.M.College of Pharmacy, Madurai for
providing me all the facilities and support for the successful completion of my thesis work.
I express my deep sincere thanks to Dr. S. Venkataraman,M.Pharm., Ph.D.,Principal,
professor and H.O.D, Dept. of Pharmaceutical chemistry, for his timely instigation and
immeasurable esteemed help to complete this thesis.
I express my deep sense of gratitude and profound thankfulness to Prof.
M.S.Prakash.,M. Pharm., Dept. of Pharmaceutical Analysis, K.M.College of Pharmacy, and
Madurai for his invaluable advice, suggestion and encouragement extended throughout the
work.
I submit sincere thanks and respectful regards Mr.T.SRINIVAS REDDY,
DIRECTOR, AND MY COLLUGES who provided me all the facilities and his excellent
guidance for my project and I am also very thankful to staff of industry for their kind
cooperation.

I extend my thanks to M. Shanthi., B.A, M.Li.Sc., Librarian and Mrs. M. Sasi kala.,
D.pharm., Lab Assistant and Mrs. J.Sridevi., lab attender and all other non-teaching staff
members of our college for their co-operation.
I cannot forget to express my gratitude and grateful thanks to my classmates
Ch.Narayana Swamy, Chaitu, Gopi, Sandhya, Sasi ruba and veeraiah who helped me
directly and indirectly for the successful completion of my project work.
.
Y. SUDHEER KUMAR
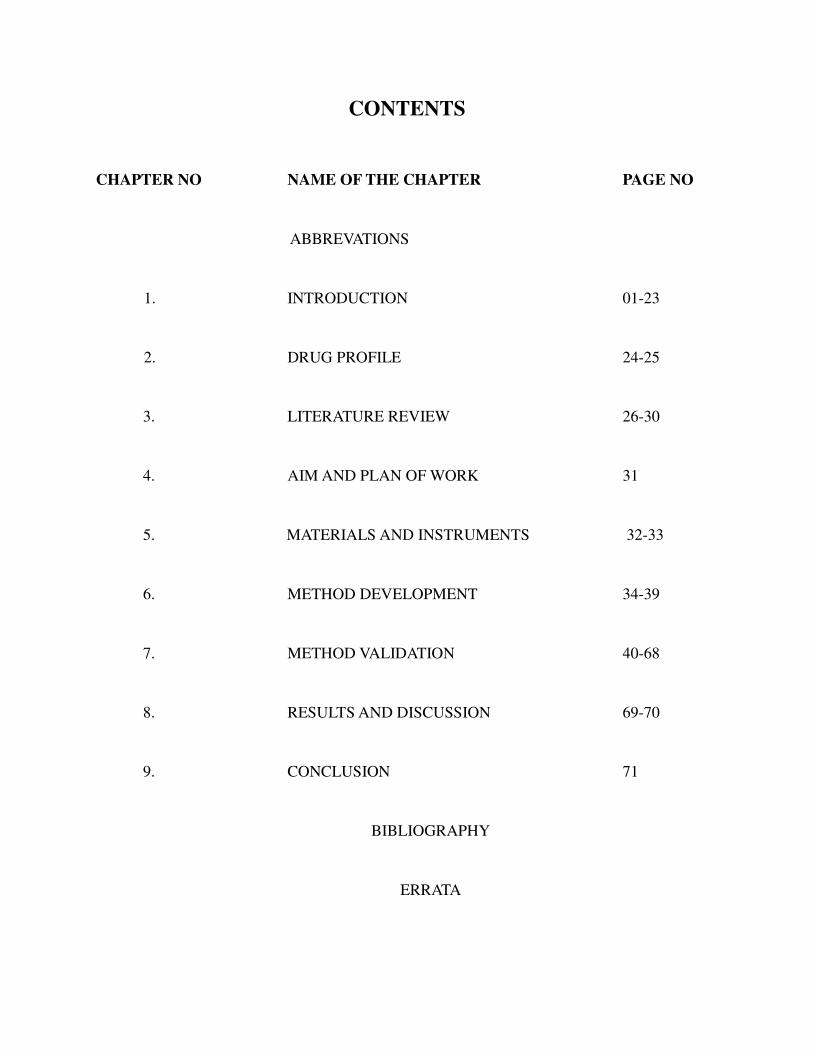
CONTENTS
CHAPTER NO NAME OF THE CHAPTER PAGE NO
ABBREVATIONS
1. INTRODUCTION 01-23
2. DRUG PROFILE 24-25
3. LITERATURE REVIEW 26-30
4. AIM AND PLAN OF WORK 31
5. MATERIALS AND INSTRUMENTS 32-33
6. METHOD DEVELOPMENT 34-39
7. METHOD VALIDATION 40-68
8. RESULTS AND DISCUSSION 69-70
9. CONCLUSION 71
BIBLIOGRAPHY
ERRATA
Introduction to analytical chemistry
1. INTRODUCTION
1.1 Introduction to analytical chemistry(1)
The pharmaceutical analysis defined as “the branch of practical chemistry
which deals with the resolution, separation, identification, determination and
purification of a given sample of a medicine, the detection and estimation of
impurities, which may be present in drug substance (or) given sample of medicine”.
The substance may be a single compound or a mixture of compounds and may
be in the form a tablet, pill, capsule, ampoule, liquid, mixture or an ointment.
The quality control tests involve methods which embrace chemicals, physio –
chemical, instrumental, microbiological (or) biological procedures.
The pharmaceutical analysis deals with the subject of determining the
composition of material in terms of the elements or compound (drug) present in the
system.
Any type of analysis involves two steps
Identification (qualitative)
Estimation (quantitative)
In qualitative analysis, a reaction is performed in such a way as to indicate the
formation of a precipitate, a change of a colour, the dissolution of a precipitate
complex formation and the evaluation of a gas.
Quantitative analysis is performed ordinarily through five steps. They are
sampling, dissolution, precipitation, measurement and calculation.
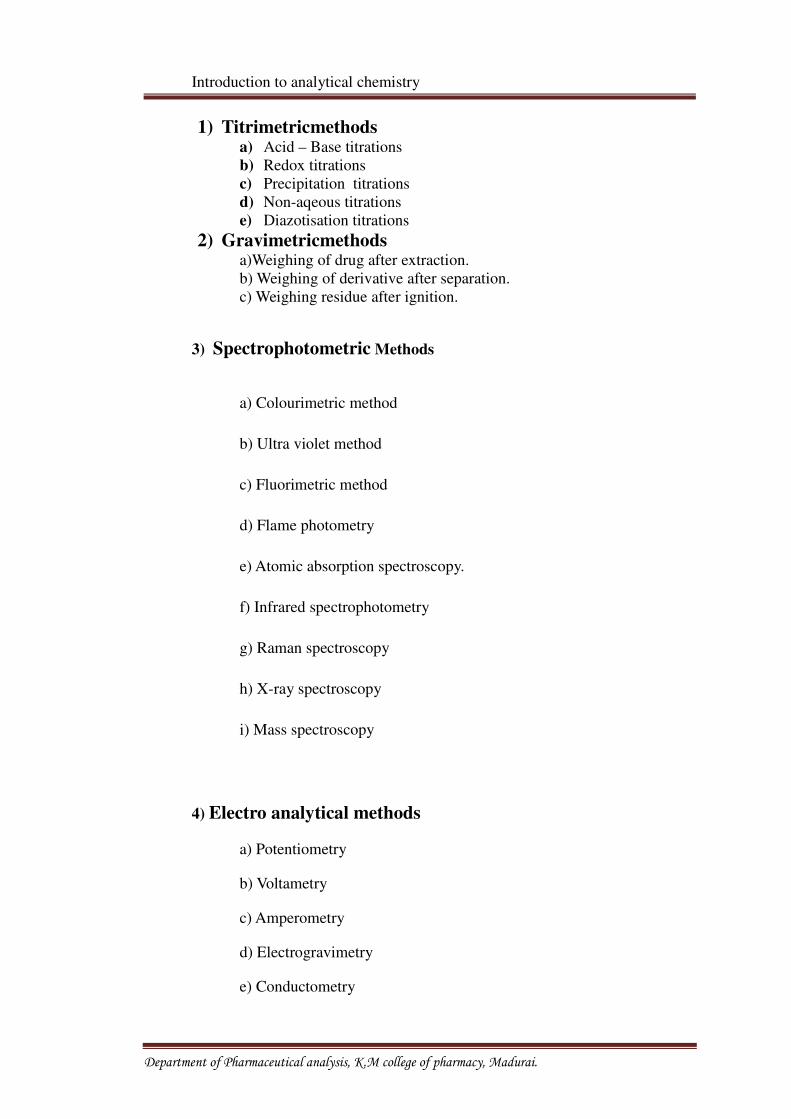
Analytical Techniques(2, 3,4)
Department of Pharmaceutical analysis, K.M college of pharmacy, Madurai.
Introduction to analytical chemistry
1) Titrimetricmethodsa) Acid – Base titrations
b) Redox titrations
c) Precipitation titrations
d) Non-aqeous titrations
e) Diazotisation titrations
2) Gravimetricmethodsa)Weighing of drug after extraction.
b) Weighing of derivative after separation.
c) Weighing residue after ignition.
3) Spectrophotometric Methods
a) Colourimetric method
b) Ultra violet method
c) Fluorimetric method
d) Flame photometry
e) Atomic absorption spectroscopy.
f) Infrared spectrophotometry
g) Raman spectroscopy
h) X-ray spectroscopy
i) Mass spectroscopy
4) Electro analytical methods
a) Potentiometry
b) Voltametry
c) Amperometry
d) Electrogravimetry
e) Conductometry
Department of Pharmaceutical analysis, K.M college of pharmacy, Madurai.
Introduction to analytical chemistry
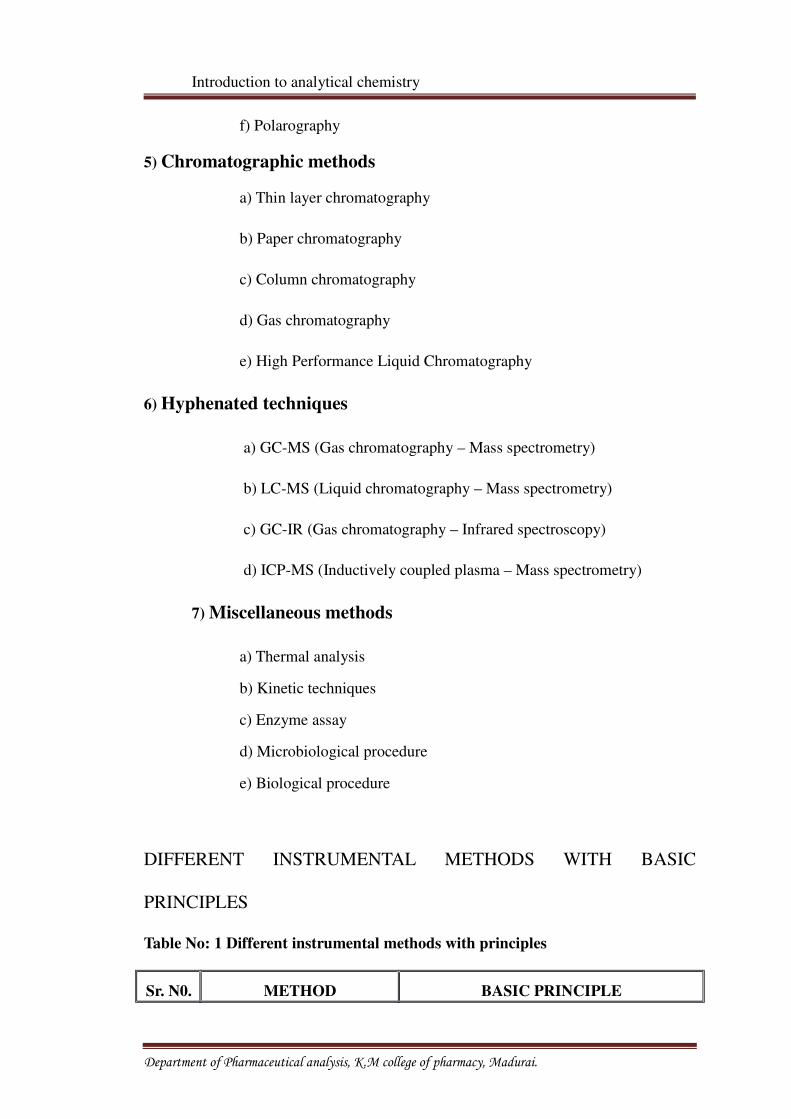
f) Polarography
5) Chromatographic methods
a) Thin layer chromatography
b) Paper chromatography
c) Column chromatography
d) Gas chromatography
e) High Performance Liquid Chromatography
6) Hyphenated techniques
a) GC-MS (Gas chromatography – Mass spectrometry)
b) LC-MS (Liquid chromatography – Mass spectrometry)
c) GC-IR (Gas chromatography – Infrared spectroscopy)
d) ICP-MS (Inductively coupled plasma – Mass spectrometry)
7) Miscellaneous methods
a) Thermal analysis
b) Kinetic techniques
c) Enzyme assay
d) Microbiological procedure
e) Biological procedure
DIFFERENT INSTRUMENTAL METHODS WITH BASIC
PRINCIPLES
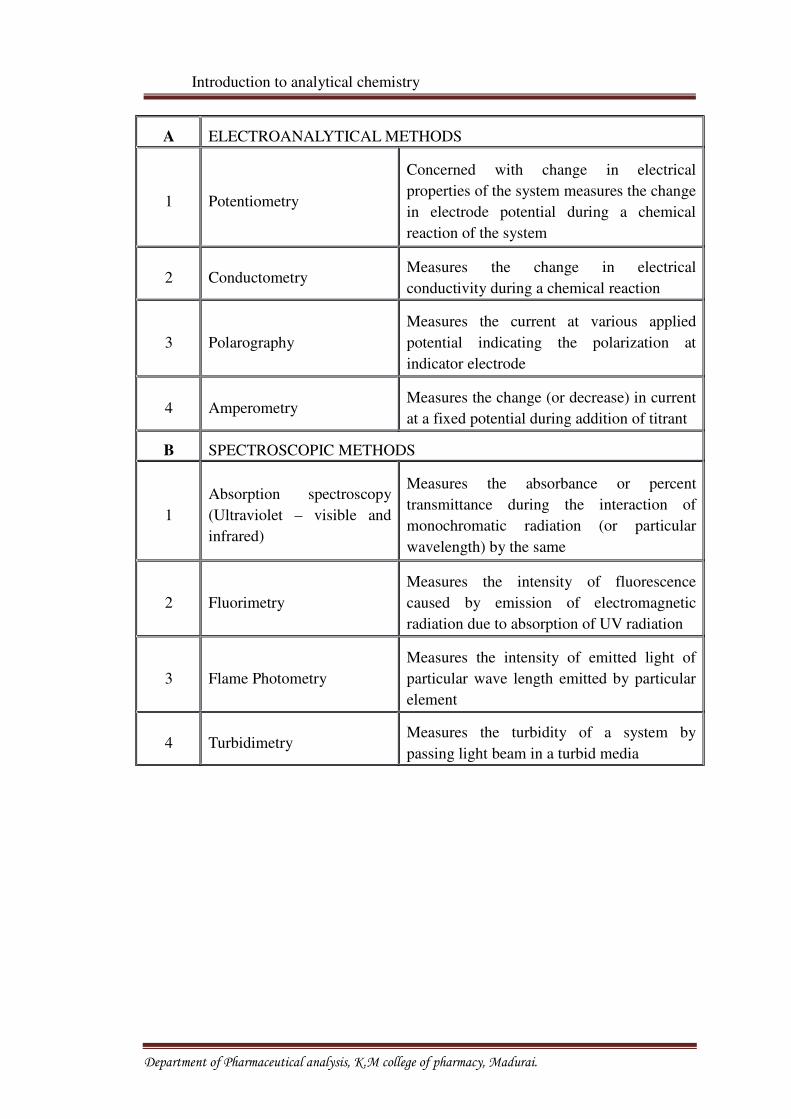
Table No: 1 Different instrumental methods with principles
Sr. N0. METHOD BASIC PRINCIPLE
Department of Pharmaceutical analysis, K.M college of pharmacy, Madurai.
Introduction to analytical chemistry
A ELECTROANALYTICAL METHODS
1 Potentiometry
Concerned with change in electrical
properties of the system measures the change
in electrode potential during a chemical
reaction of the system
2 ConductometryMeasures the change in electrical
conductivity during a chemical reaction
3 Polarography
Measures the current at various applied
potential indicating the polarization at
indicator electrode
4 AmperometryMeasures the change (or decrease) in current
at a fixed potential during addition of titrant
B SPECTROSCOPIC METHODS
1
Absorption spectroscopy
(Ultraviolet – visible and
infrared)
Measures the absorbance or percent
transmittance during the interaction of
monochromatic radiation (or particular
wavelength) by the same
2 Fluorimetry
Measures the intensity of fluorescence
caused by emission of electromagnetic
radiation due to absorption of UV radiation
3 Flame Photometry
Measures the intensity of emitted light of
particular wave length emitted by particular
element
4 TurbidimetryMeasures the turbidity of a system by
passing light beam in a turbid media
Department of Pharmaceutical analysis, K.M college of pharmacy, Madurai.
Introduction to analytical chemistry
Sr. N0. METHOD BASIC PRINCIPLE
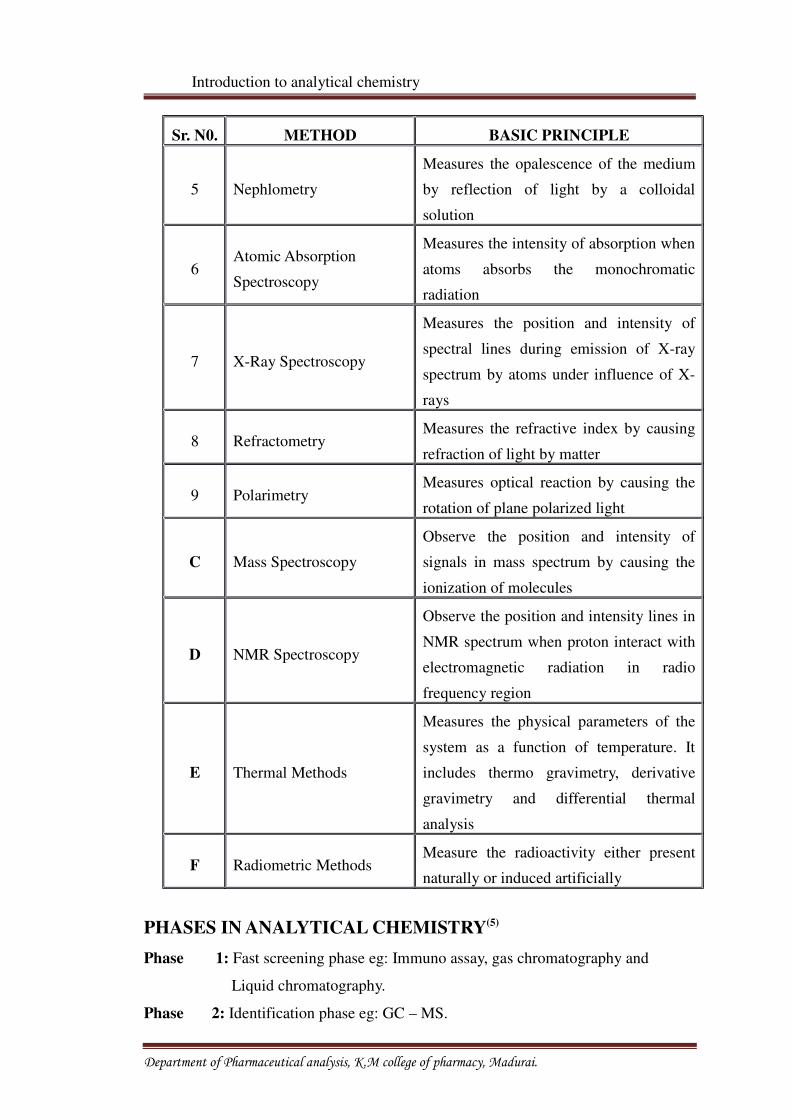
5 Nephlometry
Measures the opalescence of the medium
by reflection of light by a colloidal
solution
6Atomic Absorption
Spectroscopy
Measures the intensity of absorption when
atoms absorbs the monochromatic
radiation
7 X-Ray Spectroscopy
Measures the position and intensity of
spectral lines during emission of X-ray
spectrum by atoms under influence of X-
rays
8 RefractometryMeasures the refractive index by causing
refraction of light by matter
9 PolarimetryMeasures optical reaction by causing the
rotation of plane polarized light
C Mass Spectroscopy
Observe the position and intensity of
signals in mass spectrum by causing the
ionization of molecules
D NMR Spectroscopy
Observe the position and intensity lines in
NMR spectrum when proton interact with
electromagnetic radiation in radio
frequency region
E Thermal Methods
Measures the physical parameters of the
system as a function of temperature. It
includes thermo gravimetry, derivative
gravimetry and differential thermal
analysis
F Radiometric MethodsMeasure the radioactivity either present
naturally or induced artificially
PHASES IN ANALYTICAL CHEMISTRY(5)
Phase 1: Fast screening phase eg: Immuno assay, gas chromatography and
Liquid chromatography.
Phase 2: Identification phase eg: GC – MS.
Department of Pharmaceutical analysis, K.M college of pharmacy, Madurai.
Introduction to analytical chemistry
Phase 3: Qualification phase eg: Spectrophotometer and gas chromatography.
IMPORTANT CONSIDERATIONS IN ANALYTICAL METHODS(6)
The instrument is the most visible and exciting element of the analytical method
and it is only one component of the total analysis.
• The analyst should determine the nature of the sample, the end use of the
analytical results, the species to be analyzed.
• Quantitative information may include elemental composition, oxidation state,
functional groups, major components, minor components, complete
identification in the given sample.
• Quantitative data include accuracy, precision and range of expected analyte.
• Methods such as controlling the atmosphere to which the sample is exposed,
controlling the temperature of the sample, buffering the pH of sample
solutions.
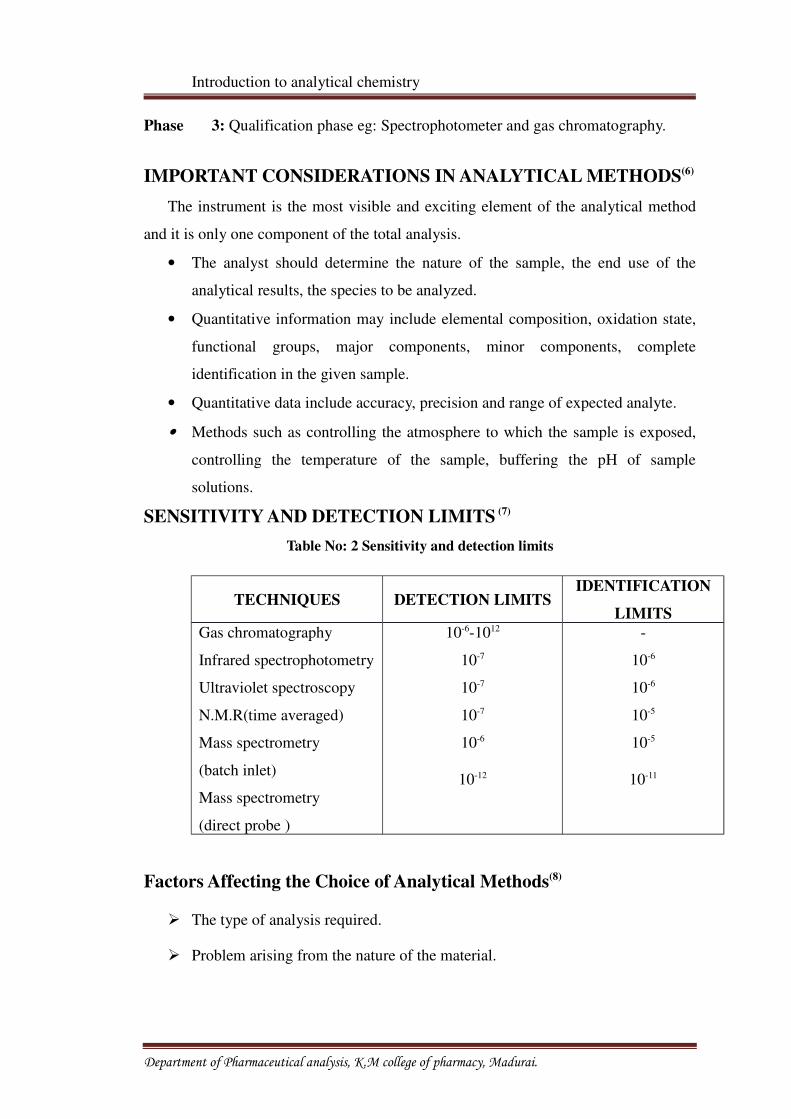
SENSITIVITY AND DETECTION LIMITS (7)
Table No: 2 Sensitivity and detection limits
TECHNIQUES DETECTION LIMITSIDENTIFICATION
LIMITS
Gas chromatography
Infrared spectrophotometry
Ultraviolet spectroscopy
N.M.R(time averaged)
Mass spectrometry
(batch inlet)
Mass spectrometry
(direct probe )
10-6-1012
10-7
10-7
10-7
10-6
10-12
-
10-6
10-6
10-5
10-5
10-11
Factors Affecting the Choice of Analytical Methods(8)
� The type of analysis required.
� Problem arising from the nature of the material.
Department of Pharmaceutical analysis, K.M college of pharmacy, Madurai.
Introduction to analytical chemistry
� Possible interference from components of the material other than those of
interest.
� The concentration range which needs to be investigated.
� The accuracy required.
� The facilities available.
� The time required for complete analysis.
� Similar type of analysis performed.
1.2 CHROMATOGRAPHY
Chromatography is a technique in which solutes are resolved by differential rates of
elution as they pass through a chromatographic column. Chromatography is essentially a
Department of Pharmaceutical analysis, K.M college of pharmacy, Madurai.
Introduction to analytical chemistry
group of techniques for the separation of the compounds of mixtures by their continuous
distribution between two phases, one of which moves relative to the other. [4]
History:
Many publications have discussed or detailed the history and development of
chromatography. Table No.2 lists the chronological order of the events that are the most
notable in the development of the present state of the field. Since the various types of
chromatography (liquid, gas, paper, thin-layer, ion exchange, supercritical fluid, and
electrophoresis) have many features in common, they must all be considered in development
of the field. [9]
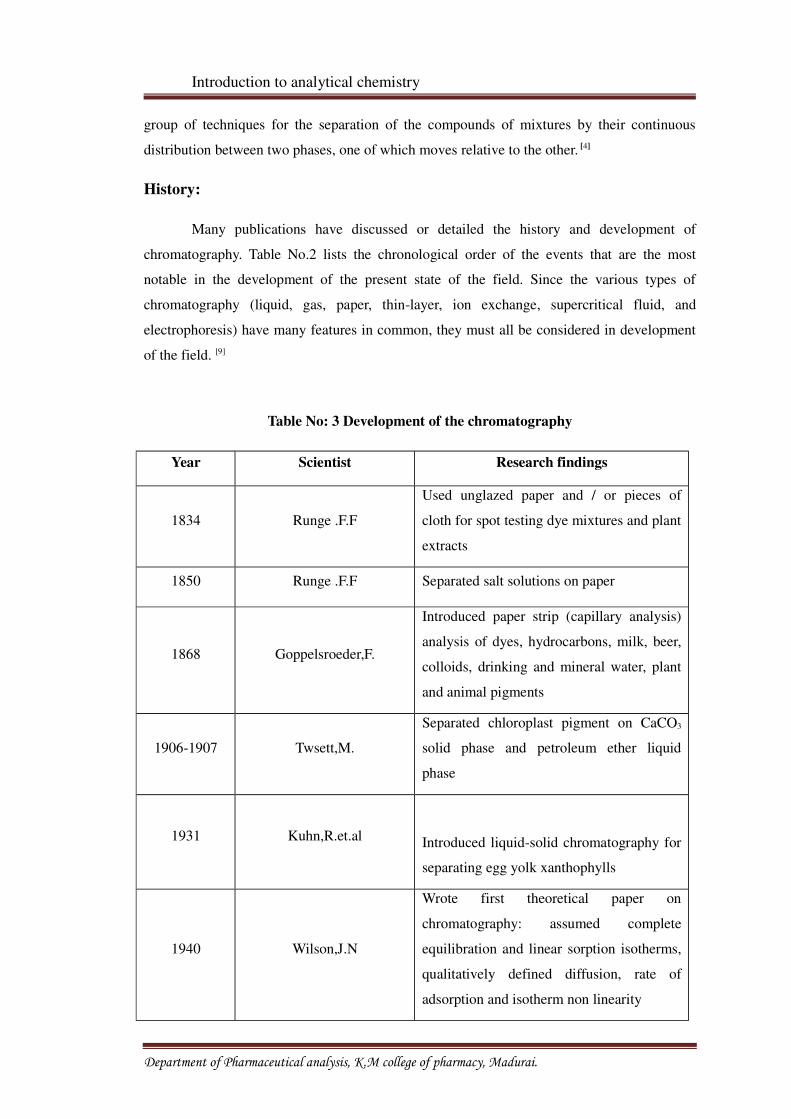
Table No: 3 Development of the chromatography
Year Scientist Research findings
1834 Runge .F.F
Used unglazed paper and / or pieces of
cloth for spot testing dye mixtures and plant
extracts
1850 Runge .F.F Separated salt solutions on paper
1868 Goppelsroeder,F.
Introduced paper strip (capillary analysis)
analysis of dyes, hydrocarbons, milk, beer,
colloids, drinking and mineral water, plant
and animal pigments
1906-1907 Twsett,M.
Separated chloroplast pigment on CaCO3
solid phase and petroleum ether liquid
phase
1931 Kuhn,R.et.alIntroduced liquid-solid chromatography for
separating egg yolk xanthophylls
1940 Wilson,J.N
Wrote first theoretical paper on
chromatography: assumed complete
equilibration and linear sorption isotherms,
qualitatively defined diffusion, rate of
adsorption and isotherm non linearity
Department of Pharmaceutical analysis, K.M college of pharmacy, Madurai.
Introduction to analytical chemistry
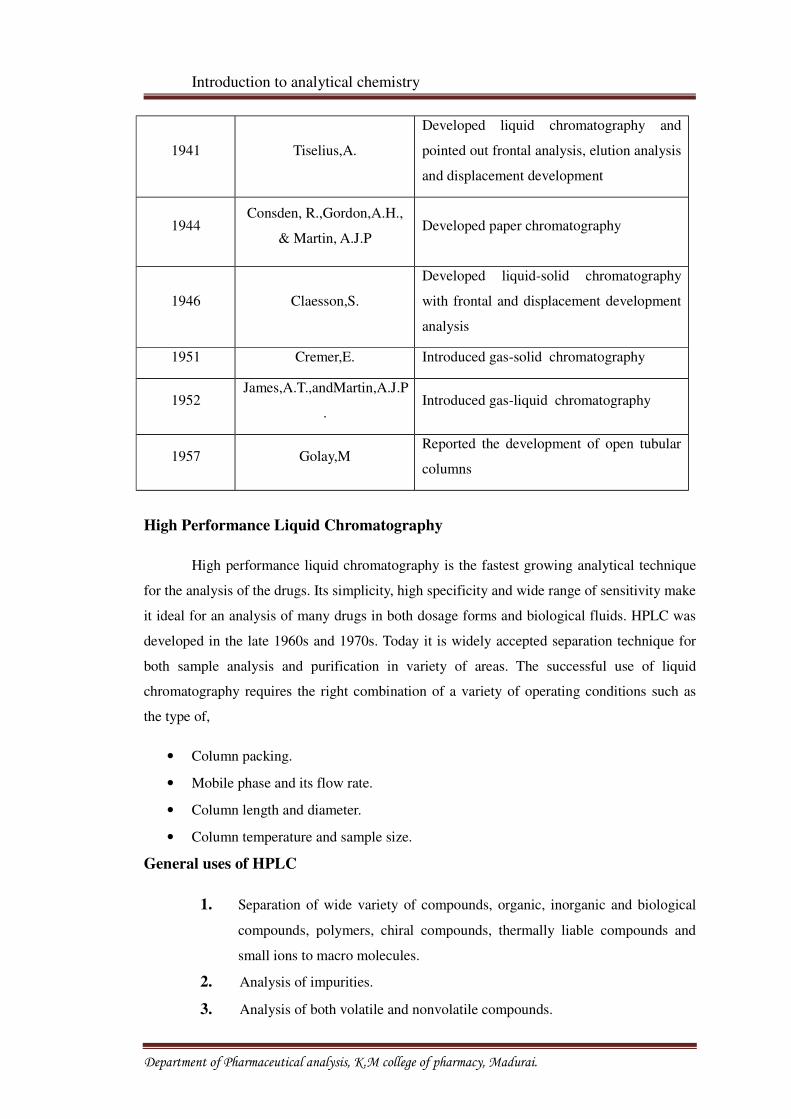
1941 Tiselius,A.
Developed liquid chromatography and
pointed out frontal analysis, elution analysis
and displacement development
1944Consden, R.,Gordon,A.H.,
& Martin, A.J.PDeveloped paper chromatography
1946 Claesson,S.
Developed liquid-solid chromatography
with frontal and displacement development
analysis
1951 Cremer,E. Introduced gas-solid chromatography
1952James,A.T.,andMartin,A.J.P
.Introduced gas-liquid chromatography
1957 Golay,MReported the development of open tubular
columns
High Performance Liquid Chromatography
High performance liquid chromatography is the fastest growing analytical technique
for the analysis of the drugs. Its simplicity, high specificity and wide range of sensitivity make
it ideal for an analysis of many drugs in both dosage forms and biological fluids. HPLC was
developed in the late 1960s and 1970s. Today it is widely accepted separation technique for
both sample analysis and purification in variety of areas. The successful use of liquid
chromatography requires the right combination of a variety of operating conditions such as
the type of,
• Column packing.
• Mobile phase and its flow rate.
• Column length and diameter.
• Column temperature and sample size.
General uses of HPLC
1. Separation of wide variety of compounds, organic, inorganic and biological
compounds, polymers, chiral compounds, thermally liable compounds and
small ions to macro molecules.
2. Analysis of impurities.
3. Analysis of both volatile and nonvolatile compounds.
Department of Pharmaceutical analysis, K.M college of pharmacy, Madurai.
Introduction to analytical chemistry
4. Determination of neutral ionic or zwitter ionic molecules.
5. Isolation and purification of compounds.
6. Ultra trace to preparative and process scale separations.
7. Qualitative and quantitative method.[6]
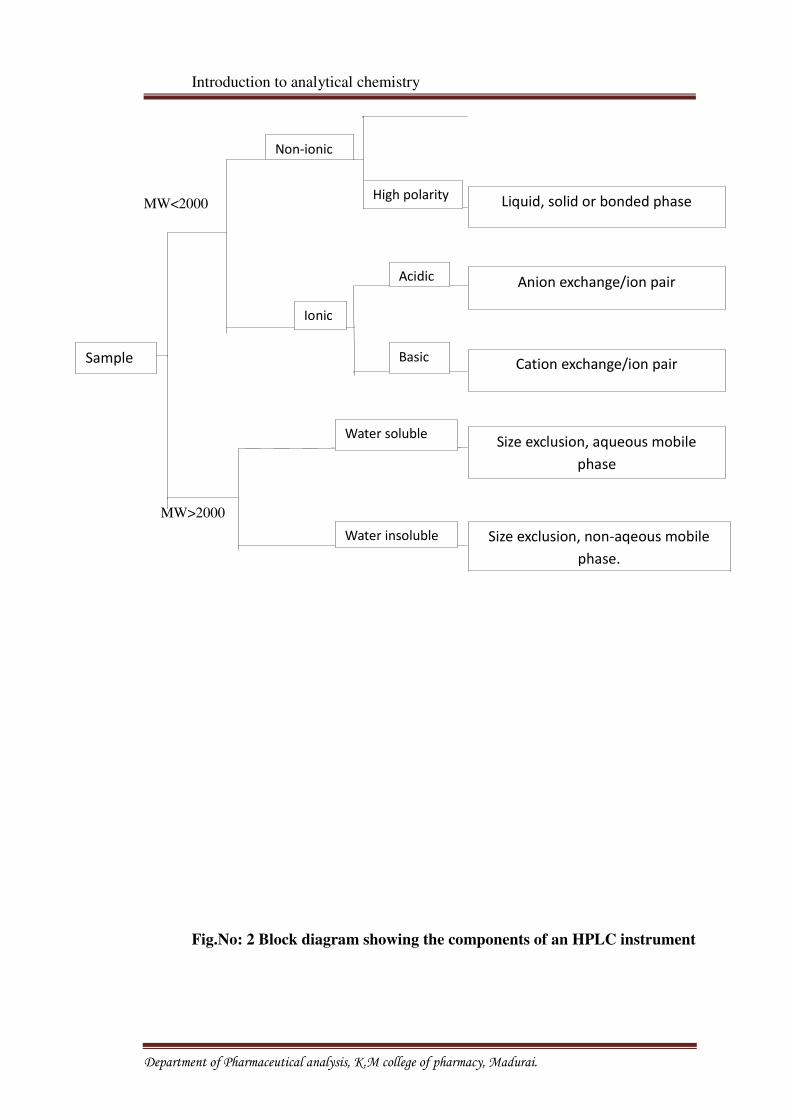
Guide to Liquid Chromatography Mode Selection
Selection of chromatography mode is based upon the analyte polarity, solubility and
ionic nature. [7] A guide to liquid chromatography mode selection is represented in fig no: 1
Fig. No: 1 Guide to Liquid Chromatography Mode Selection Reverse Phase
HPLC
Department of Pharmaceutical analysis, K.M college of pharmacy, Madurai.
Reverse phase, aqueous mobile
phase
Introduction to analytical chemistry
MW<2000
MW>2000
Fig.No: 2 Block diagram showing the components of an HPLC instrument
Department of Pharmaceutical analysis, K.M college of pharmacy, Madurai.
Liquid, solid or bonded phase
Anion exchange/ion pair
Cation exchange/ion pair
Size exclusion, aqueous mobile
phase
Size exclusion, non-aqeous mobile
phase.
Sample
Non-ionic
Ionic
Water soluble
Water insoluble
High polarity
Acidic
Basic
Introduction to analytical chemistry
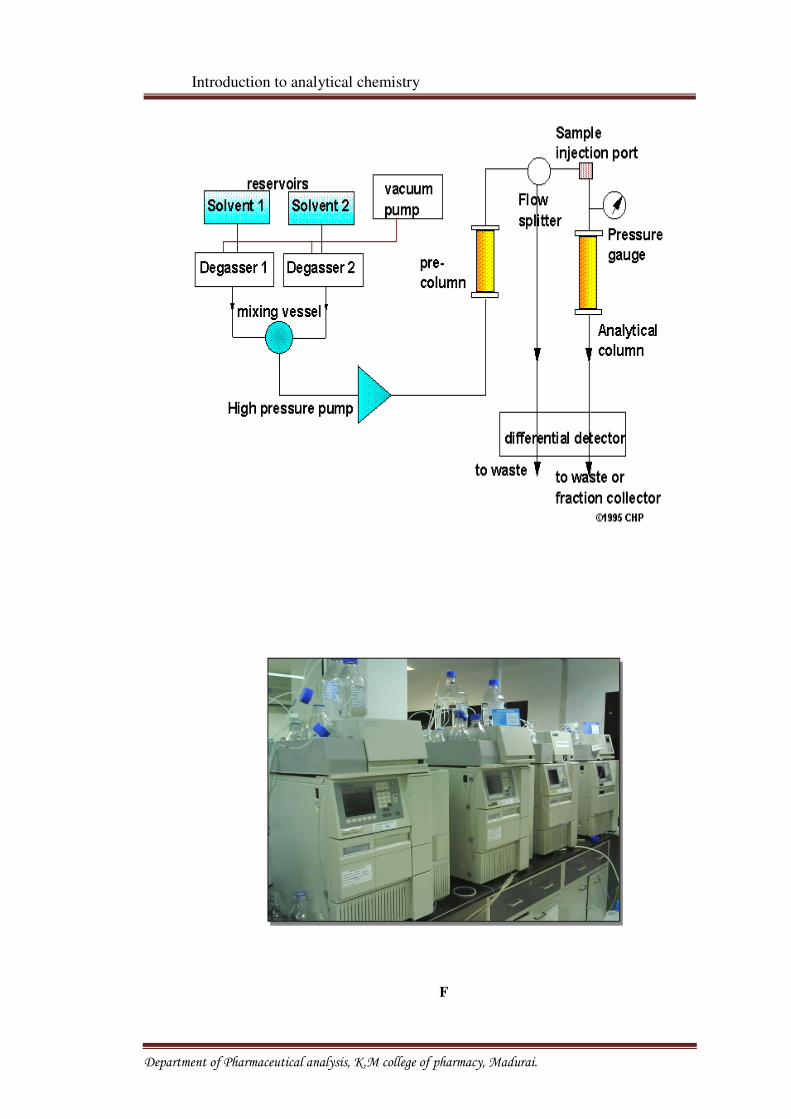
F
Department of Pharmaceutical analysis, K.M college of pharmacy, Madurai.
Introduction to analytical chemistry
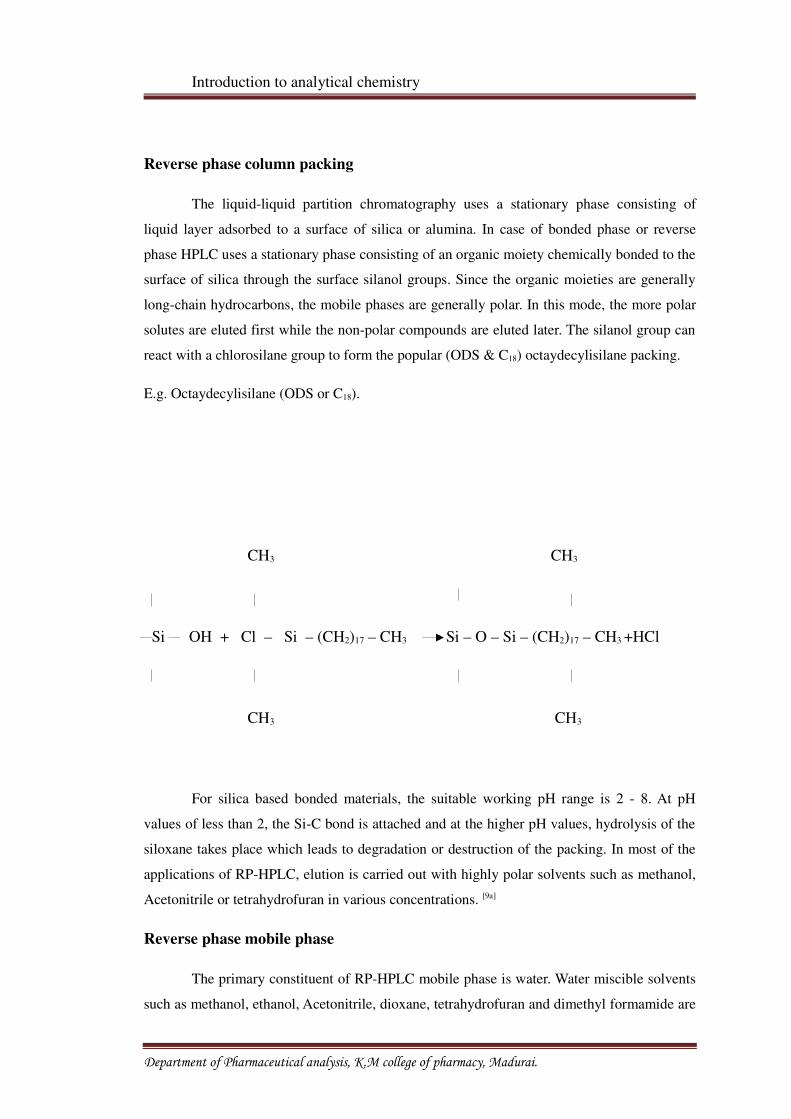
Reverse phase column packing
The liquid-liquid partition chromatography uses a stationary phase consisting of
liquid layer adsorbed to a surface of silica or alumina. In case of bonded phase or reverse
phase HPLC uses a stationary phase consisting of an organic moiety chemically bonded to the
surface of silica through the surface silanol groups. Since the organic moieties are generally
long-chain hydrocarbons, the mobile phases are generally polar. In this mode, the more polar
solutes are eluted first while the non-polar compounds are eluted later. The silanol group can
react with a chlorosilane group to form the popular (ODS & C18) octaydecylisilane packing.
E.g. Octaydecylisilane (ODS or C18).
CH3 CH3
Si OH + Cl – Si – (CH2)17 – CH3 Si – O – Si – (CH2)17 – CH3 +HCl
CH3 CH3
For silica based bonded materials, the suitable working pH range is 2 - 8. At pH
values of less than 2, the Si-C bond is attached and at the higher pH values, hydrolysis of the
siloxane takes place which leads to degradation or destruction of the packing. In most of the
applications of RP-HPLC, elution is carried out with highly polar solvents such as methanol,
Acetonitrile or tetrahydrofuran in various concentrations. [9a]
Reverse phase mobile phase
The primary constituent of RP-HPLC mobile phase is water. Water miscible solvents
such as methanol, ethanol, Acetonitrile, dioxane, tetrahydrofuran and dimethyl formamide are
Department of Pharmaceutical analysis, K.M college of pharmacy, Madurai.
Introduction to analytical chemistry
added to adjust the polarity of the mobile phase. Additionally acids, bases, buffers and/or
ionic surfactants are added. The water should be of high quality, either distilled or
demineralised water.
The most widely used organic modifiers are methanol, Acetonitrile and
tetrahydrofuran. Methanol and Acetonitrile have comparable polarities but Acetonitrile is an
aprotic solvent. Ethanol, 1-propanol and 2-propanol are also useful but less polar than
methanol. Dioxane, tetrahydrofuran are aprotic solvents that are less polar than Acetonitrile.
Reverse phase mobile phases are generally non-flammable due to high water content.
Degassing is quite important with reverse phase mobile phases. [9b]
6. DETECTORS10
The function of the detector in HPLC is to monitor the mobile phase emerging
from the column. The output of the detector is an electrical signal that is proportional
to some property of the mobile phase and/or the solutes.
LC detectors are basically of two types.
Bulk property detectors respond to mobile phase bulk property such as
refractive index, dielectric constant or density. Solute property detectors respond to
some property of solutes, such as UV absorbing, fluorescence, diffusion current,
which are not possessed by the mobile phase
Most common HPLC detectors
• UV-Visible absorbance detector (UV-VIS)
• Photo-diode array detector (PDA)
• Fluorescence detector
• Electrochemical (ECD)
• Refractive Index (RI)
• Mass detectors (MS)
• Conductometric detector
• Chiral detector (Polarimetric & circular dichrosim)
• Evaporative Light scattering detector (ELSD)
• Radiochemical detector
Department of Pharmaceutical analysis, K.M college of pharmacy, Madurai.
Introduction to analytical chemistry
Characteristics of ideal detectors
1. Adequate sensitivity.
2. Good stability and reproducibility.
3. A linear response to analyte.
4. A short response time that is independent of flow rate.
5. High reliability.
6. Minimal internal volume in order to zone broadening. [9c]
Liquid chromatographic detectors are of two basic types,
1. Differential or bulk property detector
2. Selective or solute property detector
Differential or bulk property detector
Differential or bulk property detector provides a differential measurement of a
bulk property that is possessed by both the analyte and the mobile phase.
e.g., Refractive index, dielectric constant.
Selective or solute property detector
Measure the property of an analyte which is not possessed by the mobile
phase.
e.g., UV absorbance, fluorescence.
Department of Pharmaceutical analysis, K.M college of pharmacy, Madurai.
Introduction to analytical chemistry
1.5 ICH GUIDELINES FOR ANALYTICALMETHOD
VALIDATION (11)
Method validation is the process to confirm that the analytical procedure
employed for a specific test is suitable for its intended use. Methods need to be
validated or revalidated,
���� Before their introduction into routine use
���� Whenever the conditions change for which the method has been validated,
e.g., instruments with different characteristics.
���� Whenever the method is changed and the change is outside the original scope
of the method. The International Conference on Harmonization (ICH) of
Technical Requirements for the Registration of Pharmaceutical for human use
has developed a consensus text on the validation of analytical procedures.
REASONS FOR VALIDATION
1. Enables scientists to communicate scientifically and effectively on technical
matters.
2. Setting standards of evaluation procedures for checking complaints and
taking remedial measures
3. Retrospective validation is useful for trend comparison of results compliance
to cGMP/GLP.
4. Closer interaction with pharmacopoeia harmonization particularly in respect
of impurities determination and their limits.
5. For taking appropriate action in case of non – compliance.
Department of Pharmaceutical analysis, K.M college of pharmacy, Madurai.
Introduction to analytical chemistry
6. To provide high degree of confidence that the same level of quality is
consistently built into each unit of finished product from batch to batch.
As quality control process is not static, some form of validation / Verification should
continue till the validated process is in use.
The parameters as defined by the ICH and by other organizations
���� Specificity
���� Selectivity
���� Precision
o Repeatability
o Intermediate precision
o reproducibility
���� Accuracy
���� Linearity
���� Range
���� Limit of detection
���� Limit of quantification
���� Robustness
���� Ruggedness
A) Specificity and selectivityi. Selectivityistheabilitytomeasureaccuratelyandspecificallytheanalyteinthep
resence of components that may be expected to be present in the sample
matrix.
ii. Specificity for an assay ensures that the signal measured comes from the
substance of interest and that there is no interference from excipients
and/or degradation products and/or impurities.
iii. Determination of this can be carried out by assessing the peak identity and
purity.
iv. Diodearray detectors can facilitate the development and validation of
HPLC assays. Spectra] data obtained from diode array detectors,
effectively supplement the retention time data for peak identification,
also spectral manipulation often provides information about the peak
purity. The table below lists several of the techniques available for
assessing peak identity and purity.
v. The purity index is a measure of the peak's relative purity, measured
using a full comparis on of spectral data for the leading and training edge
of the peak. A value of 1.5 is commonly accepted to indicate a pure peak.
Department of Pharmaceutical analysis, K.M college of pharmacy, Madurai.
Introduction to analytical chemistry
But>1.5wouldindicatethepresence of an impurity.
B) Precision
The precision of an analytical procedure expresses the closeness of agreement
between a series of measurement obtained from multiple sampling of the same
homogenous sample under the prescribed conditions. Precision of an analytical
procedure is usually expressed at the variance, standard deviation or coefficient of
variation of a series of measurements.
Validation of tests for assay and for quantitative determination of impurities
includes an investigation of precision.
Precision is a measure of the reproducibility of the whole analytical method
(including sampling, sample preparation and analysis) under normal operating
circumstances. Precision is determined by using the method to assay a sample for a
sufficient number of times to
Obtain statistically valid results (i.e.between6-10). The precision is then expressed
as the relative standard deviation
STDdevx100%
%RSD =
Mean
Repeatability
Express the precision under the same operating conditions over a short interval
of time. Repeatability is also termed as intra - assay precision. It should be assessed
using a minimum of nine determinations covering the specified range for the
procedure (e.g. three concentration/three replicates each) or a minimum of
determinations at 100% of the test concentration.
Intermediate precision
The extent to which intermediate precision should be established depends on
the circumstances under which the procedure is intended to be used. The applicant
should establish the effects of random events on the precision of the analytical
procedure. Typical variations to be studied include days, analysts, equipment, etc.
Department of Pharmaceutical analysis, K.M college of pharmacy, Madurai.
Introduction to analytical chemistry
Reproducibility
Reproducibility is assessed by means of an inter-laboratory trial.
Reproducibility should be considered in case of the standardization of an analytical
procedure, for instance inclusion of procedures in Pharmacopoeias.
C) Accuracy
The accuracy of an analytical procedure expresses the closeness of agreement
between the value which is accepted either as a conventional true value or on an
accepted reference value and the value found.
Assay
- Assay of Active Substance
- Assay of Medicinal products
Several methods are available to determine the accuracy.
a) Application of an analytical procedure to an analyte of known purity (e.g.
reference material).
b) Comparison of the results of the proposed analytical procedure with those of a
second well-characterized procedure, the accuracy of which is stated and/or
defined (independent procedure)
c) Application of the analytical procedure to synthetic mixtures of the product
components to which known quantities of the substance to be analyzed have
been added.
Impurity (Quantification)
Accuracy should be assessed on sample (substance /products) spiked with
known amounts of impurities. It should be clear how the individual or total impurities
are to be determined.
E.g. Weight / Weight or area percent.
D) Linearity and range
Department of Pharmaceutical analysis, K.M college of pharmacy, Madurai.
Introduction to analytical chemistry
Linearity of an analytical procedure is its ability (with in a given range) to
obtain test results which are directly proportional to the concentration (amount) of
analyte in the sample.
Linearity should be evaluated by visual inspection of a plot of signals as a
function of analyte concentration or content. If there is a linear relationship, test
results should be evaluated by appropriate statistical methods. For example,
calculation of a regression line by the method of least square. Therefore data from
regression line itself may be helpful to provide mathematical estimates of the degree
of linearity.
o Range of an analytical procedure is the interval between the upper and
lower concentration (amounts) of analyte in the sample including these
concentrations for which it has been demonstrated that the analytical
procedure has a suitable level of precision, accuracy and linearity.
The following minimum specified ranges should be considered
• For the assay of an active substance or a finished product normally from 80-
120 percent of the test concentration.
• For the content uniformity, covering a minimum of 70-130 percent of the test
concentration.
• For dissolution testing, 20% over the specified range (e.g.), If the
specifications for a controlled release product cover a region from 20% after 1
hour, upto 90% after 24 hours, the validated range would be 0-110% of label
claim.
• For the determination of an impurity, the reporting level of an impurity to
120% of the specifications.
E) Limit of Detection
The detection limit is determined by the analysis of samples with known
concentration of analyte and by establishing that minimum level at which the analyte
can reliably detected.
i. Based on visual evaluation
Visual evaluation may be used for non-instrumental methods but may be used
with instrumental methods.
Department of Pharmaceutical analysis, K.M college of pharmacy, Madurai.
Introduction to analytical chemistry
ii. Based on signal to noise ratio
Determination of the signal-to-noise ratio is performed by comparing
measured signals from samples with known low concentrations of analyte with those
of blank samples and establishing the minimum concentration at which the analyte
can be reliably detected. A signal-to-noise ratio 3 or 2:1is generally considered
acceptable for estimating the detection limit.
iii. Based on the standard deviation of the response and the slope
The detection limit (DL) may be expressed as
D L = 3.3/S
Where,
σ = the standard deviation of the response
S = the slope of the calibration curve
The slope, S may be estimated from the calibration curve of the analyte. The
estimate of σ may be carried out in a variety of ways.
a. Based on the Standard Deviation of the Blank
Measurement of the magnitude of analytical background response is
performed by analyzing an appropriate number of blank samples and calculating the
standard deviation of these responses.
b. Based on the calibration curve
A specific calibration curve should be studied using samples containing an
analyte in the range of DL. The residual standard deviation of a regression line or the
standard deviation of y-intercept of regression lines may be used as the standard
deviation
F) Limit of Quantification
The quantification limit is generally determined by the analysis of samples
with known concentrations of analyte and by establishing the minimum level at which
the analyte can be quantified with acceptable accuracy and precision
i. Based on visual evaluation
Visual evaluation may be used for non-instrumental methods but may also be
used with instrumental methods.
Department of Pharmaceutical analysis, K.M college of pharmacy, Madurai.
Introduction to analytical chemistry
ii. Based on Signal- to-Noise ratio
Determination of the Signal-to-Noise ratio is performed by comparing
measured signals from samples with known low concentrations of analyte with those
of blank samples and by establishing the minimum concentration at which the analyte
can be reliably quantified. A typical Signal- to-Noise ratio is 10:1.
iii. Based on the Standard Deviation of the Response and the slope
The quantification limit (Q L) may be expressed as
QL=10σ
S
Where,
σ = the standard deviation of the response
S = the slope of the calibration curve
The slope S may be estimated from the calibration curve of the analyte. The
estimation may be carried out in a variety of ways including,
a. Based on standard deviation of the blank
Measurement of the magnitude of analytical background response is performed
by an appropriate number of blank samples and calculating the standard deviation of
these responses.
b. Based on the Calibration Curve
A specific calibration curve should be studied using samples containing an
analyte in the range of QL. The residual standard deviation of a regression line or the
standard deviation of y-intercepts of regression lines may be used as the standard
deviation
G) Robustness
The evaluation of robustness should be considered during the development
phase and depends on the type of procedure under study. It should show the
reliability of an analysis with respect to deliberate variations in method parameters.
Examples of typical variations are
� Stability of analytical solutions.
� Extraction time.
In case of liquid chromatography, examples of typical are
Department of Pharmaceutical analysis, K.M college of pharmacy, Madurai.
Introduction to analytical chemistry
• Influence of variation of pH in a mobile phase,
• Influence of variations in mobile phase composition,
• Different columns (different lots and / or suppliers),
• Temperature,
• Flow rate.
In the case of gas-chromatography, examples of typical variations are
• Different columns (different lots and/or suppliers),
• Temperature,
• Flow rate.
F) Ruggedness
The United States pharmacopoeia (USP) define ruggedness as the degree of
reproducibility of test results obtained by the analysis of the same samples under a
variety of normal test conditions such as different labs, different analysis, different
lots of reagents etc. Ruggedness is a measure of reproducibility of test results under
normal expected operational conditions from laboratory to laboratory and from
analyst to analyst.
Department of Pharmaceutical analysis, K.M college of pharmacy, Madurai.
Drug profile
2. DRUG PROFILE
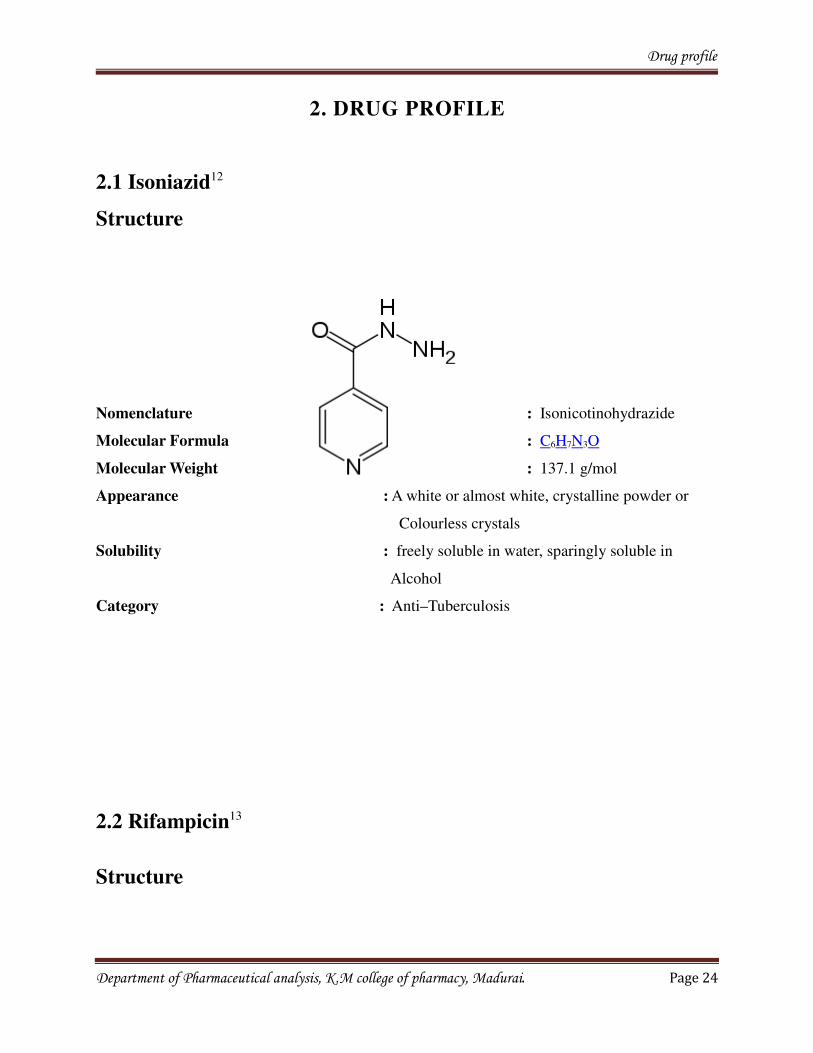
2.1 Isoniazid12
Structure
Nomenclature : Isonicotinohydrazide
Molecular Formula : C6H7N3O
Molecular Weight : 137.1 g/mol
Appearance : A white or almost white, crystalline powder or
Colourless crystals
Solubility : freely soluble in water, sparingly soluble in
Alcohol
Category : Anti–Tuberculosis
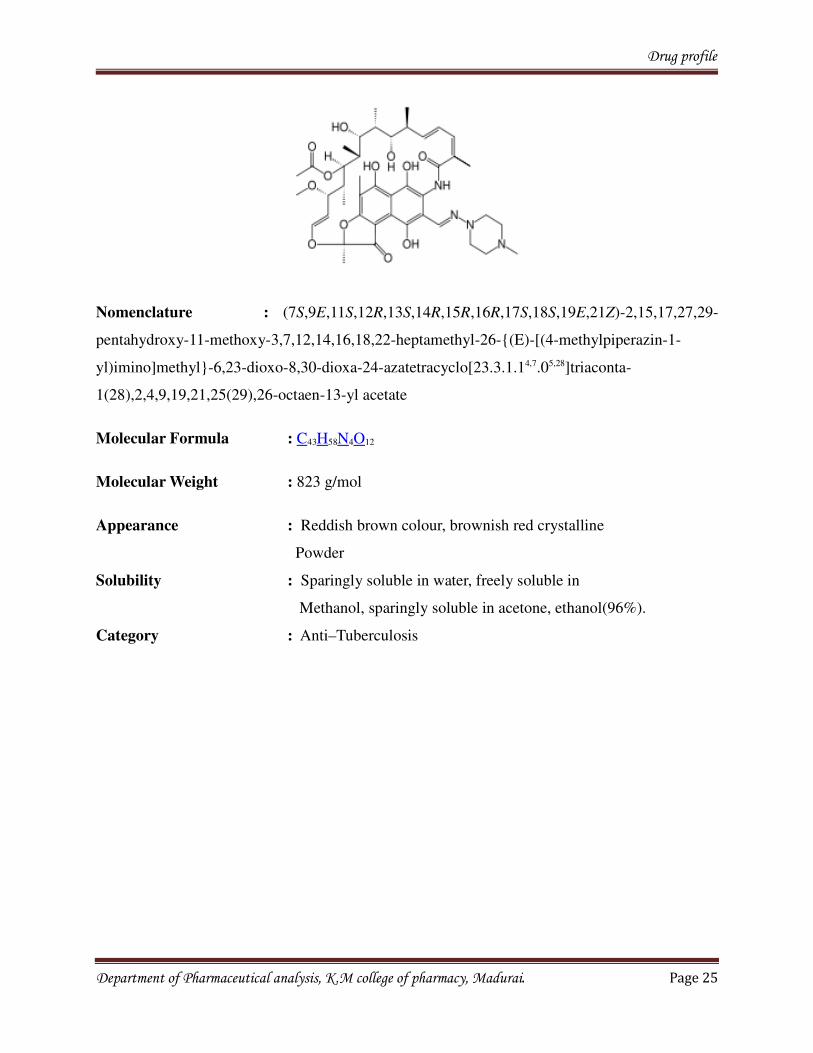
2.2 Rifampicin13
Structure
Department of Pharmaceutical analysis, K.M college of pharmacy, Madurai. Page 24
Drug profile
Nomenclature : (7S,9E,11S,12R,13S,14R,15R,16R,17S,18S,19E,21Z)-2,15,17,27,29-
pentahydroxy-11-methoxy-3,7,12,14,16,18,22-heptamethyl-26-{(E)-[(4-methylpiperazin-1-
yl)imino]methyl}-6,23-dioxo-8,30-dioxa-24-azatetracyclo[23.3.1.14,7.05,28]triaconta-
1(28),2,4,9,19,21,25(29),26-octaen-13-yl acetate
Molecular Formula : C43H58N4O12
Molecular Weight : 823 g/mol
Appearance : Reddish brown colour, brownish red crystalline
Powder
Solubility : Sparingly soluble in water, freely soluble in
Methanol, sparingly soluble in acetone, ethanol(96%).
Category : Anti–Tuberculosis
Department of Pharmaceutical analysis, K.M college of pharmacy, Madurai. Page 25
Literature Review
3. REVIEW OF LITERATURE
Shah Y, et al.,14 developed a liquid chromatographic procedure for the analysis of Rifampicin
(RIF) and Isoniazid (ISN) in pharmaceutical dosage forms utilizing reverse phase
chromatography. Isolation of analytes was carried out under isocratic condition with an
octaydecylisilane column and an aqueous mobile phase containing methanol (75%) and 0.02M
disodium hydrogen orthophosphate (25%) with pH 4.5 was adjusted with orthophosphoric acid.
The detection was done at 254mm. The method was unique in analysing Rifampicin precisely in
liquid combination with Isoniazid particularly in liquid formulation. The method was specific
and could distinctly isolate the degradation product in suspension.
Glass BD, et al.,15developed a stability – indicating HPLC method for the simultaneously
determination of Rifampicin, Isoniazid and pyrazinamide in a fixed dose combination. The best
separation and reasonable short retention times were produced on the micro bondapak C18,
4.6x250 mm column, 10 microns/125 using ACN:tBAH (42.5:57.5, v/v) (0.0002M) as the
mobile phase with optimized rate at final pH.
Caller E, et al.,16 developed and validated simple and accurate liquid chromatographic method
for estimation of Isoniazid (ISN), pyrazinamide (PZA) and Rifampicin (RIF) in combined
dosage forms. Drugs were chromatographed on a reverse phase C18 column using a mobile phase
gradient and monitored at the corresponding maximum of each compounds. The method was
linear (r2>0.999), précised (RSD%:0.50 % for ISN, 0.12% for PYR and 0.98% for RIF), accurate
(overall average recovery yields 98.55% for ISN, 98.51 for PYR and 98.56 for RIF) and
selective.
Department of Pharmaceutical analysis, K.M college of pharmacy, Madurai. Page 26
Literature Review
Mohan B, et al.,17 reported USP gradient HPLC method for quantitative determination of
Rifampicin, Isoniazid and pyrazinamide in fixed dose combination (FDC) formulations to
determine its ability to resolve major degradation products of Rifampicin, viz 3-formylrifamycin
SV, Rifampicin N-oxide, 25-desacetyl Rifampicin, Rifampicin quinine andisonicotinylhydrazone
an interaction product of 3-formylrifamycin and Isoniazid. The first observation was that the
requirements of theoretical plates listed in the given method were met for Rifampicin, but not for
Isoniazid and pyrazinamide even on columns of different makes. The resolving power of the
method was also dependent upon make of the column. On two of the three columns of the three
tested, it was able to resolve most degradation products, except Rifampicin N-oxide and 25 –
desacetylRifampicin, which were overlapping. The method was modified and an overall
satisfactory resolution for all components was obtained by changing the buffer organic modifier
ratio of solution B in the gradient from 45:55 to 55:45 and decreasing the flow rate from 1.5 to
1.0 ml/min, keeping all other conditions constant.
Panchangul R, et al., 18 developed a reversed phase HPLC method for the simultaneous
estimation of Rifampicin and its main metabolite in plasma and urine in presence of
pyrazinamide and Isoniazid. The assay involved simple liquid extraction of drug, metabolite and
internal standard (rifapentine) from biological specimens and their subsequent separation on aC18
reversed phase column and single wave length UV detection. In plasma as well as in urine
samples, all the three compounds of interest eluted within 17 min, using methanol: sodium
phosphate buffer (pH 5.2:0.01mm) (65.35, v/v) as mobile phase under isocratic conditions. It
was established that Isoniazid, pyrazinamide and ascorbic acid (added to prevent oxidative
degradation of analytes) did not interfere with the analyte peaks. Recoveries (extraction
efficiency) for drug were greater than 90 % in both plasma and urine, whereas for metabolite the
values were found to be 79 and 86 % in plasma and urine respectively. The plasma and urine
methods were précised and accurate for both the analytes. The method developed was proved to
be suitable for simultaneous estimation of Rifampicin and desacetylRifampicin in plasma and
urine samples.
Department of Pharmaceutical analysis, K.M college of pharmacy, Madurai. Page 27
Literature Review
Smith PJ, et al.,19developed simple and sensitive high performance liquid chromatographic
(HPLC) method suitable for assaying RIF, INH and PZA in bio availability studies. RIF,
desacetylRifampicin (DRIF), INH and PZA were extracted simultaneously from plasma using a
solid phase extraction column. RIF and DRIF were quantitated by using an 80% Acetonitrile
10.1% trifluoroacetic acid (TFA) as mobile phase and C8 reversed phase column .INH and PZA
were also quantitated by using C8 reversed phase column, but mobile phase was 3% Acetonitrile
10.6% TFA. Mean recovery of RIF, DRIF and PZA from plasma was well over90% and over
70% for INH. Calibration graphs were linear for all the drugs in their therapeutic range.
Correlation coefficients were all above 0.9995.
Khuhawar MY, et al., 20 developed liquid chromatographic method for determination of
Isoniazid, Pyrazinamide andRifampicin from pharmaceutical preparations and blood. Isoniazid
(ISN), pyrazinamide (PZA) and Rifampicin (RIF) were separated on YMC ODS column. ISN
was derivated with 2 – fluorence – carboxaldehyde (FCA). The separation was achieved using
ethanol – chloroform – Acetonitrile water by isocratic elution and detected at 337mm. The
detection limits were 0.11 ng, 0.2 ng and 113 ng/ injection (5 µ l) for ISN, PZA and RIF,
respectively. The method of analysis was applied to the pharmaceutical preparations and in the
blood samples of the patients suffering from tuberculosis after undergoing chemotherapy with
ISN, PZA and RIF. The amounts quantitated in blood showed 0/97 to 1.58 µg/ml ISN, 3.44 to
409 µg/ml Pz and 1.98 to 3.5 µg/ml RIF with coefficient of variations 0.8 – 1.8%, 0.9 – 1.3%
and 0.8 – 2% respectively.
Ali. J, et al., 21 developed simple, selective, and précised and stability indicating high
performance thin layer chromatographic (HPILC) method. The compounds were separated an
aluminium backed silica gel 60 F254 plates with r-hexane: 2-propanal: acetone: ammonia:
formic acid, 3:3.8:2.8:0.3:0.1 (v/v) as mobile phase. The correlation coefficients were 0.994 and
0.997 for Isoniazid and Rifampicin respectively. The values of slope and intercept of the
calibration plots were 3.755 +/_ 0.22 and 3099.1+/_ 51.21 respectively, for Isoniazid and 4.0957
Department of Pharmaceutical analysis, K.M college of pharmacy, Madurai. Page 28
Literature Review
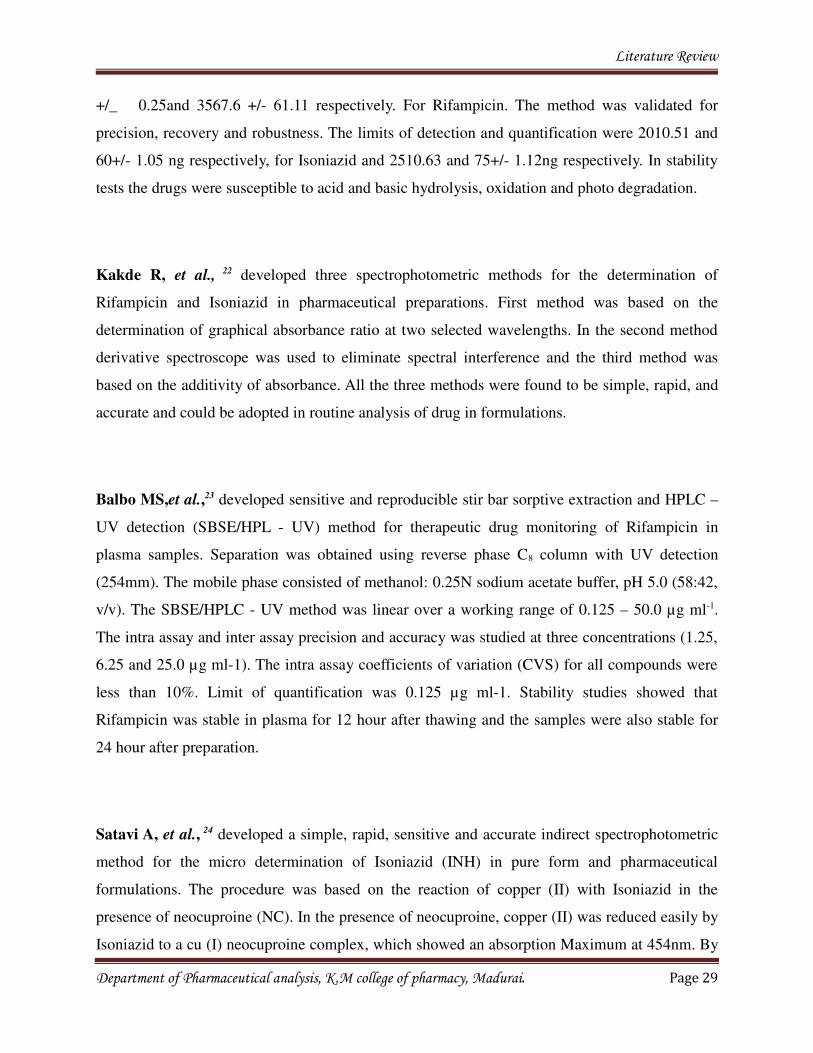
+/_ 0.25and 3567.6 +/- 61.11 respectively. For Rifampicin. The method was validated for
precision, recovery and robustness. The limits of detection and quantification were 2010.51 and
60+/- 1.05 ng respectively, for Isoniazid and 2510.63 and 75+/- 1.12ng respectively. In stability
tests the drugs were susceptible to acid and basic hydrolysis, oxidation and photo degradation.
Kakde R, et al., 22 developed three spectrophotometric methods for the determination of
Rifampicin and Isoniazid in pharmaceutical preparations. First method was based on the
determination of graphical absorbance ratio at two selected wavelengths. In the second method
derivative spectroscope was used to eliminate spectral interference and the third method was
based on the additivity of absorbance. All the three methods were found to be simple, rapid, and
accurate and could be adopted in routine analysis of drug in formulations.
Balbo MS,et al.,23 developed sensitive and reproducible stir bar sorptive extraction and HPLC –
UV detection (SBSE/HPL - UV) method for therapeutic drug monitoring of Rifampicin in
plasma samples. Separation was obtained using reverse phase C8 column with UV detection
(254mm). The mobile phase consisted of methanol: 0.25N sodium acetate buffer, pH 5.0 (58:42,
v/v). The SBSE/HPLC - UV method was linear over a working range of 0.125 – 50.0 µg ml-1.
The intra assay and inter assay precision and accuracy was studied at three concentrations (1.25,
6.25 and 25.0 µg ml-1). The intra assay coefficients of variation (CVS) for all compounds were
less than 10%. Limit of quantification was 0.125 µg ml-1. Stability studies showed that
Rifampicin was stable in plasma for 12 hour after thawing and the samples were also stable for
24 hour after preparation.
Satavi A, et al., 24 developed a simple, rapid, sensitive and accurate indirect spectrophotometric
method for the micro determination of Isoniazid (INH) in pure form and pharmaceutical
formulations. The procedure was based on the reaction of copper (II) with Isoniazid in the
presence of neocuproine (NC). In the presence of neocuproine, copper (II) was reduced easily by
Isoniazid to a cu (I) neocuproine complex, which showed an absorption Maximum at 454nm. By
Department of Pharmaceutical analysis, K.M college of pharmacy, Madurai. Page 29
Literature Review
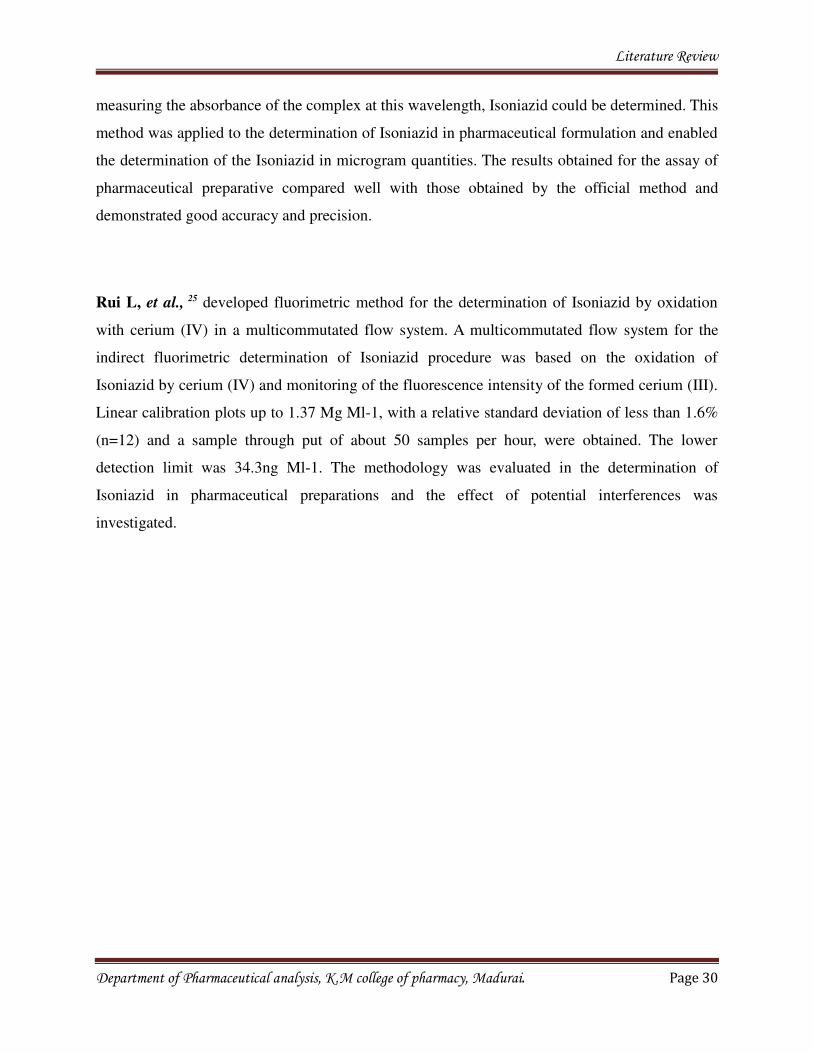
measuring the absorbance of the complex at this wavelength, Isoniazid could be determined. This
method was applied to the determination of Isoniazid in pharmaceutical formulation and enabled
the determination of the Isoniazid in microgram quantities. The results obtained for the assay of
pharmaceutical preparative compared well with those obtained by the official method and
demonstrated good accuracy and precision.
Rui L, et al., 25 developed fluorimetric method for the determination of Isoniazid by oxidation
with cerium (IV) in a multicommutated flow system. A multicommutated flow system for the
indirect fluorimetric determination of Isoniazid procedure was based on the oxidation of
Isoniazid by cerium (IV) and monitoring of the fluorescence intensity of the formed cerium (III).
Linear calibration plots up to 1.37 Mg Ml-1, with a relative standard deviation of less than 1.6%
(n=12) and a sample through put of about 50 samples per hour, were obtained. The lower
detection limit was 34.3ng Ml-1. The methodology was evaluated in the determination of
Isoniazid in pharmaceutical preparations and the effect of potential interferences was
investigated.
Department of Pharmaceutical analysis, K.M college of pharmacy, Madurai. Page 30
Aim and Plan of Work
4. AIM AND PLAN OF WORK
Aim and scope
Isoniazid and Rifampicin is official in I.P, B.P, and U.S.P. From the literature survey,
it was found that there were only few RP-HPLC methods reported for the estimation of Isoniazid and
Rifampicin in pharmaceutical dosage forms.
Hence, the aim of present work is to develop RP-HPLC method for estimation of
Isoniazid and Rifampicin from the tablet dosage form and to validate the developed RP-
HPLC method by validation parameters as per ICH guidelines.
Plan of present work
� Method development (By reverse phase HPLC).
� Validation of the developed method (By using following parameters).
a. System suitability studies
b. Accuracy
c. Precision
d. Linearity
e. Specificity
f. Robustness
g. Limit of detection
h. Limit of quantification
Department of Pharmaceutical analysis, K.M college of pharmacy, Madurai. Page
Materials and Instrument used
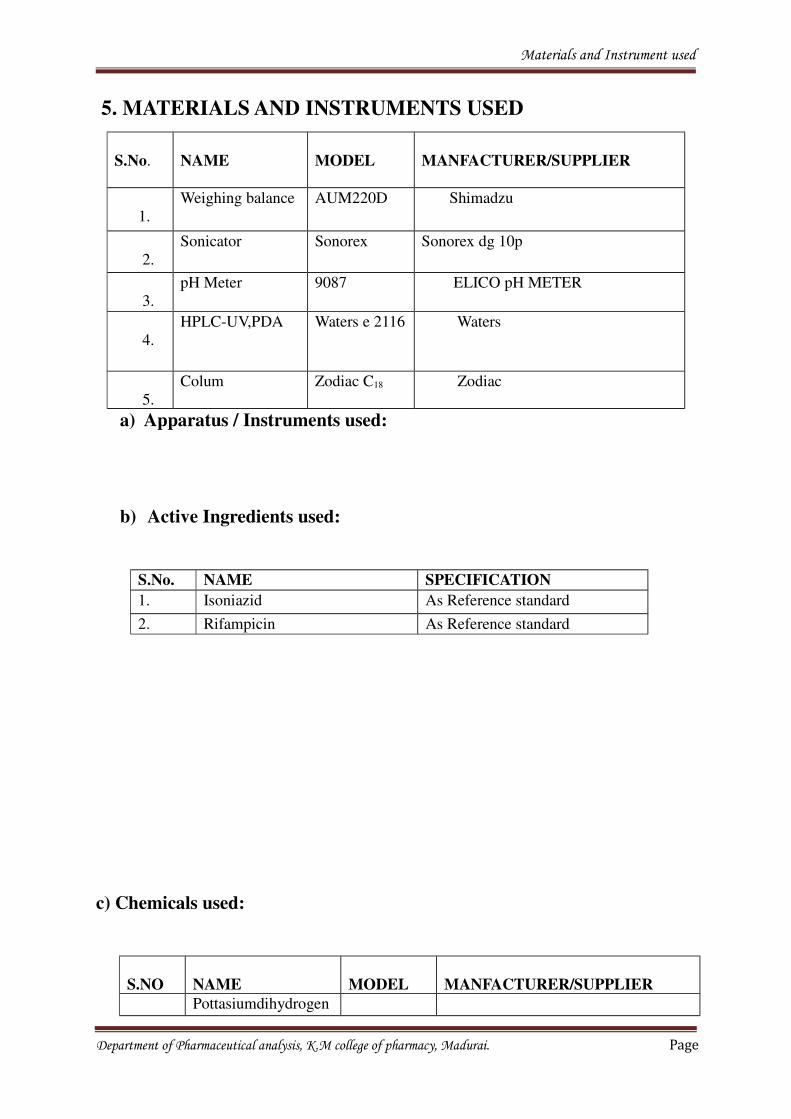
5. MATERIALS AND INSTRUMENTS USED
S.No. NAME MODEL MANFACTURER/SUPPLIER
1.
Weighing balance AUM220D Shimadzu
2.
Sonicator Sonorex Sonorex dg 10p
3.
pH Meter 9087 ELICO pH METER
4.
HPLC-UV,PDA Waters e 2116 Waters
5.
Colum Zodiac C18 Zodiac
a) Apparatus / Instruments used:
b) Active Ingredients used:
S.No. NAME SPECIFICATION
1. Isoniazid As Reference standard
2. Rifampicin As Reference standard
c) Chemicals used:
S.NO NAME MODEL MANFACTURER/SUPPLIER
Pottasiumdihydrogen
Department of Pharmaceutical analysis, K.M college of pharmacy, Madurai. Page
Materials and Instrument used
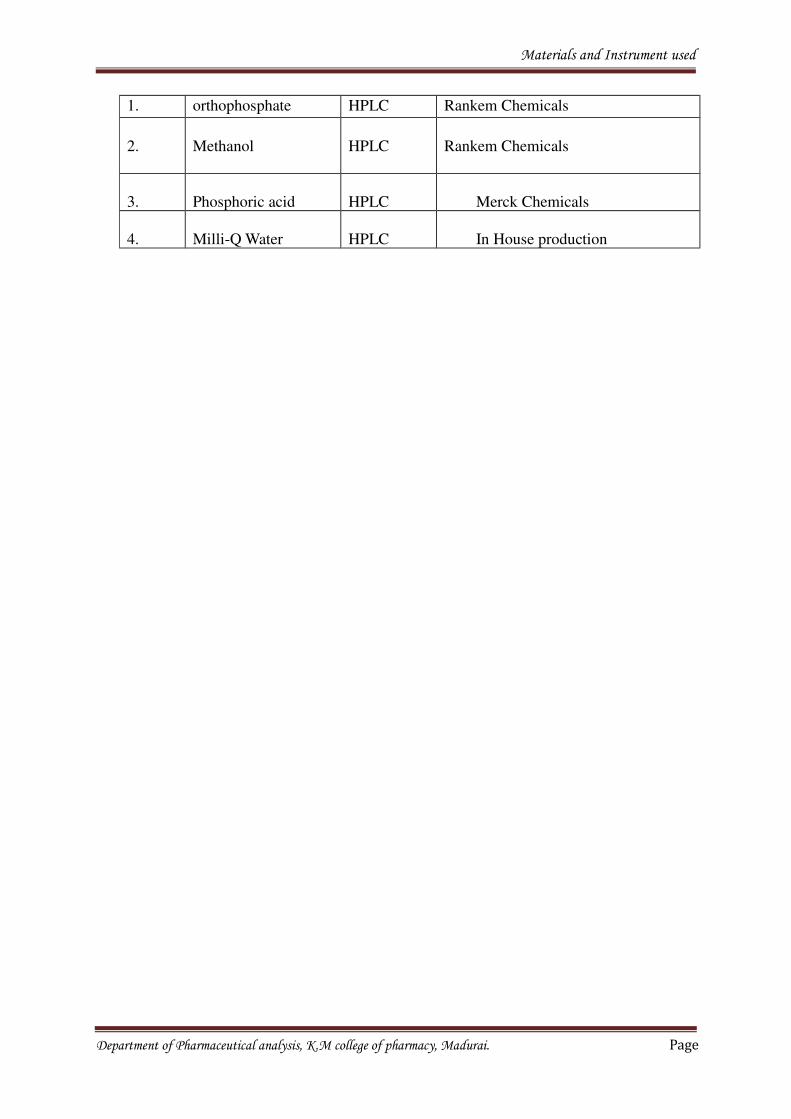
1. orthophosphate HPLC Rankem Chemicals
2. Methanol HPLC Rankem Chemicals
3. Phosphoric acid HPLC Merck Chemicals
4. Milli-Q Water HPLC In House production
Department of Pharmaceutical analysis, K.M college of pharmacy, Madurai. Page
Method Development
6. RP-HPLC METHOD DEVELOPMENT
In case of analytical method development and for drugs analysts should decide whether
the given analytical method is suitable for the assay of the drug. The method development of new
improved method usually trailers existing approaches and instrumentation to the current analyte,
as well as to the final needs or requirements of the method.
In the development stage, decision regarding choice of column, mobile phase, detectors
and method of quantitation must be addressed. In this way, development considers all the
parameters pertaining to any methods.
.
(1) Selection of stationary phase
Proper selection of the stationary phase depends up on the nature of the sample
andchemical profile. The drug selected for the present study was polar compound and could be
separated either by normal phase chromatography or reverse phase chromatography.
From literature survey, it was found that different C18columns could be appropriately used
for the separation ofIsoniazid and Rifampicin.
(2) Selection of wavelength
The sensitivity of the HPLC depends upon the selection of detection wavelength. An
ideal wavelength is one that gives good response for both drugs to be detected. The wavelength
for measurement was selected as 263 nm from the absorption spectrum.
(3) Selection of mobile phase
The mobile phase was selected andchromatograms were recorded, trails were done on
Isoniazid and Rifampicin.
ASSAY METHOD DEVELOPMENT
Department of Pharmaceutical analysis, K.M college of pharmacy, Madurai. Page 34
Method Development
The objective of this experiment was to optimize the assay method for simultaneous
estimation of Isoniazid and Rifampicinbased on the literature survey made and the methods
given in pharmacopoeia. Trials done for optimization were as follows:
Trials
Buffer preparation: 17.418 gm of Potassium Hydrogen Orthophosphate was mixed with
1000 ml of Mille-Q water and shaked for 15min and degassed.
Trial 1:
Mobile phase A : Potassium Hydrogen Orthophosphate
Mobile phase B : Methanol
Chromatographic conditions
Column : Agilent Zorbax Sb-C18, (4.6 × 250 mm, 5 µ)
Detector wavelength : 263 and 274 nm
Column temperature : 30 0C
Injection Volume : 10 µl
Flow rate : 1.0 ml/min
Runtime : 15 min
Department of Pharmaceutical analysis, K.M college of pharmacy, Madurai. Page 35
Method Development
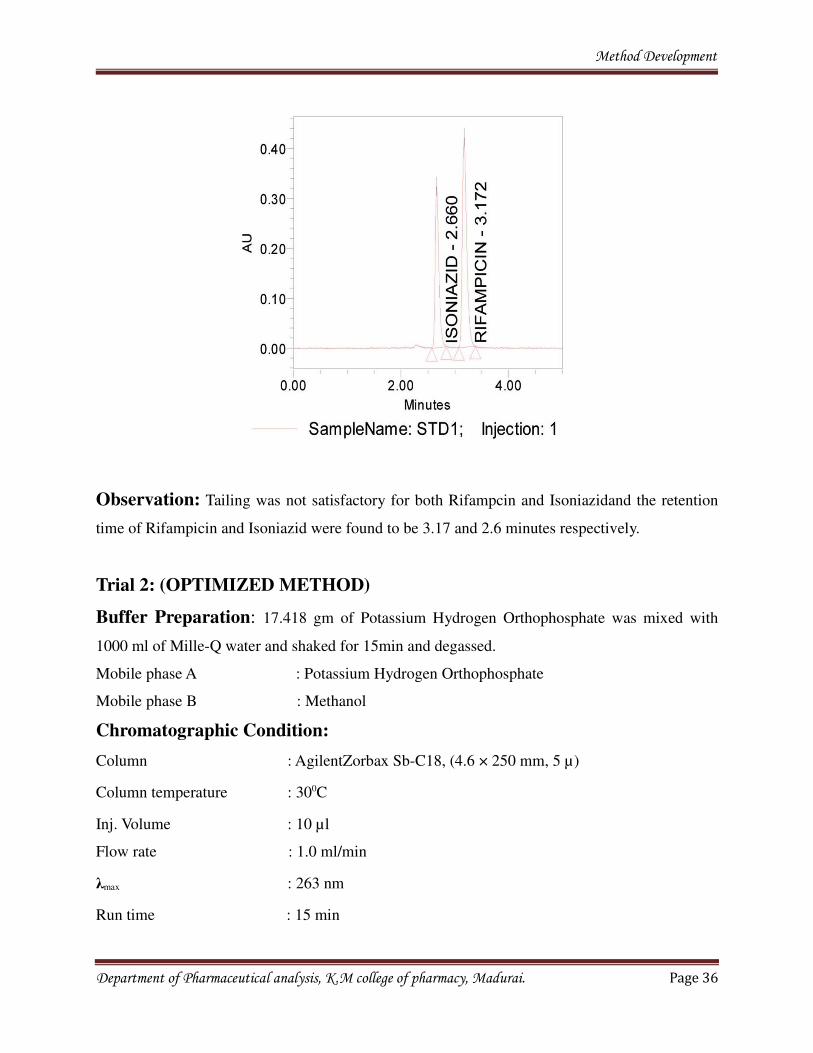
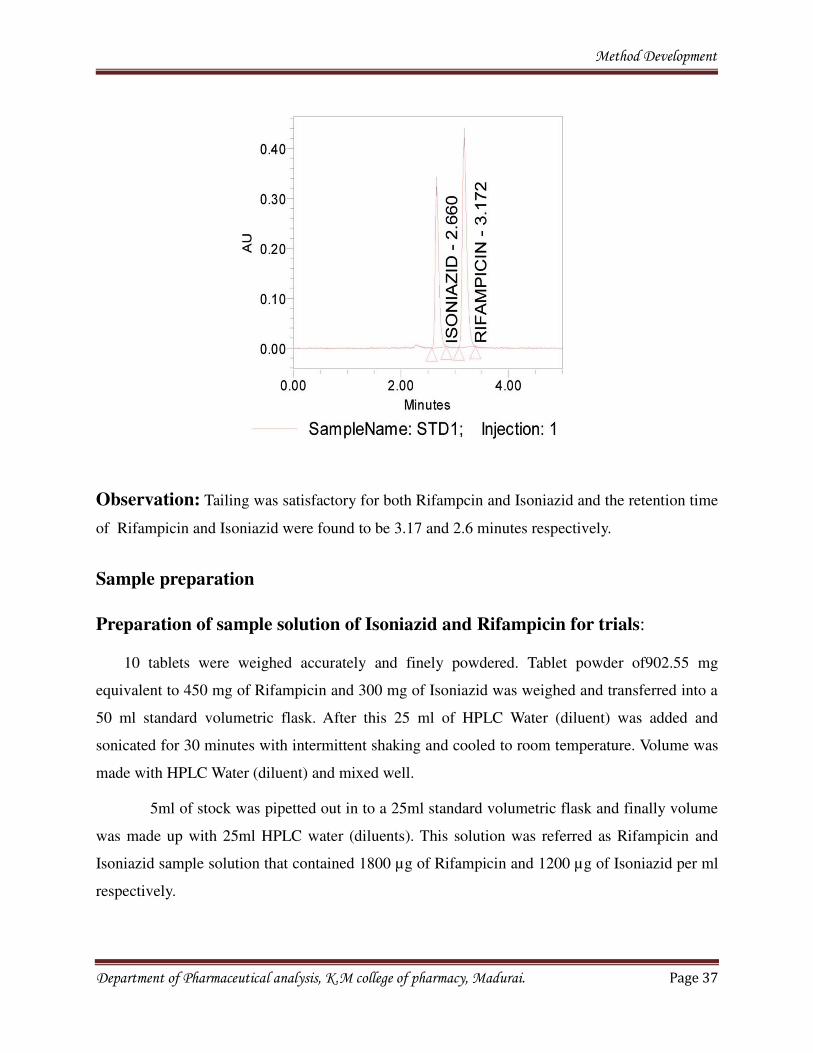
Observation: Tailing was not satisfactory for both Rifampcin and Isoniazidand the retention
time of Rifampicin and Isoniazid were found to be 3.17 and 2.6 minutes respectively.
Trial 2: (OPTIMIZED METHOD)
Buffer Preparation: 17.418 gm of Potassium Hydrogen Orthophosphate was mixed with
1000 ml of Mille-Q water and shaked for 15min and degassed.
Mobile phase A : Potassium Hydrogen Orthophosphate
Mobile phase B : Methanol
Chromatographic Condition:
Column : AgilentZorbax Sb-C18, (4.6 × 250 mm, 5 µ)
Column temperature : 300C
Inj. Volume : 10 µl
Flow rate : 1.0 ml/min
λmax : 263 nm
Run time : 15 min
Department of Pharmaceutical analysis, K.M college of pharmacy, Madurai. Page 36
Method Development
Observation: Tailing was satisfactory for both Rifampcin and Isoniazid and the retention time
of Rifampicin and Isoniazid were found to be 3.17 and 2.6 minutes respectively.
Sample preparation
Preparation of sample solution of Isoniazid and Rifampicin for trials:
10 tablets were weighed accurately and finely powdered. Tablet powder of902.55 mg
equivalent to 450 mg of Rifampicin and 300 mg of Isoniazid was weighed and transferred into a
50 ml standard volumetric flask. After this 25 ml of HPLC Water (diluent) was added and
sonicated for 30 minutes with intermittent shaking and cooled to room temperature. Volume was
made with HPLC Water (diluent) and mixed well.
5ml of stock was pipetted out in to a 25ml standard volumetric flask and finally volume
was made up with 25ml HPLC water (diluents). This solution was referred as Rifampicin and
Isoniazid sample solution that contained 1800 µg of Rifampicin and 1200 µg of Isoniazid per ml
respectively.
Department of Pharmaceutical analysis, K.M college of pharmacy, Madurai. Page 37
Method Development
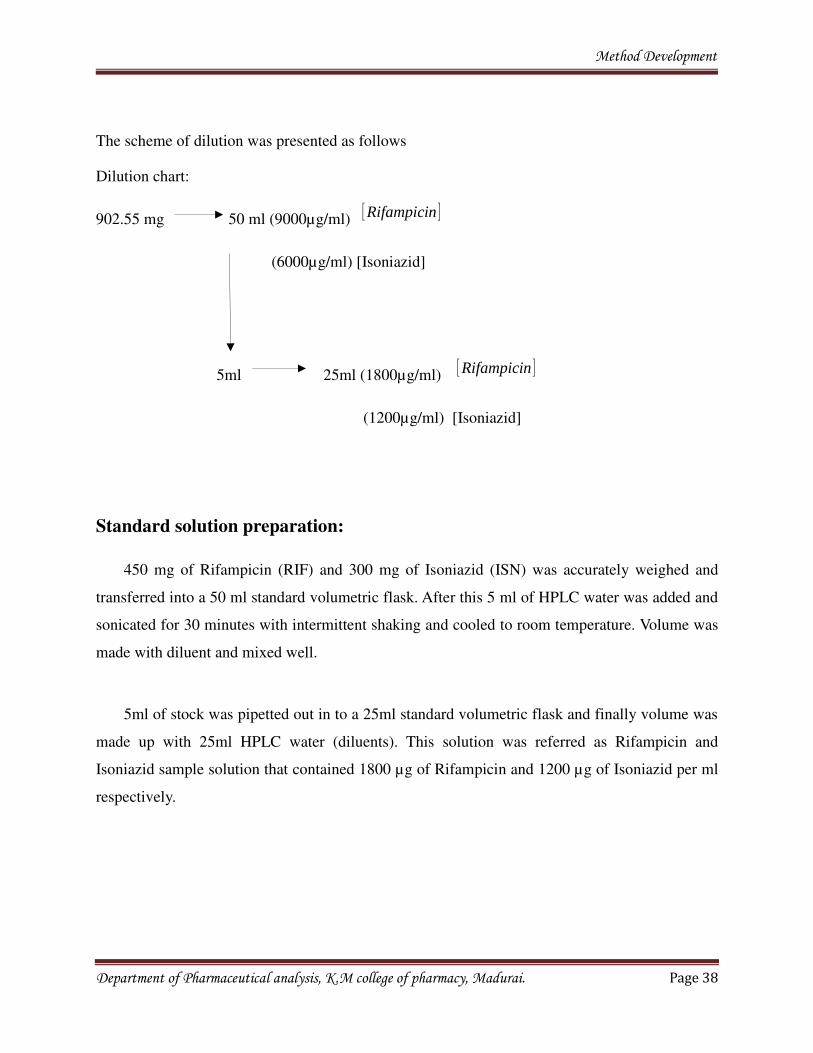
The scheme of dilution was presented as follows
Dilution chart:
902.55 mg 50 ml (9000µg/ml) [Rifampicin ]
(6000µg/ml) [Isoniazid]
5ml 25ml (1800µg/ml) [Rifampicin ]
(1200µg/ml) [Isoniazid]
Standard solution preparation:
450 mg of Rifampicin (RIF) and 300 mg of Isoniazid (ISN) was accurately weighed and
transferred into a 50 ml standard volumetric flask. After this 5 ml of HPLC water was added and
sonicated for 30 minutes with intermittent shaking and cooled to room temperature. Volume was
made with diluent and mixed well.
5ml of stock was pipetted out in to a 25ml standard volumetric flask and finally volume was
made up with 25ml HPLC water (diluents). This solution was referred as Rifampicin and
Isoniazid sample solution that contained 1800 µg of Rifampicin and 1200 µg of Isoniazid per ml
respectively.
Department of Pharmaceutical analysis, K.M college of pharmacy, Madurai. Page 38
Method Development
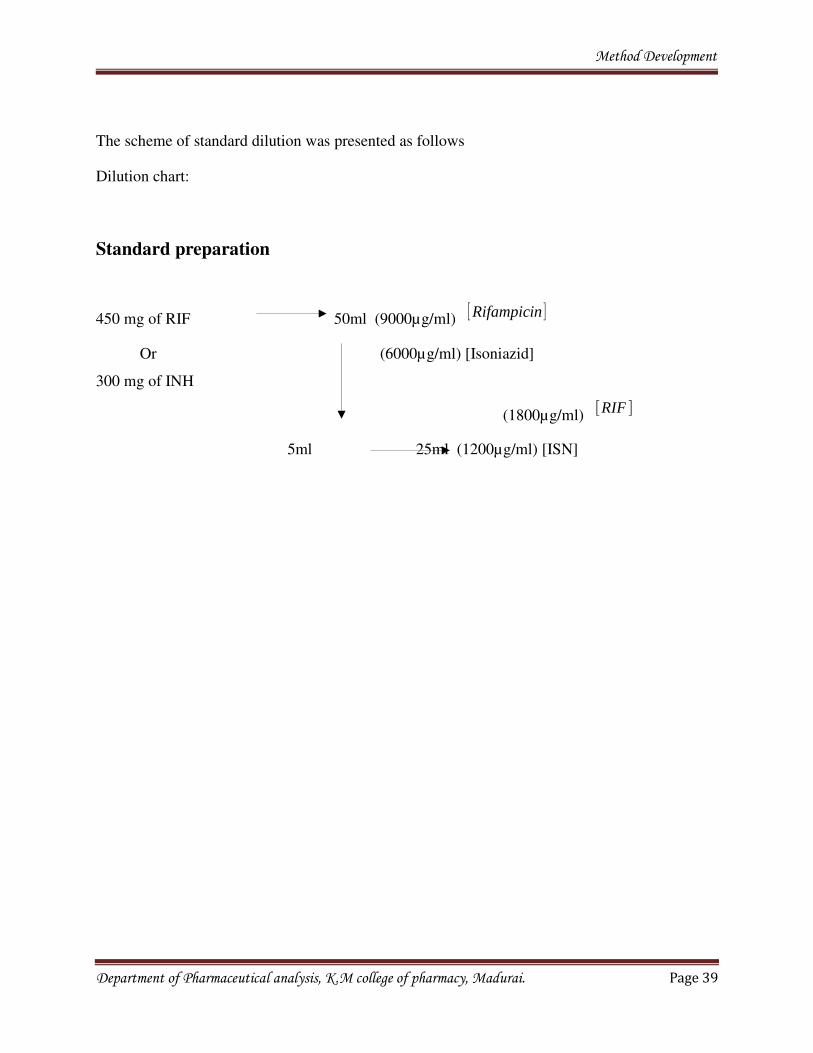
The scheme of standard dilution was presented as follows
Dilution chart:
Standard preparation
450 mg of RIF 50ml (9000µg/ml) [Rifampicin ]
Or (6000µg/ml) [Isoniazid]
300 mg of INH
(1800µg/ml)[RIF ]
5ml 25ml (1200µg/ml) [ISN]
Department of Pharmaceutical analysis, K.M college of pharmacy, Madurai. Page 39
Method Validation
7. METHOD VALIDATION
VALIDATION
According to ICH guidelines method validation can be defined as “Establishing documented
evidence, which provides a high degree of assurance that a specific activity will consistently
produce a desired result or product meeting its predetermined specifications and quality
characteristics”.Such validated analytical method for qualitative and quantitative testing of the drug
molecule assume greater importance when they are employed to generate quality and safety
compliance data during development, pre-formulation studies and post approval of drug products.
The ICH of Technical Requirements for the Registration of Pharmaceutical for human use
has developed a consensus text on the validation of analytical procedures. The document includes
definitions for eight validation characteristics
Parameters Used for Assay Validation
The validation of the assay procedure was carried out using the following parameters.
1) Parameters:
1.1 System suitability
1.2 Specificity
1.3 Method Precision
1.4 Linearity & range
1.5 Accuracy / Recovery studies
1.6 Robustness
Department of Pharmaceutical analysis, K.M college of pharmacy, Madurai. Page 40
Method Validation
PREPARATION OF STANDARD AND SAMPLE SOLUTION:
STANDARD PREPARATION:
Buffer Preparation: 17.418 gm of Potassium Hydrogen Orthophosphate was mixed
with 1000 ml of Mille-Q water and shaked for 15min and degassed.
Mobile phase A : Potassium Hydrogen Orthophosphate
Mobile phase B : Methanol
Chromatographic Condition:
Column : Agilent Zorbax Sb-C18, (4.6 × 250 mm, 5 µ)
Column temperature : 300C
Inj. Volume : 10 µl
Flow rate : 1.0 ml/min
λmax : 263 nm
Runtime : 15
Sample preparation
Preparation of sample solution of Isoniazid and Rifampicin for trials:
10 tablets were weighed accurately and finely powdered. Tablet powder of 902.55 mg
equivalent to 450 mg of Rifampicin and 300 mg of Isoniazid was weighed and transferred into a 50
ml standard volumetric flask. After this 25 ml of HPLC Water (diluent) was added and sonicated
for 30 minutes with intermittent shaking and cooled to room temperature. Volume was made with
HPLC Water (diluent) and mixed well.
5ml of stock waspipetted out in to a 25ml standard volumetric flask and finally volume was
made up with 25ml HPLC water (diluents). This solution was referred as Rifampicin and Isoniazid
sample solution that contained 1800 µg of Rifampicin and 1200 µg of Isoniazid per ml
respectively.
Department of Pharmaceutical analysis, K.M college of pharmacy, Madurai. Page 41
Method Validation
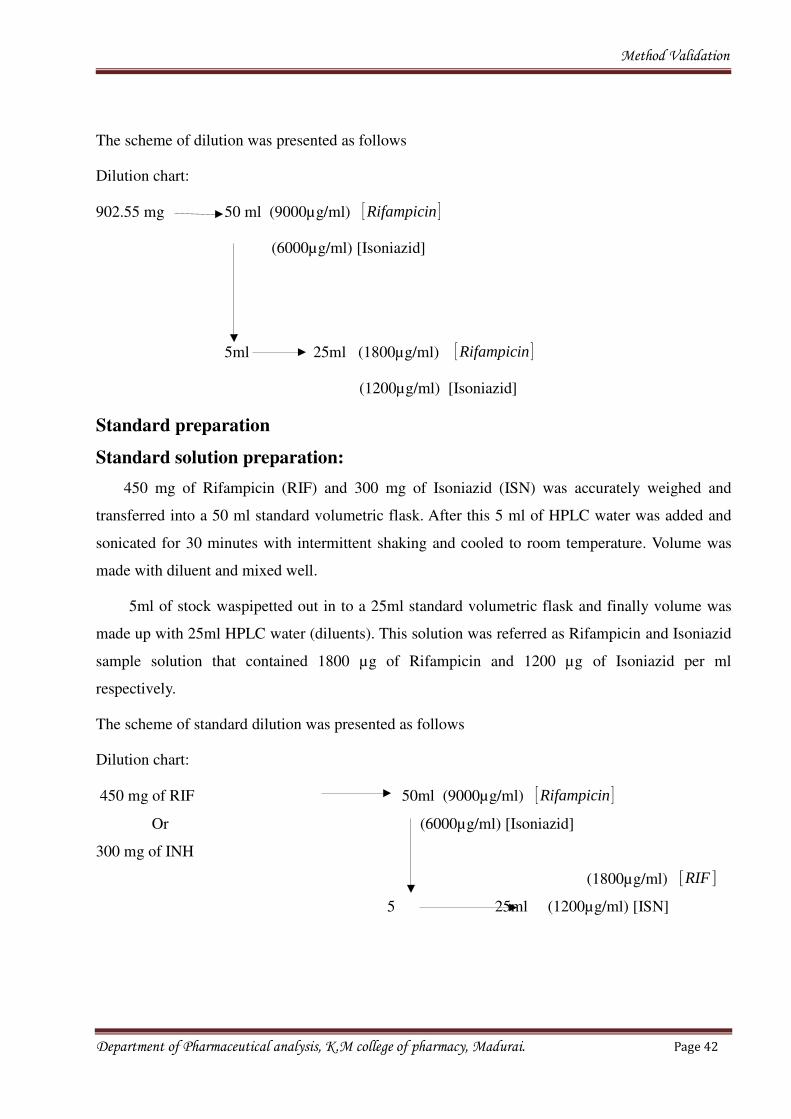
The scheme of dilution was presented as follows
Dilution chart:
902.55 mg 50 ml (9000µg/ml) [Rifampicin ]
(6000µg/ml) [Isoniazid]
5ml 25ml (1800µg/ml) [Rifampicin ]
(1200µg/ml) [Isoniazid]
Standard preparation
Standard solution preparation:
450 mg of Rifampicin (RIF) and 300 mg of Isoniazid (ISN) was accurately weighed and
transferred into a 50 ml standard volumetric flask. After this 5 ml of HPLC water was added and
sonicated for 30 minutes with intermittent shaking and cooled to room temperature. Volume was
made with diluent and mixed well.
5ml of stock waspipetted out in to a 25ml standard volumetric flask and finally volume was
made up with 25ml HPLC water (diluents). This solution was referred as Rifampicin and Isoniazid
sample solution that contained 1800 µg of Rifampicin and 1200 µg of Isoniazid per ml
respectively.
The scheme of standard dilution was presented as follows
Dilution chart:
450 mg of RIF 50ml (9000µg/ml) [Rifampicin ]
Or (6000µg/ml) [Isoniazid]
300 mg of INH
(1800µg/ml) [RIF ]
5 25ml (1200µg/ml) [ISN]
Department of Pharmaceutical analysis, K.M college of pharmacy, Madurai. Page 42
Method Validation
SYSTEM SUITABILITY
System suitability is the checking of a system to ensure system performance before or during
the analysis of unknowns. Before performing any validation experiment, HPLC method and the
procedure should be capable of providing data of acceptable quality. These tests are to verify that
the resolution and repeatability of the system are adequate for the analysis to be performed. It is
based on the concept that equipment, electronics, analytical operations and sample constitute an
integral system that can be evaluated as a whole. System suitability parameters and
recommendations were shown in the table no.3
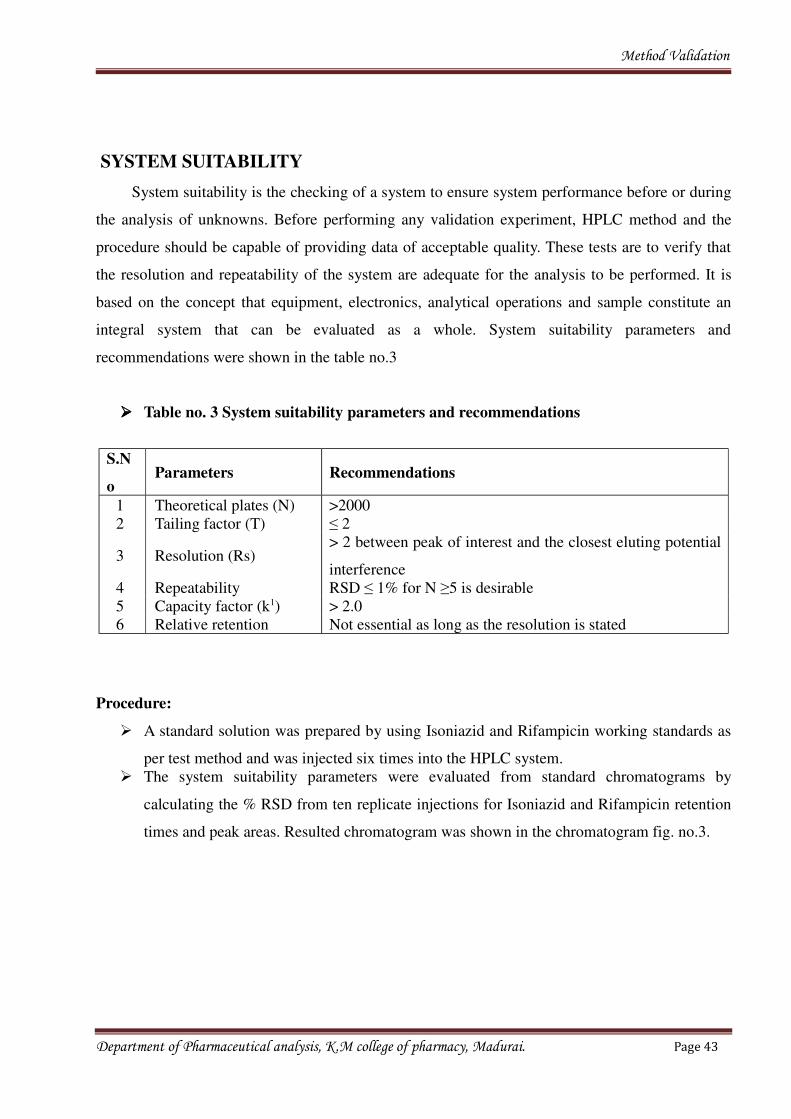
���� Table no. 3 System suitability parameters and recommendations
S.N
oParameters Recommendations
1 Theoretical plates (N) >2000
2 Tailing factor (T) ≤ 2
3 Resolution (Rs)> 2 between peak of interest and the closest eluting potential
interference
4 Repeatability RSD ≤ 1% for N ≥5 is desirable
5 Capacity factor (k1) > 2.0
6 Relative retention Not essential as long as the resolution is stated
Procedure:
� A standard solution was prepared by using Isoniazid and Rifampicin working standards as
per test method and was injected six times into the HPLC system.
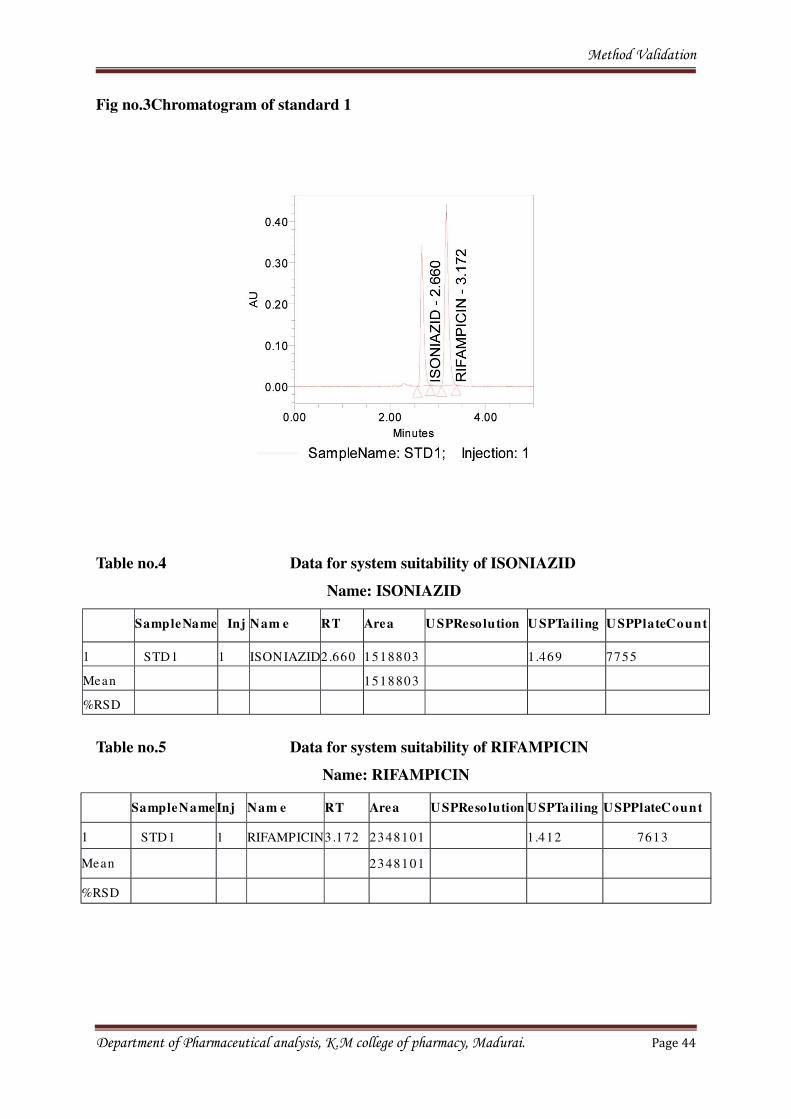
� The system suitability parameters were evaluated from standard chromatograms by
calculating the % RSD from ten replicate injections for Isoniazid and Rifampicin retention
times and peak areas. Resulted chromatogram was shown in the chromatogram fig. no.3.
Department of Pharmaceutical analysis, K.M college of pharmacy, Madurai. Page 43
Method Validation
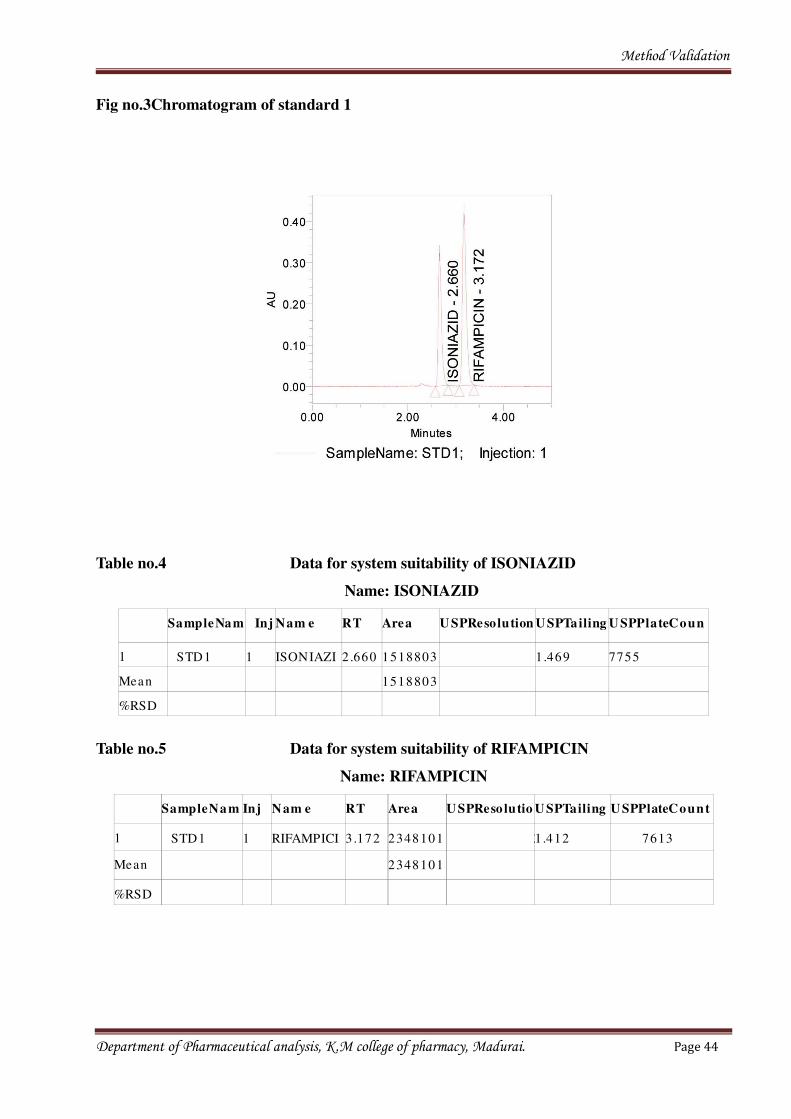
Fig no.3Chromatogram of standard 1
Table no.4 Data for system suitability of ISONIAZID
Name: ISONIAZID
SampleNam
e
Inj Nam e RT Area U SPResolution U SPTailing U SPPlateCoun
t1 STD1 1 ISONIAZI 2 .660 1518803 1.469 7755
Mean 1518803
%RSD
Table no.5 Data for system suitability of RIFAMPICIN
Name: RIFAMPICIN
SampleNa m Inj Nam e RT Area U SPReso lutio U SPTailing U SPPlateCount
1 STD1 1 RIFAMPICI 3 .172 2348101 31.412 7613
Mean 2348101
%RSD
Department of Pharmaceutical analysis, K.M college of pharmacy, Madurai. Page 44
Method Validation
Fig no.3Chromatogram of standard 1
Table no.4 Data for system suitability of ISONIAZID
Name: ISONIAZID
SampleName Inj Nam e RT Area U SPReso lution U SPTailing U SPPlateCount
1 STD1 1 ISONIAZID2.660 1518803 1.469 7755
Mean 1518803
%RSD
Table no.5 Data for system suitability of RIFAMPICIN
Name: RIFAMPICIN
SampleName Inj Nam e RT Area U SPReso lution USPTailing USPPlateCount
1 STD1 1 RIFAMPICIN3.172 2348101 31.412 7613
Mean 2348101
%RSD
Department of Pharmaceutical analysis, K.M college of pharmacy, Madurai. Page 44
Method Validation
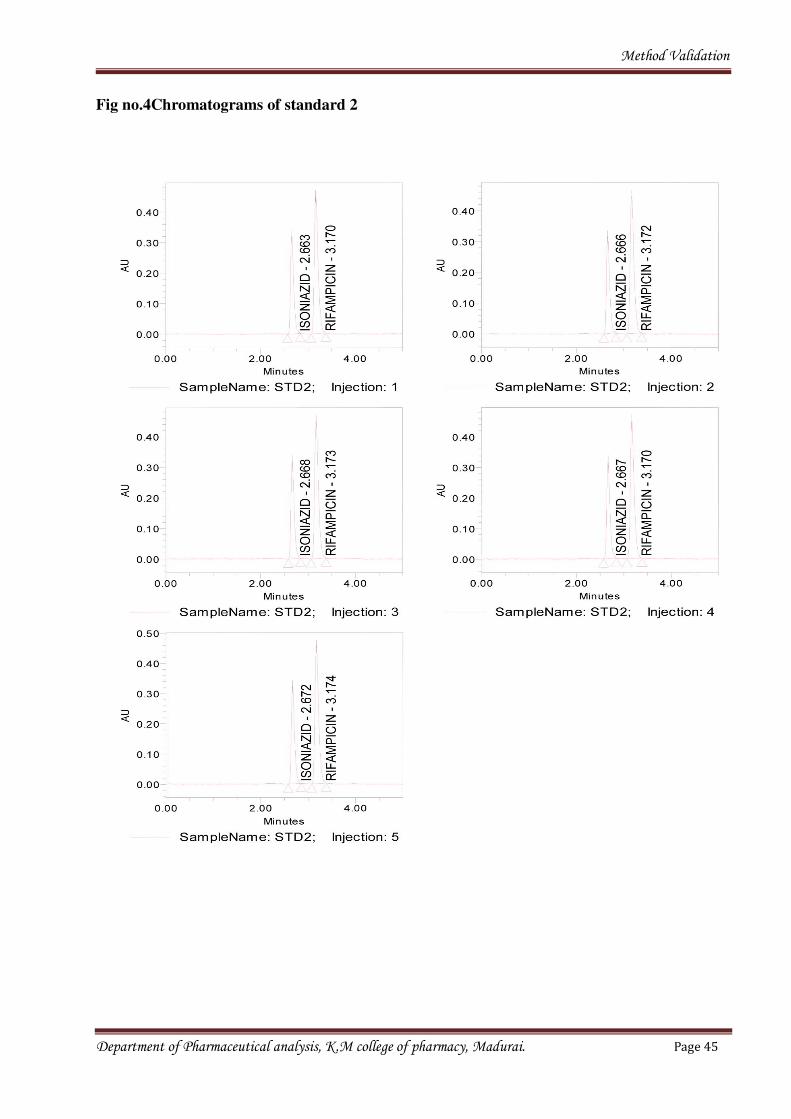
Fig no.4Chromatograms of standard 2
Department of Pharmaceutical analysis, K.M college of pharmacy, Madurai. Page 45
Method Validation
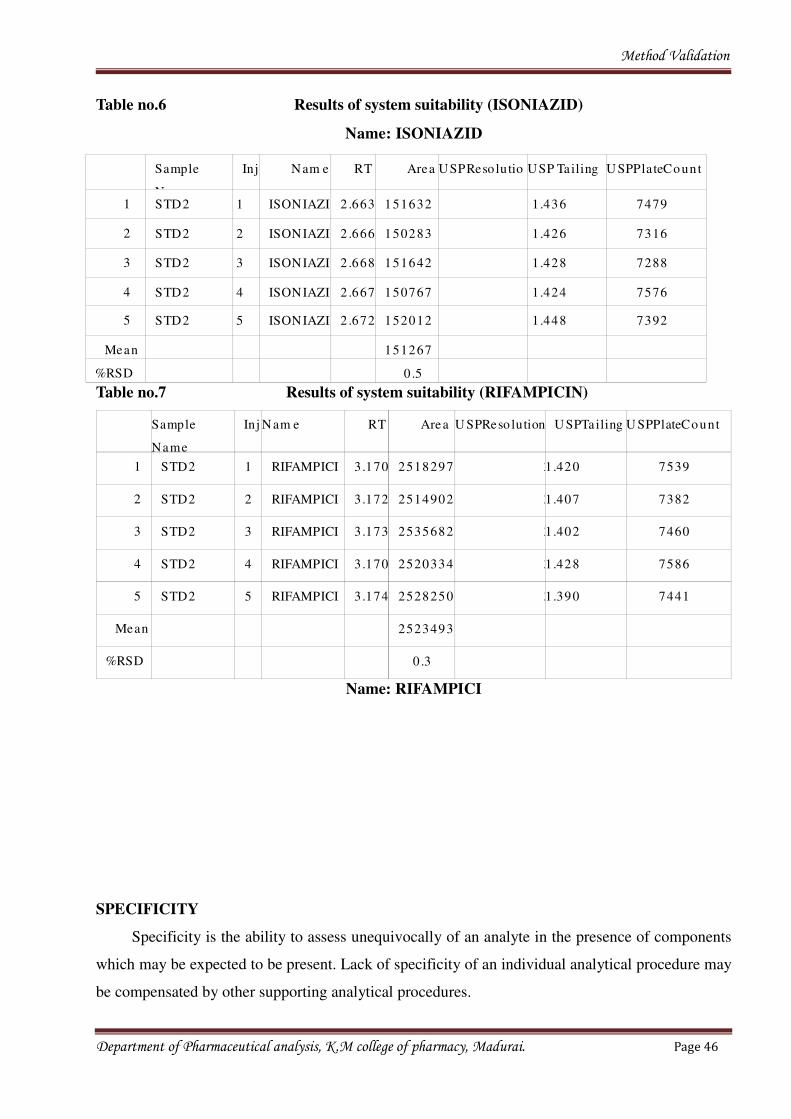
Table no.6 Results of system suitability (ISONIAZID)
Name: ISONIAZID
Table no.7 Results of system suitability (RIFAMPICIN)
Sample
Name
Inj Nam e RT Area U SPReso lution U SPTailing U SPPlateCo unt
1 STD2 1 RIFAMPICI
N
3.170 2518297 3
4
1.420 7539
2 STD2 2 RIFAMPICI
N
3.172 2514902 3
9
1.407 7382
3 STD2 3 RIFAMPICI
N
3.173 2535682 3
3
1.402 7460
4 STD2 4 RIFAMPICI
N
3.170 2520334 3
1
1.428 7586
5 STD2 5 RIFAMPICI
N
3.174 2528250 3
0
1.390 7441
Mean 2523493
%RSD 0 .3
Name: RIFAMPICI
SPECIFICITY
Specificity is the ability to assess unequivocally of an analyte in the presence of components
which may be expected to be present. Lack of specificity of an individual analytical procedure may
be compensated by other supporting analytical procedures.
Department of Pharmaceutical analysis, K.M college of pharmacy, Madurai. Page 46
Sample
Name
Inj Nam e RT Area USPReso lutio
n
USP Tailing U SPPlateCo unt
1 STD2 1 ISONIAZI 2 .663 151632 1.436 7479
2 STD2 2 ISONIAZI 2 .666 150283 1.426 7316
3 STD2 3 ISONIAZI 2 .668 151642 1.428 7288
4 STD2 4 ISONIAZI 2 .667 150767 1.424 7576
5 STD2 5 ISONIAZI 2 .672 152012 1.448 7392
Mean 151267
%RSD 0 .5
Method Validation
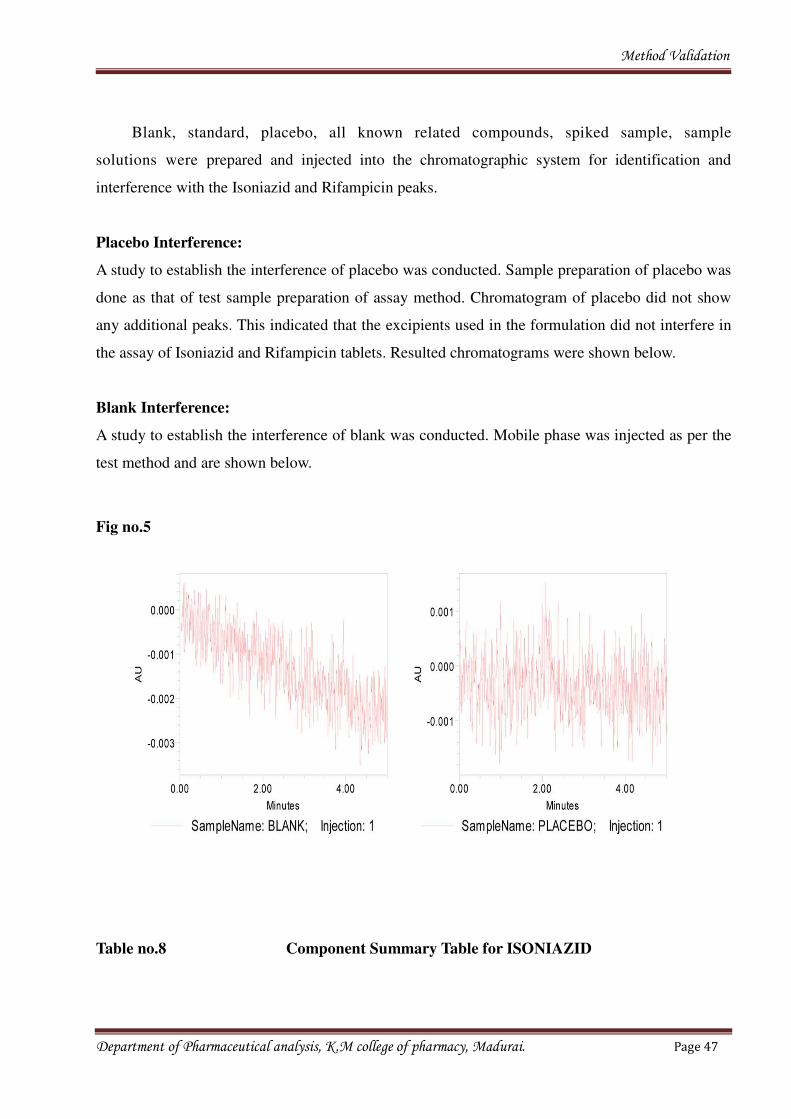
Blank, standard, placebo, all known related compounds, spiked sample, sample
solutions were prepared and injected into the chromatographic system for identification and
interference with the Isoniazid and Rifampicin peaks.
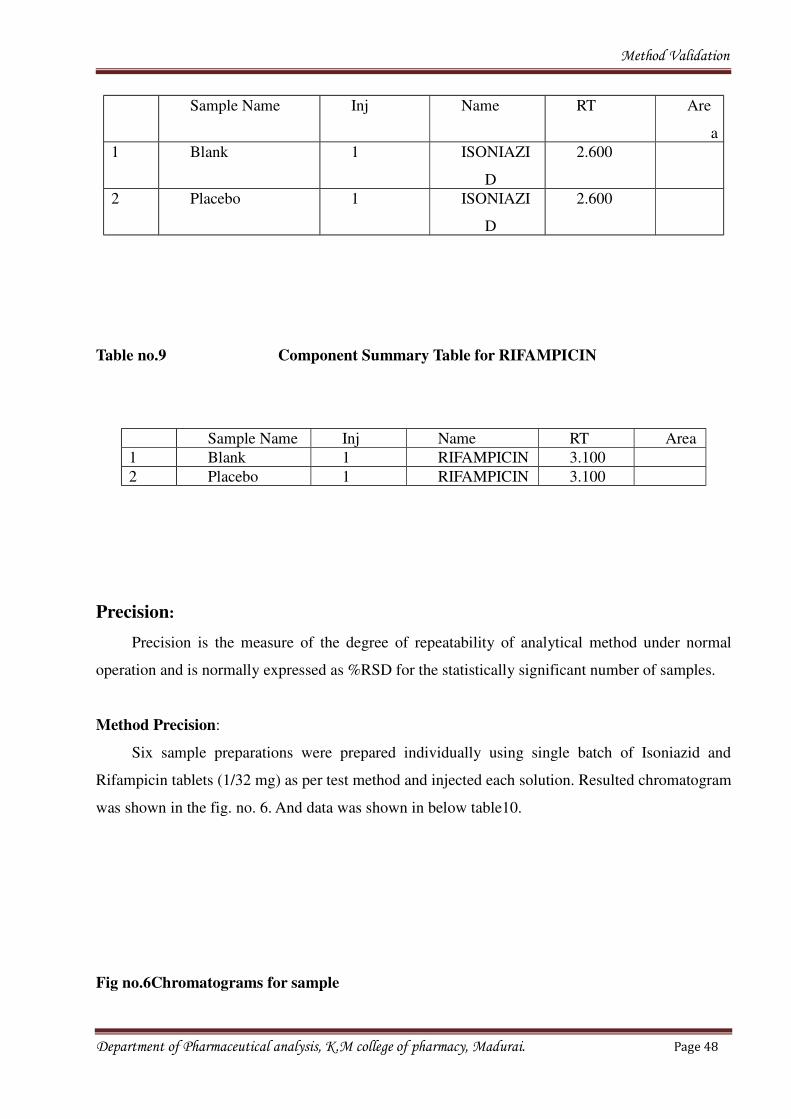
Placebo Interference:
A study to establish the interference of placebo was conducted. Sample preparation of placebo was
done as that of test sample preparation of assay method. Chromatogram of placebo did not show
any additional peaks. This indicated that the excipients used in the formulation did not interfere in
the assay of Isoniazid and Rifampicin tablets. Resulted chromatograms were shown below.
Blank Interference:
A study to establish the interference of blank was conducted. Mobile phase was injected as per the
test method and are shown below.
Fig no.5
Table no.8 Component Summary Table for ISONIAZID
Department of Pharmaceutical analysis, K.M college of pharmacy, Madurai. Page 47
Method Validation
Sample Name Inj Name RT Are
a
1 Blank 1 ISONIAZI
D
2.600
2 Placebo 1 ISONIAZI
D
2.600
Table no.9 Component Summary Table for RIFAMPICIN
Sample Name Inj Name RT Area
1 Blank 1 RIFAMPICIN 3.100
2 Placebo 1 RIFAMPICIN 3.100
Precision:
Precision is the measure of the degree of repeatability of analytical method under normal
operation and is normally expressed as %RSD for the statistically significant number of samples.
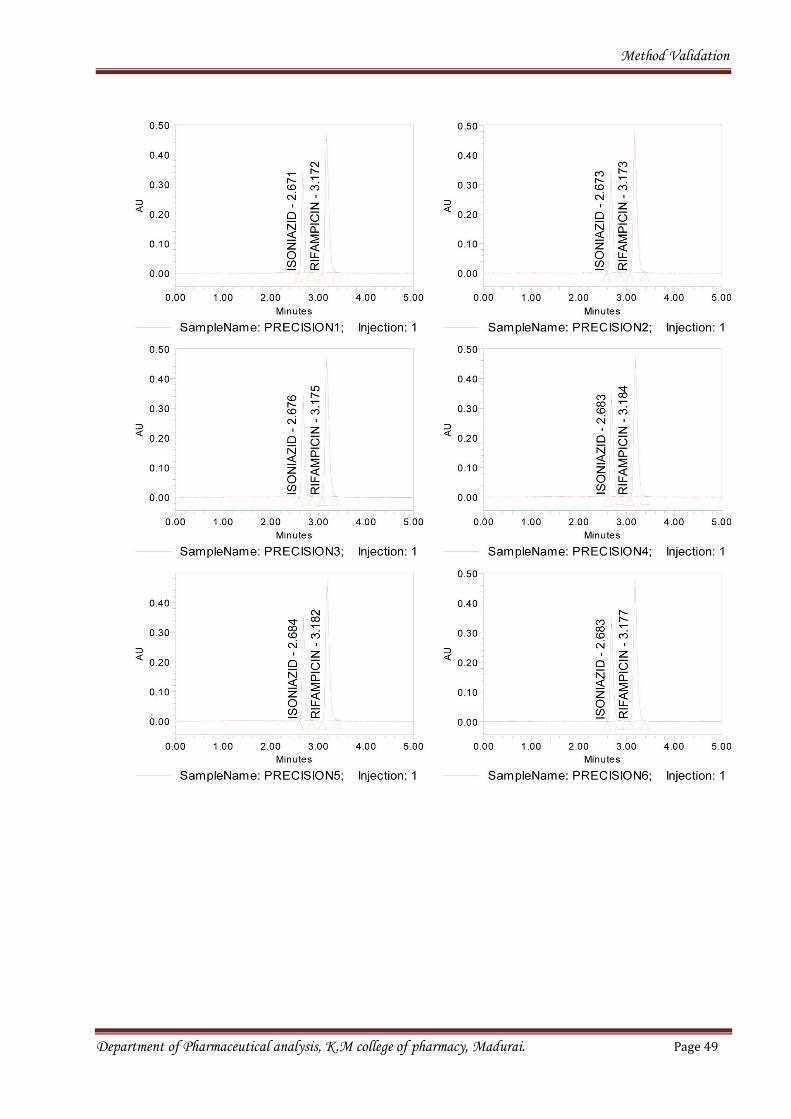
Method Precision:
Six sample preparations were prepared individually using single batch of Isoniazid and
Rifampicin tablets (1/32 mg) as per test method and injected each solution. Resulted chromatogram
was shown in the fig. no. 6. And data was shown in below table10.
Fig no.6Chromatograms for sample
Department of Pharmaceutical analysis, K.M college of pharmacy, Madurai. Page 48
Method Validation
Department of Pharmaceutical analysis, K.M college of pharmacy, Madurai. Page 49
Method Validation
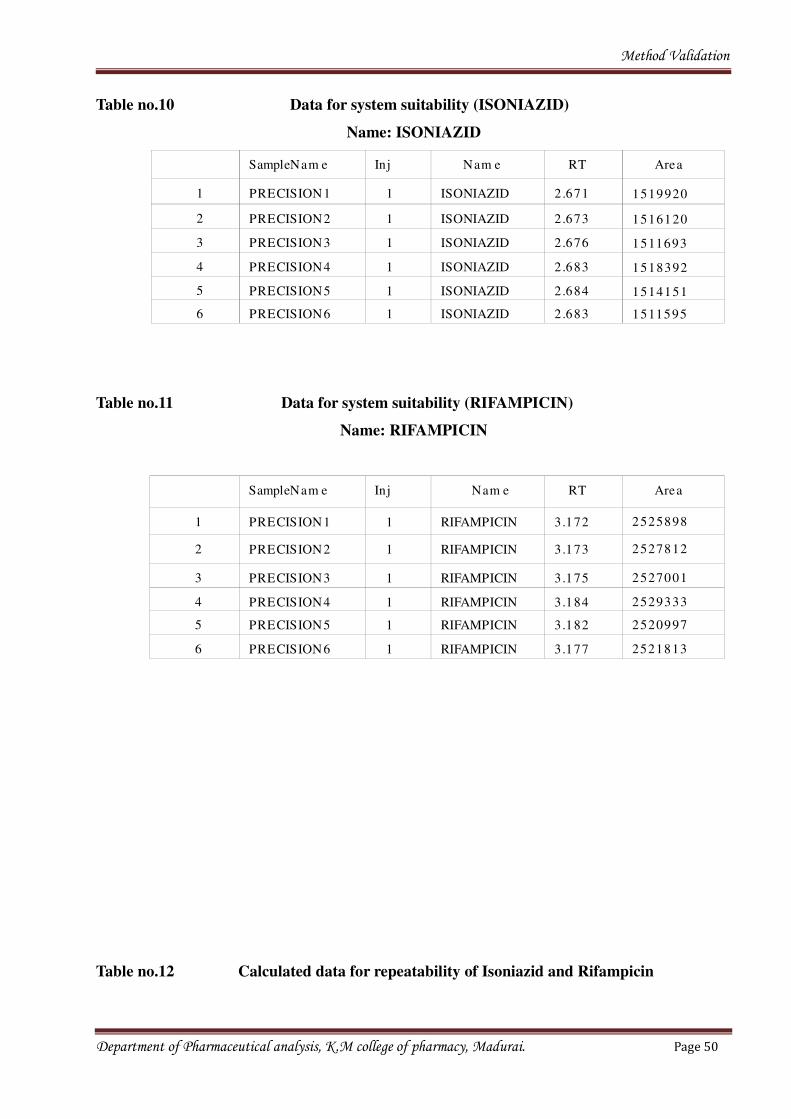
Table no.10 Data for system suitability (ISONIAZID)
Name: ISONIAZID
SampleNam e Inj Nam e RT Area
1 PRECISION1 1 ISONIAZID 2.671 1519920
2 PRECISION2 1 ISONIAZID 2.673 1516120
3 PRECISION3 1 ISONIAZID 2.676 1511693
4 PRECISION4 1 ISONIAZID 2.683 1518392
5 PRECISION5 1 ISONIAZID 2.684 1514151
6 PRECISION6 1 ISONIAZID 2.683 1511595
Table no.11 Data for system suitability (RIFAMPICIN)
Name: RIFAMPICIN
SampleNam e Inj Nam e RT Area
1 PRECISION1 1 RIFAMPICIN 3.172 2525898
2 PRECISION2 1 RIFAMPICIN 3.173 2527812
3 PRECISION3 1 RIFAMPICIN 3.175 2527001
4 PRECISION4 1 RIFAMPICIN 3.184 2529333
5 PRECISION5 1 RIFAMPICIN 3.182 2520997
6 PRECISION6 1 RIFAMPICIN 3.177 2521813
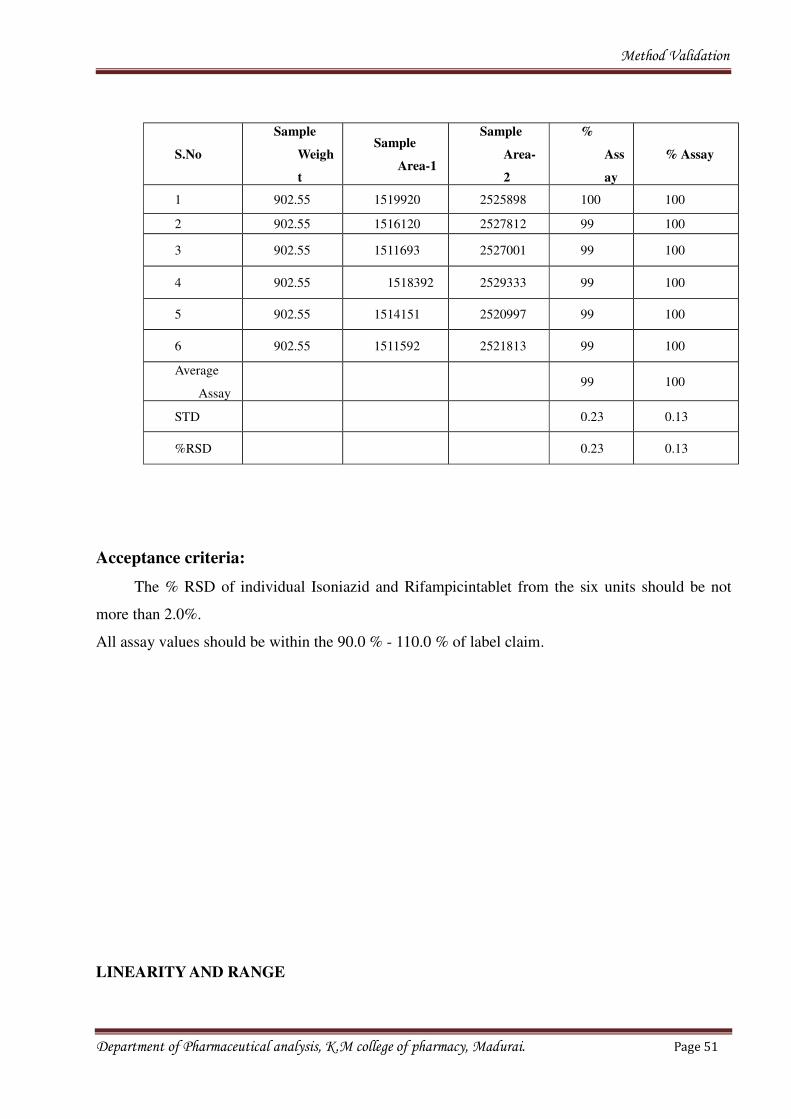
Table no.12 Calculated data for repeatability of Isoniazid and Rifampicin
Department of Pharmaceutical analysis, K.M college of pharmacy, Madurai. Page 50
Method Validation
S.No
Sample
Weigh
t
Sample
Area-1
Sample
Area-
2
%
Ass
ay
% Assay
1 902.55 1519920 2525898 100 100
2 902.55 1516120 2527812 99 100
3 902.55 1511693 2527001 99 100
4 902.55 1518392 2529333 99 100
5 902.55 1514151 2520997 99 100
6 902.55 1511592 2521813 99 100
Average
Assay99 100
STD 0.23 0.13
%RSD 0.23 0.13
Acceptance criteria:
The % RSD of individual Isoniazid and Rifampicintablet from the six units should be not
more than 2.0%.
All assay values should be within the 90.0 % - 110.0 % of label claim.
LINEARITY AND RANGE
Department of Pharmaceutical analysis, K.M college of pharmacy, Madurai. Page 51
Method Validation
Linearity
Linearity of an analytical procedure is its ability (within a given range) to obtain test results
which are directly proportional to the concentration (amount) of an analyte in the sample.
Range
Range of an analytical procedure was the interval between the upper and lower
concentration (amount) of an analyte in the sample (including these concentrations) for which it
has been demonstrated that the analytical procedure has suitable level of precision, accuracy and
linearity.
Standard solutions of Isoniazid and Rifampicin at concentration levels from 50 % to 150 %
of standard solution were injected into HPLC system. The linearity graph was plotted from 50 % to
150
Acceptance criteria
a. The correlation coefficient (r2) must be NLT 0.999.
b. The RSD of replicate injections for lower and upper level concentrations should not be
more than2.0 %.
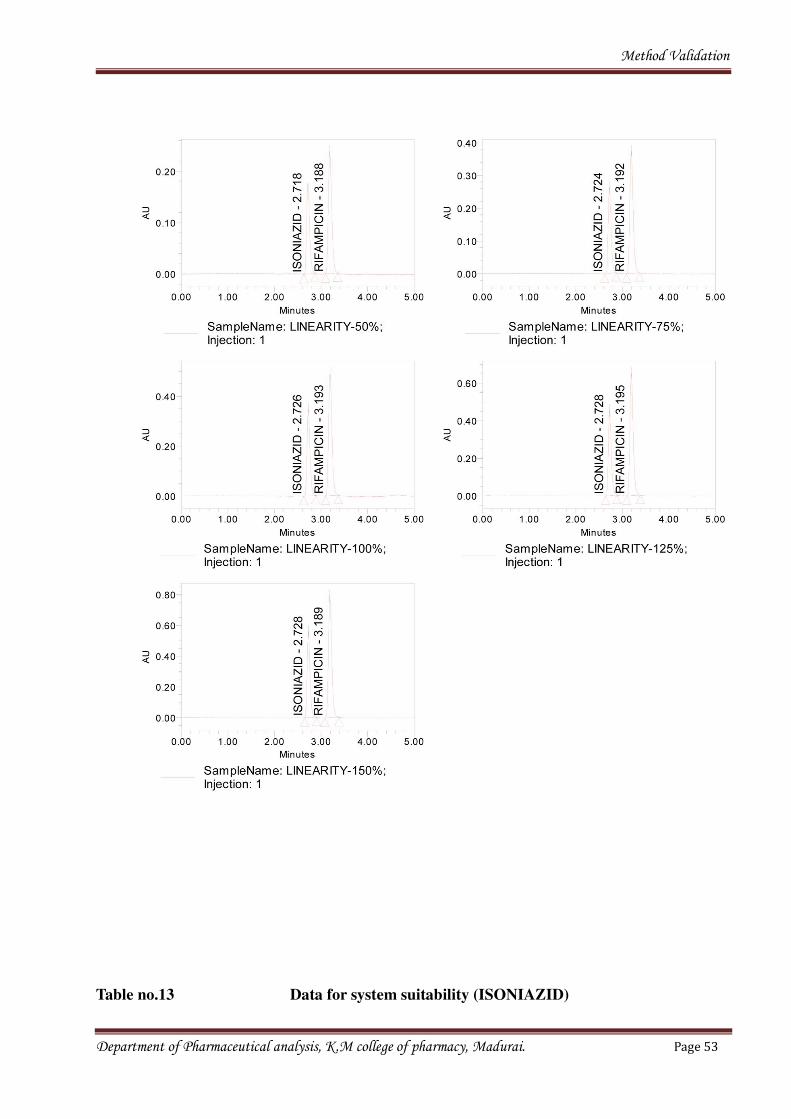
Fig no.7Chromatograms for linearity
Department of Pharmaceutical analysis, K.M college of pharmacy, Madurai. Page 52
Method Validation
Table no.13 Data for system suitability (ISONIAZID)
Department of Pharmaceutical analysis, K.M college of pharmacy, Madurai. Page 53
Method Validation
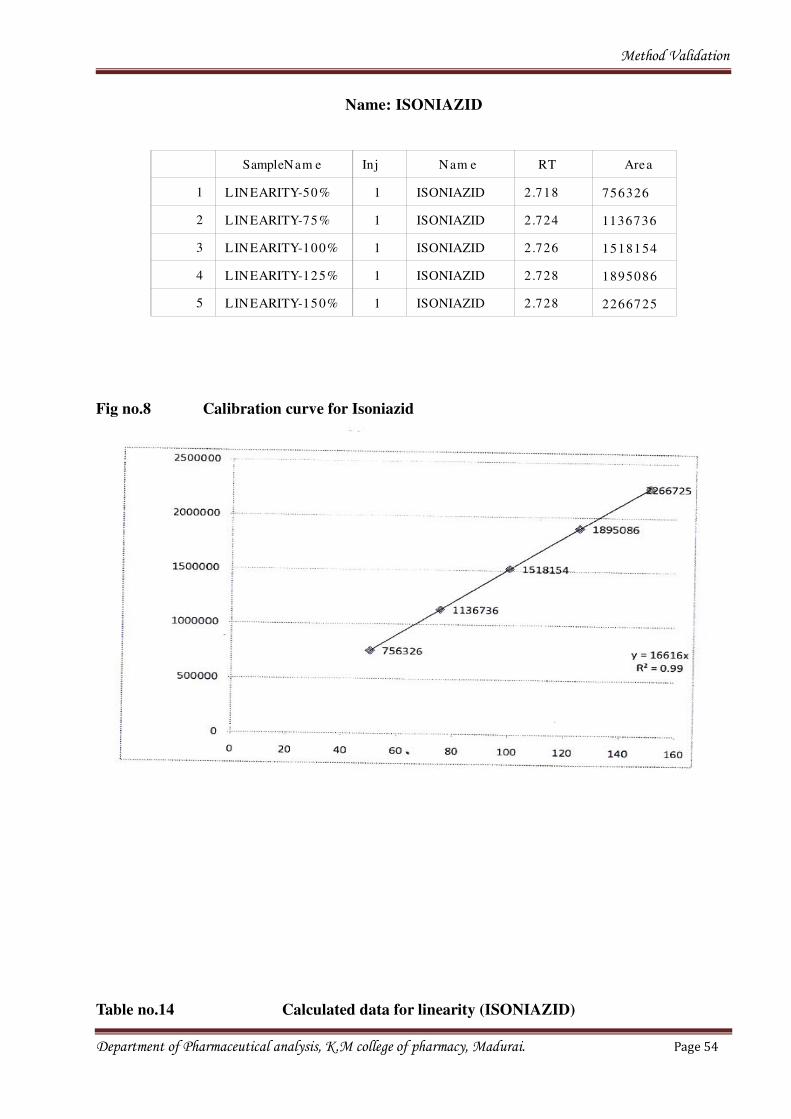
Name: ISONIAZID
SampleNam e Inj Nam e RT Area
1 LINEARITY-50% 1 ISONIAZID 2.718 756326
2 LINEARITY-75% 1 ISONIAZID 2.724 1136736
3 LINEARITY-100% 1 ISONIAZID 2.726 1518154
4 LINEARITY-125% 1 ISONIAZID 2.728 1895086
5 LINEARITY-150% 1 ISONIAZID 2.728 2266725
Fig no.8 Calibration curve for Isoniazid
Table no.14 Calculated data for linearity (ISONIAZID)
Department of Pharmaceutical analysis, K.M college of pharmacy, Madurai. Page 54
Method Validation
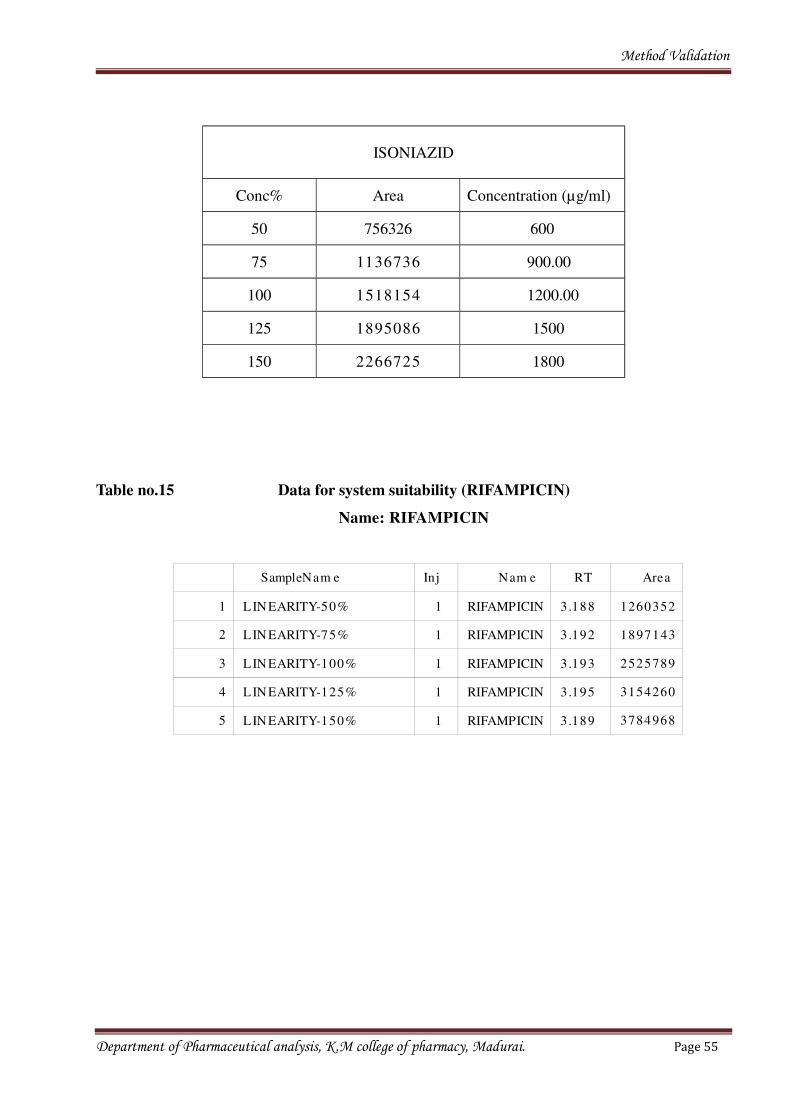
Table no.15 Data for system suitability (RIFAMPICIN)
Name: RIFAMPICIN
SampleNam e Inj Nam e RT Area
1 LINEARITY-50% 1 RIFAMPICIN 3.188 1260352
2 LINEARITY-75% 1 RIFAMPICIN 3.192 1897143
3 LINEARITY-100% 1 RIFAMPICIN 3.193 2525789
4 LINEARITY-125% 1 RIFAMPICIN 3.195 3154260
5 LINEARITY-150% 1 RIFAMPICIN 3.189 3784968
Department of Pharmaceutical analysis, K.M college of pharmacy, Madurai. Page 55
ISONIAZID
Conc% Area Concentration (µg/ml)
50 756326 600
75 1136736 900.00
100 1518154 1200.00
125 1895086 1500
150 2266725 1800
Method Validation
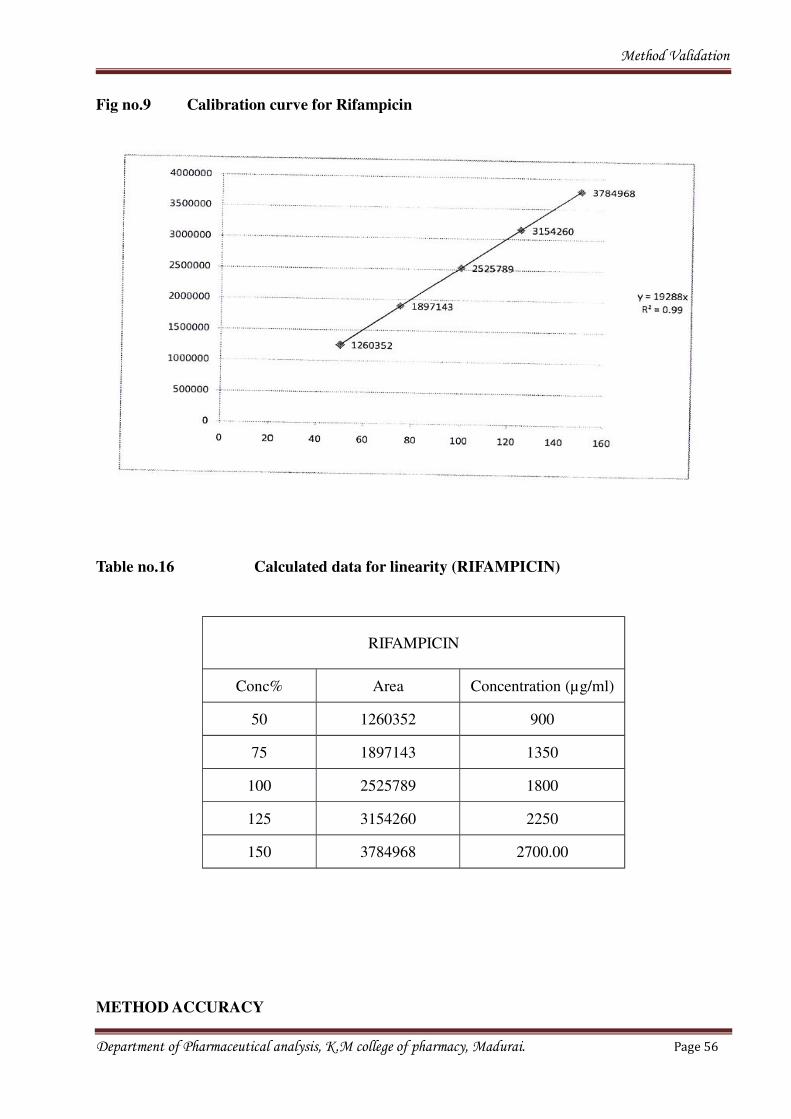
Fig no.9 Calibration curve for Rifampicin
Table no.16 Calculated data for linearity (RIFAMPICIN)
METHOD ACCURACY
Department of Pharmaceutical analysis, K.M college of pharmacy, Madurai. Page 56
RIFAMPICIN
Conc% Area Concentration (µg/ml)
50 1260352 900
75 1897143 1350
100 2525789 1800
125 3154260 2250
150 3784968 2700.00
Method Validation
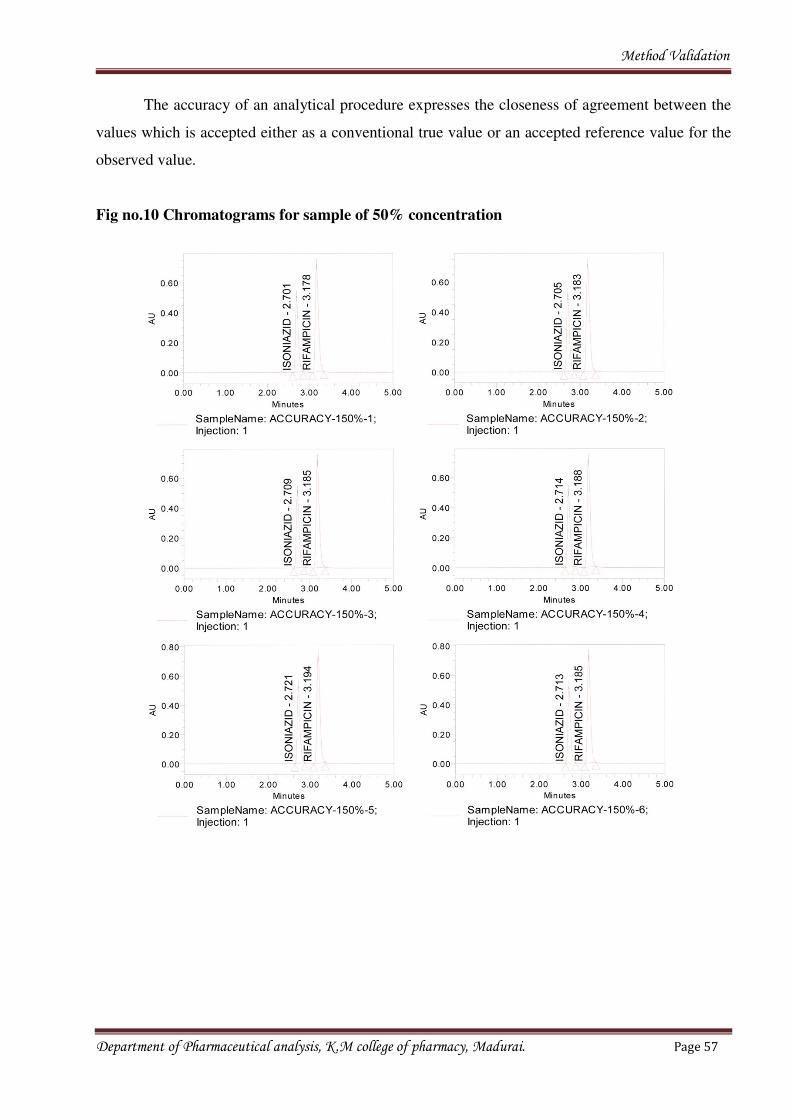
The accuracy of an analytical procedure expresses the closeness of agreement between the
values which is accepted either as a conventional true value or an accepted reference value for the
observed value.
Fig no.10 Chromatograms for sample of 50% concentration
Department of Pharmaceutical analysis, K.M college of pharmacy, Madurai. Page 57
Method Validation
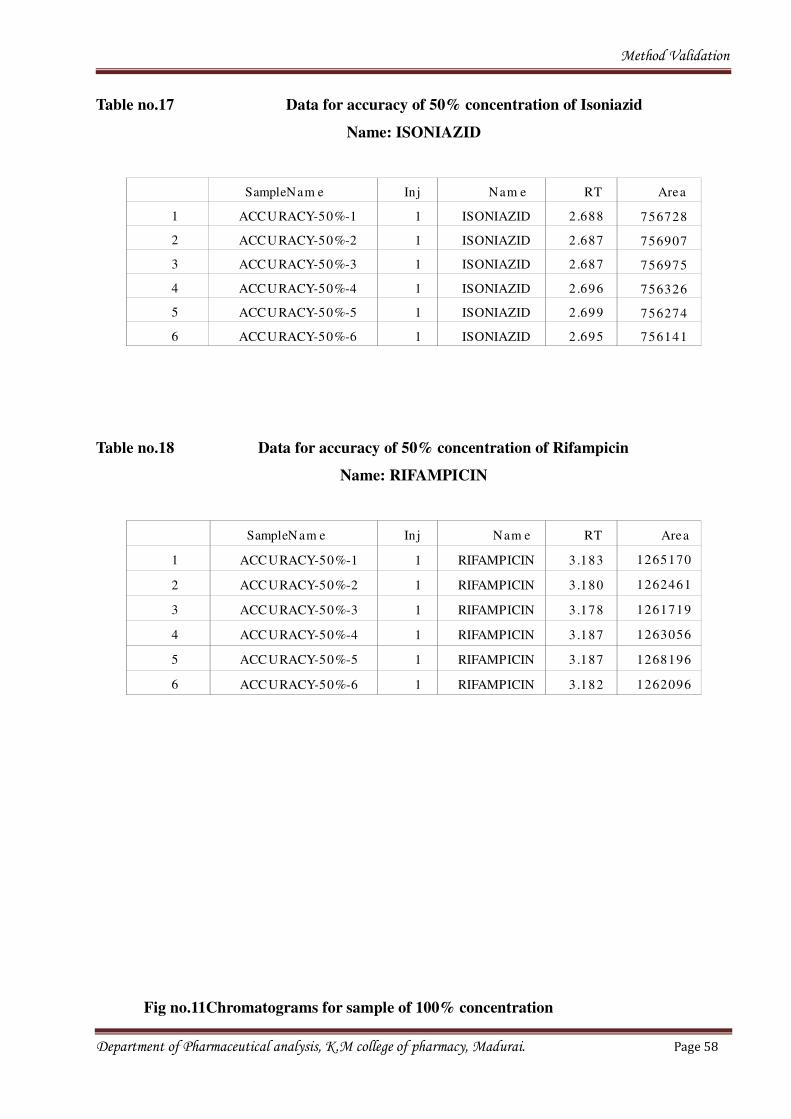
Table no.17 Data for accuracy of 50% concentration of Isoniazid
Name: ISONIAZID
SampleNam e Inj Nam e RT Area
1 ACCURACY-50%-1 1 ISONIAZID 2.688 756728
2 ACCURACY-50%-2 1 ISONIAZID 2.687 756907
3 ACCURACY-50%-3 1 ISONIAZID 2.687 756975
4 ACCURACY-50%-4 1 ISONIAZID 2.696 756326
5 ACCURACY-50%-5 1 ISONIAZID 2.699 756274
6 ACCURACY-50%-6 1 ISONIAZID 2.695 756141
Table no.18 Data for accuracy of 50% concentration of Rifampicin
Name: RIFAMPICIN
SampleNam e Inj Nam e RT Area
1 ACCURACY-50%-1 1 RIFAMPICIN 3.183 1265170
2 ACCURACY-50%-2 1 RIFAMPICIN 3.180 1262461
3 ACCURACY-50%-3 1 RIFAMPICIN 3.178 1261719
4 ACCURACY-50%-4 1 RIFAMPICIN 3.187 1263056
5 ACCURACY-50%-5 1 RIFAMPICIN 3.187 1268196
6 ACCURACY-50%-6 1 RIFAMPICIN 3.182 1262096
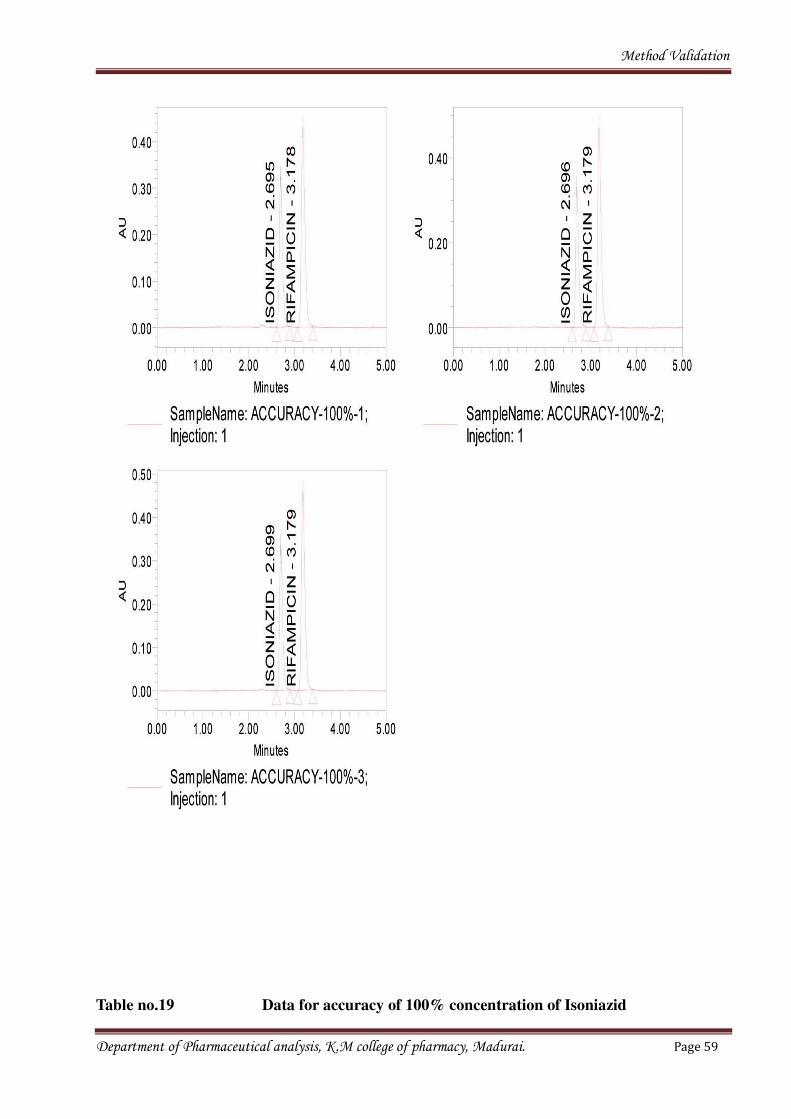
Fig no.11Chromatograms for sample of 100% concentration
Department of Pharmaceutical analysis, K.M college of pharmacy, Madurai. Page 58
Method Validation
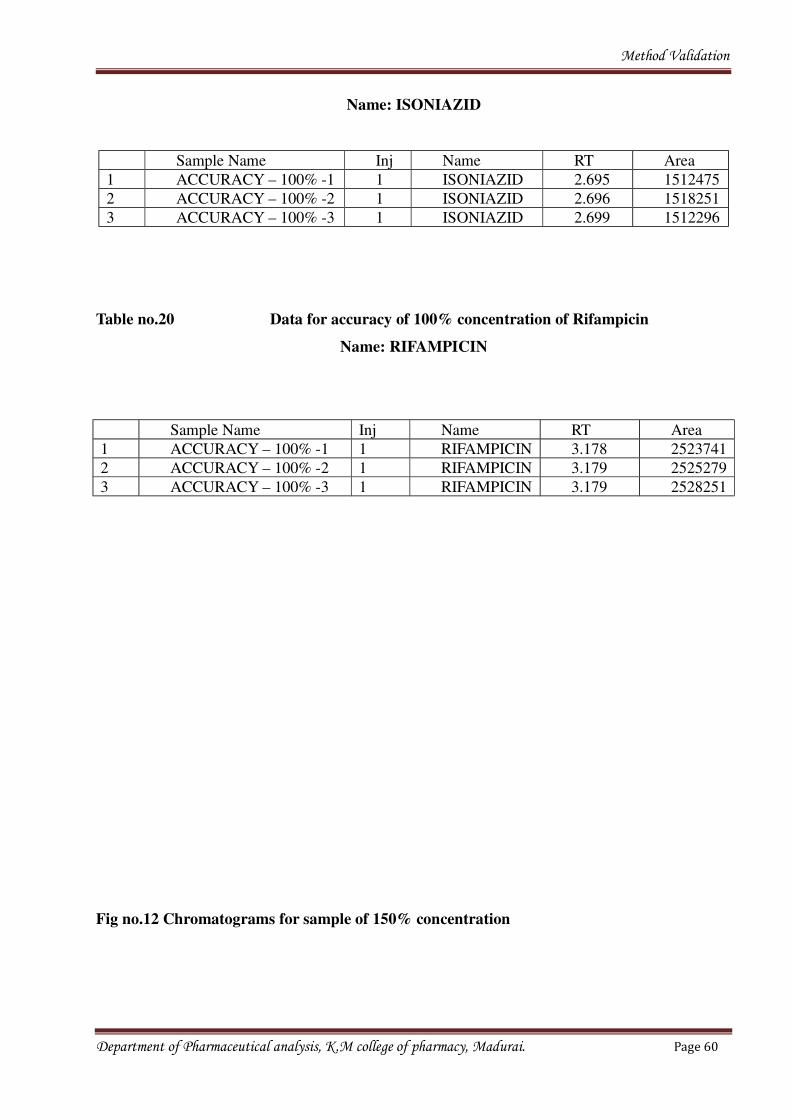
Table no.19 Data for accuracy of 100% concentration of Isoniazid
Department of Pharmaceutical analysis, K.M college of pharmacy, Madurai. Page 59
Method Validation
Name: ISONIAZID
Sample Name Inj Name RT Area
1 ACCURACY – 100% -1 1 ISONIAZID 2.695 1512475
2 ACCURACY – 100% -2 1 ISONIAZID 2.696 1518251
3 ACCURACY – 100% -3 1 ISONIAZID 2.699 1512296
Table no.20 Data for accuracy of 100% concentration of Rifampicin
Name: RIFAMPICIN
Sample Name Inj Name RT Area
1 ACCURACY – 100% -1 1 RIFAMPICIN 3.178 2523741
2 ACCURACY – 100% -2 1 RIFAMPICIN 3.179 2525279
3 ACCURACY – 100% -3 1 RIFAMPICIN 3.179 2528251
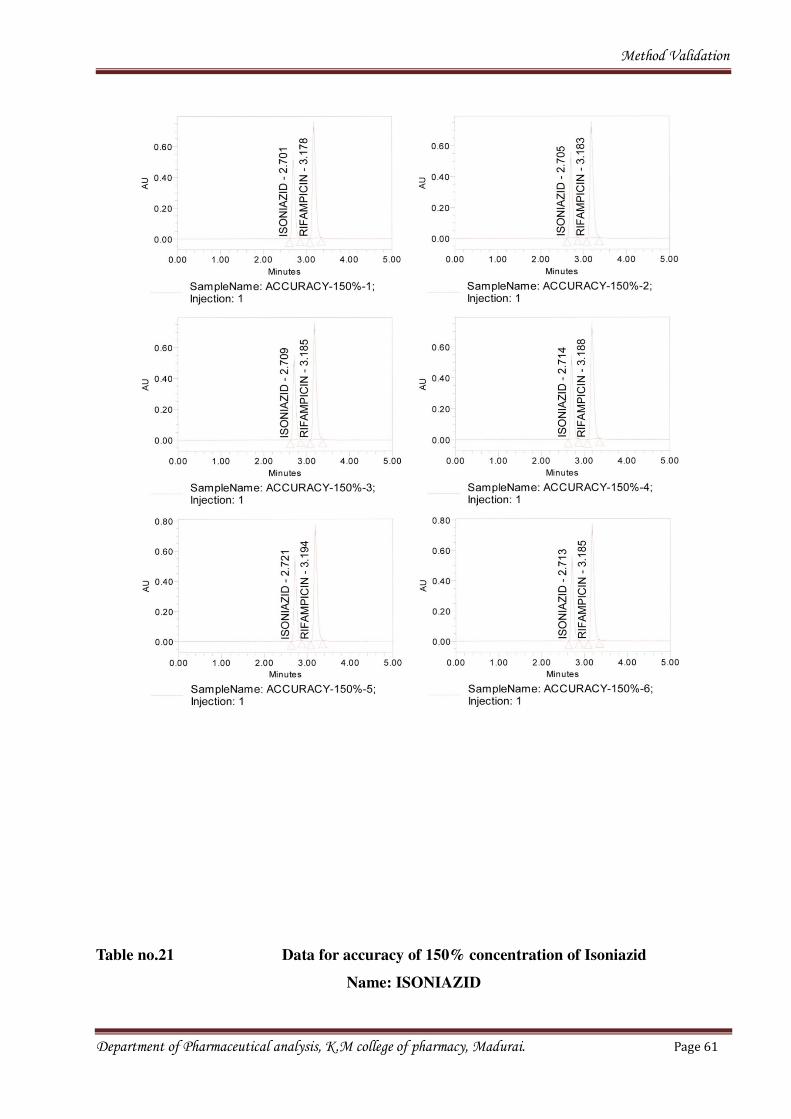
Fig no.12 Chromatograms for sample of 150% concentration
Department of Pharmaceutical analysis, K.M college of pharmacy, Madurai. Page 60
Method Validation
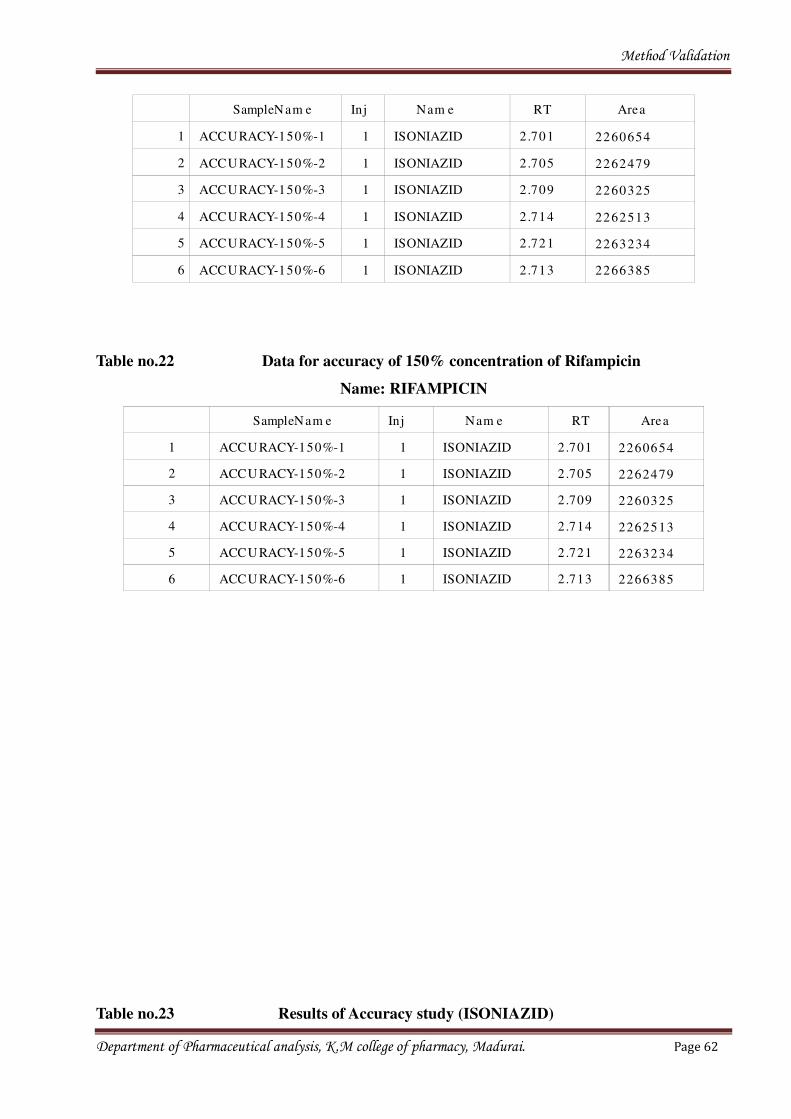
Table no.21 Data for accuracy of 150% concentration of Isoniazid
Name: ISONIAZID
Department of Pharmaceutical analysis, K.M college of pharmacy, Madurai. Page 61
Method Validation
SampleNam e Inj Nam e RT Area
1 ACCURACY-150%-1 1 ISONIAZID 2.701 2260654
2 ACCURACY-150%-2 1 ISONIAZID 2.705 2262479
3 ACCURACY-150%-3 1 ISONIAZID 2.709 2260325
4 ACCURACY-150%-4 1 ISONIAZID 2.714 2262513
5 ACCURACY-150%-5 1 ISONIAZID 2.721 2263234
6 ACCURACY-150%-6 1 ISONIAZID 2.713 2266385
Table no.22 Data for accuracy of 150% concentration of Rifampicin
Name: RIFAMPICIN
SampleNam e Inj Nam e RT Area
1 ACCU RACY-150%-1 1 ISONIAZID 2.701 2260654
2 ACCU RACY-150%-2 1 ISONIAZID 2.705 2262479
3 ACCU RACY-150%-3 1 ISONIAZID 2.709 2260325
4 ACCU RACY-150%-4 1 ISONIAZID 2.714 2262513
5 ACCU RACY-150%-5 1 ISONIAZID 2.721 2263234
6 ACCU RACY-150%-6 1 ISONIAZID 2.713 2266385
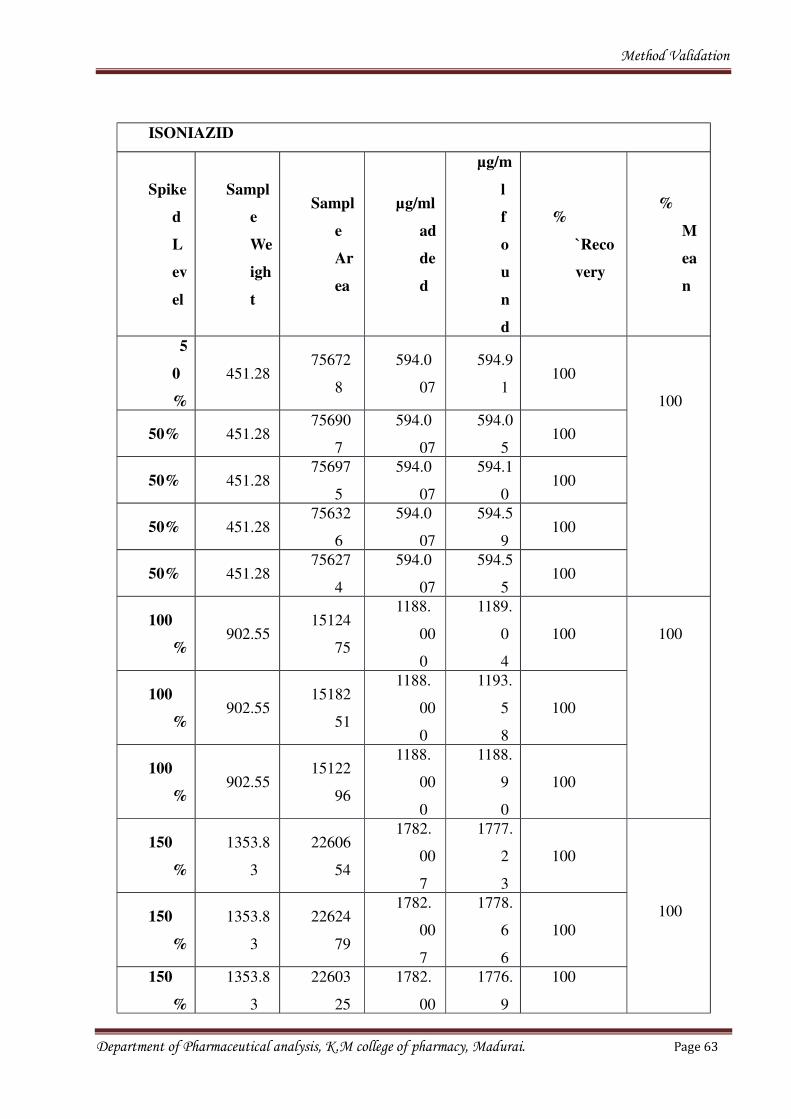
Table no.23 Results of Accuracy study (ISONIAZID)
Department of Pharmaceutical analysis, K.M college of pharmacy, Madurai. Page 62
Method Validation
ISONIAZID
Spike
d
L
ev
el
Sampl
e
We
igh
t
Sampl
e
Ar
ea
µg/ml
ad
de
d
µg/m
l
f
o
u
n
d
%
`Reco
very
%
M
ea
n
5
0
%
451.2875672
8
594.0
07
594.9
1100
100
50% 451.2875690
7
594.0
07
594.0
5100
50% 451.2875697
5
594.0
07
594.1
0100
50% 451.2875632
6
594.0
07
594.5
9100
50% 451.2875627
4
594.0
07
594.5
5100
100
%902.55
15124
75
1188.
00
0
1189.
0
4
100 100
100
%902.55
15182
51
1188.
00
0
1193.
5
8
100
100
%902.55
15122
96
1188.
00
0
1188.
9
0
100
150
%
1353.8
3
22606
54
1782.
00
7
1777.
2
3
100
100150
%
1353.8
3
22624
79
1782.
00
7
1778.
6
6
100
150
%
1353.8
3
22603
25
1782.
00
1776.
9
100
Department of Pharmaceutical analysis, K.M college of pharmacy, Madurai. Page 63
Method Validation
7 7
150
%
1353.8
3
22625
13
1782.
00
7
1778.
6
9
100
150
%
1353.8
3
22632
34
1782.
00
7
1779.
2
6
100
150
%
1353.8
3
22663
85
1782.
00
7
1781.
7
4
100
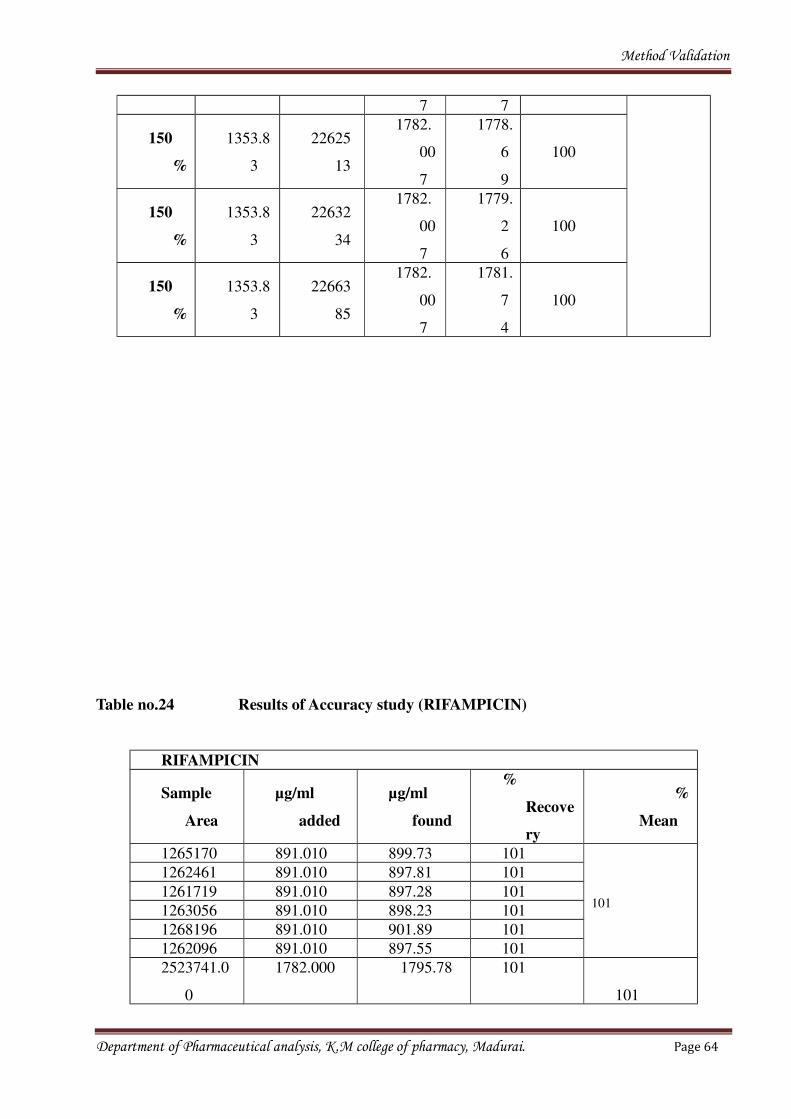
Table no.24 Results of Accuracy study (RIFAMPICIN)
RIFAMPICIN
Sample
Area
µg/ml
added
µg/ml
found
%
Recove
ry
%
Mean
1265170 891.010 899.73 101
101
1262461 891.010 897.81 101
1261719 891.010 897.28 101
1263056 891.010 898.23 101
1268196 891.010 901.89 101
1262096 891.010 897.55 101
2523741.0
0
1782.000 1795.78 101
101
Department of Pharmaceutical analysis, K.M college of pharmacy, Madurai. Page 64
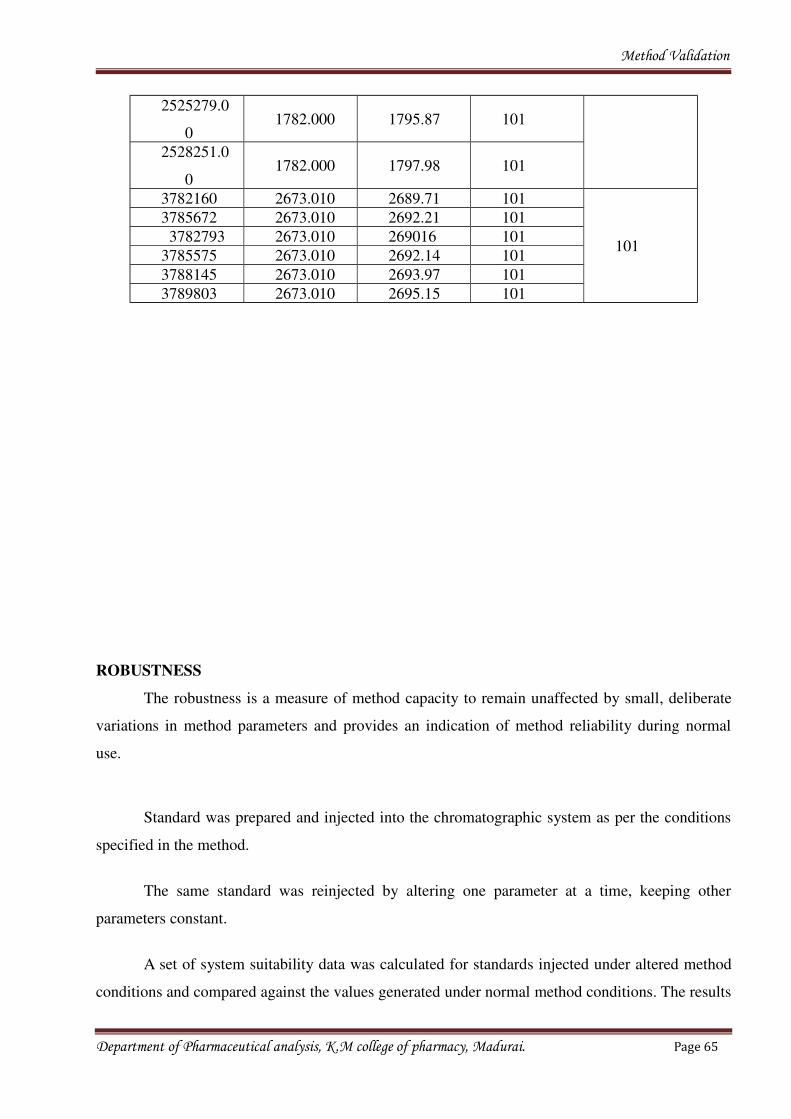
Method Validation
2525279.0
01782.000 1795.87 101
2528251.0
01782.000 1797.98 101
3782160 2673.010 2689.71 101
101
3785672 2673.010 2692.21 101
3782793 2673.010 269016 101
3785575 2673.010 2692.14 101
3788145 2673.010 2693.97 101
3789803 2673.010 2695.15 101
ROBUSTNESS
The robustness is a measure of method capacity to remain unaffected by small, deliberate
variations in method parameters and provides an indication of method reliability during normal
use.
Standard was prepared and injected into the chromatographic system as per the conditions
specified in the method.
The same standard was reinjected by altering one parameter at a time, keeping other
parameters constant.
A set of system suitability data was calculated for standards injected under altered method
conditions and compared against the values generated under normal method conditions. The results
Department of Pharmaceutical analysis, K.M college of pharmacy, Madurai. Page 65
Method Validation
were tabulated in below table.
Acceptance Criteria
All the system suitability requirements must be met.
Method Parameters:
1. Flow Rate
(Normal flow is 1.0 ml/min)
a. Reduced flow ® 0.9 ml/min
b. Increased flow ®1.1 ml/min
2. Column Operating Temperature
(Normal temperature is 30 °C)
a. Reduced Temperature ® 25 °C
b. Elevated Temperature ® 35 °C
Department of Pharmaceutical analysis, K.M college of pharmacy, Madurai. Page 66
Method Validation
Fig no.1 Chromatograms for sample flow and temperature
Department of Pharmaceutical analysis, K.M college of pharmacy, Madurai. Page 67
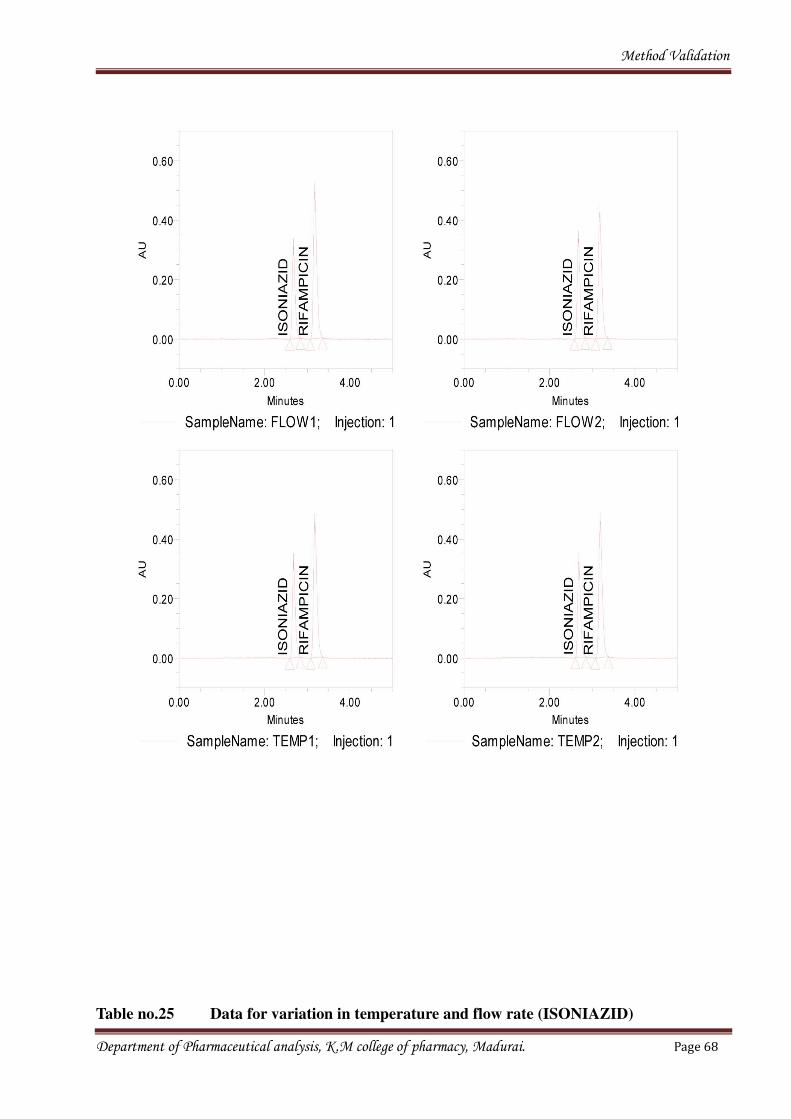
Method Validation
Table no.25 Data for variation in temperature and flow rate (ISONIAZID)
Department of Pharmaceutical analysis, K.M college of pharmacy, Madurai. Page 68
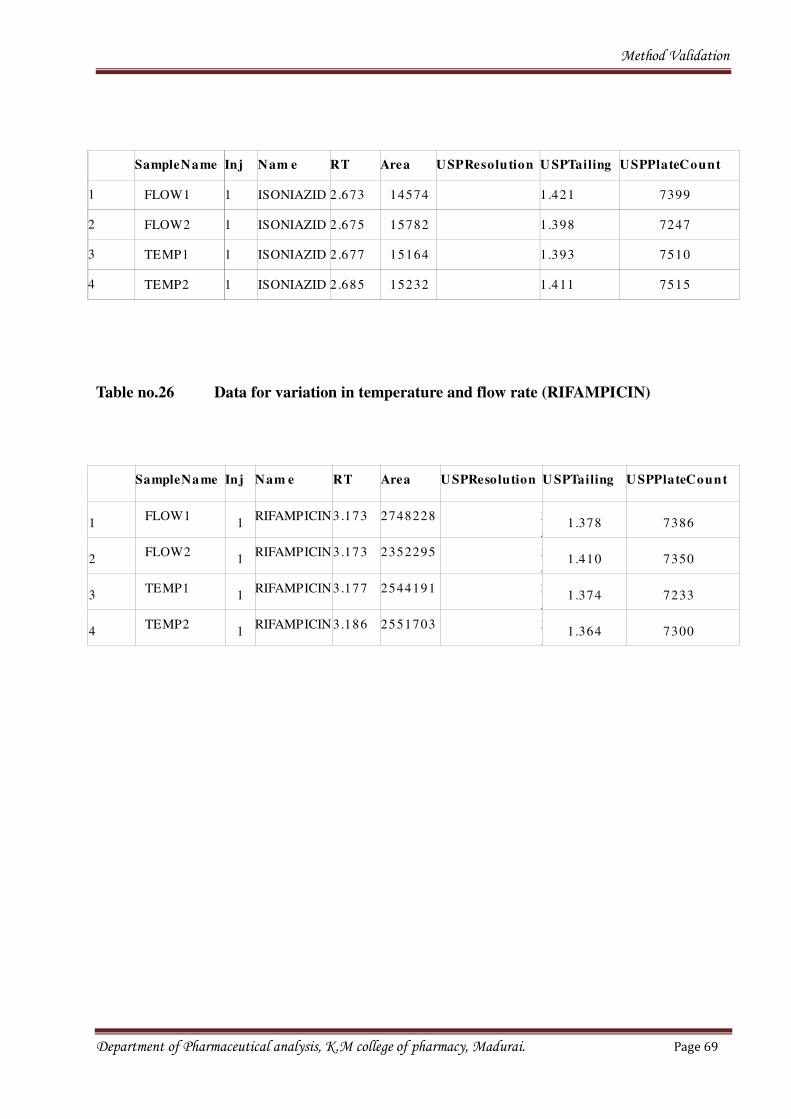
Method Validation
SampleName Inj Nam e RT Area USPResolution U SPTailing USPPlateCount
1 FLOW1 1 ISONIAZID 2.673 14574 1 .421 7399
2 FLOW2 1 ISONIAZID 2.675 15782 1 .398 7247
3 TEMP1 1 ISONIAZID 2.677 15164 1 .393 7510
4 TEMP2 1 ISONIAZID 2.685 15232 1 .411 7515
Table no.26 Data for variation in temperature and flow rate (RIFAMPICIN)
SampleNa me Inj Nam e RT Area U SPResolution U SPTailing U SPPlateCount
1FLOW1
1RIFAMPICIN3.173 2748228 3
96
1.378 7386
2FLOW2
1RIFAMPICIN3.173 2352295 3
78
1.410 7350
3TEMP1
1RIFAMPICIN3.177 2544191 3
90
1.374 7233
4TEMP2
1RIFAMPICIN3.186 2551703 3
01
1.364 7300
Department of Pharmaceutical analysis, K.M college of pharmacy, Madurai. Page 69
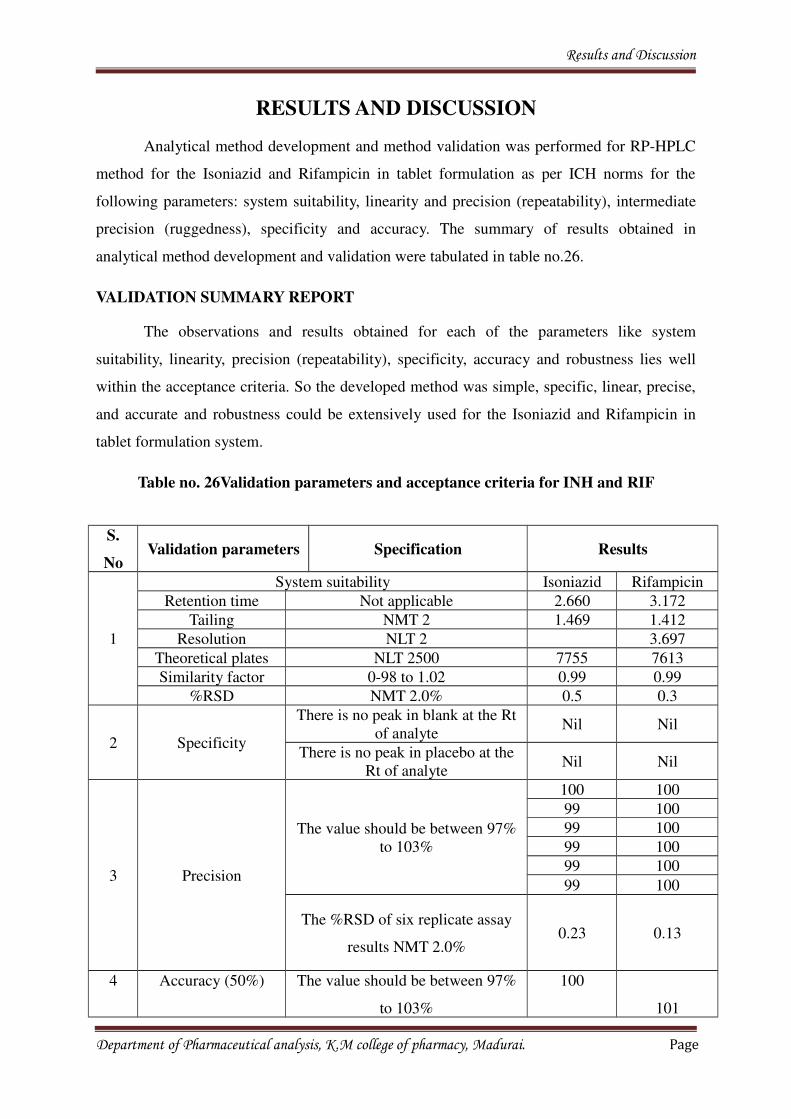
Results and Discussion
RESULTS AND DISCUSSION
Analytical method development and method validation was performed for RP-HPLC
method for the Isoniazid and Rifampicin in tablet formulation as per ICH norms for the
following parameters: system suitability, linearity and precision (repeatability), intermediate
precision (ruggedness), specificity and accuracy. The summary of results obtained in
analytical method development and validation were tabulated in table no.26.
VALIDATION SUMMARY REPORT
The observations and results obtained for each of the parameters like system
suitability, linearity, precision (repeatability), specificity, accuracy and robustness lies well
within the acceptance criteria. So the developed method was simple, specific, linear, precise,
and accurate and robustness could be extensively used for the Isoniazid and Rifampicin in
tablet formulation system.
Table no. 26Validation parameters and acceptance criteria for INH and RIF
S.
NoValidation parameters Specification Results
1
System suitability Isoniazid Rifampicin
Retention time Not applicable 2.660 3.172
Tailing NMT 2 1.469 1.412
Resolution NLT 2 3.697
Theoretical plates NLT 2500 7755 7613
Similarity factor 0-98 to 1.02 0.99 0.99
%RSD NMT 2.0% 0.5 0.3
2 Specificity
There is no peak in blank at the Rt
of analyteNil Nil
There is no peak in placebo at the
Rt of analyteNil Nil
3 Precision
The value should be between 97%
to 103%
100 100
99 100
99 100
99 100
99 100
99 100
The %RSD of six replicate assay
results NMT 2.0%0.23 0.13
4 Accuracy (50%) The value should be between 97%
to 103%
100
101
Department of Pharmaceutical analysis, K.M college of pharmacy, Madurai. Page
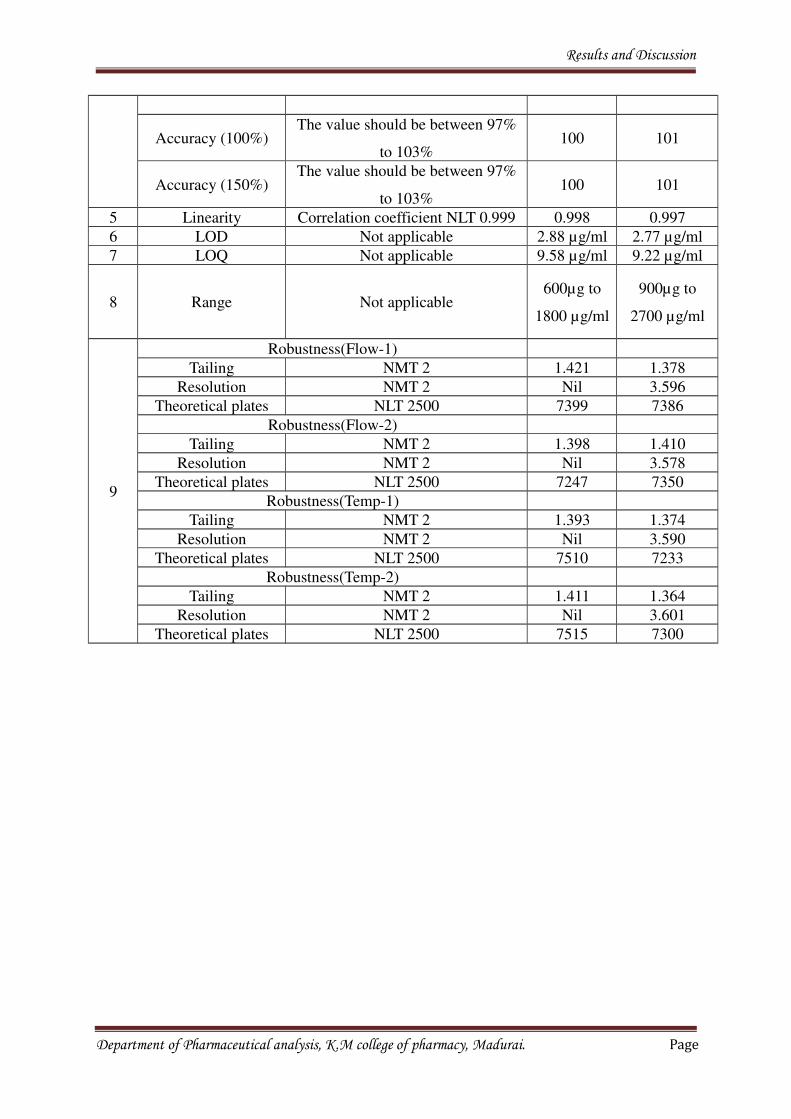
Results and Discussion
Accuracy (100%)The value should be between 97%
to 103%100 101
Accuracy (150%)The value should be between 97%
to 103%100 101
5 Linearity Correlation coefficient NLT 0.999 0.998 0.997
6 LOD Not applicable 2.88 µg/ml 2.77 µg/ml
7 LOQ Not applicable 9.58 µg/ml 9.22 µg/ml
8 Range Not applicable600µg to
1800 µg/ml
900µg to
2700 µg/ml
9
Robustness(Flow-1)
Tailing NMT 2 1.421 1.378
Resolution NMT 2 Nil 3.596
Theoretical plates NLT 2500 7399 7386
Robustness(Flow-2)
Tailing NMT 2 1.398 1.410
Resolution NMT 2 Nil 3.578
Theoretical plates NLT 2500 7247 7350
Robustness(Temp-1)
Tailing NMT 2 1.393 1.374
Resolution NMT 2 Nil 3.590
Theoretical plates NLT 2500 7510 7233
Robustness(Temp-2)
Tailing NMT 2 1.411 1.364
Resolution NMT 2 Nil 3.601
Theoretical plates NLT 2500 7515 7300
Department of Pharmaceutical analysis, K.M college of pharmacy, Madurai. Page
Conclusion
CONCLUSION
From the results obtained, it was observed that the developed method was proven to
be specific, precise, linear, accurate, rugged and robust and is suitable for its intended
purpose. So the above work performed gives documented evidence that the analytical method
for the Isoniazid and Rifampicin by RP-HPLC in tablet dosage forms will consistently
analyze these drugs quantitatively and could be used for routine analysis.
Department of Pharmaceutical analysis, K.M college of pharmacy, Madurai. Page
BIBILOGRAPHY
1. D. Kealey and P. J. Haines. Analytical Chemistry. 1st edition. New Delhi: Viva Brook
Pvt Ltd. 2002; P.1-3.
2. Skoog, West holler crouch. Fundamentals of Analytical Chemistry. 8th edition.
Australia: Thomason Brooks/Cole. 2004; P. 2-4.
3. Willard, Merit, Dean, Settle. Instrumental Method of Analysis. 7thedition. New Delhi:
CS publishers and distributors. 1986; P. 1, 592,622-628, 256-264.
4. ICH-Q2A. Validation of Analytical Procedure / Methodology. Geneva, Switzerland:
ICH Harmonised Triplicate Guidelines; 1996. P. 1-8.
5. Code ICH-Q2B. Validation of Analytical Procedure / Methodology. Geneva,
Switzerland: ICH Harmonized Triplicate Guidelines; 1996. P. 1-8.
6. Sharma BK. Organic Spectroscopy. 6th edition. New Delhi: Goel Publishing House.
2002; P.75.
7. GurdeepChatwal, Sham Anand. Instrumental Methods of Chemical
Analysis. 5thedition. New Delhi: Himalaya Publishing House. 2002; P.25-67.
8. Sharma B.K. Instrumental Method of Chemical Analysis. 18th edition Meerut: Goel
Publishing House. 1999; P. 1-23, 175-203.
9. Jeffery G. H, Denny R. C, Barnes J. D, Thomas M. Vogel’s text book of Quantitative
Chemical Analysis. 6thedition. Pearson Education. P. 2-7, 216-227.
10. Hdicostas E, Wendawiak B.W. Koch M. Quality Assurance in Analytical Chemistry
Training and Teaching. 1stedition. New Delhi: Springer Pvt Ltd. International Springer
Group. 2004; P. 204-219.
11. Martindale. The Complete Drug Reference. 3thedition. London: pharmaceutical press.
1999; P.128-523, 1027.
12. In Indian Pharmacopeia. 6th edition. Published by The Indian Pharmacopeia
Commission Indian Pharmacopeia Laboratory Govt. of India. 2010; Vol - II: 1515.
13. In Indian Pharmacopeia. 6th edition. Published by The Indian Pharmacopeia
Commission Indian Pharmacopeia Laboratory Govt. of India. 2010; Vol - III: 2054.
14. ShahY, Khanna S, Jindal KC. Determination of rifampicin and isoniazid in
pharmaceutical formulation by HPLC. Drug Development and Industrial Pharmacy.
1992; 18(14):1589-1596.
15. Glass BD, Agatonovic KS, Chen YJ, Wisoh MH. Optimization of a stability –
indicating HPLC method for the simultaneous determination of rifampicin, isoniazid
and pyrazinamide in a fixed dose combination using artificial neural networks. J
Chromatogr Sci. 2007; 45(1):38-44.
16. Calleri E, De Lorenzi E, Furlanetto S, Massolini G, Caccialanza G. Validation of a
RP-LC method for the simultaneous determination of isoniazid, pyrazinamide and
rifampicin in a pharmaceutical formulation. J Pharm and Biomed Ana. 2002;
29(6):1089-96.
17. Mohan B, Sharda N and Singh S. Evaluation of the recently reported USP gradient
HPLC method for analysis of anti-tuberculosis drugs for its ability to resolve
degradation products of rifampicin. J Pharm and Biomed Ana. 2003; 31(3):607-612.
18. Panchagnula R, Sood A, Sharda N, Kaur K. Determination of rifampicin and its main
metabolic in plasma and urine in presence of pyrazinamide and isoniazid by HPLC
method. J Pharm and Biomed Ana. 1999; 18(6):1013-1020.
19. Smith PJ. Determination of rifampicin, isoniazid and pyrazinamide by high
performance liquid chromatography after their simultaneous extraction from plasma.
The International Journal of Tuberculosis and Lung Diseases. 1999; 3(3):S325-S328
(1).
20. Khuhawar MY, Rind FM. Liquid chromatographic determination of isoniazid,
pyrazinamide and rifampicin from pharmaceutical preparation and blood. J
Chromatogr B Analyt Technol Biomed Life Sci. 2002; 766(2):357-363.
21. Ali J, Ali N, Sultana Y, Baboota S and Faiyaz S. Development and validation of a
stability indicating HPTLC method for analysis of antitubercular drugs. Acta
Chromatographica. 2007; 18:168-179.
22. Kakde RB, Kastune AV, Wadodkar SG. Spectrophotometric determination of
rifampicin and isoniazid in pharmaceutical preparation, IJPS. 2002; 64:24-27.
23. Balbao MS, Bertacci C, Bergamaschi MM, Malfana WR, Carvalhopreossi SA,Paula
ML. Rifampicin determination in plasma by stir bar sorptive extraction and liquid
chromatography. J Pharm and Biomed Ana. 2010; 51(5):1078-1083.
24. Safavi A, Krimi MA, Hormozi NM, Kamali R, Saghir N. Sensitive indriect
spectrophotometric determination of isoniazid. Spectrochim Acta A Mol Biomol
Spectrosc. 2004; 60(4):765-769.
25. Riu L, Jose L, Joao S. Fluorimetric determination of isoniazid by oxidationwith
cerium (IV) in a multicommutated flow system. Analytica Chimica Acta. 2000;
419(1):17-23.
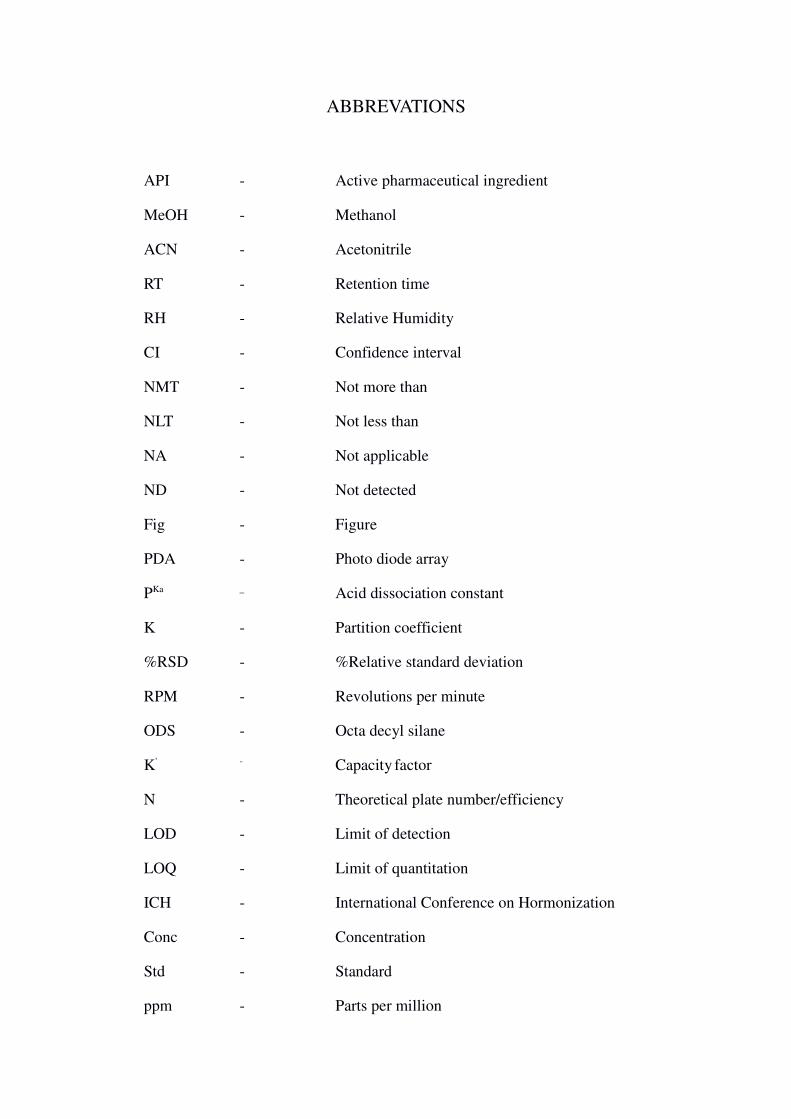
ABBREVATIONS
API - Active pharmaceutical ingredient
MeOH - Methanol
ACN - Acetonitrile
RT - Retention time
RH - Relative Humidity
CI - Confidence interval
NMT - Not more than
NLT - Not less than
NA - Not applicable
ND - Not detected
Fig - Figure
PDA - Photo diode array
PKa _ Acid dissociation constant
K - Partition coefficient
%RSD - %Relative standard deviation
RPM - Revolutions per minute
ODS - Octa decyl silane
K' - Capacity factor
N - Theoretical plate number/efficiency
LOD - Limit of detection
LOQ - Limit of quantitation
ICH - International Conference on Hormonization
Conc - Concentration
Std - Standard
ppm - Parts per million
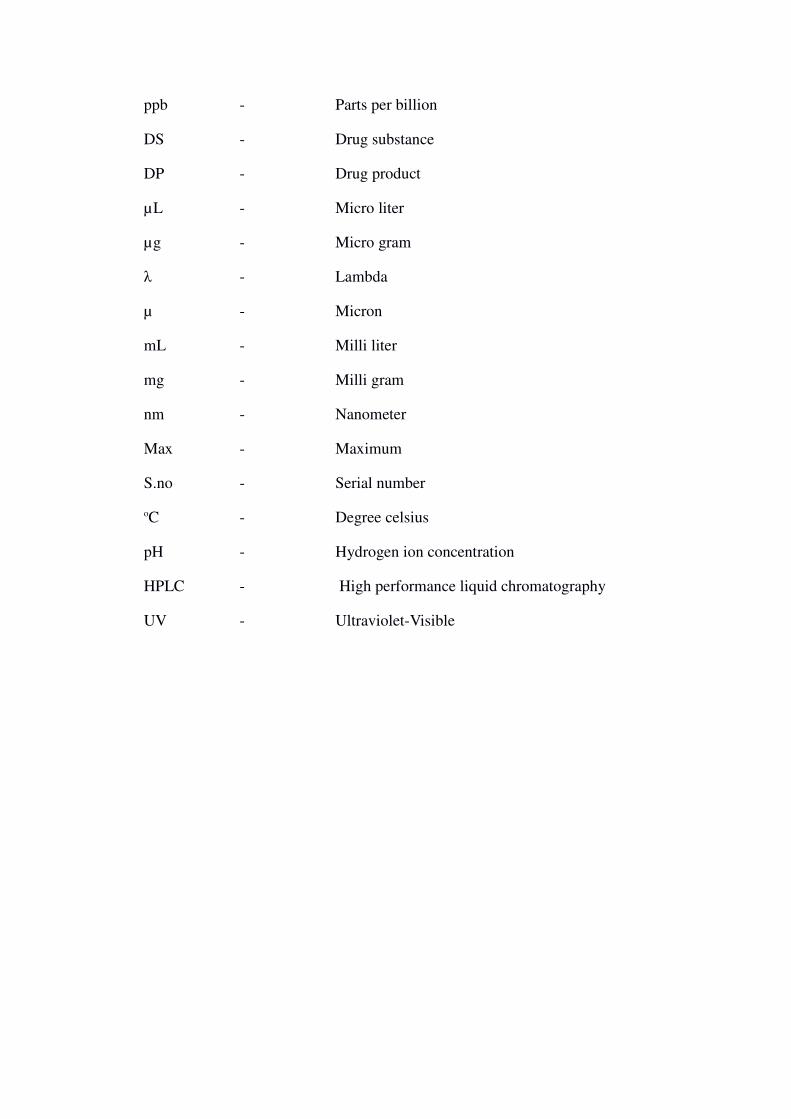
ppb - Parts per billion
DS - Drug substance
DP - Drug product
µL - Micro liter
µg - Micro gram
λ - Lambda
µ - Micron
mL - Milli liter
mg - Milli gram
nm - Nanometer
Max - Maximum
S.no - Serial number
oC - Degree celsius
pH - Hydrogen ion concentration
HPLC - High performance liquid chromatography
UV - Ultraviolet-Visible


![Development and Validation of RP-HPLC Method for …...simultaneous estimation by HPLC [8,9]. The aim of this research work is the development of a simple, rapid and precise RP-HPLC](https://img.dokumen.tips/doc/110x75/5e403e331e099c466b433b95/development-and-validation-of-rp-hplc-method-for-simultaneous-estimation-by.jpg)


![Development and validation of RP-HPLC method for ... · Key words: Ethacridine lactate, methanol, RP-HPLC validation INTRODUCTION Ethacridine lactate (EL) [Figure 1], 2- ethoxy-6,](https://img.dokumen.tips/doc/110x75/5e1ad7dff5119563481854b3/development-and-validation-of-rp-hplc-method-for-key-words-ethacridine-lactate.jpg)