Embed Size (px)
Citation preview

ROXBURY TOWNSHIPWATER DEPARTMENT BOOSTER STATION
ENERGY ASSESSMENT
for
NEW JERSEYBUREAU OF PUBLIC UTILITIES

ROXBURY TOWNSHIPWATER DEPARTMENT BOOSTER STATION
ENERGY ASSESSMENT
for
NEW JERSEYBUREAU OF PUBLIC UTILITIES
CHA PROJECT NO. 20556
May 2010
Prepared by:
CLOUGH HARBOUR & ASSOCIATES LLP
6 Campus DriveParsippany, NJ
07054-4406
(973) 538-2120

TABLE OF CONTENTSPage
1.0 INTRODUCTION & BACKGROUND....……………….…………...........1
2.0 EXECUTIVE SUMMARY………………………………………….………2
3.0 EXISTING CONDITIONS……………………….………..……………..…43.1 Building General3.2 Utility Usage3.3 HVAC Systems3.4 Lighting/Electrical Systems3.5 Plumbing Systems
4.0 ENERGY CONSERVATION MEASURES…………………………...…..64.1 ECM-1 Lighting Replacements4.2 ECM-2 Install Occupancy Sensors4.3 ECM-3 Lighting Replacements with Occupancy Sensors4.4 ECM-4 Install Door Seals 4.5 ECM-5 50 HP Booster Motor Replacement4.6 ECM-6 Electric Unit Heater Occupancy Control
5.0 POTENTIAL INCENTIVES………………………………………….……105.1 Incentives Overview5.2 Building Incentives
6.0 ALTERNATIVE ENERGY EVALUATION…………………….….……126.1 Geothermal6.2 Solar6.3 Wind6.4 Combined Heat and Power Generation (CHP)6.5 Biomass Power Generation6.6 Demand Response Curtailment
7.0 EPA PORTFOLIO MANAGER……………………………………………17
8.0 CONCLUSIONS & RECOMMENDATIONS.…………...……….…..…..18

APPENDICESA. Utility Usage AnalysisB. Equipment InventoryC. ECM-1 Lighting Replacements
ECM-2 Install Occupancy SensorsECM-3 Lighting Replacements with Occupancy Sensors
D. ECM-4 Install Door Seals E. ECM-5 50 HP Booster Motor ReplacementF. ECM-6 Electric Unit Heater Occupancy ControlG. New Jersey Pay For Performance Incentive Program H. Photovoltaic (PV) Rooftop Solar Power GenerationI. WindJ. EPA Portfolio Manager

New Jersey BPU - Energy AuditsPage 1 of 18
1.0 INTRODUCTION & BACKGROUND
This report summarizes the energy audit for the Roxbury Township Water Department Booster Station (Booster Station). The single story, approximately 800 square foot building houses pumping equipment and an office.
New Jersey’s Clean Energy Program, funded by the New Jersey Board of Public Utilities, supports energy efficiency and sustainability for Municipal and Local Government Energy Audits. Through the support of a utility trust fund, New Jersey is able to assist state and local authorities in reducing energy consumption while increasing comfort.

New Jersey BPU - Energy AuditsPage 2 of 18
2.0 EXECUTIVE SUMMARY
This report details the results of the energy audit for the Roxbury Township Water Department Booster Station (Booster Station) located in Landing, New Jersey. The building houses pumping equipment and an office. The following areas were evaluated for energy conservation measures:
Lighting replacement with occupancy sensors Door seal replacement Booster motor replacement Heater occupancy control
Various potential Energy Conservation Measures (ECMs) were identified for the above categories. Measures which are recommended for implementation have a payback of 10 years or less. This threshold is considered a viable return on investment. Potential annual savings of $2,480 for the recommended ECMs may be realized with a payback of 3.8 years.
The ECMs identified in this report will allow for the building to reduce its energy usage and if pursued has the opportunity to qualify for the New Jersey SmartStart Buildings Program. A summary of the costs, savings, and paybacks for the recommended ECMs follows:
ECM-3 Lighting Replacements with Occupancy Sensors
Budgetary Annual Utility Savings Potential Payback Payback
Cost Incentive* (without incentive) (with incentive)
Electricity Natural gas Total ROI
$ kW kWh Therms $ $ Years Years
1,900 1.1 2,730 0 500 2.7 200 3.8 3.4*Incentive is based on the New Jersey Smart Start Prescriptive Lighting Measures.
ECM-4 Install Door Seals
Budgetary Annual Utility Savings Potential Payback Payback
Cost Incentive* (without incentive) (with incentive)
Electricity Natural gas Total ROI
$ kW kWh Therms $ $ Years Years
230 0 420 0 80 2.3 NA 2.9 NA* There is no incentive available through the New Jersey Smart Start program for this ECM.
ECM-5 50-HP Booster Motor Replacement
Budgetary Annual Utility Savings Potential Payback Payback
Cost Incentive* (without incentive) (with incentive)
Electricity Natural gas Total ROI
$ kW kWh Therms $ $ Years Years
5,200 2.9 6,300 0 1,100 3.3 200 4.7 4.5
* Incentive shown is per the New Jersey Smart Start Program, 2009 Premium Motors Application for one 50-Hp motors.

New Jersey BPU - Energy AuditsPage 3 of 18
ECM-6 Electric Unit Heater Occupancy Control
Budgetary Annual Utility Savings Potential Payback Payback
Cost Incentive* (without incentive) (with incentive)
Electricity Natural gas Total ROI
$ kW kWh Therms $ $ Years Years
2,500 0.0 4,400 0 800 3.9 NA 3.1 NA
* There is no incentive available through the New Jersey Smart Start program for this ECM. Note, a $75 incentive per thermostat is available for “Occupancy Controlled Thermostats for Hospitality/Institutional Facilities”. The Booster Station facility likely does not qualify for this incentive, however BPU may consider it applicable on a case-by-case basis.

New Jersey BPU - Energy AuditsPage 4 of 18
3.0 EXISTING CONDITIONS
3.1 Building General
3.1.1 Structure
The Booster Station facility was constructed in 1973, and is an approximately 800 square foot building consisting of two water pumps equipped with two 50 HP motors, and a small office area with adjoining restroom. The exterior is composed of face brick and concrete masonry unit (CMU) blocks built on a concrete foundation. The interior walls are constructed of CMU.
The windows and doors are single pane glass with wood frames. The windows, while single pane glass and original to building construction, are in acceptable condition considering the limited occupancy of the building. It was noted that one window, located behind the main equipment operation panel, was broken and incurred infiltration, cold drafts, and heat loss, and should be replaced. The building has one main entrance and no other emergency exits. The roof system is flat, ballasted, with a rubber membrane, and is in good condition.
3.1.2 Operating Hours
Since the building is primarily used to house two water pumps and associated equipment which require minimal supervision, the building is unoccupied for most of the day during the week. Based on discussions with township personnel, it is typically occupied approximately 20 hours per week.
3.2 Utility Usage
The building uses electricity, diesel fuel, well water, and is connected into the township’s sewage system.
Electricity is purchased and delivered by Jersey Central Power & Light (JCP&L), and diesel fuel oil is used for the emergency generator only. For 2008, the building had an annual electricity consumption of 88,240 kWh at a cost of $16,200. Diesel usage data was not evaluated for this study since it is only used for the emergency generator.
The largest portion of energy usage is for electricity; the average blended rate was $0.183 per kWh. The electricity usage trend shows higher consumption in July and December. The building had a maximum kW demand of 62.9 kW and a minimum kW of 41 kW in 2008. The monthly average over the observed 12-month period was 47.4 kW.
Since the building is typically unoccupied, domestic water usage information was not collected, and water conservation measures not considered.
Utility data is provided in Appendix A.

New Jersey BPU - Energy AuditsPage 5 of 18
3.3 HVAC Systems
3.3.1 Heating
The building does not contain a central heating system. Space heating is provided by seven electric unit heaters which distribute warm air to various parts of the building. Five of the electric unit heaters are ceiling mounted and two are wall mounted. Heat is controlled by wall mounted thermostats or unit mounted dial thermostats. It was observed that the heater located in the chemical storage room was operating while the room was unoccupied. None of the thermostats are programmable. Appendix B provides an Equipment Inventory.
3.3.2 Cooling
The building utilizes one small window air conditioning unit located in the rear office. The unit provides approximately 8,000 BTU of cooling and is controlled by an individual thermostat.
3.4 Lighting/Electrical Systems
The interior lighting within the building is comprised of mainly inefficient T-12 fluorescent light fixtures. The T-12s are original to building construction and are all 4’fixtures. Lighting is controlled by individual switches in each space. The lighting within the building remains in use with occupancy. In general, the lighting is turned on and off by the staff when the building is occupied. It is estimated that the lighting is in use approximately 20 hours per week. The single exit sign is energy efficient LED type wired individually to a breaker.
The building’s exterior lighting consists of three incandescent fixtures that utilize 200 watt bulbs. The exterior lighting is controlled by a switch within the building. The building utilizes a 60-kW ONAN backup diesel fired generator located inside the building.
3.5 Plumbing Systems
Hot water is produced by one Vanguard electric hot water tank located in the bathroom. The tank has a capacity of 30 gallons and utilizes 4.5 kW of electricity when both elements are energized. The unit was installed in 1983.
The plumbing system consists of domestic water, sanitary, and vent piping. Plumbing fixtures include one toilet, one sink, and floor drains.

New Jersey BPU - Energy AuditsPage 6 of 18
4.0 ENERGY CONSERVATION MEASURES
4.1 ECM-1 Lighting Replacements
A comprehensive fixture survey was conducted of the entire building. Each switch and circuit was identified, and the number of fixtures, locations, and existing wattage established. Most of the lighting consists of T-12 fluorescent fixtures with magnetic ballasts, which are regarded as inefficient by today’s standards. Each fixture is equipped with two 4-foot straight bulbs.
Overall energy consumption can be reduced by retrofitting approximately 12 T-12 fixtures with more efficient T-8 fluorescent lamps. Existing T-12 lamps and ballasts of each fixture can be replaced with electronic ballasts and two 4-foot, T-8 fluorescent lamps as required.
This measure will allow the facility to stock only T-8 fixtures in the future. Presently, the facility has a mixture of T-12 lamps with multiple ballast combinations. In the future, the facility should only purchase low wattage super T-8s and ballasts such as the low wattage 4-foot 28 watt units. These lamps may be directly installed into any existing 34 watt fixture when lamps fail. By installing these lamps over time, the most efficient lighting system available will be consistent throughout the facility.
The fluorescent lighting retrofits have an expected life of 15 years, according to ASHRAE, and total energy savings over the life of the project are estimated at 39,000 kWh and $7,500.
The implementation cost and savings related to this ECM are presented in Appendix C and summarized below:
ECM-1 Lighting Replacements
Budgetary Annual Utility Savings Potential Payback Payback
Cost Incentive* (without incentive) (with incentive)
Electricity Natural gas Total ROI
$ kW kWh Therms $ $ Years Years
1,700 1.1 2,600 0 500 3.1 200 3.4 3.0*Incentive is based on the New Jersey Smart Start Prescriptive Lighting Measures.
This measure is recommended when combined with ECM-2; see ECM-3.
4.2 ECM-2 Install Occupancy Sensors
It is proposed that occupancy sensors be installed in selected rooms to turn off lights when the area is unoccupied. A lighting survey was conducted of all fixtures to determine the average time lights are presently on in each space. Occupancy sensors were not considered in mechanical areas due to safety concerns. Other areas were not considered due to the proposed location of occupancy sensors. If a sensor does not have a clear view of the area, it may darken even with people in the space, creating an unsafe condition.
Lighting fixtures throughout the building are manually turned on and off at switches located within the spaces. The lights are operational as needed based on occupancy of the facility. Each interior building light is operated approximately 20 hours per week.

New Jersey BPU - Energy AuditsPage 7 of 18
Typical traffic patterns for each space were then taken into account to approximate the actual occupancy hours per day. Occupancy sensors were proposed only in the restroom and office space within this building. Two occupancy sensors and some standard electrical work are required for this measure.
Lighting controls have an expected life of 15 years, according to ASHRAE, and total energy savings over the life of the project are estimated at 3,150 kWh, and $450.
The implementation cost and savings related to this ECM are presented in Appendix C and summarized below:
ECM-2 Install Occupancy Sensors
Budgetary Annual Utility Savings Potential Payback Payback
Cost Incentive* (without incentive) (with incentive)
Electricity Natural gas Total ROI
$ kW kWh Therms $ $ Years Years
240 0.0 210 0 30 1.0 40 8.0 6.6*Incentive is based on the New Jersey Smart Start Prescriptive Lighting Measures.
This measure is recommended when combined with ECM-1; see ECM-3.
4.3 ECM-3 Lighting Replacements with Occupancy Sensors
This measure is a combination of ECMs 1 and 2 to allow for maximum energy and demand reduction. Due to interactive effects, the energy and cost savings for occupancy sensors and lighting upgrades are not cumulative.
The lighting retrofits and controls have an expected lifetime of 15 years, according to ASHRAE, and total energy savings over the life of the project are estimated at 40,950 kWh, and $7,500.
The implementation cost and savings related to this ECM are presented in Appendix C and summarized below:
ECM-3 Lighting Replacements with Occupancy Sensors
Budgetary Annual Utility Savings Potential Payback Payback
Cost Incentive* (without incentive) (with incentive)
Electricity Natural gas Total ROI
$ kW kWh Therms $ $ Years Years
1,900 1.1 2,730 0 500 2.7 200 3.8 3.4*Incentive is based on the New Jersey Smart Start Prescriptive Lighting Measures.
This measure is recommended.

New Jersey BPU - Energy AuditsPage 8 of 18
4.4 ECM-4 Install Door Seals
The doors are original to the building’s construction and the gaps around the perimeters result in air infiltration. Installing door seals will reduce infiltration and save energy. This measure determined the perimeter length and gap spacing of the two exterior doors. Infiltration reductions and associated energy savings were then calculated by using weather bin heating and cooling hour data.
Door seals have an expected life of 10 years, according to the manufacturer, and total energy savings over the life of the project are estimated at 4,000 kWh and $1,000.
The implementation cost and savings related to this ECM are presented in Appendix D and summarized below:
ECM-4 Install Door Seals
Budgetary Annual Utility Savings Potential Payback Payback
Cost Incentive* (without incentive) (with incentive)
Electricity Natural gas Total ROI
$ kW kWh Therms $ $ Years Years
230 0 420 0 80 2.3 NA 2.9 NA* There is no incentive available through the New Jersey Smart Start program for this ECM.
This measure is recommended.
4.5 ECM-5 50 HP Booster Motor Replacement
Of the two existing 50 HP electric motors on the water pumps, pump #2, which is an older model wasinefficient. This ECM evaluated replacing the existing standard efficiency motor on Pump #2 with apremium efficiency motor. Savings were determined by comparing the energy usage of the existing pump motor to the energy usage with a premium efficiency motor. According to a vendor who originally installed the motor on Pump #1, since the field work was performed at the site, the Township has replaced the standard efficiency motor on Pump #2 with a premium efficiency unit. The ECM assesses the energy that will be saved due to the replacement.
The Pump #2 motor has run hours of approximately 2,200 per year and will have an expected lifetime of 20 years, according to NEMA and the estimated total energy savings are 126,000 kWh over the life of the project or $22,000.
The implementation cost and savings related to this ECM are presented in Appendix E and summarized as below:
ECM-5 50-HP Booster Motor Replacement
Budgetary Annual Utility Savings Potential Payback Payback
Cost Incentive* (without incentive) (with incentive)
Electricity Natural gas Total ROI
$ kW kWh Therms $ $ Years Years
5,200 2.9 6,300 0 1,100 3.3 200 4.7 4.5
* Incentive shown is per the New Jersey Smart Start Program, 2009 Premium Motors Application for one 50-Hp motors.
This measure is recommended.

New Jersey BPU - Energy AuditsPage 9 of 18
4.6 ECM-6 Electric Unit Heater Occupancy Control
Space temperature is controlled by seven electric unit heaters with nonprogrammable thermostats. Due to the low occupancy of the building, this measure proposes to equip the unit heaters with occupancy controlled thermostats. This measure calculates energy savings based on setting back the electric heaters to 55°F when the space is not occupied. When occupancy is sensed by the occupancy sensor, the thermostat goes into an occupied mode (programmed setpoint) for 30 minutes. After 30 minutes have elapsed and no occupancy is sensed, the thermostat goes into unoccupied mode (i.e. setback setpoint or off) until occupancy is sensed again.
Occupancy controlled thermostats have an expected life of 15 years, according to ASHRAE, and total energy savings over the life of the project are estimated at 66,000 kWh and $12,000.
The implementation cost and savings related to this ECM are presented in Appendix F and summarized below:
ECM-6 Electric Unit Heater Occupancy Control
Budgetary Annual Utility Savings Potential Payback Payback
Cost Incentive* (without incentive) (with incentive)
Electricity Natural gas Total ROI
$ kW kWh Therms $ $ Years Years
2,500 0.0 4,400 0 800 3.9 NA 3.1 NA
* There is no incentive available through the New Jersey Smart Start program for this ECM. Note, a $75 incentive per thermostat is available for “Occupancy Controlled Thermostats for Hospitality/Institutional Facilities”. The Booster Station facility likely does not qualify for this incentive, however BPU may consider it applicable on a case-by-case basis.
This measure is recommended.
It should be noted that the Township of Roxbury could achieve similar energy savings without the installation of occupancy controlled thermostats. Timeclocks could achieve similar effects at lower cost.

New Jersey BPU - Energy AuditsPage 10 of 18
5.0 POTENTIAL INCENTIVES
5.1 Incentives Overview
The Booster Station facility energy conservation project may be eligible for incentives by the New Jersey Office of Clean Energy. The largest incentives available will be for the New Jersey Pay for Performance (P4P) Program. The P4P program is designed for qualified energy conservation projects in facilities that consume a minimum annual peak electric demand of 200 kW per month (building is eligible if the demand in any of the preceding 12 months exceeds 200kW). Facilities that meet this criterion must also achieve a minimum performance target of 15% by using an approved simulation modeling tool before and after construction. To utilize this program, a P4P Partner would need to be engaged.
Incentives for the P4P program include the following:
Incentive #1: The P4P Program pays $0.05 per square foot to a maximum of $50,000 or 50% of building annual energy cost for the P4P Partner to develop an Energy Reduction Plan (ERP). This incentive is paid after approval of the ERP and signed Installation Agreement. Applicant must agree to commit to implementation of the ERP within 6 months or the incentive must be returned to the state.
Incentive #2: Paid after installation of recommended measures; base incentives deliver $0.11/kWh and $1.10/therm not to exceed 30% of total project cost.
Incentive #3: Paid after acceptance of Post-Construction Benchmarking Report showing energy savings over one year utilizing the approved simulation modeling tool and EPA Portfolio Manager. Incentive #3 base incentives deliver $0.07/kWh and $0.70/therm not to exceed 20% of total project cost.
Combining Incentives #2 and #3 will deliver a total of $0.18/ kWh and $1.80/therm not to exceed 50% of total project cost. Incentives for #2 and #3 are increased by $0.005/kWh and $0.05/therm for each percentage increase above the minimum performance target calculated with the approved simulation modeling tool, not to exceed 50% of total project cost.
A new incentive structure has been announced for projects exceeding 20% in energy savings utilizing the required EPA portfolio manager benchmarking tool. The new incentive structure will double incentives #2 and #3 therefore producing a total of $0.36/kWh and a $3.60/ therm for those projects exceeding 20%. Incentive #1 for application preparation and energy reduction plan development has not changed however the maximum incentive has now been raised to 80% of project costs. The 200 kW/month minimum annual peak electric demand has been dropped so any structure can apply. This incentive structure will be in effect until December 31, 2010.
Incentives are also available for prescriptive measures for various types of equipment under the New Jersey SmartStart Buildings incentive program. This program provides incentives dependent upon the existing equipment type and proposed equipment retrofit measure. Prescriptive measures under this program are paid after installation and no energy savings verification will be required. If applicable, incentives from this program are reflected in the ECM summaries and attached appendices. If the building qualifies and enters into the New Jersey P4P Program, all energy savings from recommended ECMs are included in the total building energy usage and savings to be applied towards the P4P incentive, including any ECMs that may have incentives available in the SmartStart Buildings program. A project is not applicable for incentives in both programs.

New Jersey BPU - Energy AuditsPage 11 of 18
5.2 Building Incentives
5.2.1 New Jersey P4P Program
The building is eligible for incentives under the New Jersey P4P Program. For the 800 square foot building, Incentive #1 corresponds to approximately $40. Since the overall energy reduction for the building is estimated to exceed the 15% minimum, the building is eligible for Incentives #2 and #3. When calculating the total Incentive #2 and #3 for the New Jersey P4P Program, all energy conservation measures are included as the amount received is based on building wide energy improvements. If all the energy conservation measures analyzed in this report are implemented, the total available incentive is up to $2,500 and would reduce payback from 3.9 to 2.9 years.
5.2.2 New Jersey SmartStart Buildings Program
The building is also eligible for incentives under the New Jersey SmartStart Buildings Program for the Lighting Replacements with Occupancy Sensors energy conservation measures (ECM-3), and Premium Motors (ECM-5) suggested in this study. The total amount of all qualified incentives is about $400.
As mentioned previously, a project cannot apply for incentives from both the P4P Program and the SmartStart Buildings Program for the same project. See Appendix G for calculations.

New Jersey BPU - Energy AuditsPage 12 of 18
6.0 ALTERNATIVE ENERGY SCREENING EVALUATION
6.1 Geothermal
Geothermal heat pumps (GHP) transfer heat between the constant temperature of the earth and the building to maintain the building’s interior space conditions. Below the surface of the earth throughout New Jersey the temperature remains in the low 50F range throughout the year. This stable temperature provides a source for heat in the winter and a means to reject excess heat in the summer. With GHP systems, water is circulated between the building and the piping buried in the ground. The ground heat exchanger in a GHP system is made up of a closed or open loop pipe system. Most common is the closed loop in which high density polyethylene pipe is buried horizontally at 4-6 feet deep or vertically at 100 to 400 feet deep. These pipes are filled with an environmentally friendly antifreeze/water solution that acts as a heat exchanger. In the summer, the water picks up heat from the building and moves it to the ground. In the winter the system reverses and fluid picks up heat from the ground and moves it to the building. Heat pumps make collection and transfer of this heat to and from the building possible.
The Booster Station facility has five electric resistance wall hanging unit heaters and two wall mounted unit distributing warm air throughout the facility. Cooling is provided by one 8,000 BTU window DX unit. To take advantage of a GHP system, the building would have to install a low temperature closed loop water source heat pump system to realize the benefit of the consistent temperature of the ground. This will also include the removal of the existing heating and cooling system.
This measure is not recommended due to the high cost to replace the existing systems.
6.2 Solar
6.2.1 Photovoltaic Rooftop Solar Power Generation
The building was evaluated for the potential to install rooftop photovoltaic (PV) solar panels for power generation. Present technology incorporates the use of solar cell arrays that produce direct current (DC) electricity. This DC current is converted to alternating current (AC) with the use of an electrical device known as an inverter. The building’s roof has sufficient room to install a large solar cell array. A structural analysis would be required to determine if the roof framing could support a cell array.
The PVWATTS solar power generation model was utilized to calculate PV power generation. The New Jersey Clean Power Estimator provided by the New Jersey Clean Energy Program is presently being updated; therefore, the site recommended use of the PVWAT solar grid analyzer version 1. The closest city available in the model is Newark, New Jersey and a fixed tilt array type was utilized to calculate energy production. The PVWAT solar power generation model is provided in Appendix H.
The State of New Jersey incentives for non-residential PV applications is $1.00/watt up to 50 kW of installed PV array. Federal tax credits are also available for renewable energy projects up to 30% of installation cost. Municipalities do not pay federal taxes; therefore, would not be able to utilize the federal tax credit incentive.
Installation of (PV) arrays in the state New Jersey will allow the owner to participate in the New Jersey solar renewable energy certificates program (SREC). This is a program that has been set up to allow entities with large amounts of environmentally unfriendly emissions to purchase credits from zero emission (PV) solar-producers. An alternative compliance penalty (ACP) is paid for by the high emission producers and is set each year on a declining scale of 3% per year. One SREC credit is equivalent to

New Jersey BPU - Energy AuditsPage 13 of 18
1000 kilowatt hours of PV electrical production; these credits can be traded for period of 15 years from the date of installation. The cost of the ACP penalty for 2009 is $689; this is the amount that must be paid per SERC by the high emission producers. The expected dollar amount that will be paid to the PV producer for 2009 is expected to be $600/SREC credit. Payments that will be received from the PV producer will change from year to year dependent upon supply and demand. Renewable Energy Consultants is a third party SREC broker that has been approved by the New Jersey Clean Energy Program. As stated above there is no definitive way to calculate an exact price that will be received by the PV producer per SREC over the next 15 years. Renewable Energy Consultants estimated an average of $487/ SERC per year and this number was utilized in the cash flow for this report.
The Booster Station facility had a maximum kW demand of 62.9 kW and a minimum kW of 41.0 kW over the previous 12 months. The monthly average over the observed 12 month period was 47.4 kW. The facility’s existing load and roof area should justify the use of 2 kW of installed PV solar array; therefore, a 2 kW system size was selected for the calculations. The building’s roof has only limited space which would not support a larger system. The system costs for PV installations were derived from the most recent NYSERDA (New York State Energy Research and Development Agency) estimates of total cost of system installation. It should be noted that the cost of installation is currently $10 per watt or $10,000 per kW of installed system. This has increased in the past few years due to the rise in national demand for PV power generator systems. Other cost considerations will also need to be considered. PV panels have an approximate 20 year life span; however, the inverter device that converts DC electricity to AC has a life span of 10 to 12 years and will need to be replaced multiple times during the useful life of the PV system.
ECM –S1 Photovoltaic (PV) Rooftop Solar Power Generation –2 kW System
Budgetary Annual Utility Savings Total
New Jersey
Renewable
New Jersey
Renewable Payback Payback
Cost SavingsEnergy
Incentive* SREC**(without incentive)
(with incentives)
Electricity Natural gas Total
$ kW kWh Therms $ $ $ $ Years Years
20,000 0 2400 0 400 400 4,000 1200 >30 10.0*Incentive based on New Jersey Renewable Energy Program for non-residential applications of $1.00 per Watt of installed capacity** Estimated Solar Renewable Energy Certificate Program (SREC) for 15 years at $487/1000 kWh
This measure is not recommended at this time due to the long payback period; however, it could be a potentially viable renewable measure to be considered in the future if electricity rates continue to increase and if PV installation costs decline below $10 per watt.
6.2.2 Solar Thermal Domestic Hot Water Plant
Active solar thermal systems use solar collectors to gather the sun’s energy to heat water, another fluid, or air. An absorber in the collector converts the sun’s energy into heat. The heat is then transferred by circulating water, antifreeze, or sometimes air to another location for immediate use or storage for later utilization. Applications for active solar thermal energy include providing hot water, heating swimming pools, space heating, and preheating air in residential and commercial buildings.
A standard solar hot water system is typically composed of solar collectors, heat storage vessel, piping, circulators, and controls. Systems are typically integrated to work alongside a conventional heating system that provides heat when solar resources are not sufficient. The solar collectors are usually placed on the roof of the building, oriented south, and tilted around the site’s latitude, to maximize the amount of radiation collected on a yearly basis.

New Jersey BPU - Energy AuditsPage 14 of 18
Several options exist for using active solar thermal systems for space heating. The most common method involves using glazed collectors to heat a liquid held in a storage tank (similar to an active solar hot water system). The most practical system for the site would transfer the heat from the panels to thermal storage tanks and transfer solar produced thermal energy to use for domestic hot water production.
As of the writing of this report, there are no incentives available for installation of thermal solar systems. Presently there is a federal tax credit of 30% of installation cost for the thermal applications, however the Township of Roxbury does not pay federal taxes and, therefore, would not benefit from this program.
The facility has limited occupancy and one bath room sink. Due to low hot water use this measure is not recommended.
This measure is not recommended.
6.3 Wind
Small wind turbines use a horizontal axis propeller, or rotor, to capture the kinetic energy of the wind and convert it into rotary motion to drive a generator which usually is designed specifically for the wind turbine. The rotor consists of two or three blades, usually made from wood or fiberglass. These materials give the turbine the needed strength and flexibility, and have the added advantage of not interfering with television signals. The structural backbone of the wind turbine is the mainframe, and includes the slip-rings that connect the wind turbine, which rotates as it points into changing wind directions, and the fixed tower wiring. The tail aligns the rotor into the wind.
To avoid turbulence and capture greater wind energy, turbines are mounted on towers. Turbines should be mounted at least 30 feet above any structure or natural feature within 300 feet of the installation. Smaller turbines can utilize shorter towers. For example, a 250-watt turbine may be mounted on a 30-50 foot tower, while a 10 kW turbine will usually need a tower of 80-120 feet. Tower designs include tubular or latticed, guyed or self-supporting. Wind turbine manufacturers also provide towers.
The New Jersey Clean Energy Program for small wind installations has designated numerous pre-approved wind turbines for installation in the State of New Jersey. Incentives for wind turbine installations are based on kilowatt hours saved in the first year. Systems sized under 16,000 kWh per year of production will receive a $3.20 per kWh incentive. Systems producing over 16,000 kWh will receive $51,200 for the first 16,000 kWh of production with an additional $0.50 per kWh up to a maximum cap of 750,000 kWh per year. Federal tax credits are also available for renewable energy projects up to 30% of installation cost for systems less than 100 kW. However, as noted previously, municipalities do not pay federal taxes and are, therefore, not eligible for the tax credit incentive.
The most important part of any small wind generation project is the mean annual wind speed at the height of which the turbine will be installed. In the Roxbury New Jersey area, the map indicates a mean annual wind speed of below 10 miles per hour. For the building, there are site restrictions. Parking lots, radio communication towers, trees, and local residential housing would greatly affect a tower location. An aerial satellite image of the site and wind speed map is included in Appendix I.
This measure is not recommended due to the low mean annual wind speed.
6.4 Combined Heat and Power Generation (CHP)
Combined heat and power, cogeneration, is self-production of electricity on-site with beneficial recovery of the heat byproduct from the electrical generator. Common CHP equipment includes reciprocating

New Jersey BPU - Energy AuditsPage 15 of 18
engine-driven, micro turbines, steam turbines, and fuel cells. Typical CHP customers include industrial, commercial, institutional, educational institutions, and multifamily residential facilities. CHP systems that are commercially viable at the present time are sized approximately 50 kW and above, with numerous options in blocks grouped around 300 kW, 800 kW, 1,200 kW and larger. Typically, CHP systems are used to produce a portion of the electricity needed by a building some or all of the time, with the balance of electric needs satisfied by purchase from the grid.
Any proposed CHP project will need to consider many factors, such as existing system load, use of thermal energy produced, system size, natural gas fuel availability, and proposed plant location.
The Booster Station facility has sufficient need for electrical generation and the ability to use most of the thermal byproduct during the winter. Thermal usage during the summer months is low, and thermal energy produced by the CHP plant will be wasted. An absorption chiller could be installed to utilize the heat to produce chilled water; however, there is no chilled water distribution system in the building.
The most viable option for a CHP plant would be a reciprocating engine natural gas-fired unit. However, since the building does not have natural gas service, this option is not viable.
This measure is not recommended due to not having access to natural gas and limited use of summertime heat.
6.5 Biomass Power Generation
Biomass power generation is a process in which waste organic materials are used to produce electricity or thermal energy. These materials would otherwise be sent to the landfill or expelled to the atmosphere. To participate in NJCEP's Customer On-Site Renewable Energy program, participants must install an on-site sustainable biomass or fuel cell energy generation system. Incentives for bio-power installations are available to support up to 1MW-dc of rated capacity.
*Class I organic residues are eligible for funding through the NJCEP CORE program. Class I wastes include the following renewable supply of organic material:
Wood wastes not adulterated with chemicals, glues or adhesives Agricultural residues (corn stover, rice hulls or nut shells, manures, poultry litter, horse manure,
etc) and/or methane gases from landfills Food wastes Municipal tree trimming and grass clipping wastes Paper and cardboard wastes Non adulterated construction wood wastes, pallets
The NJDEP evaluates biomass resources not identified in the RPS.
Examples of eligible facilities for a CORE incentive include:
Digestion of sewage sludge Landfill gas facilities Combustion of wood wastes to steam turbine Gasification of wood wastes to reciprocating engine Gasification or pyrolysis of bio-solid wastes to generation equipment
* from NJOCE Website

New Jersey BPU - Energy AuditsPage 16 of 18
This measure is not recommended because the site does not have room to store the waste organic materials, noise issues, and potential zoning issues.
6.6 Demand Response Curtailment
Presently, the Booster Station facility has electricity delivered and supplied by Jersey Central Power and Lighting Corporation (JCP&L). Utility curtailment is an agreement with the regional transmission organization and an approved Curtailment Service Providers (CSP) to shed electrical load by either turning major equipment off or energizing all or part of a building utilizing an emergency generator, therefore reducing the electrical demand on the utility grid. PJM is the regional transmission organization (RTO) that coordinates the movement of wholesale electricity in all or parts of 13 states and the District of Columbia including the State of New Jersey.
This program is to benefit the utility company during high demand periods and PJM offers incentives to the CSP to participate in this program. Enrolling in the program will require program participants to drop electrical load or turn on their emergency generators during high electrical demand conditions or during emergencies. Part of the program also will require that program participants reduce their required load or run their emergency generators with notice to test the system. A minimum of 100 kW of curtailable load is required to enter the program. Discussions with the EnerNoc Corporation, an approved CSP, indicate that existing emergency generators will not pass the emissions requirements to enter the program.
Presently, the building has 60-kW of back up generation. During the observed period an average of 47.4 kW per month was needed. One of the two Booster pumps will need to run when tower filling is required, therefore the bulk of the electricity usage is needed during any request to reduce electrical load.
This is not recommended because the building load cannot be substantially reduced during a planned Demand Response Curtailment event.

New Jersey BPU - Energy AuditsPage 17 of 18
7.0 EPA PORTFOLIO MANAGER
The United State Energy Protection Agency (EPA) is a federal agency in charge of regulating environment waste and policy in the United States. The EPA has released the EPA Portfolio Manager for public use. The program is designed to allow property owners and managers to share, compare and improve upon their building’s energy consumption. Inputting such parameters at electricity, heating fuel, building characteristics and location into the website based program generates a naturalized energy rating score out of 100. Once an account is registered, monthly utility data can be entered to track the savings progress and retrieve an updated energy rating score on a monthly basis.
The building includes pumping equipment and an office area. Since more than 10% of the space is Other (i.e., Service), the building does not fall under the listed space description categories needed to generate a full report and provide an energy star rating. The portfolio manager did provide energy intensity ratings of a site intensity of 369 kBTU/ft2.
The building’s performance, however, can be compared to national site and source EUI averages. With a Source Energy Intensity of 369 kBTU/ft2/year, the building is considered a high energy consumer per the Portfolio Manager. Reducing energy loss associated with lighting retrofit, occupancy sensor installation, door seals, window repair, 50-Hp booster motor replacement, and electric unit heater occupancy control will result in a more favorable score. If all the measures recommended in this report are fully implemented, it is projected that a Source Energy Usage Index of 303 kBTU/ft2/year can be obtained.
A full EPA Energy Star Portfolio Manager Report is located in Appendix J. The user name and password was provided to Valarie Wyble, Executive Assistant, Township of Roxbury.

New Jersey BPU - Energy AuditsPage 18 of 18
8.0 CONCLUSIONS & RECOMMENDATIONS
The energy audit conducted by CHA at the Roxbury Township Water Department Booster Station (Booster Station), in Landing, New Jersey identified potential ECMs for lighting replacement with occupancy sensors, door seal replacement, booster motor replacement, and heater occupancy control. Potential annual savings of $2,480 may be realized for the recommended ECMs, with a summary of the costs,savings, and paybacks as follows:
ECM-3 Lighting Replacements with Occupancy Sensors
Budgetary Annual Utility Savings Potential Payback Payback
Cost Incentive* (without incentive) (with incentive)
Electricity Natural gas Total ROI
$ kW kWh Therms $ $ Years Years
1,900 1.1 2,730 0 500 2.7 200 3.8 3.4*Incentive is based on the New Jersey Smart Start Prescriptive Lighting Measures.
ECM-4 Install Door Seals
Budgetary Annual Utility Savings Potential Payback Payback
Cost Incentive* (without incentive) (with incentive)
Electricity Natural gas Total ROI
$ kW kWh Therms $ $ Years Years
230 0 420 0 80 2.3 NA 2.9 NA* There is no incentive available through the New Jersey Smart Start program for this ECM.
ECM-5 50-HP Booster Motor Replacement
Budgetary Annual Utility Savings Potential Payback Payback
Cost Incentive* (without incentive) (with incentive)
Electricity Natural gas Total ROI
$ kW kWh Therms $ $ Years Years
5,200 2.9 6,300 0 1,100 3.3 200 4.7 4.5
* Incentive shown is per the New Jersey Smart Start Program, 2009 Premium Motors Application for one 50-Hp motors.
ECM-6 Electric Unit Heater Occupancy Control
Budgetary Annual Utility Savings Potential Payback Payback
Cost Incentive* (without incentive) (with incentive)
Electricity Natural gas Total ROI
$ kW kWh Therms $ $ Years Years
2,500 0.0 4,400 0 800 3.9 NA 3.1 NA
* There is no incentive available through the New Jersey Smart Start program for this ECM. Note, a $75 incentive per thermostat is available for “Occupancy Controlled Thermostats for Hospitality/Institutional Facilities”. The Booster Station facility likely does not qualify for this incentive, however BPU may consider it applicable on a case-by-case basis.

APPENDIX A
Utility Usage Analysis

New Jersey BPU Energy Audit ProgramCHA #20556Building: Township of Roxbury Booster Station
Account Number: 10 00 00 1638 1 4Jersey Central Power and Lighting
OutdoorSupply Delivery Cost Blended Rate Unit Cost Unit Cost Lighting
Period kWH KW ($) ($/kWH) ($/kWH) ($/kW)1 1/1/2008 9,040 62.9 1,621.26 0.1793 0.1415 5.44 $0.002 2/1/2008 8,080 49.9 1,402.42 0.1736 0.1416 5.17 $0.003 3/1/2008 7,640 49.3 1,327.74 0.1738 0.1405 5.16 $0.004 4/1/2008 7,200 51.2 1,238.85 0.1721 0.1350 5.21 $0.005 5/1/2008 5,760 47.9 1,035.86 0.1798 0.1373 5.12 $0.006 6/1/2008 6,440 42.5 1,253.86 0.1947 0.1597 5.31 $0.007 7/1/2008 7,880 41.9 1,551.89 0.1969 0.1688 5.28 $0.008 8/1/2008 6,640 41.0 1,347.08 0.2029 0.1705 5.25 $0.009 9/1/2008 6,560 41.7 1,329.10 0.2026 0.1691 5.28 $0.00
10 10/1/2008 7,040 41.8 1,226.50 0.1742 0.1450 4.92 $0.0011 11/1/2008 7,280 53.2 1,336.82 0.1836 0.1452 5.25 $0.0012 12/1/2008 8,680 45.0 1,493.76 0.1721 0.1460 5.03 $0.00
Total 88,240 62.9 16,165$ 0.1832 0.1496 5.21 $0.00
Minimum Demand 41.0 kWAverage Demand 47.4 kW
Gallons of Water Pumped by Booster Station in 2008:
Water PumpedPeriod 10^3 Gallons
1/1/2008 3,2622/1/2008 2,6753/1/2008 2,7144/1/2008 3,0095/1/2008 3,7186/1/2008 4,3807/1/2008 3,5688/1/2008 3,2069/1/2008 4,117
10/1/2008 4,75811/1/2008 3,62812/1/2008
$38.74 $14.87 $0.60$90.29 $254.27 $129.57 $43.60$11.65 $763.35 $40.84 $28.51 $92.47 $258.15 $137.04 $46.11$11.65
$6.98
$88.11 $266.56
$205.75$279.50
$0.69
$1,035.86
$1,621.26
$226.45
$23.66 $0.64 $1,402.42$22.37 $1,327.74
$1,493.76
$153.32 $51.59 $26.47
$0.56$0.58$21.32
$0.71$11.65 $854.04 $52.09 $31.90
$721.78
$1,226.50$1,336.82
$0.51$0.62$0.52$0.52
$1,253.86$1,551.89$1,347.08$1,329.10
$25.42
$258.38
$23.07$19.44$19.21$20.61
kWH
$16.87 $0.46$18.86
$0.57
kW
$245.21$225.55
$97.23 $342.26
$1,496.54 $512.39$9,502.72 $458.48 -$255.34 $1,084.96
$147.21 $55.93
$220.00
$944.41 $46.42 -$59.87 $95.45-$63.20 $88.51
-$28.64 $89.57
$123.47 $43.97
$834.82 $33.27
$792.09 $38.93$765.97 $36.18 -$61.12 $87.32
$88.97 $109.22 $36.75
-$18.80 $89.96-$22.32 $96.11
$845.00 $33.67
-$23.24 $80.97 $97.69 $32.87
$133.64 $44.97$221.39-$24.39
$11.65$11.65
$139.80
$544.17 $29.21$754.08 $32.66
$1,002.80 $39.96
$11.65$11.65$11.65$11.65$11.65$11.65
Electricity
ElectricityTransitional Assessment
ChargeCustomer Charge
Energy Charge
Transmission Charge
Reconciliation Charge
Delivery Charge
Delivery Charge
Non-Utility Gen. Chg
Societal Benefit
System Control Total
$11.65 $680.21 $36.51 -$29.04 $122.11 $41.09 $21.08 $1,238.85
$2,960.23
$112.61 $37.89$215.14$111.26 $37.44$119.40 $40.18

Utility Data - RoxburyBoosterStation(rev-1).xlsElectricity Chart
0.0
10.0
20.0
30.0
40.0
50.0
60.0
70.0
80.0
90.0
100.0
0
1,000
2,000
3,000
4,000
5,000
6,000
7,000
8,000
9,000
10,000
Jan-
08
Feb
-08
Mar
-08
Apr
-08
May
-08
Jun-
08
Jul-0
8
Aug
-08
Sep
-08
Oct
-08
Nov
-08
Dec
-08
Dem
and
(kW
)
Usa
ge
(kW
h)
Pu
mp
ed W
ater
(10
^3 G
al)
Month
Electric Usage - Township of RoxburyBooster Station
Usage Water Pumped Demand

APPENDIX B
Equipment Inventory

NJBPU Energy AuditsCHA Project No. 20556Township of RoxburyShore Hills Booster Pump Station #2
Equipment Inventory
DescriptionManufacturer Name Model No. Equipment Type Capacity/Size Location Areas Served Date Installed
Useable Life Expectancy
(years) Other Info.Pump Motor #1 Reliance Mod:SKS326ATE215A
Ser:40112565 Eff. 94.57
Booster Pump Motor 50 Hp Station Main Area 2007 30
Pump Motor #2 Reliance Mod: P32000246 Eff. 87.5
Booster Pump Motor 50 Hp Station Main Area 1972 Nearing end of useful life
expectancy
Electric Unit Heater Marley MUH-07-8 Heater 7.5 Kw/208V Station Main Area Assumed >15 years
30 ceiling mounted
Electric Unit Heater Dayton Ese 1850 Heater 7.5 Kw/208V Station Main Area Assumed >15 years
30 ceiling mounted
Electric Unit Heater Marley MUH-10-8 (S/N 10-91-1995)
Heater 10 Kw/208V Station Main Area 1995 30 ceiling mounted
Electric Unit Heater Marley MUH-07-9 Heater 7.0 Kw/208V Station Main Area Assumed >15 years
30 ceiling mounted
Electric Unit Heater Dayton 2E636A Heater 2.4 Kw/208V Station Cholorine Area Assumed >15 years
30 ceiling mounted
Electric Unit Heater Dayton 5E185d Heater 3.0 kW Station Office 2007 30 wall mounted
Electric Unit Heater N/A N/A Heater 3.0 kW (est) Station Bath Room Assumed >15 years
30 wall mounted
Emergency Generator ONAN 60.0DYA-15R/92670 Ser:02735888836
Stand By 60 kW Station Main Area Assumed >15 years
30
Hot Water Heater Vangaurd Mod:1PZ Ser:1002236443
Hot Water Heater 9.0 kW Btu 30 Gallon
Station Bath Room Assumed >15 years
20
Window AC unit Fridgidare EAHG863IT2 AC Unit 8000 Btu Station Control Room Assumed >10 years
15
Computers (1) Various Various Personal Computer n/a Various Various Various Various VariousPrinters (1) Various Various Printer n/a Various Various Various Various Various
Pump Station ECM Calcs-(Rev-12).xlsxHVAC Inventory

APPENDIX C
ECM-1 Lighting Replacements
ECM-2 Install Occupancy Sensors
ECM-3 Lighting Replacements with Occupancy Sensors

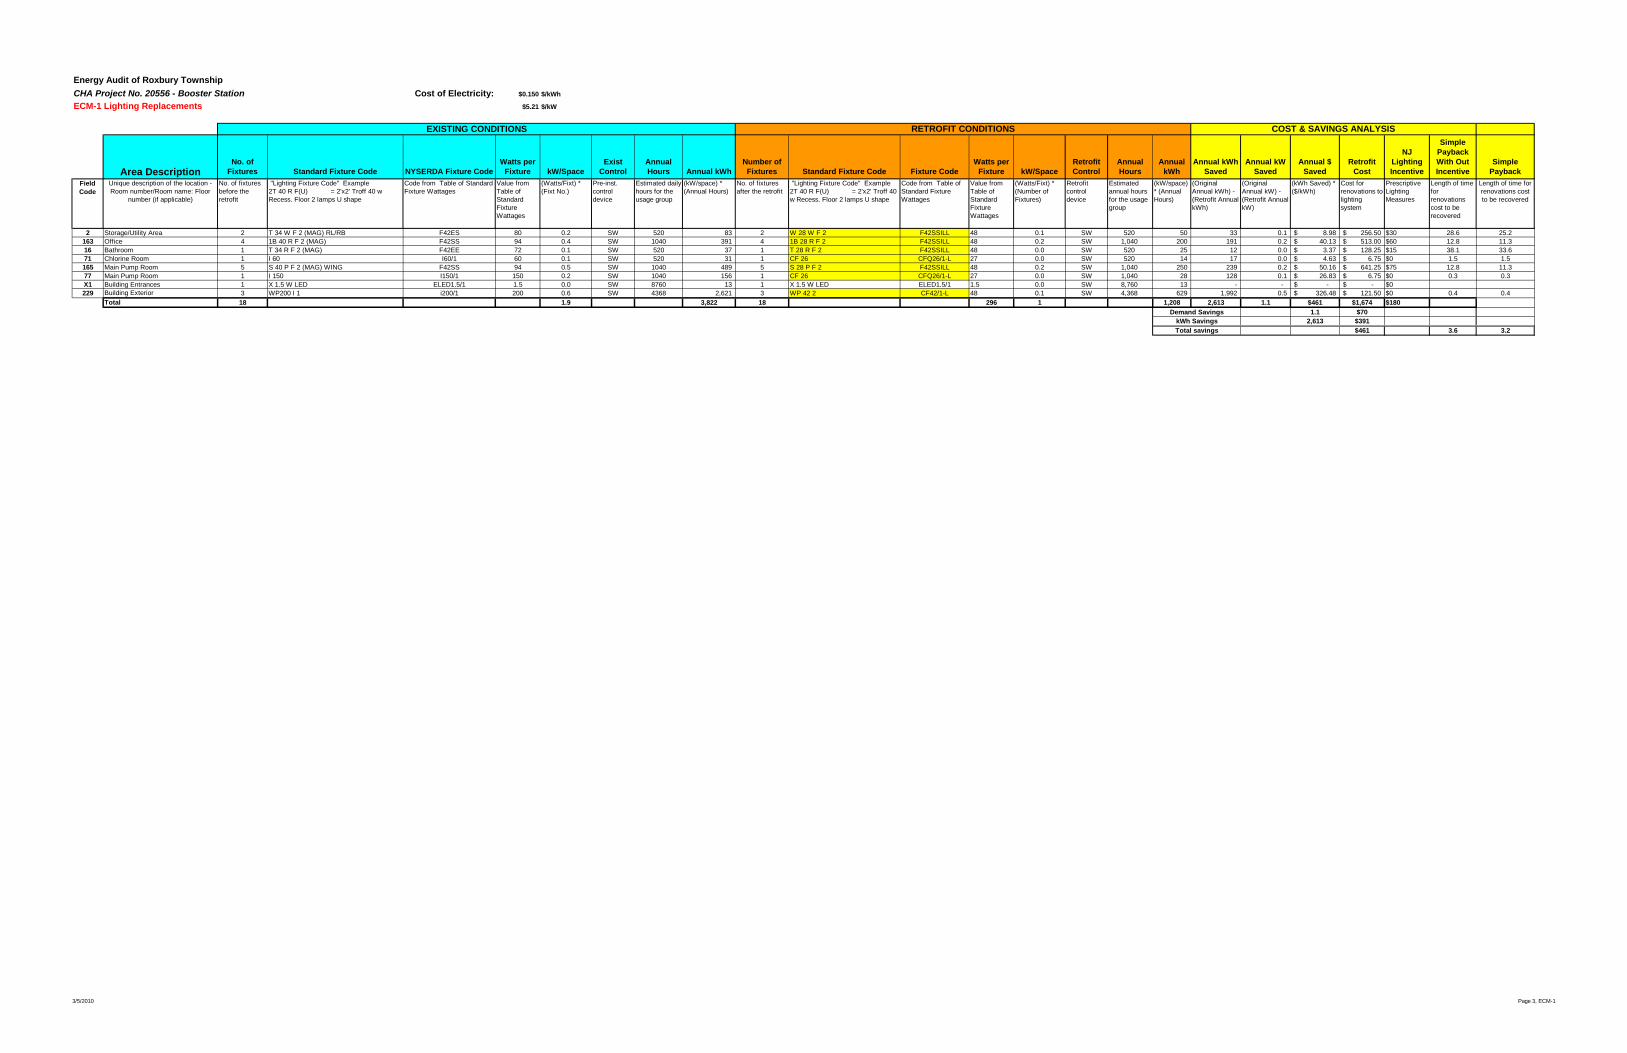
Energy Audit of Roxbury TownshipCHA Project No. 20556 - Booster Station Cost of Electricity: $0.150 $/kWh
Existing Lighting $5.21 $/kW
No. of Fixtures Standard Fixture Code NYSERDA Fixture Code
Watts per Fixture kW/Space Exist Control
Annual Hours
Retrofit Control
Annual kWh
Field Code
No. of fixtures
before the retrofit
"Lighting Fixture Code" Example 2T 40 R F(U) = 2'x2' Troff 40 w Recess. Floor 2 lamps U shape
Code from Table of Standard Fixture Wattages
Value from Table of Standard Fixture Wattages
(Watts/Fixt) * (Fixt No.)
Pre-inst. control device
Estimated annual hours for the usage
group
Retrofit control device
(kW/space) * (Annual Hours)
Notes
2 Storage/Utility Area 2 T 34 W F 2 (MAG) RL/RB F42ES 80 0.2 SW 520 None 83 area behind panel163 Office 4 1B 40 R F 2 (MAG) F42SS 94 0.4 SW 1040 OCC 391 one fixture not lit16 Bathroom 1 T 34 R F 2 (MAG) F42EE 72 0.1 SW 520 OCC 3771 Chlorine Room 1 I 60 I60/1 60 0.1 SW 520 None 31165 Main Pump Room 5 S 40 P F 2 (MAG) WING F42SS 94 0.5 SW 1040 None 48977 Main Pump Room 1 I 150 I150/1 150 0.2 SW 1040 None 156 above generatorX1 1 X 1.5 W LED ELED1.5/1 1.5 0.0 SW 8760 None 13229 3 WP200 I 1 i200/1 200 0.6 SW 4368 None 2,621
18 1.9 3,822
Unique description of the location - Room number/Room name: Floor
number (if applicable)
EXISTING CONDITIONS
Area Description
Building EntrancesBuilding ExteriorTotal
3/5/2010 Page 2, Existing
Energy Audit of Roxbury TownshipCHA Project No. 20556 - Booster Station Cost of Electricity: $0.150 $/kWh
ECM-1 Lighting Replacements $5.21 $/kW
No. of Fixtures Standard Fixture Code NYSERDA Fixture Code
Watts per Fixture kW/Space
Exist Control
Annual Hours Annual kWh
Number of Fixtures Standard Fixture Code Fixture Code
Watts per Fixture kW/Space
Retrofit Control
Annual Hours
Annual kWh
Annual kWh Saved
Annual kW Saved
Annual $ Saved
Retrofit Cost
NJ Lighting Incentive
Simple Payback With Out Incentive
Simple Payback
Field Code
No. of fixtures before the retrofit
"Lighting Fixture Code" Example 2T 40 R F(U) = 2'x2' Troff 40 w Recess. Floor 2 lamps U shape
Code from Table of Standard Fixture Wattages
Value from Table of Standard Fixture Wattages
(Watts/Fixt) * (Fixt No.)
Pre-inst. control device
Estimated daily hours for the usage group
(kW/space) * (Annual Hours)
No. of fixtures after the retrofit
"Lighting Fixture Code" Example 2T 40 R F(U) = 2'x2' Troff 40 w Recess. Floor 2 lamps U shape
Code from Table of Standard Fixture Wattages
Value from Table of Standard Fixture Wattages
(Watts/Fixt) * (Number of Fixtures)
Retrofit control device
Estimated annual hours for the usage group
(kW/space) * (Annual Hours)
(Original Annual kWh) - (Retrofit Annual kWh)
(Original Annual kW) - (Retrofit Annual kW)
(kWh Saved) * ($/kWh)
Cost for renovations to lighting system
Prescriptive Lighting Measures
Length of time for renovations cost to be recovered
Length of time for renovations cost to be recovered
2 2 T 34 W F 2 (MAG) RL/RB F42ES 80 0.2 SW 520 83 2 W 28 W F 2 F42SSILL 48 0.1 SW 520 50 33 0.1 8.98$ 256.50$ $30 28.6 25.2163 4 1B 40 R F 2 (MAG) F42SS 94 0.4 SW 1040 391 4 1B 28 R F 2 F42SSILL 48 0.2 SW 1,040 200 191 0.2 40.13$ 513.00$ $60 12.8 11.316 1 T 34 R F 2 (MAG) F42EE 72 0.1 SW 520 37 1 T 28 R F 2 F42SSILL 48 0.0 SW 520 25 12 0.0 3.37$ 128.25$ $15 38.1 33.671 1 I 60 I60/1 60 0.1 SW 520 31 1 CF 26 CFQ26/1-L 27 0.0 SW 520 14 17 0.0 4.63$ 6.75$ $0 1.5 1.5165 5 S 40 P F 2 (MAG) WING F42SS 94 0.5 SW 1040 489 5 S 28 P F 2 F42SSILL 48 0.2 SW 1,040 250 239 0.2 50.16$ 641.25$ $75 12.8 11.377 1 I 150 I150/1 150 0.2 SW 1040 156 1 CF 26 CFQ26/1-L 27 0.0 SW 1,040 28 128 0.1 26.83$ 6.75$ $0 0.3 0.3X1 1 X 1.5 W LED ELED1.5/1 1.5 0.0 SW 8760 13 1 X 1.5 W LED ELED1.5/1 1.5 0.0 SW 8,760 13 - - -$ -$ $0229 3 WP200 I 1 i200/1 200 0.6 SW 4368 2,621 3 WP 42 2 CF42/1-L 48 0.1 SW 4,368 629 1,992 0.5 326.48$ 121.50$ $0 0.4 0.4
18 1.9 3,822 18 296 1 1,208 2,613 1.1 $461 $1,674 $1801.1 $70
2,613 $391$461 3.6 3.2Total savings
kWh SavingsDemand Savings
Total
Bathroom
Main Pump Room
Chlorine RoomMain Pump Room
Building EntrancesBuilding Exterior
RETROFIT CONDITIONS
Area Description
Storage/Utility AreaOffice
EXISTING CONDITIONS
Unique description of the location - Room number/Room name: Floor
number (if applicable)
COST & SAVINGS ANALYSIS
3/5/2010 Page 3, ECM-1

Energy Audit of Roxbury TownshipCHA Project No. 20556 - Booster Station Cost of Electricity: $0.150 $/kWh
ECM-2 Install Occupancy Sensors $5.21 $/kW
No. of Fixtures Standard Fixture Code NYSERDA Fixture Code
Watts per Fixture kW/Space
Exist Control
Annual Hours Annual kWh
Number of Fixtures Standard Fixture Code Fixture Code
Watts per Fixture kW/Space
Retrofit Control
Annual Hours
Annual kWh
Annual kWh Saved
Annual kW Saved
Annual $ Saved
Retrofit Cost
NJ Lighting Incentive
Simple Payback With Out Incentive
Simple Payback
Field Code
No. of fixtures before the retrofit
"Lighting Fixture Code" Example 2T 40 R F(U) = 2'x2' Troff 40 w Recess. Floor 2 lamps U shape
Code from Table of Standard Fixture Wattages
Value from Table of Standard Fixture Wattages
(Watts/Fixt) * (Fixt No.)
Pre-inst. control device
Estimated annual hours for the usage group
(kW/space) * (Annual Hours)
No. of fixtures after the retrofit
"Lighting Fixture Code" Example 2T 40 R F(U) = 2'x2' Troff 40 w Recess. Floor 2 lamps U shape
Code from Table of Standard Fixture Wattages
Value from Table of Standard Fixture Wattages
(Watts/Fixt) * (Number of Fixtures)
Retrofit control device
Estimated annual hours for the usage group
(kW/space) * (Annual Hours)
(Original Annual kWh) - (Retrofit Annual kWh)
(Original Annual kW) - (Retrofit Annual kW)
(kW Saved) * ($/kWh)
Cost for renovations to lighting system
Length of time for renovations cost to be recovered
Length of time for renovations cost to be recovered
2 2 T 34 W F 2 (MAG) RL/RB F42ES 80 0.2 SW 520 83.2 2 T 34 W F 2 (MAG) RL/RB F42ES 80 0.2 None 520 83.2 0.0 0.0 $0.00 $0.00 $0.00163 4 1B 40 R F 2 (MAG) F42SS 94 0.4 SW 1040 391.0 4 1B 40 R F 2 (MAG) F42SS 94 0.4 OCC 520 195.5 195.5 0.0 $29.25 $118.75 $20.00 4.1 3.416 1 T 34 R F 2 (MAG) F42EE 72 0.1 SW 520 37.4 1 T 34 R F 2 (MAG) F42EE 72 0.1 OCC 260 18.7 18.7 0.0 $2.80 $118.75 $20.00 42.4 35.371 1 I 60 I60/1 60 0.1 SW 520 31.2 1 I 60 I60/1 60 0.1 None 520 31.2 0.0 0.0 $0.00 $0.00 $0.00165 5 S 40 P F 2 (MAG) WING F42SS 94 0.5 SW 1040 488.8 5 S 40 P F 2 (MAG) WING F42SS 94 0.5 None 1040 488.8 0.0 0.0 $0.00 $0.00 $0.0077 1 I 150 I150/1 150 0.2 SW 1040 156.0 1 I 150 I150/1 150 0.2 None 1040 156.0 0.0 0.0 $0.00 $0.00 $0.00X1 1 X 1.5 W LED ELED1.5/1 1.5 0.0 SW 8760 13.1 1 X 1.5 W LED ELED1.5/1 1.5 0.0 None 8760 13.1 0.0 0.0 $0.00 $0.00 $0.00229 3 WP200 I 1 i200/1 200 0.6 SW 4368 2,620.8 3 WP200 I 1 i200/1 200 0.6 None 4368 2,620.8 0.0 0.0 $0.00 $0.00 $0.00
18 1.9 3,822 18 2 3,607 214 0 32 $238 400.0 $0214 $32
$32 7.4 6.2
Main Pump Room
Total Savings
TotalDemand Savings
kWh Savings
OfficeBathroom
Building Exterior
Chlorine Room
Building EntrancesMain Pump Room
COST & SAVINGS ANALYSIS
Area DescriptionUnique description of the location - Room number/Room name: Floor
number (if applicable)
EXISTING CONDITIONS RETROFIT CONDITIONS
Storage/Utility Area
3/5/2010 Page 4, ECM-2

Energy Audit of Roxbury TownshipCHA Project No. 20556 - Booster Station Cost of Electricity: $0.150 $/kWh
ECM-3 Lighting Replacements Occupancy Sensors $5.21 $/kW
No. of Fixtures Standard Fixture Code NYSERDA Fixture Code
Watts per Fixture kW/Space
Exist Control
Annual Hours Annual kWh
Number of Fixtures Standard Fixture Code Fixture Code
Watts per Fixture kW/Space
Retrofit Control
Annual Hours
Annual kWh
Annual kWh Saved
Annual kW Saved
Annual $ Saved Retrofit Cost
NJ Lighting Incentive
Simple Payback With Out Incentive
Simple Payback
Field Code
No. of fixtures before the retrofit
"Lighting Fixture Code" Example 2T 40 R F(U) = 2'x2' Troff 40 w Recess. Floor 2 lamps U shape
Code from Table of Standard Fixture Wattages
Value from Table of Standard Fixture Wattages
(Watts/Fixt) * (Fixt No.)
Pre-inst. control device
Estimated daily hours for the usage group
(kW/space) * (Annual Hours)
No. of fixtures after the retrofit
"Lighting Fixture Code" Example 2T 40 R F(U) = 2'x2' Troff 40 w Recess. Floor 2 lamps U shape
Code from Table of Standard Fixture Wattages
Value from Table of Standard Fixture Wattages
(Watts/Fixt) * (Number of Fixtures)
Retrofit control device
Estimated annual hours for the usage group
(kW/space) * (Annual Hours)
(Original Annual kWh) - (Retrofit Annual kWh)
(Original Annual kW) - (Retrofit Annual kW)
(kWh Saved) * ($/kWh)
Cost for renovations to lighting system
Prescriptive Lighting Measures
Length of time for renovations cost to be recovered
Length of time for renovations cost to be recovered
2 2 T 34 W F 2 (MAG) RL/RB F42ES 80 0.2 SW 520 83 2 W 28 W F 2 F42SSILL 48 0.1 None 520 50 33 0.1 8.98$ 256.50$ 30$ 28.6 25.2163 4 1B 40 R F 2 (MAG) F42SS 94 0.4 SW 1040 391 4 1B 28 R F 2 F42SSILL 48 0.2 OCC 520 100 291 0.2 55.07$ 631.75$ 80$ 11.5 10.016 1 T 34 R F 2 (MAG) F42EE 72 0.1 SW 520 37 1 T 28 R F 2 F42SSILL 48 0.0 OCC 260 12 25 0.0 5.23$ 247.00$ 35$ 47.2 40.571 1 I 60 I60/1 60 0.1 SW 520 31 1 CF 26 CFQ26/1-L 27 0.0 None 520 14 17 0.0 4.63$ 6.75$ -$ 1.5 1.5165 5 S 40 P F 2 (MAG) WING F42SS 94 0.5 SW 1040 489 5 S 28 P F 2 F42SSILL 48 0.2 None 1,040 250 239 0.2 50.16$ 641.25$ 75$ 12.8 11.377 1 I 150 I150/1 150 0.2 SW 1040 156 1 CF 26 CFQ26/1-L 27 0.0 None 1,040 28 128 0.1 26.83$ 6.75$ -$ 0.3 0.3X1 1 X 1.5 W LED ELED1.5/1 1.5 0.0 SW 8760 13 1 X 1.5 W LED ELED1.5/1 1.5 0.0 None 8,760 13 - - -$ -$ -$ 229 3 WP200 I 1 i200/1 200 0.6 SW 4368 2,621 3 WP 42 2 CF42/1-L 48 0.1 None 4,368 629 1,992 0.5 326.48$ 121.50$ -$ 0.4 0.4
18 1.9 3,822 18 0.8 1,096 1.1 477 1,912 220
1.1 $702,726 $408
$477 4.0 3.5
Bathroom
Storage/Utility Area
Chlorine Room
Building EntrancesBuilding Exterior
Office
Main Pump RoomMain Pump Room
Total Savings
RETROFIT CONDITIONS
Unique description of the location - Room number/Room name: Floor
number (if applicable)
COST & SAVINGS ANALYSIS
Demand Savings
Area Description
kWh Savings
Total
EXISTING CONDITIONS
3/5/2010 Page 5, ECM-3
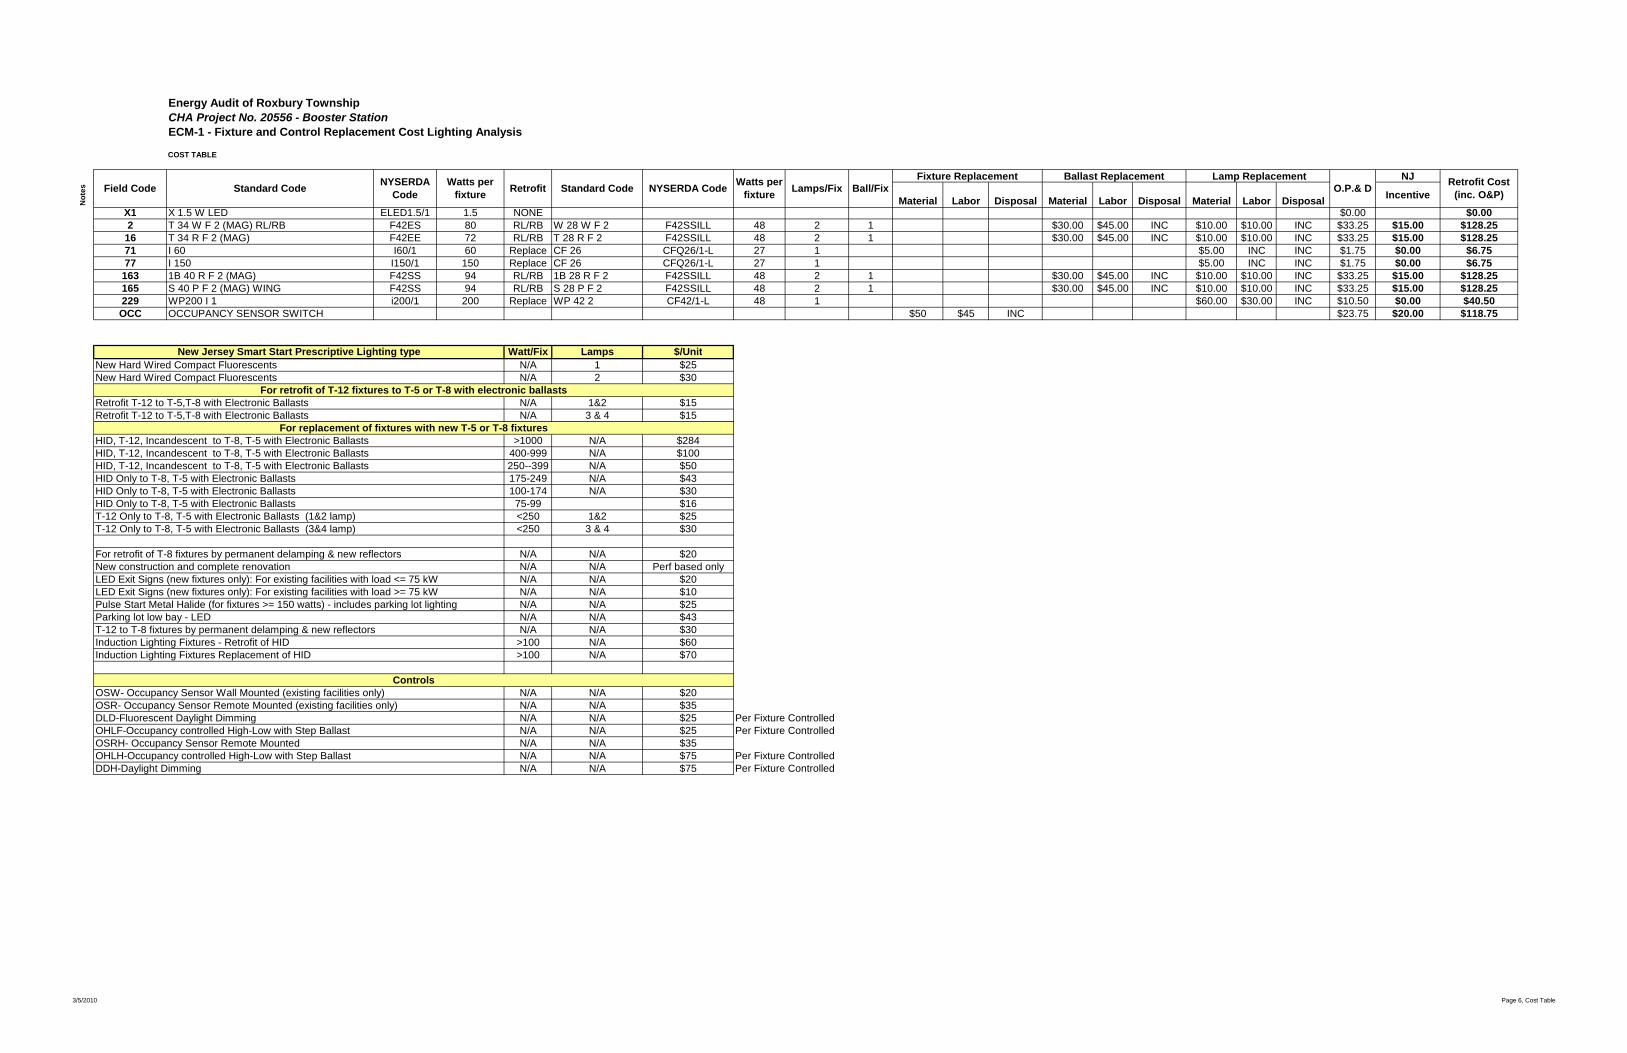
Energy Audit of Roxbury TownshipCHA Project No. 20556 - Booster StationECM-1 - Fixture and Control Replacement Cost Lighting Analysis
COST TABLE
NJ
Material Labor Disposal Material Labor Disposal Material Labor Disposal Incentive
X1 X 1.5 W LED ELED1.5/1 1.5 NONE $0.00 $0.002 T 34 W F 2 (MAG) RL/RB F42ES 80 RL/RB W 28 W F 2 F42SSILL 48 2 1 $30.00 $45.00 INC $10.00 $10.00 INC $33.25 $15.00 $128.25
16 T 34 R F 2 (MAG) F42EE 72 RL/RB T 28 R F 2 F42SSILL 48 2 1 $30.00 $45.00 INC $10.00 $10.00 INC $33.25 $15.00 $128.2571 I 60 I60/1 60 Replace CF 26 CFQ26/1-L 27 1 $5.00 INC INC $1.75 $0.00 $6.7577 I 150 I150/1 150 Replace CF 26 CFQ26/1-L 27 1 $5.00 INC INC $1.75 $0.00 $6.75
163 1B 40 R F 2 (MAG) F42SS 94 RL/RB 1B 28 R F 2 F42SSILL 48 2 1 $30.00 $45.00 INC $10.00 $10.00 INC $33.25 $15.00 $128.25165 S 40 P F 2 (MAG) WING F42SS 94 RL/RB S 28 P F 2 F42SSILL 48 2 1 $30.00 $45.00 INC $10.00 $10.00 INC $33.25 $15.00 $128.25229 WP200 I 1 i200/1 200 Replace WP 42 2 CF42/1-L 48 1 $60.00 $30.00 INC $10.50 $0.00 $40.50OCC OCCUPANCY SENSOR SWITCH $50 $45 INC $23.75 $20.00 $118.75
Watt/Fix Lamps $/UnitN/A 1 $25N/A 2 $30
N/A 1&2 $15N/A 3 & 4 $15
>1000 N/A $284400-999 N/A $100250--399 N/A $50175-249 N/A $43100-174 N/A $30
75-99 $16<250 1&2 $25<250 3 & 4 $30
N/A N/A $20N/A N/A Perf based onlyN/A N/A $20N/A N/A $10N/A N/A $25N/A N/A $43N/A N/A $30
>100 N/A $60>100 N/A $70
N/A N/A $20N/A N/A $35N/A N/A $25 Per Fixture ControlledN/A N/A $25 Per Fixture ControlledN/A N/A $35N/A N/A $75 Per Fixture ControlledN/A N/A $75 Per Fixture Controlled
HID, T-12, Incandescent to T-8, T-5 with Electronic Ballasts
LED Exit Signs (new fixtures only): For existing facilities with load >= 75 kWPulse Start Metal Halide (for fixtures >= 150 watts) - includes parking lot lightingParking lot low bay - LEDT-12 to T-8 fixtures by permanent delamping & new reflectors
For retrofit of T-8 fixtures by permanent delamping & new reflectorsNew construction and complete renovation
DDH-Daylight Dimming
OSW- Occupancy Sensor Wall Mounted (existing facilities only)OSR- Occupancy Sensor Remote Mounted (existing facilities only)
OHLF-Occupancy controlled High-Low with Step Ballast
OHLH-Occupancy controlled High-Low with Step Ballast
Retrofit T-12 to T-5,T-8 with Electronic Ballasts
OSRH- Occupancy Sensor Remote Mounted
DLD-Fluorescent Daylight Dimming
Controls
Induction Lighting Fixtures Replacement of HID
New Jersey Smart Start Prescriptive Lighting type
HID Only to T-8, T-5 with Electronic Ballasts
LED Exit Signs (new fixtures only): For existing facilities with load <= 75 kW
Induction Lighting Fixtures - Retrofit of HID
HID, T-12, Incandescent to T-8, T-5 with Electronic Ballasts
Retrofit Lamp Replacement
Ball/FixNYSERDA CodeWatts per
fixtureStandard Code
New Hard Wired Compact Fluorescents
Retrofit T-12 to T-5,T-8 with Electronic Ballasts
New Hard Wired Compact Fluorescents
Standard CodeRetrofit Cost
(inc. O&P)O.P.& DField Code
Fixture Replacement Ballast ReplacementLamps/Fix
For replacement of fixtures with new T-5 or T-8 fixtures
For retrofit of T-12 fixtures to T-5 or T-8 with electronic ballasts
T-12 Only to T-8, T-5 with Electronic Ballasts (1&2 lamp)T-12 Only to T-8, T-5 with Electronic Ballasts (3&4 lamp)
No
tes NYSERDA
CodeWatts per
fixture
HID Only to T-8, T-5 with Electronic Ballasts
HID Only to T-8, T-5 with Electronic Ballasts
HID, T-12, Incandescent to T-8, T-5 with Electronic Ballasts
3/5/2010 Page 6, Cost Table

Energy Audit of Roxbury TownshipCHA Project No. 20556 - Booster StationECM 1 - Fixture and Control Replacement Cost Lighting Analysis
Hours/Day Hours/Year Proposed Utilized24 8760 8760 Y4 1040 520 Y
12 4368 4368 Y2 520 520 Y2 520 260 Y4 1040 1040 YPump Room
Hours of Operation
Bath Room
Outdoor Lighting
Energy Audit of Roxbury TownshipExitsOffices
Storage Areas
3/5/2010 Page 7, Operating Hours

APPENDIX D
ECM-4 Install Door Seals

NJBPU Energy AuditsCHA Project No. 20556Building: Shore Hills Booster Pump Station #2
ECM - 4 Install Door Seals
Existing: Lack of door seals result in excessive heat loss and infiltrationProposed: Install door seals and/or weather-stripping to reduce air infiltration
Heating System Efficiency 100% Ex Occupied Clng Temp. N/A *F Ex Occupied Htg Temp. 60 *FCooling System Efficiency 1.20 kW/ton Ex Unoccupied Clng Temp. N/A *F Ex Unoccupied Htg Temp. 60 *F
Prop Occupied Clng Temp. N/A *F Prop Occupied Htg Temp. 60 *FLinear Feet of Door Edge 45 Prop Unoccupied Clng Temp. N/A *F Prop Unoccupied Htg Temp. 60 *FExisting Infiltration Factor* 0.5 cfm/LF Cooling Occ Enthalpy Setpoint 27.5 Btu/lb Electricity 0.18$ $/kWh Proposed Infiltration Factor* 0.2 cfm/LF Cooling Unocc Enthalpy Setpoint 27.5 Btu/lb Natural Gas -$ $/therm*Infiltration Factor per Carrier Handbook of Air Conditioning System Designbased on average door seal gap calculated below.
Occupied Unoccupied Occupied Unoccupied
Avg Outdoor Air Temp.
Bins °FAvg Outdoor Air Enthalpy
Existing Equipment Bin
Hours
Occupied Equipment Bin
Hours
Unoccupied Equipment Bin
HoursDoor Infiltration Load BTUH
Door Infiltration
Load BTUHDoor Infiltration Load BTUH
Door Infiltration
Load BTUH
Existing Cooling Energy
kWh
Proposed Cooling Energy
kWh
Existing Heating Energy
therms
Proposed Heating Energy therms
A B C D E F G H I J K L
102.5 49.1 0 0 0 0 0 0 0 0 0 0 097.5 42.5 3 1 2 0 0 0 0 0 0 0 092.5 39.5 34 16 18 0 0 0 0 0 0 0 087.5 36.6 131 62 69 0 0 0 0 0 0 0 082.5 34.0 500 238 262 0 0 0 0 0 0 0 077.5 31.6 620 295 325 0 0 0 0 0 0 0 072.5 29.2 664 316 348 0 0 0 0 0 0 0 067.5 27.0 854 407 447 0 0 0 0 0 0 0 062.5 24.5 927 441 486 0 0 0 0 0 0 0 057.5 21.4 600 286 314 61 61 24 24 0 0 0 052.5 18.7 610 290 320 182 182 73 73 0 0 1 047.5 16.2 611 291 320 304 304 122 122 0 0 2 142.5 14.4 656 312 344 425 425 170 170 0 0 3 137.5 12.6 1,023 487 536 547 547 219 219 0 0 6 232.5 10.7 734 350 384 668 668 267 267 0 0 5 227.5 8.6 334 159 175 790 790 316 316 0 0 3 122.5 6.8 252 120 132 911 911 365 365 0 0 2 117.5 5.5 125 60 65 1,033 1,033 413 413 0 0 1 112.5 4.1 47 22 25 1,154 1,154 462 462 0 0 1 07.5 2.6 22 10 12 1,276 1,276 510 510 0 0 0 02.5 1.0 13 6 7 1,397 1,397 559 559 0 0 0 0-2.5 0.0 0 0 0 1,519 1,519 608 608 0 0 0 0-7.5 -1.5 0 0 0 1,640 1,640 656 656 0 0 0 0
TOTALS 8,760 4,171 4,589 0 0 24 10
Existing Door Infiltration 23 cfm Savings 14 therms -$ Existing Unoccupied Door Infiltration 23 cfm 419 kWh 77$ Proposed Door Infiltration 9 cfm 0 kWh -$ Proposed Unoccupied Door Infiltration 9 cfm 419 kWh 77$
DoorWidth
(ft)Height
(ft)Linear Feet (LF)
gap (in)
gap location LF of gap % door w/ gapAverage gap for
door (in)Main Door 4 7.5 23 0.25 all sides 23 100% 0.25
Chlorine Rm. Door 3.5 7.5 22 0.25 all sides 22 100% 0.25Total 7.5 15 45 0.250 45 100% 0.250
Note: Doors labeled 'a', 'b', etc. are a part of the same door assembly.
EXISTING LOADS PROPOSED LOADS COOLING ENERGY HEATING ENERGY
Pump Station ECM Calcs-(Rev-12).xlsxECM-4 Door Seals

NJBPU Energy Audits
CHA Project No. 20556
Building: Shore Hills Booster Pump Station #2 Multipliers0.99
ECM - 4 Install Door Seals Labor: 1.22Equipment: 1.09
MAT. LABOR EQUIP. MAT. LABOR EQUIP.-$
Door Seals (3'x7') 2 ea 35$ 50$ -$ 69$ 122$ -$ 191$ Door Seals (double door - 6' x 7') 0 ea 65$ 100$ -$ -$ -$ -$ -$
-$ -$ -$ -$ -$ -$ -$ -$ -$ -$ -$ -$ -$ -$ -$ -$ -$ -$ -$ -$ -$ -$ -$ -$ -$ -$ -$ -$ -$ -$ -$ -$
191$ Subtotal19$ 10% Contingency
21$ 10%Contractor O&P
-$ 0% Engineering231$
Description QTY UNIT UNIT COSTS
Total
SUBTOTAL COSTS TOTAL COST
REMARKS
Pump Station ECM Calcs-(Rev-12).xlsxECM-4 Cost Est

APPENDIX E
ECM-5 50 HP Booster Motor Replacement

NJBPU Energy AuditsCHA Project No. 20556Building: Shore Hills Booster Pump Station #2 Demand Energy
Cost Cost Material Labor EquipmentECM - 5 50 Hp Booster Motor Replacement $/kW-month $/kWh
5.21$ 0.15$ 0.99 1.22 1.09Savings Analysis Cost Estimates
New NjExisting Load Existing Existing New Load New New Demand Demand Annual kWh $ kWh Total $ Estimated Payback Incentive
# Description Location HP Factor Efficiency kW HPb Factor Efficiency kW Savings Savings $ Hours Savings Savings Savings Cost Years Materials Labor Equipment Materials Labor Equipment Total Cost
1 Pump #2 Station 50 0.9 0.875 38.4 50 0.9 0.946 35.5 2.878 180$ 2,200 6,332 948$ 1,128$ 5,190$ 4.6 2,771$ 600$ -$ 2,743$ 732$ -$ 3,475$ 198$ Total 50 38.4 50 35.5 2.88 180$ 6,332 948$ 1,128$ 5,190$
2.9Notesa Price quote by Pegasus Electric, 908-852-3750 $5,190 Price will be honored Unitil March 2010
b Existing and new efficiencies should be entered if known. If not known,use provided curve fit based on "DOE Survey Installed Average" and NEMA Premiumvalues, respectively.
c Same as existing HP unless resized to better match load
Unit Costs Subtotal Costs
Multipliers
Pump Station ECM Calcs-(Rev-12).xlsxECM-5 Prem Motors

APPENDIX F
ECM-6 Electric Unit Heater Occupancy Control

NJBPU Energy AuditsCHA Project No. 20556Building: Shore Hills Booster Pump Station #2
ECM - 6 Electric Unit Heater Occupancy ControlDescription Contol electric unit heaters with occupancy sening thermoststs
Given Electric Energy Costs 0.183 $/kWhGas Energy Costs 0 $/mcfOperating Weeks per Year 25Cooling Season N/A wksHeating Season 25 wksSummer Indoor Setpoint Temp N/A degFWinter Indoor Setpoint 65 degFTotal Fan System Load 1.5 HP
Assumptions Reduction in Runtime Hours 60 hrs/wkChiller Efficiency N/A kW/tonHeating Plant Efficiency 100%Summer Unocc. Temp N/A degFWinter Unocc. Temp 55 degFHeating Value of Fuel N/A Btu/mcfCFM per motor HP 1000 cfm/hpCycling Factor for off hours runtime 50%
Formula Motor Energy Savings = (HP x 0.746 x reduced hours x operating weeksx)(1-Cf)
Cooling Energy Savings = (Fhp x (cfm/hp) x 1.08 x Td x Hr x W x Ceff)/12,000where, Fhp = Fan HP; cfm/hp = 1000; Td = (Avg Summer Unocc Temp - Summer Indoor Setpoint);Hr = Reduction in Clg. Operating hours; W = Cooling Season; Ceff = chiller efficiency
Heating Energy Savings = ((Fhp x (cfm/hp) x 1.08 x Td x Hr x W)/(HBtu x Heff))(1-Cf)where, HBtu - Heating value of fuel; Heff - heating system efficiency; W - Winter Season; Td - (Winter Indoor Setpoint - Avg Unocc Winter Temp)
HP Conv. Reduced Hrs Weeks CyclingFactorCalculation Motor Savings=( 1.5 x 0.746 x 60 x 25 )x( 1 - 50% )= 839 Kwh
HPCFM/HP Conv. Td
Reduced Hrs
Clg Wks Ceff
Clg. Savings =( 1.5 x 1000 x 1.08 x N/A x 60 x N/A x N/A )/ 12,000 = 0 Kwh
HPCFM/HP Conv. Td
Reduced Hrs
Htg Wks btu/kWh Heff
Cycling Factor
Htg. Savings =( 1.5 x 1000 x 1.08 x 10 x 60 x 25 )/( 3412 x 100% )x( 1 - 50% )= 3,561 kWh
Result Annual Motor Savings= 839 kWhAnnual Cooling Savings= 0 kWhAnnual Heating Savings= 3,561 kWhTotal kWh Savings 4,400 kWhAnnual Cost Savings= $805
Comments
Pump Station ECM Calcs-(Rev-12).xlsxECM-6 Unit Heater Control

NJBPU Energy AuditsCHA Project No. 20556
Shore Hills Booster Pump Station #2 Multipliers0.99
ECM - 6 Electric Unit Heater Occupancy Control Labor: 1.22Equipment: 1.09
MAT. LABOR EQUIP. MAT. LABOR EQUIP.
7 ea 223 90$ 1545.39 769$ 0 1,937$
1,937$ Subtotal193.70$ 10% Contingency
319.61$ 15% Contractor O&P-$ 0% Engineering
2,450$ Total
SUBTOTAL COSTSTOTAL COST REMARKS
Means Mechanical Cost Data - 2009
UNIT COSTS
Unit Heater Occupancy Sensing Thermostat Controler
Description QTY UNIT
Pump Station ECM Calcs-(Rev-12).xlsxECM-6 Heater Control Cost Est

APPENDIX G
New Jersey Pay For Performance Incentive Program

NJBPU Energy AuditsCHA Project No. 20556Shore Hills Booster Pump Station #2
New Jersey Pay For Performance Incentive Program
Note: The following calculation is based on the New Jersey Pay For Performance Incentive Program per September, 2009. The values represented below are only applicable through December 31, 2010.
0.5 * Maximum allowable incentive
kWh Therms $/kWh $/thermExisting Usage 88,240 0 Incentive #2 $0.11 $1.10
Proposed Savings 13,877 0 Incentive #3 $0.07 $0.70Existing Total MMBtus $0.18 $1.80
Proposed Savings MMBtus% Reduction 0.8 * Maximum allowable incentive
Proposed Annual Savings$/kWh $/therm
Incentive #2 $0.22 $2.20Incentive #3 $0.14 $1.40
$0.36 $3.60Elec Gas Total
Incentive #2 $1,527 $0 $1,527Incentive #3 $971 $0 $971
Totals $2,498 $0 $2,498
Total Project Cost $9,783% Incentives of Project Cost* 25.5% w/o Incentives w/ IncentivesProject Cost w/ Incentives* $7,285 3.9 2.9
* Maximum allowable incentive is 80% of total project cost, or $2 million per gas account and $2 million per electric account
EPA Portfolio Manager:kWh Therms
Proposed Savings 13,877 0Proposed Savings MMBtus
% Reduction* Includes savings for lighting measures with prescriptive incentives.
15.7%≥ 20%
4715.7%
≥ %15 - < 20%
Incentives $
Project Payback (years)
$2,487
Annual Utilities
30147
Pump Station ECM Calcs-(Rev-12).xlsxP4P Incentive

APPENDIX H
Photovoltaic (PV) Rooftop Solar Power Generation

Please send questions and comments regarding PVWATTS to Webmaster
Disclaimer and copyright notice
Return to RReDC home page (http://rredc.nrel.gov )
* * *AC Energy
&Cost Savings
Station Identification
City: Newark
State: New_Jersey
Latitude: 40.70° N
Longitude: 74.17° W
Elevation: 9 m
PV System Specifications
DC Rating: 2.0 kW
DC to AC Derate Factor: 0.770
AC Rating: 1.5 kW
Array Type: Fixed Tilt
Array Tilt: 40.7°
Array Azimuth: 180.0°
Energy Specifications
Cost of Electricity: 18.0 ¢/kWh
Results
MonthSolar
Radiation(kWh/m2/day)
AC Energy(kWh)
Energy Value
($)
1 3.36 166 29.88
2 4.05 179 32.22
3 4.58 217 39.06
4 4.84 212 38.16
5 5.30 234 42.12
6 5.33 220 39.60
7 5.27 222 39.96
8 5.25 220 39.60
9 5.06 214 38.52
10 4.46 201 36.18
11 3.15 144 25.92
12 2.87 138 24.84
Year 4.46 2366 425.88
About the Hourly Performance Data
Output Hourly Performance Data
* Saving Text from a Browser
Output Results as Text
Run PVWATTS v.1 for another US location or an International locationRun PVWATTS v.2 (US only)
Page 1 of 1
3/4/2010file://C:\DOCUME~1\3143\LOCALS~1\Temp\X9LQDFUB.htm


Cost of Electricity $0.18 $/kWh
Budgetary Estimated TotalNew Jersey Renewable
New Jersey Renewable Payback Payback
Cost Maintenance Savings * Energy Incentive ** SREC
(without incentive)
(with incentive)
Savings$ kW kWh therms $ $ $ $ $ Years Years
$20,000 0.0 2,366 0 $426 0 $426 $4,000 $1,151 47.0 10.1
** Estimated Solar Renewable Energy Certificate Program (SREC) SREC for 15 Years= $487/1000kwh
Estimated Solar Renewable Energy Certificate Program (SREC) payments for 15 Years from RR Renewable Energy Consultants
Year SREC 1 6002 6003 6004 5005 5006 5007 5008 5009 500
10 50011 40012 40013 40014 40015 400
AVG 487
ECM-S-1 Photovoltaic (PV) Rooftop Solar Power Generation-2kW System
Annual Utility Savings
Roxbury Shore Hills Booster Pump Station #2
*Incentive based on New Jersey renewable energy program for non-residential applications(PV)= $1.00/W of installed PV system
3/4/2010 Page 1, Summary

APPENDIX I
Wind

AtlanticOcean
P e n n s y l v a n i aP e n n s y l v a n i a
D e l a w a r eD e l a w a r e
N e w Y o r kN e w Y o r k
M a r y l a n dM a r y l a n d
N e w Y o r kN e w Y o r k
C o n n e c t i c u tC o n n e c t i c u t
OceanBurlington
Morris
Sussex
Atlantic
Salem
Warren
Monmouth
Hunterdon
Cumberland
Bergen
Mercer
Somerset
Middlesex
Gloucester
Camden
Passaic
Cape May
Essex
Union
Hudson
Tabor
Newark
Edison
Vernon
Vienna
Camden
Bayonne
CliftonPassaic
Kresson
Trenton
Fenwick
Paterson
Vineland
Elizabeth
New Egypt
Zarephath
Colts Neck
Union City
Chatsworth
Flemington
Jersey City
Dennisville
Crandon Lakes
Beach Haven West
73°30'0"W
73°30'0"W
74°0'0"W
74°0'0"W
74°30'0"W
74°30'0"W
75°0'0"W
75°0'0"W
75°30'0"W
75°30'0"W
76°0'0"W
76°0'0"W41
°0'0"N
41°0'
0"N
40°30
'0"N
40°30
'0"N
40°0'
0"N
40°0'
0"N
39°30
'0"N
39°30
'0"N
39°0'
0"N
39°0'
0"N
950000
950000
1000000
1000000
1050000
1050000
1100000
1100000
1150000
1150000
4300
000
4300
000
4350
000
4350
000
4400
000
4400
000
4450
000
4450
000
4500
000
4500
000
4550
000
4550
000
4600
000
4600
000
Mean Speed at 30 m mph m/s
< 10.1 < 4.510.1 - 11.2 4.5 - 5.011.2 - 12.3 5.0 - 5.512.3 - 13.4 5.5 - 6.0
13.4 - 14.5 6.0 - 6.514.5 - 15.7 6.5 - 7.015.7 - 16.8 7.0 - 7.516.8 - 17.9 7.5 - 8.017.9 - 19.0 8.0 - 8.5 > 19.0 > 8.5
0 8 16 24 324Miles
0 10 20 30 405Kilometers
FeaturesCity
Interstate Highway
County Boundary
Water Body
Wind Resource of New JerseyWind Resource of New Jersey Mean Annual Wind Speed at 30 Meters
AWS Truewind, LCC
Projection: Tranverse Mercator,UTM Zone 17 WGS84
Spatial Resolution of Wind Resource Data: 200mThis map was created by AWS Truewind using
the MesoMap system and historical weather data.Although it is believed to represent an accurate
overall picture of the wind energy resource, estimates at any location should be confirmed by
measurement.The transmission line information was obtained byAWS Truewind from the Global Energy Decisions
Velocity Suite. AWS does not warrant the accuracy of the transmission line information.
Generalized Transmission Line Category
Under 100 kV
100 kV-161 kV
230 kV-287 kV
345 kV
500 kV
735 kV +
Step-Up
DC Line

APPENDIX J
EPA Portfolio Manager

OMB No. 2060-0347
STATEMENT OF ENERGY PERFORMANCEBooster Station
Building ID: 1933005 For 12-month Period Ending: December 31, 20081
Date SEP becomes ineligible: N/A Date SEP Generated: February 22, 2010
FacilityBooster Station2 Ford RoadLanding, NJ 07850
Facility OwnerN/A
Primary Contact for this FacilityN/A
Year Built: 1980Gross Floor Area (ft2): 816
Energy Performance Rating2 (1-100) N/A
Site Energy Use Summary3
Electricity - Grid Purchase(kBtu) 301,075 Natural Gas - (kBtu)4 0 Total Energy (kBtu) 301,075
Energy Intensity5 Site (kBtu/ft2/yr) 369 Source (kBtu/ft2/yr) 1232 Emissions (based on site energy use) Greenhouse Gas Emissions (MtCO2e/year) 46 Electric Distribution Utility FirstEnergy - Jersey Central Power & Lt Co National Average Comparison National Average Site EUI 77 National Average Source EUI 150 % Difference from National Average Source EUI 722% Building Type Service
(VehicleRepair/Service,Postal Service)
Stamp of Certifying Professional
Based on the conditions observed at thetime of my visit to this building, I certify that
the information contained within thisstatement is accurate.
Meets Industry Standards6 for Indoor EnvironmentalConditions:Ventilation for Acceptable Indoor Air Quality N/A Acceptable Thermal Environmental Conditions N/A Adequate Illumination N/A
Certifying ProfessionalN/A
Notes: 1. Application for the ENERGY STAR must be submitted to EPA within 4 months of the Period Ending date. Award of the ENERGY STAR is not final until approval is received from EPA.2. The EPA Energy Performance Rating is based on total source energy. A rating of 75 is the minimum to be eligible for the ENERGY STAR.3. Values represent energy consumption, annualized to a 12-month period.4. Natural Gas values in units of volume (e.g. cubic feet) are converted to kBtu with adjustments made for elevation based on Facility zip code.5. Values represent energy intensity, annualized to a 12-month period.6. Based on Meeting ASHRAE Standard 62 for ventilation for acceptable indoor air quality, ASHRAE Standard 55 for thermal comfort, and IESNA Lighting Handbook for lighting quality.
The government estimates the average time needed to fill out this form is 6 hours (includes the time for entering energy data, PE facility inspection, and notarizing the SEP) and welcomessuggestions for reducing this level of effort. Send comments (referencing OMB control number) to the Director, Collection Strategies Division, U.S., EPA (2822T), 1200 Pennsylvania Ave., NW,Washington, D.C. 20460.
EPA Form 5900-16

ENERGY STAR®
Data Checklistfor Commercial Buildings
In order for a building to qualify for the ENERGY STAR, a Professional Engineer (PE) must validate the accuracy of the data underlying the building's energyperformance rating. This checklist is designed to provide an at-a-glance summary of a property's physical and operating characteristics, as well as its total energyconsumption, to assist the PE in double-checking the information that the building owner or operator has entered into Portfolio Manager.
Please complete and sign this checklist and include it with the stamped, signed Statement of Energy Performance.NOTE: You must check each box to indicate that each value is correct, OR include a note.
CRITERION VALUE AS ENTERED INPORTFOLIO MANAGER VERIFICATION QUESTIONS NOTES
Building Name Booster Station Is this the official building name to be displayed inthe ENERGY STAR Registry of LabeledBuildings?
Type Service (Vehicle
Repair/Service, PostalService)
Is this an accurate description of the space inquestion?
Location 2 Ford Road, Landing, NJ
07850 Is this address accurate and complete? Correctweather normalization requires an accurate zipcode.
Single Structure Single Facility
Does this SEP represent a single structure? SEPscannot be submitted for multiple-buildingcampuses (with the exception of acute care orchildren's hospitals) nor can they be submitted asrepresenting only a portion of a building
Entire Building (Other)
CRITERION VALUE AS ENTERED INPORTFOLIO MANAGER VERIFICATION QUESTIONS NOTES
Gross Floor Area 816 Sq. Ft.
Does this square footage include all supportingfunctions such as kitchens and break rooms usedby staff, storage areas, administrative areas,elevators, stairwells, atria, vent shafts, etc. Alsonote that existing atriums should only include thebase floor area that it occupies. Interstitial(plenum) space between floors should not beincluded in the total. Finally gross floor area is notthe same as leasable space. Leasable space is asubset of gross floor area.
Number of PCs 0(Optional) Is this the number of personal computers in thespace?
Weekly operatinghours 40Hours(Optional)
Is this the total number of hours per week that thespace is 75% occupied? This number shouldexclude hours when the facility is occupied only bymaintenance, security, or other support personnel.For facilities with a schedule that varies during theyear, "operating hours/week" refers to the totalweekly hours for the schedule most often followed.
Workers on MainShift 3(Optional)
Is this the number of employees present during themain shift? Note this is not the total number ofemployees or visitors who are in a building duringan entire 24 hour period. For example, if there aretwo daily 8 hour shifts of 100 workers each, theWorkers on Main Shift value is 100.
Page 1 of 2

ENERGY STAR®
Data Checklistfor Commercial Buildings
Energy ConsumptionPower Generation Plant or Distribution Utility: FirstEnergy - Jersey Central Power & Lt Co
Fuel Type: Electricity
Meter: Electrical Meter Act #100000163814 (kWh (thousand Watt-hours))Space(s): Entire Facility
Generation Method: Grid Purchase
Start Date End Date Energy Use (kWh (thousand Watt-hours))
12/01/2008 12/31/2008 8,680.00
11/01/2008 11/30/2008 7,280.00
10/01/2008 10/31/2008 7,040.00
09/01/2008 09/30/2008 6,560.00
08/01/2008 08/31/2008 6,640.00
07/01/2008 07/31/2008 7,880.00
06/01/2008 06/30/2008 6,440.00
05/01/2008 05/31/2008 5,760.00
04/01/2008 04/30/2008 7,200.00
03/01/2008 03/31/2008 7,640.00
02/01/2008 02/29/2008 8,080.00
01/01/2008 01/31/2008 9,040.00
Electrical Meter Act #100000163814 Consumption (kWh (thousand Watt-hours)) 88,240.00
Electrical Meter Act #100000163814 Consumption (kBtu (thousand Btu)) 301,074.88
Total Electricity (Grid Purchase) Consumption (kBtu (thousand Btu)) 301,074.88
Is this the total Electricity (Grid Purchase) consumption at this building including allElectricity meters?
Additional FuelsDo the fuel consumption totals shown above represent the total energy use of this building?Please confirm there are no additional fuels (district energy, generator fuel oil) used in this facility.
On-Site Solar and Wind EnergyDo the fuel consumption totals shown above include all on-site solar and/or wind power located atyour facility? Please confirm that no on-site solar or wind installations have been omitted from thislist. All on-site systems must be reported.
Certifying Professional (When applying for the ENERGY STAR, the Certifying Professional must be the same as the PE that signed and stamped the SEP.)
Name: _____________________________________________ Date: _____________
Signature: ______________________________________ Signature is required when applying for the ENERGY STAR.
Page 2 of 2

FOR YOUR RECORDS ONLY. DO NOT SUBMIT TO EPA.
Please keep this Facility Summary for your own records; do not submit it to EPA. Only the Statement of Energy Performance(SEP), Data Checklist and Letter of Agreement need to be submitted to EPA when applying for the ENERGY STAR.
FacilityBooster Station2 Ford RoadLanding, NJ 07850
Facility OwnerN/A
Primary Contact for this FacilityN/A
General InformationBooster Station
Gross Floor Area Excluding Parking: (ft2) 816 Year Built 1980 For 12-month Evaluation Period Ending Date: December 31, 2008
Facility Space Use SummaryEntire Building
Space Type
Other - Service(Vehicle
Repair/Service,Postal Service)
Gross Floor Area(ft2) 816
Number of PCso 0
Weekly operating hourso 40
Workers on Main Shifto 3
Energy Performance ComparisonEvaluation Periods Comparisons
Performance Metrics Current(Ending Date 12/31/2008)
Baseline(Ending Date 12/31/2008) Rating of 75 Target National Average
Energy Performance Rating N/A N/A 75 N/A N/A
Energy Intensity
Site (kBtu/ft2) 369 369 0 0 77
Source (kBtu/ft2) 1232 1232 0 0 150
Energy Cost
$/year $ 16,165.14 $ 16,165.14 N/A N/A $ 3,373.58
$/ft2/year $ 19.81 $ 19.81 N/A N/A $ 4.13
Greenhouse Gas Emissions
MtCO2e/year 46 46 0 0 10
kgCO2e/ft2/year 56 56 0 0 12
More than 50% of your building is defined as Service (Vehicle Repair/Service, Postal Service). This building is currently ineligible for a rating. Please note the NationalAverage column represents the CBECS national average data for Service (Vehicle Repair/Service, Postal Service). This building uses X% less energy per square footthan the CBECS national average for Service (Vehicle Repair/Service, Postal Service). Notes:o - This attribute is optional.d - A default value has been supplied by Portfolio Manager.


![,]PZov vÀ] }vu v oZ }µ /vÀ v } Ç Figure 1: Preservation Area...Hopatcong Borough Byram Township Jefferson Township Roxbury Township Mount Arlington Borough Stanhope Borough Sparta](https://img.dokumen.tips/doc/110x75/5ec623db59740a007745fa72/pzov-v-vu-v-oz-v-v-figure-1-preservation-area-hopatcong-borough.jpg)