Embed Size (px)
Citation preview

INDEX
(FOUR REPORTS FOLLOW THIS INDEX PAGE) Synthesis and Characterization Alkali Metal Salts Containing Trapped Hydrino............................... Page 2 Rowan University College of Liberal Arts and Sciences Departments of Chemistry and Biochemistry Prof. Amos Mugweru Prof. K.V. Ramanujachary Ms. Heather Peterson Mr. John Kong Mr. Anthony Cirri Report on Synthesis and Studies of “Generation 2” Lower Energy Hydrogen Chemicals ................ Page 17 Rowan University College of Liberal Arts and Sciences Departments of Chemistry and Biochemistry Prof. Amos Mugweru Prof. K.V. Ramanujachary Heather Peterson John Kong Anomalous Heat Gains from Multiple Chemical Mixtures: Analytical Studies of “Generation 2” Chemistries of BlackLight Power Corporation ...................................................................................... Page 37 Rowan University Faculy & Staff: Rowan University Students: Dr. Peter Mark Jansson, PP PE Ulrich K.W. Schwabe, BSECE Prof. Amos Mugweru Kevin Bellomo-Whitten Prof. K.V. Ramanujachary Pavlo Kostetsky Heather Peterson, BSCh John Kong Eric Smith Water Flow Calorimetry, Experimental Runs and Validation Testing for BlackLight Power.......... Page 94 Rowan University College of Engineering Departments of Electrical, Chemical and Mechanical Engineering Prof. Peter Mark Jansson PP PE Ulrich K.W. Schwabe BSECE Matthew Abdallah ChE Nathaniel Downes ECE Patrick Hoffman ME

Synthesis and Characterization Alkali Metal Salts Containing Trapped Hydrino
Performed at Rowan University
Glassboro, New Jersey
College of Liberal Arts and Sciences Departments of Chemistry and Biochemistry
Prof. Amos Mugweru Prof. K.V. Ramanujachary
Ms Heather Peterson Mr. John Kong
Mr. Anthony Cirri
May 2009

1
Synthesis and Characterization Alkali Metal Salts Containing Trapped Hydrino
Prof. Amos Mugweru, Prof. K.V. Ramanujachary, Ms Heather Peterson, Mr. John Kong and
Mr. Anthony Cirri
Rowan University
Chemistry and Biochemistry
Glassboro NJ, 08028
Summary
In this work, potassium chloride and potassium iodide salts containing a new form of hydrogen
(hydrino) were synthesized. Characterization using solid state MAS 1H NMR of potassium chloride
salt containing the hydrino hydrogen (KH*Cl) gave spectral features at ‐4.50 ppm and 1.20 ppm
relative to tetramethylsilane (TMS) while liquid 1H NMR gave less intense peaks at 1.20 ppm versus
TMS. MAS 1H NMR of potassium iodide salt containing the hydrino hydrogen (KH*I) gave an intense
broad peak at approximately ‐2.45 ppm relative to TMS while liquid 1H NMR showed a very intense
peak at approximately 1.258 ppm. These unusual upfield shifted peaks relative to the respective
ordinary molecular hydrogen (4.5 ppm in liquid NMR) and hydride (0.8 and 1.1 ppm in MAS 1H
NMR) 1H NMR peak locations are similar to those reported by BLP. Samples synthesized using
chemicals provided by BLP also yielded similar MAS 1H NMR spectral features. BLP has attributed
these peaks to lower energy hydrogen (hydrino) as hydride ions (‐4.5 and ‐2.45 ppm in MAS 1H
NMR) and molecular hydrino gas (1.2 ppm in liquid 1H NMR). Neutron diffraction studies indicate
the possibility of trapped interstitial atoms although the exact nature of these could not be
established unambiguously. Elemental analysis on these salts containing hydrino hydrogen showed
negligible amounts of Be, Cr, Mn, Ni, Co, Zn, As, Ag, Cd, Sb, Ba and Pb. These results are supportive
of the possibility of having lower electronic states of hydrogen.

2
Introduction
BLP has made claims of the existence of a hydrogen where the single electron resides in a lower
energy state called hydrinos [1‐8]. The transition to such a state is induced by the presence of a
catalyst and atomic hydrogen [1‐8]. It has been claimed that the alkali metal halide is capable of
trapping this lower energy hydrogen as a high binding energy hydride ion also called the hydrino
hydride ion. If these claims are verified then it is reasonable to envision a potentially novel and
revolutionary energy source.
In this work, we have used chemicals supplied by BLP and synthesized several alkali halido
hydrides, (KH*X, X= Cl and I) containing hydrino hydride ions trapped in the lattice of the alkali
halides. The procedure is outlined below. We also purchased our own chemicals and synthesized
in‐house samples of these compounds. Synthesis of KH*X included the reaction of KCl or KI with
hydrogen in the presence of catalysts [2‐5, 7, 8]. These reactions were carried at temperatures in
the range of 500oC to 600oC in a kiln for 68 hours. BLP has claimed that the high binding energy
hydrides have a smaller radius relative to the normal hydride which in turn enhance the shielding.
The observed upfield shifts in the NMR spectra has been attributed to the increased shielding.
The objective of the work at the Chemistry and Biochemistry Department at Rowan was to
synthesize and characterize hydrino‐hydride ions trapped in the lattice of alkali halides and
compare the results with those obtained from BLP materials
Synthesis of Alkali Salts with Trapped Hydrino
Chemicals and Procedures
KCl and KI ( both with a purity better than 99.5%) were procured from VWR, potassium sticks from
Strem Chemicals, and nickel screen (Ni, 20x20 mesh plain, 0.014 inch in diameter) was purchased
from the Unique Wire Weaving Company. K2CO3 and H2O2 were also purchased from VWR.
In preparation for the reaction, the salts were first dried in a flask under a vacuum of approximately
50 mTorr at 200oC for 14 hours and then transferred to the glove box. The potassium sticks were
washed three times with anhydrous hexane inside the glove box. Nickel screen was washed with a
water solution containing 20 wt % K2CO3 and 5 % H2O2 and then with deionizer water and dried at
100 oC overnight.
3
For the synthesis of KH*Cl, a clean stainless steel reactor was transferred to the glove box after
drying in the oven overnight at 120oC and lined with about 43 grams of nickel screen. A stainless
steel crucible was then placed in the reactor. The oxide layer on the surface of potassium was
peeled off with a penknife. About 1.6 g of the shinny potassium was weighed and placed on the
bottom of stainless steel crucible. 20 grams of KCl was then weighed and placed in the stainless
steel crucible to cover the potassium. The reactor was tightly closed and was checked for any leaks
before placing the reaction was started. The reactor was pumped down to a final vacuum of < 30
mTorr.
For synthesis of KH*I, 15.0 grams of dry Raney Ni 2800 was weighed inside the glove box and
placed in the stainless steel crucibles. Approximately 1.0 g of potassium metal was also weighed
inside the glove box and placed in a smaller stainless steel crucible. 20 grams of KI was then
weighed and spread over the potassium metal inside the smaller crucible. The crucible was
subsequently transferred to the larger crucible and placed on the bottom of the reactor before
sealing and evacuation. The reaction temperature for this synthesis was 500oC. The rest of the
procedure was similar synthesis of KH*Cl.
After evacuation of the reactors, hydrogen gas (5 PSIG pressure) was slowly introduced and the
temperature was gradually increased to 600oC. The reactor pressure was maintained at 5 PSIG for
the next 68 hours. In some experiments, the pressure was checked and more hydrogen added every
30 minutes if needed to maintain 5 PSIG. After the completion of the experiment, the kiln was shut
down and allowed to cool naturally. At about 300oC, the kiln’s lid was opened to hasten the cooling.
The reactor was pressurized with helium after the reactor temperature had dropped to 50oC.
The reactor assembly was transferred to the Ar‐filled glove box after closing all the valves. The
hydrogen containing salts were retrieved and placed in a vial. Nearly 1.0 gram of the sample was
sent out for solid state MAS 1H NMR studies. This procedure was repeated several times to ensure
the reproducibility during the months of January to May. Liquid NMR studies of these samples were
taken at Rowan University. Solid state MAS 1H NMR results, liquid 1H NMR, as well as elemental
analysis, and neutron diffraction studies were carried out.

4
For solution 1H NMR measurements, KH*X samples were first washed in DMF‐d7 solvent in a glove
box. The clear liquid, just above the solid material, was transferred to an NMR tube (attached to a
vacuum line for sealing) and then flame‐sealed for NMR analysis. Proton NMR was recorded using a
400 MHz Varian Oxford AS400 NMR system. Solution 1H NMR spectra of these salts were obtained
in the DMF‐d7 solvent. All NMR specra were relative to TMS.
Elemental analysis of the salt was done using inductively coupled plasma mass spectrometry
(Agilent 7500, ICP‐MS) and using standard analytical procedures.
Results and Discussions
Characterization of Hydrino Containing KCl Salts
Figure 1 shows the solid state MAS 1H NMR spectrum of KH*Cl sample prepared using chemicals
provided by BLP using the procedure described above. Two peaks were observed, one intense peak
at around ‐4.469 ppm and another less intense centered at 1.197 ppm. Other samples synthesized
using BLP chemicals yielded similar spectra.
Figure 2 shows the MAS 1H NMR spectrum of the KCl salt purchased by Rowan from VWR. Two
peaks with low intensity centered at around 1.13 ppm and at 4.298 ppm were observed, and no
peaks upfield of TMS were detected. BLP reported that the MAS 1H NMR of mixtures of KCl and KH
show an H2 peak at 4.3 ppm and KH in two chemical environments at 1.1 and 0.8 ppm [3,5]. KH is
air sensitive and not present in KCl. The peak at 1.1 ppm has been found only in salts that contain a
hydrino catalyst [2] and H2. The peak at 1.1 ppm has been observed by other researchers who
could not assign it [9]. It is observed along with the known H2 peak at about 4.3 ppm. BLP
attributes the peak to interstitial H2(1/4) [2]. MAS 1H NMR spectra of some additional KH*Cl salts
synthesized using Rowan procured reagents are shown in Figures 3 and 4. Two intense peaks were
obtained, one at ‐4.5 ppm and another at 1.201 ppm. All syntheses showed considerable
reproducibility as each sample yielded the similar spectra.
Solid State 1H NMR clearly shows an upfield shifted peak at ‐4.50 ppm and a peak at 1.20 ppm
which BLP has attributed to hydrino hydride ion and molecular hydrino, H2(1/4), respectively. The
unusual upfield shifted peaks were consistently observed at these positions in the samples as

5
repeated runs yielded similar spectra. We cannot assign negative upfield shifted peaks to any
known compound from the literature as ordinary alkali hydrides alone or when mixed with alkali
halides only show down‐field shifted peaks.
Solution 1H NMR spectrum of KH*Cl in DMF‐d7 as the solvent is shown in figure 5. Four peaks were
observed, a singlet at 8.030ppm and two solvent peak quintets centered at 2.907 ppm, and 2.715
ppm. Another singlet is also visible at 3.379 ppm due to presence of residual water in DMF. There
was no clear upfield shifted peak at ‐3.80 ppm that was observed by BLP [2]; although, a less
intense peak at 1.25 ppm assigned to H2(1/4) by BLP [2] was apparent (Figure 5 insert).
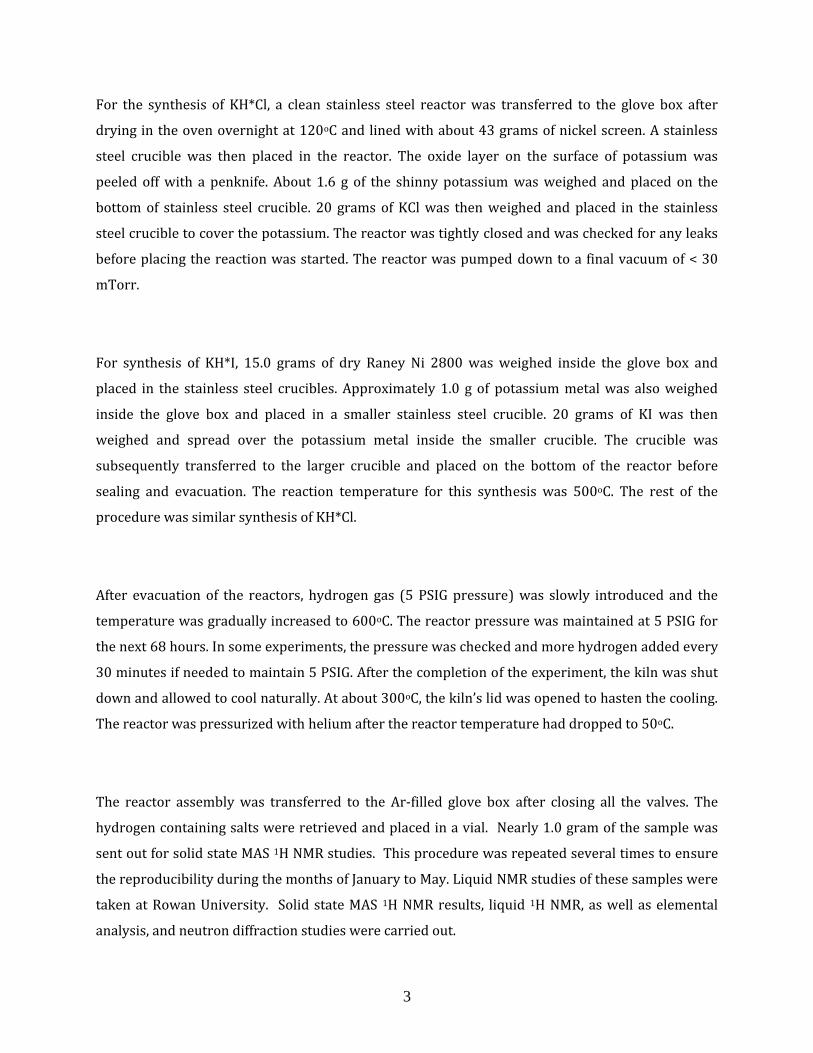
Neutron diffraction studies of KH*Cl and KCl used in the synthesis indicated that interstitial atoms
could be trapped in the KCl lattice. Figure 6 shows the neutron diffraction pattern KCl while figure 7
shows the neutron diffraction pattern of KH*Cl. This initial result leads us to believe that indeed
hydrogen could be the atom in the salt but exactly in what form is still not clear to us. We have
planned more neutron diffraction studies.
Elemental analysis of KH*Cl using ICP‐MS yielded the following results: Be (less than 1 ppb) , Cr
(3.0 ppb) , Mn (less than 1.0 ppb), Ni (less than 1.0 ppb) , Co (< 1.0 ppb ) , Zn (about 1.0 ppb) , As (
about 1.6 ppb), Ag ( 7.4 ppb), Cd (< 1.0ppb), Sb (1.8 ppb), Ba (<1.0 ppb) and Pb (0.3 ppb). These
concentrations were too low to influence the reaction or the NMR results.

6
Fig. 1. Solid state MAS 1H NMR spectrum of sample prepared using BLP chemicals.
Fig. 2. MAS 1H NMR spectrum of KCl bought from VWR.
-15-10-50 5 10 15 Chemical Shift/ppm
1.131
4.298
-15-10-5051015
Chemical Shift /ppm
- 4.469 ppm
1.197 ppm

7
Fig. 3. MAS 1H NMR spectrum of KH*Cl synthesized using chemicals purchased by Rowan.
Fig. 4. MAS 1H NMR spectrum of KH*Cl synthesized on Feb 24, 2009 using chemicals procured by
Rowan.
-15-10-5051015
Chemical Shift/ppm
- 4.504 ppm
1.201 ppm
-15-10-5 05 10 15 Chemical Shift/ppm
- 4.486 ppm
1.20 ppm

8
Fig. 5. Liquid 1H NMR spectra of KH*Cl synthesized on April 14, 2009 using chemicals procured by
Rowan.
Fig. 6. Neutron diffraction spectra of KCl.
-50 5 10 Chemical Shift (ppm)
8.030
3.379
2.711
2.907
1.248
0.9 1 1.1 1.2 1.3 1.4 1.5
9
Fig.7. Neutron diffraction pattern of KH*Cl.
Characterization of Hydrino Containing KI Salts
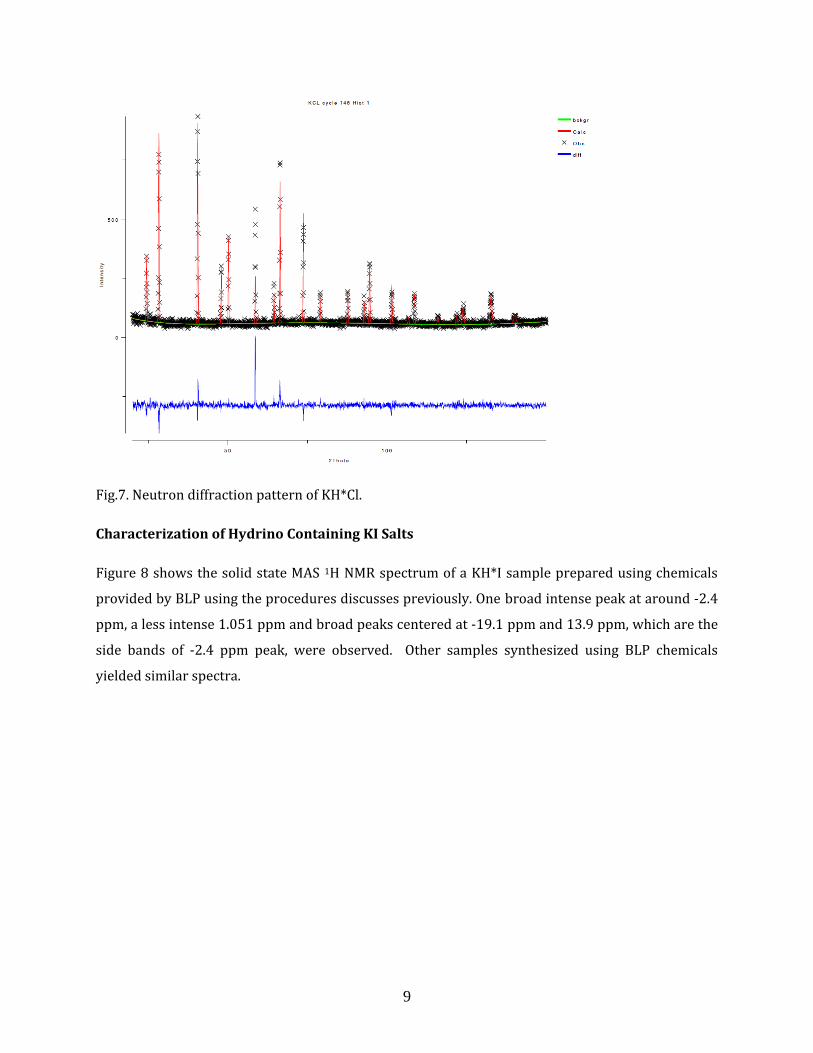
Figure 8 shows the solid state MAS 1H NMR spectrum of a KH*I sample prepared using chemicals
provided by BLP using the procedures discusses previously. One broad intense peak at around ‐2.4
ppm, a less intense 1.051 ppm and broad peaks centered at ‐19.1 ppm and 13.9 ppm, which are the
side bands of ‐2.4 ppm peak, were observed. Other samples synthesized using BLP chemicals
yielded similar spectra.

10
Fig. 8. MAS 1H NMR spectra of KH*I sample prepared using chemicals provided by BLP.
Using our own chemicals and protocols discussed previously, we synthesized KH*I. MAS 1H NMR
spectra of some of the KH*I salts synthesized are shown in Figures 9 and 10. One broad intense
peak was obtained, at between ‐2.3 ppm and ‐2.7 ppm. A less intense broad peak was observed at
approximately 1 ppm. The sidebands of the about ‐2.4 ppm peak were observed at about ‐19 ppm
and 13ppm. The synthesis was reproducible as repetition of sample synthesis yielded the same
spectra.
Previously BLP published results show MAS 1H NMR spectra with broad peaks at around ‐2.31 ppm
and 1.13 ppm versus TMS. According to BLP, the upfield shifted peak at around ‐2.31 ppm is due to
a hydrino hydride ion, H–(1/4) shifted compared to the –4.4 ppm peak in KH*Cl by a matrix effect
that also broadens the peak, whereas the peak at around 1.05 ppm is due to trapped molecular
hydrino gas H2(1/4). Other than the halide, the main hydrogen dissociator used in this synthesis
was Raney Ni as opposed to Ni screen in the synthesis of KH*Cl. KH*Cl gives very sharp peaks
(Figures 1, 3, and 4). The narrow peak width obtained with KH*Cl points to a free ion rotating. In
the literature no compounds have been found with the kind of protons contained in these
-30-20-100102030
Chemical Shift (ppm)
-2.437
13.928-19.1281.051

11
compounds. We are planning to carry out neutron diffraction studies of this salt to indentify any
interstitial atoms present.
The solution 1H NMR spectrum of KH*I synthesized in our lab using DMF‐d7 as the solvent is shown
in Figure 11. Four solvent peaks were observed, a singlet at 8.030ppm and two quintets centered at
2.898 ppm, and 2.686 ppm. Another singlet is also visible at 3.498 ppm due to presence of residual
water in DMF. There was also a huge peak at 1.258 ppm which was not due to the DMF solvent.
Samples synthesized using BLP chemicals and our own chemicals have shown consistent unusual
liquid 1H NMR peaks at approximately 1.258 ppm. BLP’s published results also include another less
intense peak at ‐3.79 ppm in addition to the peak at 1.21 ppm [2]. BLP has attributed the upfield
shifted peaks at ‐3.79 ppm to H–(1/4) while the one at approximately 1.21 is assigned to H2 (1/4).
Our liquid 1H NMR spectra did not show the less intense peaks at ‐3.79 ppm but an unusually large
peak at 1.258 ppm was obtained which matched the H2(1/4). This huge peak may also be formed
through conversion of H– (1/4) to hydrino gas H2(1/4).
Fig. 9. MAS 1H NMR spectrum of KH*I synthesized on April 15, 2009 using chemicals procured by
Rowan.
-20-1001020Chemical Shift (ppm)
-2.414
1.130-18.58313.136

12
Fig. 10. MAS 1H NMR spectrum of KH*I synthesized on April 28, 2009 using chemicals procured by
Rowan.
Fig. 11. Liquid 1H NMR spectrum of KH*I synthesized on April 28, 2009 using chemicals procured
by Rowan.
-32-24-16-8 081624Chemical Shift (ppm)
-2.677
1.145-18.88713.207
-6-3036912Chemical Shift (ppm)
8.030
1.258
3.498
2.6882.899
13
Conclusions and Further Work
The solid state MAS 1H NMR spectra of KH*Cl and KH*I synthesized using chemicals purchased by
Rowan and those provided by BLP have shown similar and consistent unusual upfield shifted peaks
relative to those of ordinary H species. From KH*Cl we observed peaks at around 1.20 and ‐4.50
ppm while KH*I shows broad, high intensity peaks at around ‐2.3 to ‐2.7 ppm. BLP has attributed
these upfield shifted peak at ‐4.50 ppm and ‐2.3 ppm to H‐(1/4) while the ones at approximately
1.21 ppm and 1.1 ppm to H2(1/4) [2]. Liquid 1H NMR studies show less intense peaks at 1.248 ppm
for KH*Cl while strong peaks were observed for KH*I at 1.258 ppm.
Neutron diffraction studies on these samples point to presence of trapped atoms in the crystal
lattice of these salts. According to our elemental analysis results using ICP‐MS, we do not see
significant amount of other elements that could play a role in the synthesis. Accordingly, we have
ruled out the role of other elements in these reactions. Although we have not concluded our work
in the area of characterization, we are not aware of any hydride compounds in the literature based
on elemental analysis that gives these upfield‐shifted peaks. This gives credence to presence of
hydrinos trapped in these salts.
To precisely confirm the presence of hydrino hydride ions and molecular hydrino in these salts we
plan to perform further neutron diffraction. After obtaining the diffraction pattern, we plan to drive
off the trapped interstitial atoms through heating and obtain the pattern again. The pattern should
resemble either KCl or KI, after driving off the hydrino gas.
References
1. Mills, R.L., L. Y, and K. Akhtar, Spectroscopic Observation of Helium‐Ion and Hydrogen‐Catalyzed Hydrino Transitions. Submitted.
2. Mills, R.L., G. Zhao, K. Akhtar, Z. Chang, J. He, Y. Lu, W. Good, G. Chu, and B. Dhandapani, Commercializable power source from forming new states of hydrogen. International Journal of Hydrogen Energy, 2009. 34(2): p. 573‐614.
14
3. R.L Mills, B.D., Mark Nansteel, Jiliang He, Tina Shannon, Alex Echezuria, Synthesis and characterization of novel hydride compounds. International Journal of Hydrogen Energy, 2001. 26: p. 339‐367.
4. Mills, R.L. and P. Ray, Spectroscopic identification of a novel catalytic reaction of potassium and atomic hydrogen and the hydride ion product. International Journal of Hydrogen Energy, 2002. 27(2): p. 183‐192.
5. Mills, R.L., Synthesis and Characterization of potassium iodo hydride. International Journal of Hydrogen Energy, 2000. 25: p. 1185‐1203.
6. Mills, R., The Grand Unified Theory of Classical Quantum Mechanics. June 2008 Edition, http://www.blacklightpower.com/theory/bookdownload.shml.
7. Mills, R.L., J. Dong, W. Good, and A. Voigt, Minimum heat of formation of potassium iodo hydride. International Journal of Hydrogen Energy, 2001. 26(11): p. 1199‐1208.
8. Mills, R.L., P. Ray, B. Dhandapani, W. Good, P. Jansson, and M. Nansteel, Spectroscopic and NMR identification of novel hydride ions in fractional quantum energy states formed by an exothermic reaction of atomic hydrogen with certain catalysts. Eur Phys J Appl Phys, 2004. 28: p. 83‐10.
9. Lu C, Hu J, Kwak JH, Yang Z, Ren R, Markmaitree T, et. al., Study the Effects of Mechanical Activation on Li‐N‐H systems with 1H and 6Li solid‐dtate NMR. Journal of Power Sources 2007; 170:419‐24.

Report on Synthesis and Studies of “Generation 2” Lower Energy Hydrogen Chemicals
Performed at Rowan University
Glassboro, New Jersey
College of Liberal Arts & Sciences Departments of Chemistry & BioChemistry
Prof. Amos Mugweru
Prof. K.V. Ramanujachary
Heather Peterson
John Kong
August 10, 2009
2
Report on synthesis and studies of “Generation 2” lower energy hydrogen chemicals
Prof. Amos Mugweru, Prof. K.V. Ramanujachary, Ms Heather Peterson, and Mr. John Kong
Rowan University
Chemistry and Biochemistry
Glassboro NJ, 08028
The primary aim of this work was to reproduce the synthesis and conduct studies of BLP
generation‐2 chemistry. This phase of the work is a continuation of prior work that involved studies
on the lower energy state of hydrogen. During the current reporting period, sodium or potassium
hydride, magnesium or calcium metal powder, titanium carbide or activated carbon support
material and several halide salts were loaded in a cell and were heated to initiate the reaction. The
products of the reaction, including the gases generated, were collected and analyzed. Gaseous
products were analyzed using gas chromatography and mass spectrometry. The solid product was
analyzed using X‐ray diffraction (XRD). The reaction pathway was determined based on the starting
materials and the post reaction products determined by chemical analysis. In most of the reactions the
presence of magnesium hydride, the metal of metal halide reactant and an alkali halide salt were
observed. A small amount of magnesium halide was also observed. However, the starting metal
halide salt was absent in all the products. Liquid 1H NMR spectra after extraction with DMF-d7 showed
a very intense peak at approximately 1.258 ppm and at -3.84 ppm which BLP previously attributed to a
lower energy hydrogen (hydrino) as molecular hydrino gas and hydrino hydride ions, respectively. The
heat generated for each reaction was determined by carrying out the calorimetric studies in the
Department of Engineering. For the different reaction mixtures approximately 1.6–6.5 times more energy
than the maximum expected for conventional chemistry was observed. Temperature programmed
desorption studies was used to rule out presence of water and/or CO/CO2 in the starting materials. In what
follows, we present some of experimental studies that were carried out at Rowan.

3
Background
In our prior report, we reproducibly synthesized “hydrino” trapped compounds using procedures
provided by BLP. In the same study, we were able to confirm the unusal state of hydrogen,
“hydrino,” using both liquid 1H NMR and MAS 1H NMR studies. For the generation of the unusual
state of hydrogen, we employed a method in which alkaline halides were heated in the presence of
hydrogen and a catalyst to form hydrinos. According to BLP, the alkali metal halide is capable of
trapping the lower energy hydrogen as a high binding energy hydride ion [also called the hydrino
hydride ion as well as molecular hydrino]. In this report, we report the results from studying BLP
generation 2 chemistry. BLP has been conducting studies on generation 2 chemistry that they claim
will potentially lead to a new energy source. In the generation 2 chemistry, (we witnessed at BLP
and performed at Rowan University), sodium or potassium hydride, magnesium or calcium powder,
a support material, and a metal halide were mixed and heated to initiate the reaction. Calorimetric
studies as well as chemical characterization of the reaction products were performed using XRD,
GC, MS, and TPD techniques. Liquid 1H NMR was also carried out on some of the samples. We
report here the results of these reactions carried out at Rowan using chemicals procured by us, and
using both 0.05 mole (5X) and 0.5 mole (50X) scale reactors. We initially assessed possible chemical
reactions occurring and their energies. The enthalpies of the most energetic reactions possible
were compared with the actual heat measured calorimetrically in the smaller 5X reactors and
larger 50X reactors.
Chemicals and Procedures
Titanium carbide, TiC, tin iodide, SnI2 (99%), iron bromide, FeBr2 (98+%), magnesium metal
powder, Mg (99.8%), potassium hydride, KH (30‐35% wt% in mineral oil), indium chloride, InCl
(99.995%), cobalt iodide, CoI2 (99.5%), europium bromide, EuBr2 (99.99%), manganese iodide,
MnI2 (98%), calcium, Ca (98.8%), and silver chloride, AgCl (99.9%) were all supplied by Alfa Aesar.
The anhydrous hexane (>99%) was supplied by Sigma Aldrich and sulfur hexafluoride, SF6 (99.9%)
was from GTS-Welco. In preparation for the first reaction, titanium carbide was first dried in a flask
under a vacuum of approximately 50 mTorr at 200 °C for 14 hours and then transferred to the
glove box. The potassium hydride was washed inside the glove box with anhydrous hexane four
times after decanting the mineral oil. The KH was further dried in the anti‐chamber of the glove
box for 4 hours to remove residual hexane and other organic residues, and later transferred into a

4
sealed container within the glove box. As will be described later, temperature programmed
desorption (TPD) studies were done on the starting materials, manganese iodide, titanium carbide
and other salts to quantify any condensable gas(es) such as water and/or CO2/CO present.
For a 50X reaction, 83.0 grams of KH, 50.0 grams of Mg, 200.0 grams of TiC and 154.0 grams of MnI2
were weighed and thoroughly mixed in a large beaker inside the glove box. A 2 liter cell was
transferred to a glove box and the reaction mixture was quantitatively transferred into the cell and
then the cell closed. The loaded cell was taken to the Technology Park in Rowan University where
calorimetric studies were carried out. For a 5X reactor, 8.30 grams of KH, 5.0 grams of Mg, 20.0
grams of TiC and 15.40 grams of MnI2 were used. The reaction was repeated with MnI2 replaced by
FeBr2, SnI2, InCl, CoI2 , EuBr2 AgCl and SF6.
For the solution 1H NMR measurements, a post reaction sample from NaH +MgH2 + activated
carbon and 0.03 moles of SF6 gas was extracted using DMF‐d7 solvent in a glove box. The clear
liquid, just above the solid material, was transferred to an NMR tube and tightly capped. 1H NMR
was recorded using a 400 MHz Varian Oxford AS400 NMR system. All chemical shifts in 1H NMR
spectra were relative to TMS.
Temperature programmed desorption (TPD) studies
The desorption behavior of materials was stuided using a Chembet 3000 chemisorption unit of
Quantchrome Corporation with a thermal conductivity detector (TCD). The initial task of this phase
of analysis was to quantify water present, if any, in starting materials. Argon was used as a carrier
gas, and dry ice was used for the separation of water (by condensation) during the course of
desorption experiments. Appromately 0.1 grams of the sample was loaded into the TPD cell under
argon environment. The cell was then placed in a thermal heater and connected to a gas line
(including stainless steel tubing and reservoir). Any condensed water would be carried into the
TCD analyzer when the dry ice dewar was removed and the trap was thawed to room temperature.
Appendix A shows the TPD traces of the starting materials (TiC and MnI2) suggesting a negligible
amount of water and CO2 present in the materials.
An independent TPD analysis was also performed using the ideal gas law. Approximately 0.1 grams
of the starting chemical sample was loaded into a TPD cell under argon, the cell was then placed in a
thermal heater and connected to a gas line (including stainless steel tubing and reservoir). Before
heating, the sample and gas line were evacuated to ~10‐5 Torr of pressure. The cell was then heated

5
slowly to ~500 °C in order to desorb all of the water present in the sample. The evolved gas was
expanded into a reservoir of known volume. The gas line was then submerged into a liquid nitrogen
dewar in order to condense any water vapor or other gas(es) present from the thermal desorption.
After evacuating the noncondensable gases, the cold trap was removed to allow the reservoir to
reach room temperature and evaporate any condensed gas with temperature increases. In the
experiment, cell temperature, room temperature, and gas pressure were monitored and recorded
by a Labview program.
The quantity of gas obtained could be calculated using the ideal gas law (Equation 1) using the
measured pressure, temperature and volume.
PV = nRT (1)
The results of the TPD of the TiC and MnI2 starting materials are given in Appendix A. Since liquid
nitrogen was used as the cold trap, any gas with a boiling point above –196 °C would have been
condensed. As shown, the total condensable gas was negligible; thus, the material contained
minute quantities of H2O (and/or CO2 and CO) from both TiC and MnI2. Their contribution to the
heat energy of the reaction was considered to be small enough to be neglected in the heat balance
calculations.
Analysis of reaction products
Before collecting the gas for MS and GC analysis, the pressure and volume of the gas in reactor was
measured by connecting the reactor to a pre‐evacuated reservoir (known volume) with a pressure
gauge. Using the known combined volume, measured pressure and temperature, the moles of gas
were determined using the ideal gas law. The gas from the reaction was then transferred to an
empty cell for mass spectroscopic identification and quantitative gas chromatography. Gas
chromatography (GC) showed that most of the gas generated during the reaction was methane.
Figure 1 shows the gas chromatogram of the gases generated during the reaction. Argon is already
present as all the chemical manipulations are carried out in this atmosphere. The gas was loaded
into a six‐port rotary valve from gas container with a gas line before the injection Prior to the gas
sample loading, the sample loop (~3 ml) in the six‐port rotary valve was sufficiently evacuated
(~10‐5 torr) to remove any residual gas/contaminant. The oven temperature was set at 80 °C, the
injector was set to 100 °C, and the detector was set to 120 °C. Helium was the carrier gas and a flow
rate of 43.4 ml/min was employed. Calibrations using pure gases H2, CH4, CO, and CO2 were

6
performed prior to testing. Figure 2 shows the mass spectrum of the gases generated during the
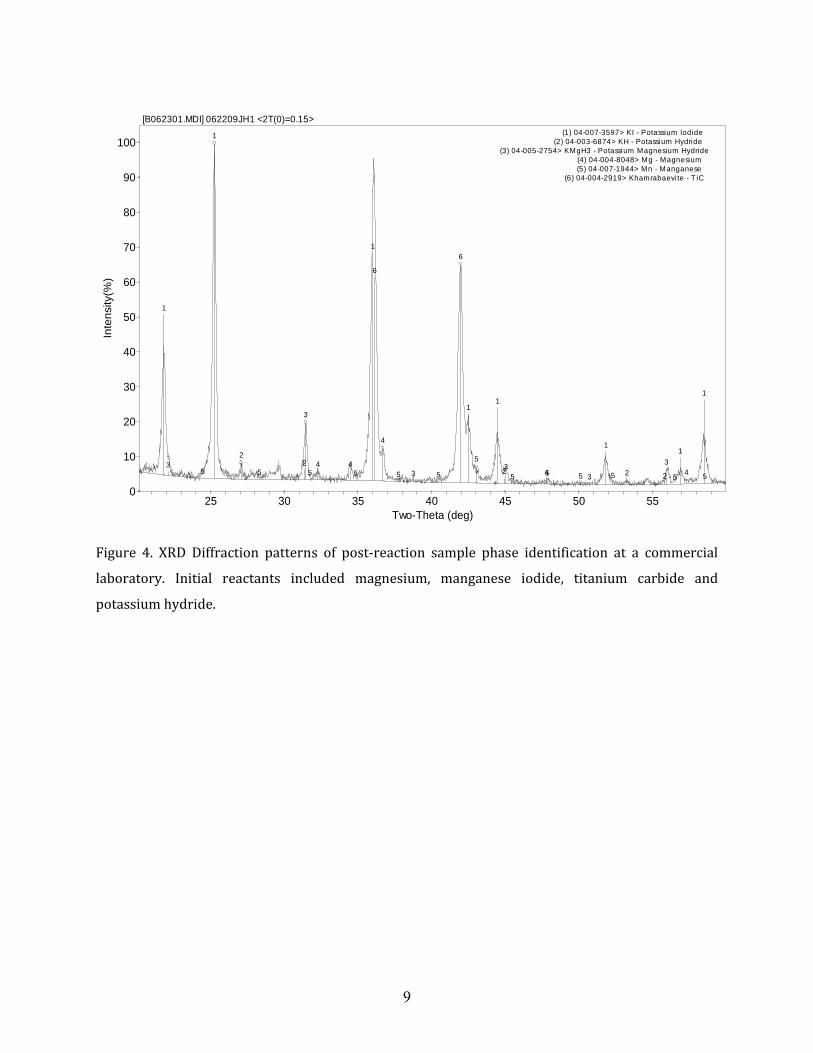
reaction. To quantify the amount of methane found in the gaseous phase, a calibration curve of
methane gas was obtained (Appendix A). In the case of the reaction mixture 83g KH +50g Mg +
200g TiC + 154g MnI2 a quantitative analysis of the gaseous phase indicated that 16.0% volume of
the gas produced was methane. Since the total gas pressure was about 1 atm, and the volume of
methane was 384 ml (2400 ml × 16%), the moles of methane in the product was 0.01575 mole
(room temperature 24 °C).
0 2 4 6 8 10 12 14-2000
0
2000
4000
Inte
nsity
(a.u
)
Retention Time (min)
CH4
Ar
Figure 1. Gas chromatograph of contents of gas phase following the reaction.
Figure 2. MS spectra of gas following the reaction. Methane is the minor component while Ar was
the predominant component as the cell was loaded under argon in dry box.
0 10 20 30 40 50 60 70 80 900.0
1.0x10⁻⁵
2.0x10⁻⁵
3.0x10⁻⁵
Inte
nsity
(tor
r)
M/Z (amu)
CH4
Ar
Ar++

7
Xray diffraction (XRD)
In this part of the work, we have carried out several slow scans of post run products from the
Technology Park in Rowan University. The samples were loaded in hermetically sealed sample
holders (Bruker Model #A100B37) in a glove box under argon and wax sealed. Diffraction patterns
were recorded using Scintag X2 Advanced Diffraction System with an operating voltage set to 40 kV
and current of 30 mA. Patterns were recorded in a step mode [0.02 Deg/min] in the 2θ range 10‐70
using a residence time of 8 seconds. The diffraction patterns of post reaction mixture of manganese
iodide, potassium hydride, magnesium and titanium carbide recorded at Rowan are shown in
Figure 3. The diffraction patterns from a library were matched to the diffraction pattern obtained
from the post run samples. From the diffraction patterns potassium iodide, magnesium metal,
manganese metal, titanium carbide, and magnesium hydride were observed. The diffraction
patterns obtained at Rowan and at a commercial laboratory were similar.
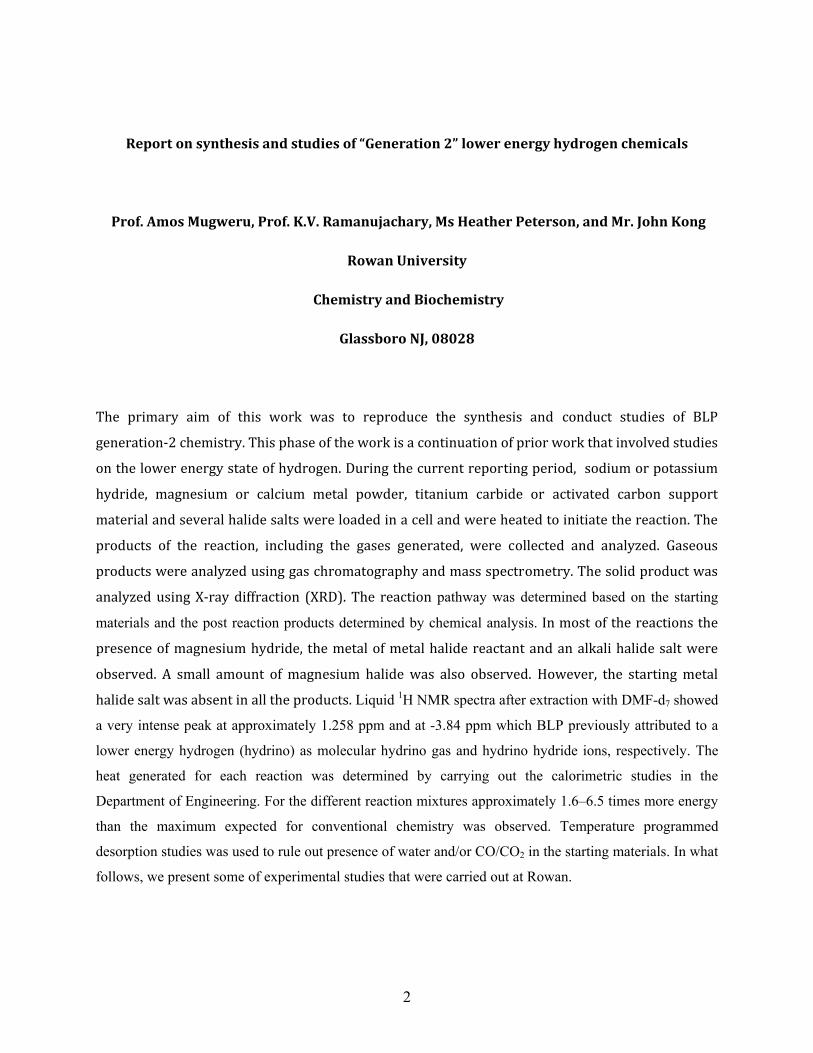
Figure 4 shows the diffraction patterns obtained from the commercial laboratory. Quantitative XRD
analysis from a commercial laboratory shows KH (2.6 + 0.3 %), Mg (4.3 + 0.4%), Mn (3.7+ 0.4%), KI
(22.7 + 0.3%), KMgH2 (5.7 + 0.2%) and TiC (61.0 + 0.8). Manganese iodide was absent from the
reaction products suggesting that it may be the limiting reactant. This was the case based on the
mole ratios of the reagents of the reaction mixture. Accordingly, all the energy calculations were
based on the actual amount of MnI2.
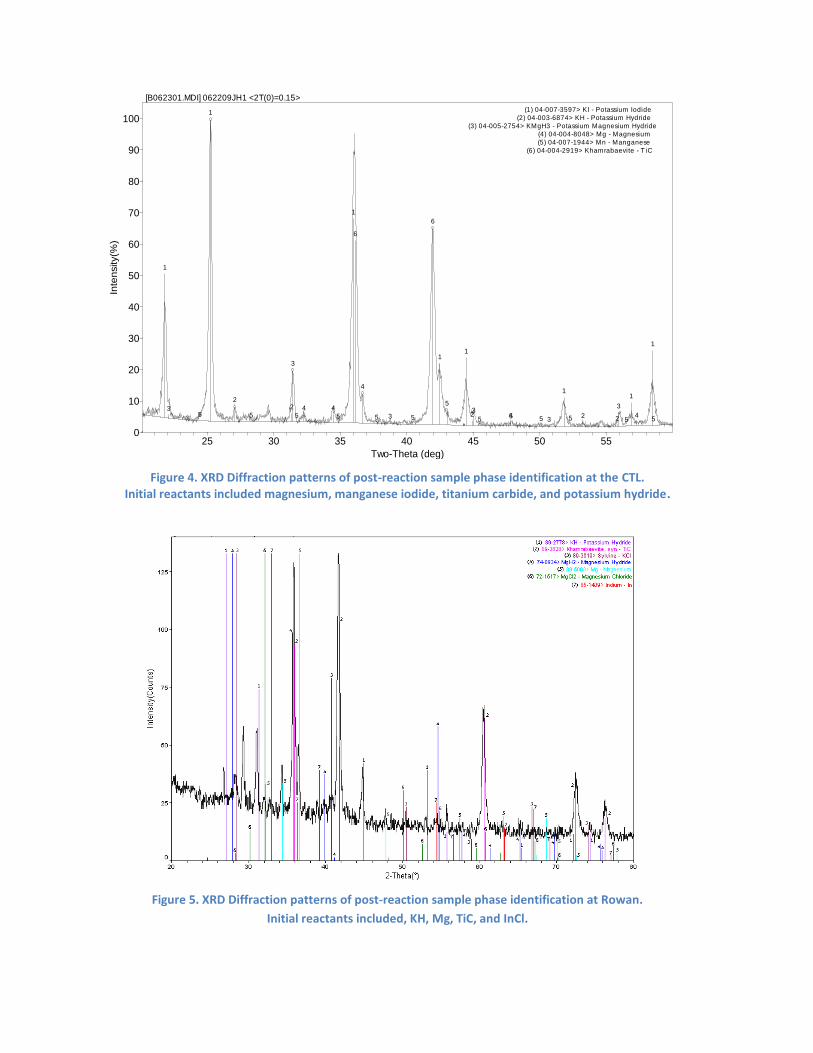
Figure 5 shows the XRD Diffraction patterns of post‐reaction sample phase identification at Rowan.
Reactants included potassium hydride, magnesium, titanium carbide and indium chloride. From the
diffraction patterns we observe that there is no indium chloride in the post reaction mixture,
indicating that it was consumed. The post reaction sample contains magnesium, traces of
magnesium hydride, and magnesium chloride, and indium metal. There were other smaller peaks
that could not be assigned and the phase identification is not conclusive.
XRD of post reaction mixtures containing (i) KH+Mg+SnI2+TiC (ii) NaH+ MgH2+ SF6 +activated
carbon, and (iii) KH+Mg+AgCl+activated carbon are given in the appendix section E. Although we
were not able to establish the completion of the reaction, we however observe some magnesium
hydride, in all cases. The XRD also suggests that all the initial halide salt used in the starting mixture
was absent in the post reaction mixture.

8
Figure 3. XRD Diffraction patterns of post‐reaction sample phase identification at Rowan. Initial
reactants included magnesium, manganese iodide, titanium carbide and potassium hydride.
9
1
1
1
11
1
112
22 2 2
3
33 33 3
4
4444
55 5 5 55 5 5 55 55 5
6
6
25 30 35 40 45 50 55Two-Theta (deg)
0
10
20
30
40
50
60
70
80
90
100
Inte
nsity
(%)
[B062301.MDI] 062209JH1 <2T(0)=0.15>(1) 04-007-3597> KI - Potassium Iodide
(2) 04-003-6874> KH - Potassium Hydride(3) 04-005-2754> KMgH3 - Potassium Magnesium Hydride
(4) 04-004-8048> Mg - Magnesium(5) 04-007-1944> Mn - Manganese
(6) 04-004-2919> Khamrabaevite - T iC
Figure 4. XRD Diffraction patterns of post‐reaction sample phase identification at a commercial
laboratory. Initial reactants included magnesium, manganese iodide, titanium carbide and
potassium hydride.

10
Figure 5. XRD Diffraction patterns of post‐reaction sample phase identification at Rowan. Initialreactants included, KH, Mg, TiC and InCl.
Solution 1H NMR characterization of post reaction products
Solution 1H NMR spectrum of post reaction product involving sodium hydride, magnesium,
activated carbon and SF6 gas was extracted in DMF‐d7 solvent for at least 12 hours. Figure 6 shows
the 1H NMR spectra of the solution obtained. A singlet at 8.03 ppm and two quintets centered at
2.92 ppm, and 2.74 ppm are from the solvent. There was a clear additional large upfield shifted
peak at ‐3.85 ppm, which was not due to the solvent. BLP has previously attributed the upfield
shifted peaks at ‐3.85 ppm to H–(1/4). This upfield shifted NMR peak had been observed by us, in
our compounds in reactions involving hydrogen gas in presence of catalyst and an alkaline salt at
high temperature. BLP has attributed this 1H NMR peak to the formation of hydrino hydride, H–
(1/4) in the reaction.

11
Figure 6. Liquid 1H NMR spectrum of an extract of a post reaction sample containing
NaH+MgH2+SF6+activated carbon in DMF‐d7 solvent.
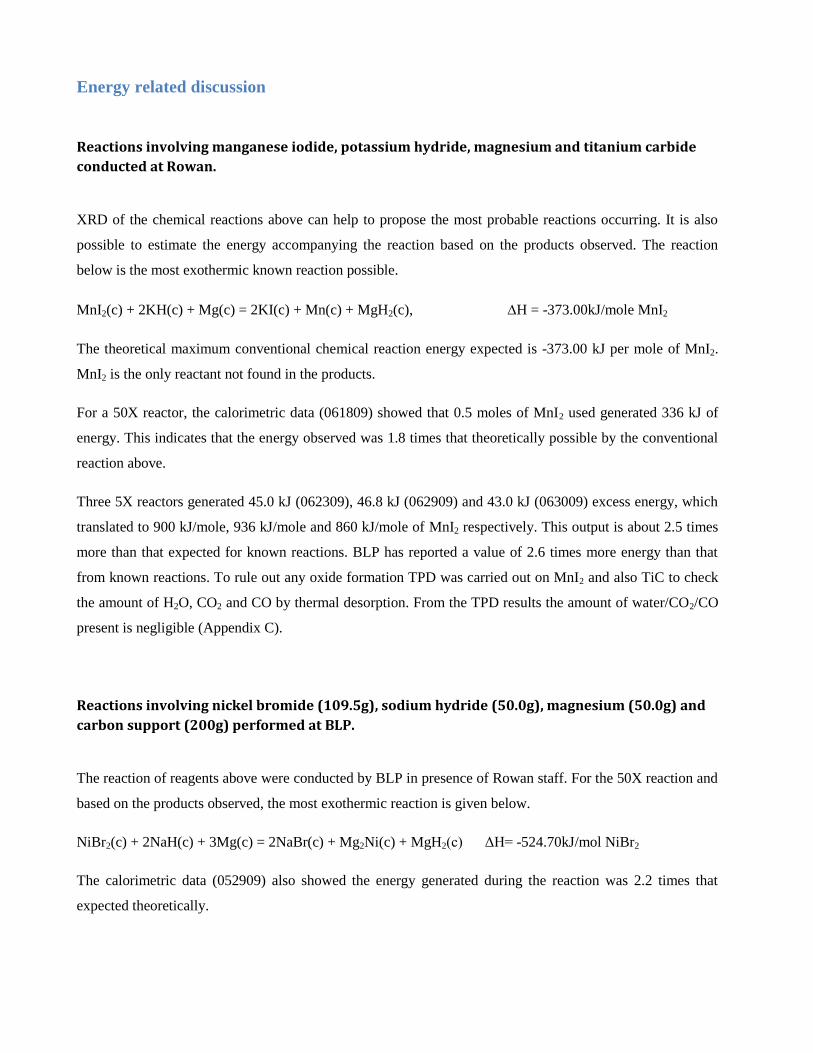
Energy related discussions
Reactions involving manganese iodide, potassium hydride, magnesium and titanium carbide
conducted at Rowan.
XRD of the chemical reactions above can help to propose the most probable reaction occuring. It is
also possible to estimate the energy accompanying the reaction based on the products observed.
The reaction below is the most exothermic known reaction possible.
MnI2(c) + 2KH(c) + Mg(c) = 2KI(c) + Mn(c) + MgH2(c), ΔH = ‐373.00kJ/mole MnI2.
The theoretical maximum conventional chemical reaction energy expected is ‐373.00 kJ per mole of
MnI2[MnI2 is the limiting reagent in our trials].

12
For a 50X reactor, the calorimetric data (061809) showed that 0.5 moles of MnI2 used generated
336 kJ of energy. This indicates that the energy observed was 1.8 times that theoretically possible
by the conventional reaction above.
Three 5X reactors generated 45.0 kJ (062309), 46.8 kJ (062909) and 43.0 kJ (063009) excess
energy which translated to 900 kJ/mole, 936 kJ/mole and 860 kJ/mole of MnI2 respectively. This
output is about 2.5 times more than that expected for known reactions. BLP has reported a value of
2.6 times more energy than that from known reactions. To rule out the presence of any
oxide/carbonate, careful TPD studies were conducted on MnI2 andTiC. From the TPD results the
amount of water/CO2/CO responsible for the formation of oxide/carbonate is negligible (see
Appendix C).
Reactions involving 99% pure nickel bromide (109.5g), sodium hydride (50.0g), magnesium
(50.0g) and carbon support (200g) performed at BLP.
The reaction conducted by BLP‐personnel in presence of Rowan staff. For the 50X reaction and
based on the products observed, the most exothermic reaction is given below.
NiBr2(c) + 2NaH(c) + 3Mg(c) = 2NaBr(c) + Mg2Ni(c) + MgH2(c) ΔH= ‐524.70kJ/mol NiBr2
The calorimetric data (052909) also showed the energy generated during the reaction was 2.2
times that expected theoretically.
Reactions involving silver chloride (7.2g), potassium hydride (8.3g), magnesium (5.0g) and activated
carbon (20.0g) conducted at Rowan.
The most exothermic reaction for the 5X reaction based on the products observed, is given below (XRD
spectra in Appendix E).
AgCl(c) + KH(c) + 0.5Mg(c) = KCl(c) + Ag(c) + 0.5MgH2(c) ΔH= -289.44kJ/mol AgCl
The calorimetric data (070809) also showed that an average of 2.3 times the expected energy was
generated.

13
Reactions involving sulphur hexaflouride (0.03 mol), sodium hydride (5.0g), magnesium hydride
(5.0g) and activated carbon (20.0 g) conducted at Rowan.
The most exothermic reaction for the 5X reaction based on the products observed, is given below (XRD
spectra in Appendix E) .
SF6(g) + 2NaH(c) + 3MgH2(c) + 2C(s) = 2NaMgF3(c) + 2CH4(g) + MgS(c) ΔH= -2,369.22 kJ/mol SF6
The calorimetric data also showed that an average of 1.2–1.5 times the expected energy was generated.
Reactions involving potassium hydride (8.3g), magnesium (5.0g), titanium carbide (20g) and indium
chloride (7.5g) conducted at Rowan.
The most exothermic reaction for the 5X reaction based on the products observed, is given below (XRD
spectra in Appendix E).
InCl(c) + KH(c) + 0.5Mg(c) = KCl(c) + In(c) + 0.5MgH2(c) ΔH= -230.15 kJ/mol InCl
The average calorimetric data showed that an average of 2.05 times the expected energy was generated.
Reactions involving potassium hydride (7.47g), magnesium (4.5g), titanium carbide (18g) and
europium bromide (14.04g) conducted at Rowan.
The most exothermic reaction for the 5X reaction based on the products observed, is given below (XRD
spectra in Appendix E).
EuBr2(c) + 2KH(c) = 2KBr(c) + EuH2(c) ΔH= -136.55 kJ/mol EuBr2
The average calorimetric data showed that an average of 6.5 times the expected energy was generated.
Based on the XRD results, the corresponding reaction was endothermic, indicating an infinite gain
relative to the observed chemical reactions.
Reactions involving potassium hydride (8.3g), magnesium (5.0g), titanium carbide (20g) and iron
bromide (10.8 g) conducted at BLP in the presence of Dr. Peter Jansen.
For the 5X reaction and based on the products observed, the most exothermic reaction is given below.

14
FeBr2(c) + 2KH(c) + Mg(c) = 2KBr(c) + Fe(c) + MgH2(c) ΔH= -497.7 kJ/mol FeBr2
The average calorimetric data (062309) showed that an average of 1.84 times more energy than expected
was generated.
Reactions involving potassium hydride (8.3g), magnesium (5.0g), titanium carbide (20g) and cobalt
iodide (15.65 g) conducted at Rowan.
For the 5X reaction and based on the products observed, the most exothermic reaction is given below.
CoI2(c) + 2KH(c) + Mg(c) = 2KI(c) + Co(c) + MgH2(c) ΔH= -527.0 kJ/mol CoI2
The average calorimetric data (070609) showed that an average of 1.58 times more energy than expected
was generated.
Reactions involving potassium hydride (8.3g), magnesium (5.0g), titanium carbide (20g) and tin
iodide (18.5 g) conducted at Rowan.
For the 5X reaction and based on the products observed, the most exothermic reaction is given below
SnI2(c) + 2KH(c) + 3Mg(c) = 2KI(c) + Mg2Sn(c) + MgH2(c) ΔH= -552.8 kJ/mol SnI2
The average calorimetric data (071609) showed that an average of 1.66 times more energy than expected
was generated.
Reactions involving sodium hydride (5.0g), calcium (5.0g), activated carbon carbide (20g) and
manganese iodide (15.45 g) conducted at Rowan.
For the 5X reaction and based on the products observed, the most exothermic reaction is given below:
MnI2(c) + Ca(c) + 2NaH(c) = 2NaI(c) + CaH2(c) + Mn(c) ΔH= -402.0 kJ/mol MnI2
The average calorimetric data (072409) showed that an average of 1.74 times more energy than expected
was generated.

15
Summary
During the current reporting period we have investigated the chemistry and thermodynamics of the
reaction mixtures containing AH (A = Na or K), Mg and , several halides on various supports. The
alkali metal hydrides served the dual role of catalyst and hydrogen source. Both metal halides such
as, NiBr2, MnI2, AgCl, EuBr, FeBr2, InCl and non‐metal halide SF6 were tested for the reaction. The
presence of calcium or magnesium metal powder, the metal halide and a support material were
essential for the progress of the reaction. Typically, the reaction mixtures were loaded and heated
in a cell to initiate the reaction. All manipulations were carried out in the Ar‐filled drybox. The
reaction products were characterized initially using XRD. The chemical identity of the products
from the XRD studies were used in writing the reaction scheme. In several of the runs the products
were mainly magnesium hydride, the metal of the metal halide reactant, and an alkali halide salt.
There was no evidence of crystalline metal halide in the final product, indicating its complete
consumption. Calorimetric studies indicated the release of energy far in excess of what is predicted
based on the elementary thermodynamic calculations. Products of the reaction mixture containing
NaH, MgH2, activated carbon, and SF6 indicated the presence of “hydrino” species by use of liquid 1H
NMR.
TPD results on the starting materials indicate that there was no water or oxides of carbon present.
The absence of detectable amount of metal oxides in the XRD patterns of the products further rules
out the possibility of a reaction between water and reactive metals. Although we have not
concluded our work in the area of characterization, the presence of the new forms of lower energy
hydrogen “hydrino” observed in our previous report may be responsible for these higher than
expected energy gains observed.
In conclusion, the experimental work carried out at Rowan University in the Departments of
Engineering and Chemistry confirms independently the empirical findings of BLP with respect
to anomalous heat generation and chemical analysis. BLP attributes the anomalous heat
generated to the formation of an unusual state of hydrogen during these reactions, what they have
named 'hydrinos'.
16
Appendix Section:
Appendix A
Appendix B
0
10
20
30
40
0 100 200 300 400 500 600
Temperature oC
TPD of TIC
TPD (temperature‐program desorption) of TiC
17
Appendix C
0
0.5
1
1.5
2
2.5
3
0 2000 4000 6000 8000 1 104
Time (sec)
MnI2 trap dropped
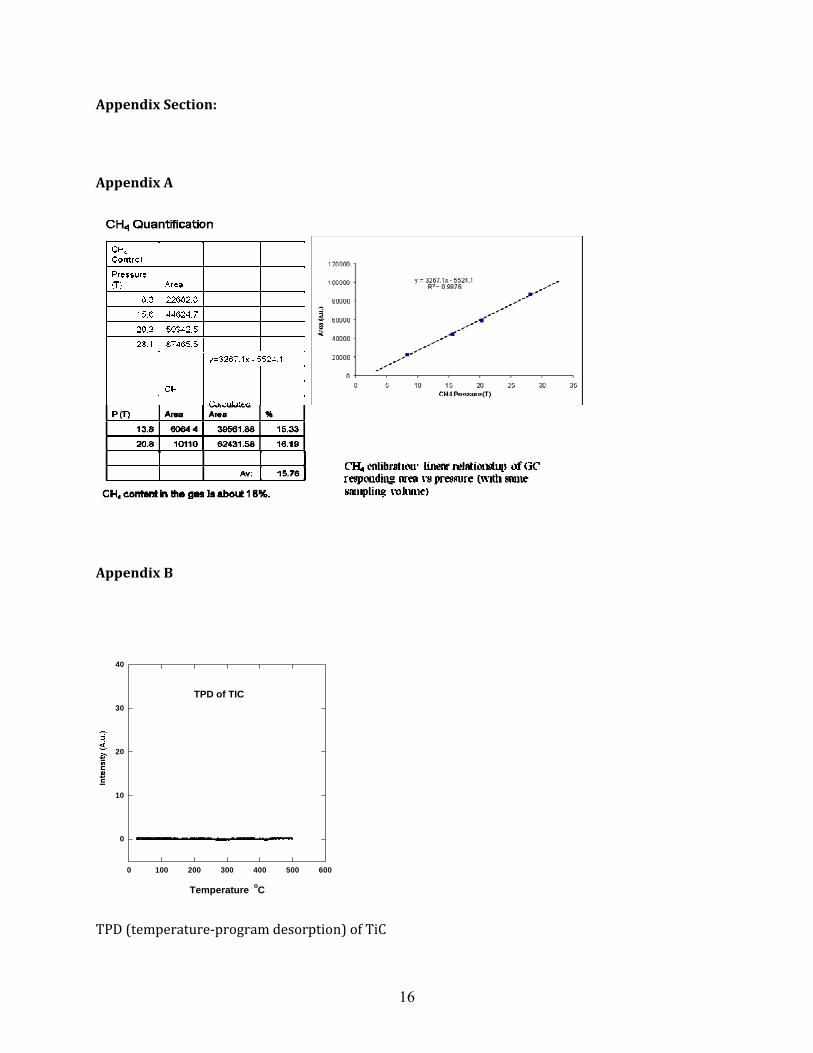
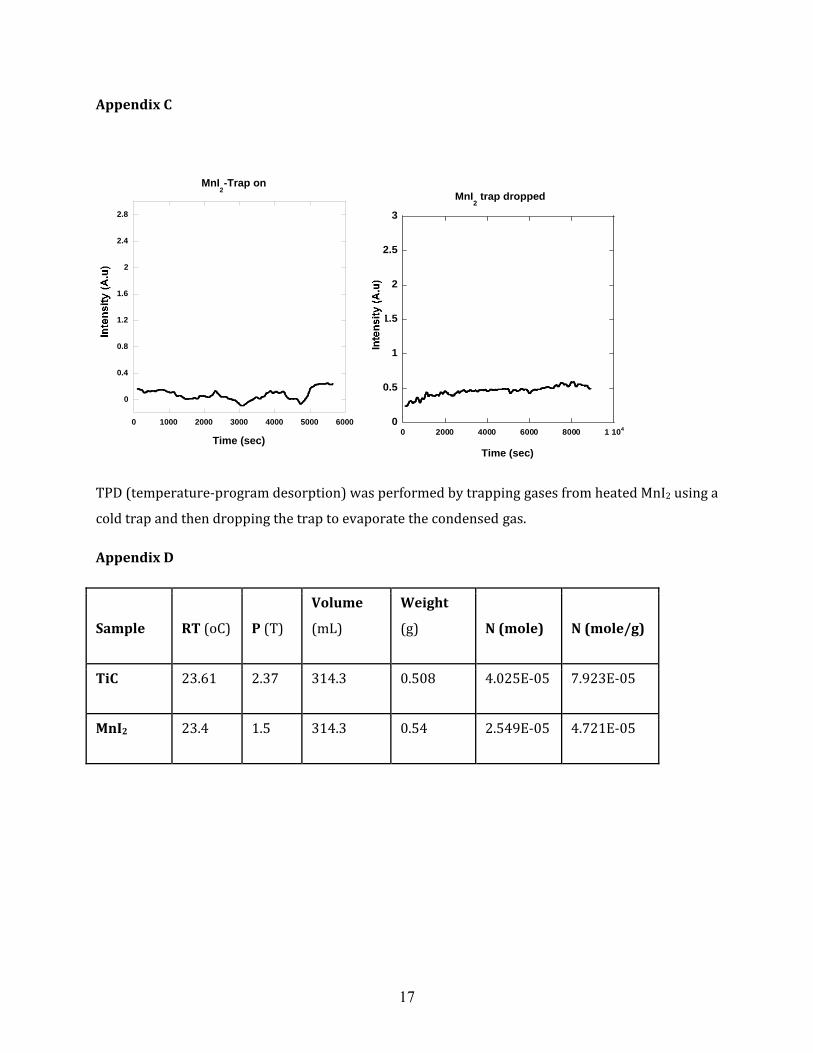
TPD (temperature‐program desorption) was performed by trapping gases from heated MnI2 using a
cold trap and then dropping the trap to evaporate the condensed gas.
Appendix D
Sample RT (oC) P (T)
Volume
(mL)
Weight
(g) N (mole) N (mole/g)
TiC 23.61 2.37 314.3 0.508 4.025E‐05 7.923E‐05
MnI2 23.4 1.5 314.3 0.54 2.549E‐05 4.721E‐05
0
0.4
0.8
1.2
1.6
2
2.4
2.8
0 1000 2000 3000 4000 5000 6000
Time (sec)
MnI2-Trap on

18
Appendix E
Initial reactants include potassium hydride, magnesium, activated carbon and silver chloride.
Initial reactants include sodium hydride, magnesium hydride, activated carbon and sulfur (VI) fluoride.

19
Initial reactants include potassium hydride, magnesium, titanium carbide and tin (II) iodide.
-50510Chemical Shift (ppm)
8.03
4.5513.499
2.92
2.752
3.8540.1770.823
Liquid 1H NMR spectrum of an extract of a post reaction sample containing NaH+MgH2+SF6+ activated carbon in DMF‐d7 solvent.

20
Initial reactants include potassium hydride, magnesium, activated carbon and europium bromide.

Rowan University Faculty & Staff: Rowan University Students: Dr. Peter Mark Jansson, PP PE Ulrich K.W. Schwabe, BSECE Prof. Amos Mugweru Kevin Bellomo-Whitten Prof. K.V. Ramanujachary Pavlo Kostetskyy Heather Peterson, BSCh John Kong Eric Smith Eric Smith
10 August 2009
Anomalous Heat Gains from Multiple
Chemical Mixtures: Analytical Studies of “Generation 2” Chemistries
of BlackLight Power Corporation

Contents
Executive Summary ................................................................................................................................................ 3
Introduction ........................................................................................................................................................... 4
Background ............................................................................................................................................................ 4
Chemicals and Procedures ..................................................................................................................................... 5
Temperature programmed desorption studies (TPD)............................................................................................ 6
Analysis of reaction products ................................................................................................................................. 7
X-ray diffraction (XRD) ........................................................................................................................................... 8
Energy related discussion..................................................................................................................................... 11
Reactions involving manganese iodide, potassium hydride, magnesium and titanium carbide
conducted at Rowan. ........................................................................................................................................... 11
Reactions involving nickel bromide (109.5g), sodium hydride (50.0g), magnesium (50.0g)
and carbon support (200g) performed at BLP. .................................................................................................... 11
Reactions involving silver chloride (7.2g), potassium hydride (8.3g), magnesium (5.0g)
and activated carbon (20.0g) conducted at Rowan. ............................................................................................ 12
Reactions involving sulfur hexafluoride (0.03 mol), sodium hydride (5.0g), magnesium hydride (5.0g)
and activated carbon (20.0 g) conducted at Rowan. ........................................................................................... 12
Reactions involving potassium hydride (8.3g), magnesium (5.0g) and titanium carbide (20g)
and indium chloride (7.5g) conducted at Rowan. ................................................................................................ 12
Reactions involving potassium hydride (7.47g), magnesium (4.5g) and titanium carbide (18g)
and europium bromide (14.04g) conducted at Rowan. ....................................................................................... 12
Reactions involving potassium hydride (8.3g), magnesium (5.0g), titanium carbide (20g)
and iron bromide (10.8 g) conducted at BLP in the presence of Dr. Peter Jansen. ............................................. 13
Reactions involving potassium hydride (8.3g), magnesium (5.0g), titanium carbide (20g)
and cobalt iodide (15.65 g) conducted at Rowan. ............................................................................................... 13
Reactions involving potassium hydride (8.3g), magnesium (5.0g), titanium carbide (20g)
and tin iodide (18.5 g) conducted at Rowan. ....................................................................................................... 13
Reactions involving sodium hydride (5.0g), calcium (5.0g), activated carbon carbide (20g)
and manganese iodide (15.45 g) conducted at Rowan. ....................................................................................... 14
Calorimetry........................................................................................................................................................... 14
Conclusion ............................................................................................................................................................ 17
Appendix A – Chemistry Information ................................................................................................................... 18
Appendix B– Small Cell Calibrations ..................................................................................................................... 20
Appendix C – Large Cell Calibrations .................................................................................................................... 36
Appendix D – Small Cell Heat Runs ..................................................................................................................... 41
Appendix E – Large Cell Heat Runs ....................................................................................................................... 57

Executive Summary
BlackLight Power (BLP) of Cranbury, NJ has been developing multiple chemical reactions that they believe
create favorable conditions to provide catalysts and reaction conditions needed to relax the hydrogen atom
below its widely accepted ground state. Through these reactions BLP claims they are capable of generating
a significant quantity of heat from the energy released. In order to test and validate these claims, a team of
engineering and chemistry professors and students at Rowan University have been independently
conducting testing of the equipment and chemicals used by BLP in Rowan University laboratory facilities at
Science Hall and the South Jersey Technology Park. This report specifically focuses on the details of the
most recent testing (May – July 2009), which involves several different chemistries, performed in over 20
heat releasing runs during the three month period. The testing is a continuation of previous work
commenced in the Spring of 2008 when Rowan University independently verified the calibration accuracy
and testing protocols of the BLP measurement system and anomalous heat generation using BLP’s
proprietary catalysts. One 50X (0.5 moles) metal halide scale heat run and nearly 20 5X (0.05 moles) metal
halide scale heat runs were performed using ten (10) different chemical mixtures. In addition, Rowan
validators witnessed the loading and unloading of two additional 5X scale runs and a 50X scale run at BLP
labs. The detailed chemical combinations are fully disclosed herein and include mixtures consisting of
potassium hydride, sodium hydride, magnesium, calcium, titanium carbide, manganese iodide and other
chemicals detailed in Table 1.
What is most significant about this new work is that our Rowan University (RU) team was able to
consistently generate anomalous heat through these reactions in our South Jersey Technology Park
calorimeter laboratory in quantities ranging from 1.2 times to 6.5 times the maximum theoretical heat
available through known exothermic reactions. Also, we were able to procure the chemicals used in the
reactions from normal chemical suppliers (e.g. Alfa Aesar and Sigma Aldrich). Of particular import is that
the specific quantities and mixtures of reaction chemicals are fully disclosed in this document (See Tables 1
and 4). This significant disclosure by BLP now presented for the first time in this report makes it possible for
any laboratory with a nominally accurate calorimetry system (1-3% error) to demonstrate the repeatability
of these reactions which produce anomalous heat regularly in our university laboratory. Finally, the
scientists of the Rowan University Chemistry and Biochemistry Department have analyzed the reaction
products and are confident that the procedures we have followed and chemicals we have procured and
reacted are not capable of generating the quantities of heat we have observed. They have also reproduced
BLP tests which identify a novel form of hydrogen as a potential explanation of the additional heat evolved.

Introduction
The primary aim of this work was to reproduce synthesis experiments and conduct calorimetry studies of
BLP ‘generation 2’ chemistry in a continuation of prior work that involved what BLP claims is ‘lower energy’
hydrogen. In this work potassium hydride, sodium hydride, magnesium metal powder, titanium carbide
support material and several halide salts (See Table 4 for complete list of all chemicals involved in the
numerous experiments) were loaded in a cell and heated to initiate a chemical reaction. The products of
the reaction including the gases generated were collected and analyzed using gas chromatography and
mass spectrometry. The solid samples were analyzed using XRD and showed the presence of magnesium
hydride, the metal of the metal halide reactant and an alkali halide. A small amount of magnesium halide
was also observed. However the starting halide salt was absent in the products. Liquid proton NMR showed
the ‘hydrino hydride ion H–(1/4)’ upfield at -3.85 ppm and the corresponding ‘molecular hydrino H2(1/4)’ at
1.23 ppm as predicted by Mills [R. L. Mills, G. Zhao, K. Akhtar, Z. Chang, J. He, Y. Lu, W. Good, G. Chu, B.
Dhandapani, “Commercializable Power Source from Forming New States of Hydrogen,” Int. J. Hydrogen
Energy, Vol. 34, (2009), 573–614.]. The heat generated during these many reaction experiments was
determined by carrying out detailed calorimetric studies in the Department of Engineering at their South
Jersey Technology Park calorimetry laboratory. These 20 experiments indicated an average energy of 1.95
and one as high as over 6.5 that of what would be expected for the most energetic conventional chemical
reaction. Temperature programmed desorption studies were used to rule out the presence of water in the
starting materials. In what follows, we present the results of some of the experimental studies that were
carried out.
Background
In a prior report the Department of Chemistry and Biochemistry synthesized compounds using procedures
provided by BLP in a search for potential causes of the anomalous heat being generated by the reactions. In
that analysis, the RU Chemistry Department was able to confirm the presence of unusual hydrogen in the
reaction products using both liquid 1H NMR and MAS 1H NMR studies. For that study, alkaline halides were
heated in presence of hydrogen and a catalyst. According to BLP, the alkali metal halide is capable of
trapping the ‘lower energy’ or ‘hydrino’ hydrogen as a high binding energy hydride ion called the ‘hydrino
hydride’ ion and as the corresponding molecular hydrino. In this report our RU research team was to focus
on BLP ‘generation 2’ chemistries. BLP has been conducting studies with a range of chemistries that they
claim to represent a new energy source that is more easily verifiable. In the chemistry tests, which RU
personnel witnessed at BLP, potassium hydride, magnesium metal powder, a support material, and metal
halide were mixed and heated to initiate the reaction. Calorimetric studies as well as chemical
characterizations of the reaction products were done using XRD, TPD, GC/MS techniques. We report
chemical test of reactions done at Rowan with our chemicals using both 5X and 50X scale reactors. We
assess possible reactions occurring along with their enthalpies, and compare the enthalpies of the
anticipated reaction with the actual heat observed for both the smaller 5X reactors and the larger 50X
reactor.
Chemicals and Procedures
A number of components were used in preparation of reaction cells for heat runs conducted at Rowan
University. Table 1 contains a summary of the components used along with purity and supplier information.
Table 1. Component Information
Component Purity Supplier Formula
Titanium Carbide n/a Alfa Aesar TiC
Tin Iodide 99% Alfa Aesar SnI2
Iron Bromide 98+% Alfa Aesar FeBr2
Magnesium Metal 99.80% Alfa Aesar Mg
Potassium Hydride (in mineral oil)
n/a Alfa Aesar KH
Manganese Iodide 98% Strem Chemicals MnI2
Anhydrous Hexane ≥99% Sigma Aldrich CH3(CH2)4CH3
Indium Chloride 99.995% Alfa Aesar InCl
Cobalt Iodide 99.5% Alfa Aesar CoI2
Europium Bromide 99.99% Alfa Aesar EuBr2
Silver Chloride 99.9% Alfa Aesar AgCl
Sulfur Hexafluoride 99.9% GTS–Welco SF6
Calcium 98.8% Alfa Aesar Ca
The following is an example of how RU prepared to perform one of these studies (conducted on 18 June
2009): In preparation for the reaction, titanium carbide was first dried in a flask under a vacuum of
approximately 50 mTorr at 200 oC for 14 hours and then transferred to a glove box. The potassium hydride
was washed inside the glove box with anhydrous hexane four times after decanting the mineral oil.
Potassium hydride was further dried in the anti-chamber of the glove box for 4 hours to remove residual
hexane and other organic residues, and afterwards placed in a sealed container.
In preparation for the experiment, 83.0 grams of KH, 50.0 grams of Mg, 200.0 grams of TiC and 154.0 grams
of MnI2 were weighed and thoroughly mixed in a large beaker inside the glove box. A 2.0 liter cell was
placed in a glove box, the reaction mixture was quantitatively poured into it, after which the cell was sealed
in the controlled environment. The loaded cell was then taken to SJTP where the calorimetric test was
performed. For a 5X cell the weight of each individual component of reaction mixture was reduced by a
factor of ten. The reaction was repeated with MnI2 replaced by FeBr2, InCl, CoI2, SnI2 and EuBr2. In further
reaction mixtures activated carbon (AC) replaced TiC and AgCl or SF6 replaced MnI2.
Temperature programmed desorption studies (TPD)
The analysis was performed using a Chembet 3000 chemisorption unit of Quantchrome corporation with a
Thermal conductivity detector (TCD). The initial task of this phase of analysis was to quantify the water
present, if any, in the starting materials. Argon was used as a carrier gas and dry ice was used for the
separation of water [by condensation] during the course of desorption experiments. Approximately 0.1
grams of the sample was loaded into a TPD cell in an argon environment, the cell was then placed in a
thermal heater and connected to a gas line (including stainless steel tubing and reservoir). Any condensed
water would be carried into the TCD analyzer when the dry ice dewar was removed and the trap was
warmed to room temperature. Appendix A shows the TPD trace for the starting materials (TiC and MnI2)
suggesting a negligible amount of condensable gas such as water and CO2 present in the materials.
An independent TPD analysis was also performed using the ideal gas law. Approximately 0.1 grams of the
starting chemical sample was loaded into a TPD cell under argon, the cell was then placed in a thermal
heater and connected to a gas line (including stainless steel tubing and reservoir). Before heating, the
sample and gas lines were evacuated to ~10-5 Torr of pressure. The cell was then heated slowly to roughly
500 oC in order to desorb all of the water present in the sample. The evolved gas was expanded into a
reservoir of known volume. The gas line was then submerged into a liquid nitrogen dewar in order to
condense any water vapor or other gas(es) present from the thermal desorption. After evacuating the
noncondensable gases, the cold trap was removed to allow the reservoir to reach room temperature and
evaporate any condensed gas with temperature increases. In the experiment, cell temperature, room
temperature, and gas pressure were monitored and recorded by the Labview program.
The quantity of gas obtained was calculated using the ideal gas law (Equation 1) using the measured
pressure, temperature and volume.

PV = nRT (1)
The results of the TPD of the TiC and MnI2 starting materials are given in Appendix A. Since liquid nitrogen
was used as the cold trap, any gas with a boiling point temperature above -196 oC would have been
condensed. As shown, the total condensable gas was negligible; thus, the material contained minute
quantities of H2O (and/or CO2 and CO) from both TiC and MnI2. Their contribution to the heat energy of the
reaction was considered to be small enough to be negligible in the heat balance calculations.
Analysis of reaction products
Before collecting the gas for MS and GC analysis, the pressure and volume of the gas in the reactor was
measured by connecting the reactor to a pre-evacuated reservoir of known volume that had a pressure
gauge. Using the known combined volume, measured pressure and temperature, the moles of gas were
determined using the ideal gas law. Room temperature was also recorded. The gas from the reaction was
then collected in an empty cell for mass spectroscopic identification and quantitative gas chromatography.
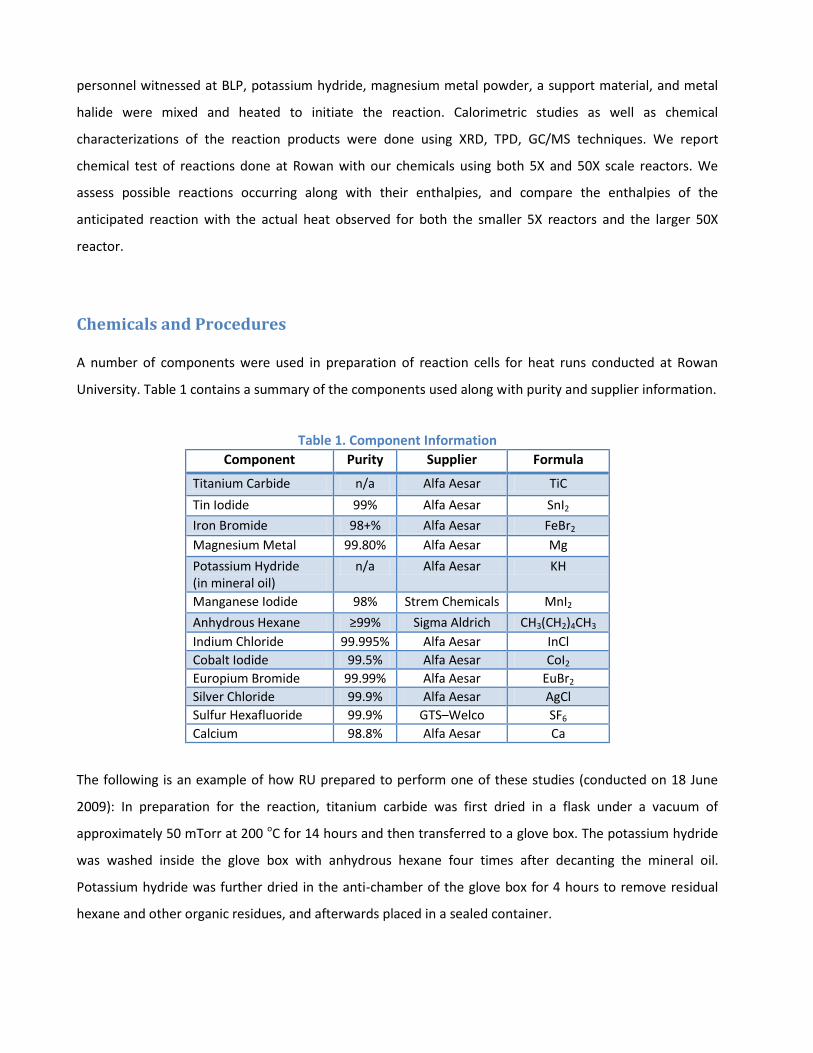
Gas chromatography (GC) showed that most of the gas generated during the reaction was methane. Figure
1 below shows a GC chromatogram of the gases generated during the reaction. Argon is present due to cell
loading being done in an argon environment of a glove box. The gas was directly injected into a GC via a six-
port rotary valve, which was connected to the gas line right before the injector. Prior to the gas sample
addition, the sample loop (~3 ml) in the six-port rotary valve was sufficiently evacuated (~10E-5 Torr) to
remove any residual gases and contaminants. The oven temperature was set to 80 oC, the injector to 100
oC, and the detector to 120 oC. Helium at a flow rate of 43.4 ml/min was chosen as a carrier gas.
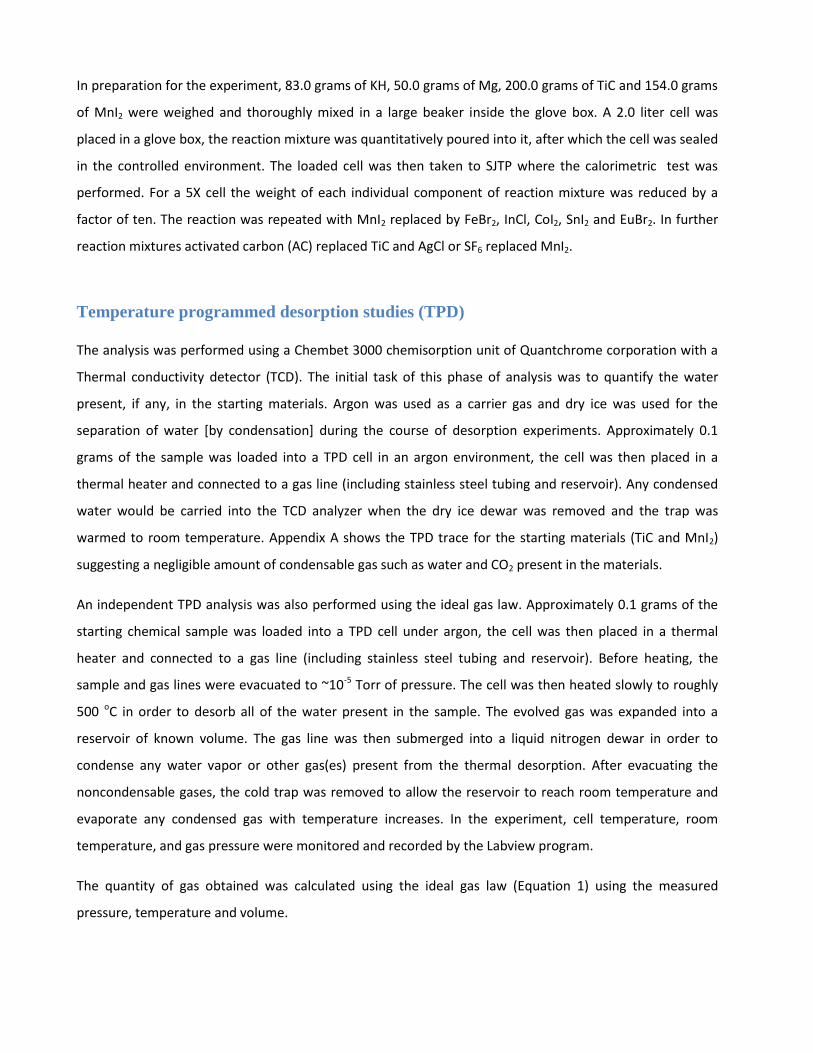
Calibrations using pure H2, CH4, CO, and CO2 were performed prior to testing. Figure 2 shows an MS
spectrum of gas generated during the reaction. To quantify the amount of methane found in the gaseous
phase, a calibration curve of methane gas was obtained (Appendix A). In the case of the reaction mixture
83g KH +50g Mg + 200g TiC + 154.5g MnI2, a quantitative analysis of the gaseous phase indicated that 16.0%
of volume of the gas produced was methane. Since the total gas pressure was about 1 atm and the volume
of methane was 384 ml (2400 ml × 16%), the moles of methane in the product was 0.0158 mole (at a room
temperature of 24 oC).
0 2 4 6 8 10 12 14
-2000
0
2000
4000
Inte
nsity (
a.u
)
Retention Time (min)
CH4
Ar
Figure 1. Gas Chromatograph of contents of gas phase generated during the reaction
Figure 2. MS spectra of gas generated in the reaction.
Methane shows as the minor component due to cell loading in an Argon filled dry-box.
X-ray diffraction (XRD)
In this part of the work, the Department of Chemistry carried out several slow scans of post run samples
from the Tech Park at RU. Diffraction patterns were recorded using the Scintag X2 Advanced Diffraction
System with an operating voltage set to 40 kV and current of 30 mA. Patterns were recorded in a step mode
[0.02 Deg/min] at a diffraction angle of 2θ in the range of 10-70 using a residence time of 8 seconds. The
0 10 20 30 40 50 60 70 80 90
0.0
1.0x10⁻⁵
2.0x10⁻⁵
3.0x10⁻⁵
Inte
nsity (
torr
)
M/Z (amu)
CH4
Ar
Ar++

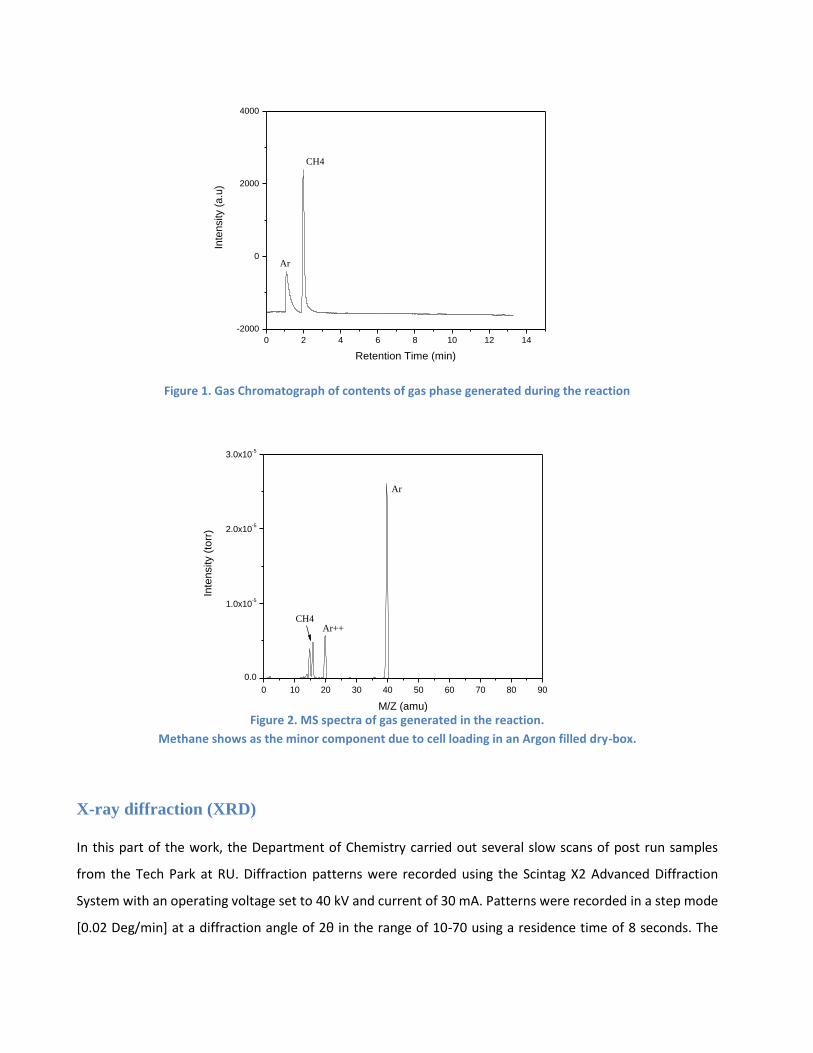
diffraction patterns of the post reaction product of manganese iodide, potassium hydride, magnesium and
titanium carbide done at Rowan is shown in Figure 3. The diffraction patterns from the library were
matched to those obtained from the post-run samples. From the diffraction patterns potassium iodide,
magnesium metal, manganese metal, titanium carbide and magnesium hydride were observed. The
diffraction patterns obtained at Rowan and independently at a commercial testing laboratory (CTL) were
similar. Figure 4 shows the diffraction patterns obtained from the CTL. Quantitative XRD from the CTL
shows KH (2.6 + 0.3 %), Mg ( 4.3 + 0.4%), Mn (3.7+ 0.4%), KI (22.7 + 0.3%), KMgH2 (5.7 + 0.2%) and TiC (61.0
+ 0.8). Manganese iodide was absent from the reaction products indicating it may have been the limiting
reactant. Energy calculations performed were thus based on MnI2.
Figure 3. XRD Diffraction patterns of post-reaction sample phase identification at RU.
Initial reactants included magnesium, manganese iodide, titanium carbide, and potassium hydride.
1
1
1
11
1
11
22
2 2 2
3
33 33 3
4
4444
5
5 5 5 55 5 5 55 55 5
6
6
25 30 35 40 45 50 55
Two-Theta (deg)
0
10
20
30
40
50
60
70
80
90
100In
ten
sity(%
)
[B062301.MDI] 062209JH1 <2T(0)=0.15>
(1) 04-007-3597> KI - Potassium Iodide
(2) 04-003-6874> KH - Potassium Hydride
(3) 04-005-2754> KMgH3 - Potassium Magnesium Hydride
(4) 04-004-8048> Mg - Magnesium
(5) 04-007-1944> Mn - Manganese
(6) 04-004-2919> Khamrabaevite - T iC
Figure 4. XRD Diffraction patterns of post-reaction sample phase identification at the CTL. Initial reactants included magnesium, manganese iodide, titanium carbide, and potassium hydride.
Figure 5. XRD Diffraction patterns of post-reaction sample phase identification at Rowan.
Initial reactants included, KH, Mg, TiC, and InCl.
Energy related discussion
Reactions involving manganese iodide, potassium hydride, magnesium and titanium carbide
conducted at Rowan.
XRD of the chemical reactions above can help to propose the most probable reactions occurring. It is also
possible to estimate the energy accompanying the reaction based on the products observed. The reaction
below is the most exothermic known reaction possible.
MnI2(c) + 2KH(c) + Mg(c) = 2KI(c) + Mn(c) + MgH2(c), H = -373.00kJ/mole MnI2
The theoretical maximum conventional chemical reaction energy expected is -373.00 kJ per mole of MnI2.
MnI2 is the only reactant not found in the products.
For a 50X reactor, the calorimetric data (061809) showed that 0.5 moles of MnI2 used generated 336 kJ of
energy. This indicates that the energy observed was 1.8 times that theoretically possible by the conventional
reaction above.
Three 5X reactors generated 45.0 kJ (062309), 46.8 kJ (062909) and 43.0 kJ (063009) excess energy, which
translated to 900 kJ/mole, 936 kJ/mole and 860 kJ/mole of MnI2 respectively. This output is about 2.5 times
more than that expected for known reactions. BLP has reported a value of 2.6 times more energy than that
from known reactions. To rule out any oxide formation TPD was carried out on MnI2 and also TiC to check
the amount of H2O, CO2 and CO by thermal desorption. From the TPD results the amount of water/CO2/CO
present is negligible (Appendix C).
Reactions involving nickel bromide (109.5g), sodium hydride (50.0g), magnesium (50.0g) and
carbon support (200g) performed at BLP.
The reaction of reagents above were conducted by BLP in presence of Rowan staff. For the 50X reaction and
based on the products observed, the most exothermic reaction is given below.
NiBr2(c) + 2NaH(c) + 3Mg(c) = 2NaBr(c) + Mg2Ni(c) + MgH2(c) ΔH= -524.70kJ/mol NiBr2
The calorimetric data (052909) also showed the energy generated during the reaction was 2.2 times that
expected theoretically.

Reactions involving silver chloride (7.2g), potassium hydride (8.3g), magnesium (5.0g) and
activated carbon (20.0g) conducted at Rowan.
The most exothermic reaction for the 5X reaction based on the products observed, is given below (XRD
spectra in appendix E).
AgCl(c) + KH(c) + 0.5Mg(c) = KCl(c) + Ag(c) + 0.5MgH2(c) ΔH= -289.44kJ/mol AgCl
The calorimetric data (070809) also showed that an average of 2.3 times the expected energy was generated.
Reactions involving sulfur hexafluoride (0.03 mol), sodium hydride (5.0g), magnesium hydride
(5.0g) and activated carbon (20.0 g) conducted at Rowan.
The most exothermic reaction for the 5X reaction based on the products observed, is given below (XRD
spectra in appendix E) .
SF6(g) + 2NaH(c) + 3MgH2(c) + 2C(s) = 2NaMgF3(c) + 2CH4(g) + MgS(c) ΔH= -2,369.22 kJ/mol SF6
The calorimetric data also showed that an average of 1.2–1.5 times the expected energy was generated.
Reactions involving potassium hydride (8.3g), magnesium (5.0g) and titanium carbide (20g)
and indium chloride (7.5g) conducted at Rowan.
The most exothermic reaction for the 5X reaction based on the products observed, is given below (XRD
spectra in appendix E).
InCl(c) + KH(c) + 0.5Mg(c) = KCl(c) + In(c) + 0.5MgH2(c) ΔH= -230.15 kJ/mol InCl
The average calorimetric data showed that an average of 2.05 times the expected energy was generated.
Reactions involving potassium hydride (7.47g), magnesium (4.5g) and titanium carbide (18g)
and europium bromide (14.04g) conducted at Rowan.
The most exothermic reaction for the 5X reaction based on the products observed, is given below (XRD
spectra in appendix E).

EuBr2(c) + 2KH(c) = 2KBr(c) + EuH2(c) ΔH= -136.55 kJ/mol EuBr2
The average calorimetric data showed that an average of 6.5 times the expected energy was generated. Based
on the XRD results, the corresponding reaction was endothermic, indicating an infinite gain relative to the
observed chemical reactions.
Reactions involving potassium hydride (8.3g), magnesium (5.0g), titanium carbide (20g) and
iron bromide (10.8 g) conducted at BLP in the presence of Dr. Peter Jansen.
For the 5X reaction and based on the products observed, the most exothermic reaction is given below.
FeBr2(c) + 2KH(c) + Mg(c) = 2KBr(c) + Fe(c) + MgH2(c) ΔH= -497.7 kJ/mol FeBr2
The average calorimetric data (062309) showed that an average of 1.84 times more energy than expected was
generated.
Reactions involving potassium hydride (8.3g), magnesium (5.0g), titanium carbide (20g) and
cobalt iodide (15.65 g) conducted at Rowan.
For the 5X reaction and based on the products observed, the most exothermic reaction is given below.
CoI2(c) + 2KH(c) + Mg(c) = 2KI(c) + Co(c) + MgH2(c) ΔH= -527.0 kJ/mol CoI2
The average calorimetric data (070609) showed that an average of 1.58 times more energy than expected was
generated.
Reactions involving potassium hydride (8.3g), magnesium (5.0g), titanium carbide (20g) and
tin iodide (18.5 g) conducted at Rowan.
For the 5X reaction and based on the products observed, the most exothermic reaction is given below
SnI2(c) + 2KH(c) + 3Mg(c) = 2KI(c) + Mg2Sn(c) + MgH2(c) ΔH= -552.8 kJ/mol SnI2
The average calorimetric data (071609) showed that an average of 1.66 times more energy than expected was
generated.

Reactions involving sodium hydride (5.0g), calcium (5.0g), activated carbon carbide (20g) and
manganese iodide (15.45 g) conducted at Rowan.
For the 5X reaction and based on the products observed, the most exothermic reaction is given below:
MnI2(c) + Ca(c) + 2NaH(c) = 2NaI(c) + CaH2(c) + Mn(c) ΔH= -402.0 kJ/mol MnI2
The average calorimetric data (072409) showed that an average of 1.74 times more energy than expected was
generated.
Calorimetry
A continuous water flow calorimeter was used as part of the experimental setup. In order to ensure valid
experimental results from exothermic heat runs a series of calibrations were conducted using both the 1kW
and 50kW systems. All of the experiments performed strictly followed the experimental procedures written
specifically for each cell type. A detailed procedure write-up can be found in previously submitted reports.
A series of calibrations were performed for both cell types from early May 2009 through the present time.
Nearly all of the results obtained were well within the accepted coupling range (1-3% error) with a few
exceptions that could be attributed to equipment malfunction and errors in experimental procedure. A
summary of these calibrations has been provided in Table 2.
Table 2. Summary of Small Cell Calibrations
Run Date Input Output (kJ) ∆E (kJ) % Difference Coupling
1 5/13/2009 149.52 147.56 -1.96 -1.31% 98.69%
2 5/20/2009 150.36 149.39 -0.98 -0.65% 99.35%
3 5/22/2009 200.50 197.16 -3.35 -1.67% 98.33%
4 5/26/2009 127.46 124.32 -3.15 -2.47% 97.53%
5 5/27/2009 240.73 239.28 -1.45 -0.60% 99.40%
6 5/28/2009 149.69 148.58 -1.12 -0.75% 99.25%
7 5/29/2009 152.57 151.72 -0.84 -0.55% 99.45%
8 6/2/2009 149.74 149.33 -0.41 -0.27% 99.73%
9 6/28/2009 120.17 119.29 -0.88 -0.73% 99.27%
10 7/1/2009 140.19 139.10 -1.09 -0.78% 99.22%
11 7/5/2009 179.44 179.07 -0.37 -0.21% 99.79%
12 7/14/2009 268.78 265.31 -3.48 -1.29% 98.71%
13 7/15/2009 230.66 228.13 -2.52 -1.09% 98.91%
14 7/20/2009 199.25 198.73 -0.52 -0.26% 99.74%
15 7/27/2009 199.67 198.49 -1.17 -0.59% 99.41%
16 7/28/2009 199.23 198.69 -0.55 -0.27% 99.73%

Calibrations were performed frequently and the results obtained can be observed in Appendices B and C.
Detailed graphical analysis of the small cell calibrations can be seen in Appendix B.
A summary of large cell calibrations is contained in Table 3 below. The results obtained from data analysis
using Matlab software were within acceptable ranges. The percent difference between input and output
energies was between 1.0 and 3.0 percent. These calibrations were, on average, higher than their smaller
cell counterparts, an anomaly which can be attributed to the necessity for significantly lengthier cool down
periods that allowed for higher losses to the surroundings.
Table 3. Summary of Large Cell Calibrations
Run Date Input Output (kJ) ∆E (kJ) % Difference Coupling
1 6/10/2009 1452.59 1425.85 -26.74 -1.84% 98.20%
2 6/11/2009 899.03 888.22 -10.81 -1.20% 98.80%
3 6/12/2009 776.40 763.04 -13.36 -1.72% 98.28%
4 6/24/2009 1401.19 1360.74 -40.45 -2.89% 97.11%
5 6/26/2009 1203.16 1173.96 -29.20 -2.43% 97.57%
Several heat runs were also conducted using different component mixtures as reactants. The compositions
and quantities of the reactant mixtures were discussed in further detail in the chemistry section. All of the
heat runs conducted at SJTP coincided well with those obtained from heat runs conducted at BLP. A
summary of the heat run results can be found in Table 4. Figures obtained from Matlab analysis of the heat
run data can be found in Appendices D and E.

Table 4. Heat Run Summary
Date Chemical Composition Input (kJ) Output (kJ) ∆E
(kJ) Max Theoretical
Energy (kJ)
Energy Gain (∆E/Max.
Theoretical Energy)
5/29/2009 50.0 g NaH + 50 g Mg + 200 g AC + 109.5 g NiBr2 (BLP SITE) Amos/Chari
1990.00 2567.00 577.00 262 2.2
6/18/2009 83 g KH + 50.0 g Mg + 200.0 g TiC + 154.5 g Mnl2
715.28 1051.92 336.60 186 1.8
6/23/2009 8.3 g KH + 5.0 g Mg + 20.0 g TiC + 15.45 g Mnl2(BLP SITE) Peter/Kevin
292.00 337.00 45.00 18.6 2.4
6/23/2009 8.3 g KH + 5.0 g Mg + 20.0 g TiC + 10.8 g FeBr2 (BLP SITE) Peter/Kevin
308.00 354.00 46.00 24.9 1.84
6/29/2009 8.3 g KH + 5.0 g Mg + 20.0 g TiC + 15.45 g Mnl2
252.74 299.63 46.89 18.6 2.52
6/30/2009 8.3 g KH + 5.0 g Mg + 20.0 g TiC + 15.45 g Mnl2
287.82 330.83 43.00 18.6 2.31
7/2/2009 8.3 g KH + 5.0 g Mg + 20.0 g TiC + 7.5 g InCl
243.94 266.98 23.04 11.5 2.0
7/3/2009 8.3 g KH + 5.0 g Mg + 20.0 g TiC + 7.5 g InCl
269.97 294.43 24.46 11.5 2.12
7/6/2009 8.3 g KH + 5.0 g Mg + 20.0 g TiC + 15.65 g CoI2
240.11 281.93 41.81 26.35 1.58
7/8/2009 8.3 g KH + 5.0 g Mg + 20.0 g AC + 7.2 g AgCl
487.24 521.41 34.17 14.52 2.35
7/9/2009 8.3 g KH + 5.0 g Mg + 20.0 g AC + 7.2 g AgCl
357.07 382.56 25.48 14.52 1.75
7/10/2009 5.0 g NaH + 5.0 g MgH2 + 20.0 g AC + 0.03 mole of SF6 Online
217.06 301.46 84.40 71 (0.03 mole SF6) 1.2
7/13/2009 5.0 g NaH + 5.0 g MgH2 + 20.0 g AC + 0.03 mole of SF6 Online
177.69 282.66 104.97 71 (0.03 mole SF6) 1.5
7/16/2009 8.3 g KH + 5.0 g Mg + 20.0 g TiC + 18.5 g SnI2
199.86 245.85 45.99 27.6 1.66
7/21/2009 7.47 g KH + 4.5 g Mg + 18.0 g TiC + 14.04 g EuBr2
321.17 361.77 40.60 6.16 6.5
7/23/2009 5.0 g NaH + 5.0 g Ca + 20.0 g AC + 15.45 g MnI2
336.56 388.61 52.05 29.5 1.76
7/24/2009 5.0 g NaH + 5.0 g Ca + 20.0 g AC + 15.45 g MnI2
346.88 398.29 51.41 29.5 1.74
7/25/2009 5.0 g NaH + 5.0 g MgH2 + 20.0 g AC + 0.03 mole of SF6 Online
252.77 349.29 96.53 71 (0.03 mole SF6) 1.37

Conclusion
The scientific investigations completed at Rowan University make it quite clear that there is a source of
heat being generated in these numerous chemical reactions that cannot be explained in the confines of
conventional modern chemistry. Dozens of calibrations on both the 5X and 50X calorimeter cells have
given our research team confidence that there is but a small error in the water flow calorimetry, (having
coupling efficiencies averaging above 98%). In all cases the heat gains observed are many multiples
greater than any potential inaccuracies of our measurement system. The chemical analyses completed
by RU chemists have been performed on all the heat runs reported herein for both 5X and 50X scale
reactions. These studies show repeatedly that the amount of heat generated in the reactions exceed
known conventional chemical reaction pathways. Many additional studies by the Department of
Chemistry indicate that an anomalous signature of a novel form of hydrogen (called “hydrino” by BLP)
has been observed during characterization of the products. In addition to the dozens of experiments
completed to date on BLP technology at the South Jersey Technology Park, several validation runs have
also been observed at BLP by Rowan University professors and students. From this plethora of data our
conclusion is that some novel reaction is causing large releases of excess energy as BLP contends. It is
the sincere hope of the research team at Rowan University that other research laboratories across the
world will find confidence from our results to begin reproducing these experiments for themselves.
This report has revealed BLP proprietary recipes that demonstrate consistent heat gains from what their
scientists state are the result of the formation of lower energy hydrogen. While this initial analysis is not
intended to conclusively validate BLP’s lower energy hydrogen hypothesis our conclusions clearly are
not in conflict with it. We encourage the scientific community to replicate our experiments and seek to
understand with us if there are any alternative explanations for these consistent experimental results.
This report (combined with others published in journals or on the web) provides sufficient detail to
enable a reasonably equipped research lab to immediately validate and critique our findings.

Appendix A – Chemistry Information
0
10
20
30
40
0 100 200 300 400 500 600
Temperature oC
TPD of TIC
TPD (temperature-program desorption) of TiC

0
0.5
1
1.5
2
2.5
3
0 2000 4000 6000 8000 1 104
Time (sec)
MnI2 trap dropped
Trapping gases from heated MnI2 using a cold trap and then dropping the trap to evaporate the condensed gas
by use of TPD (temperature-program desorption)
Table 5. Content of Condensable Gas from TPD of Starting Chemicals
Sample RT (oC) P (T) Volume (mL) Weight (g) N (mole) N (mole/g)
TiC 23.61 2.37 314.3 0.508 4.025E-05 7.923E-05
MnI2 23.4 1.5 314.3 0.54 2.549E-05 4.721E-05
0
0.4
0.8
1.2
1.6
2
2.4
2.8
0 1000 2000 3000 4000 5000 6000
Time (sec)
MnI 2 -Trap on
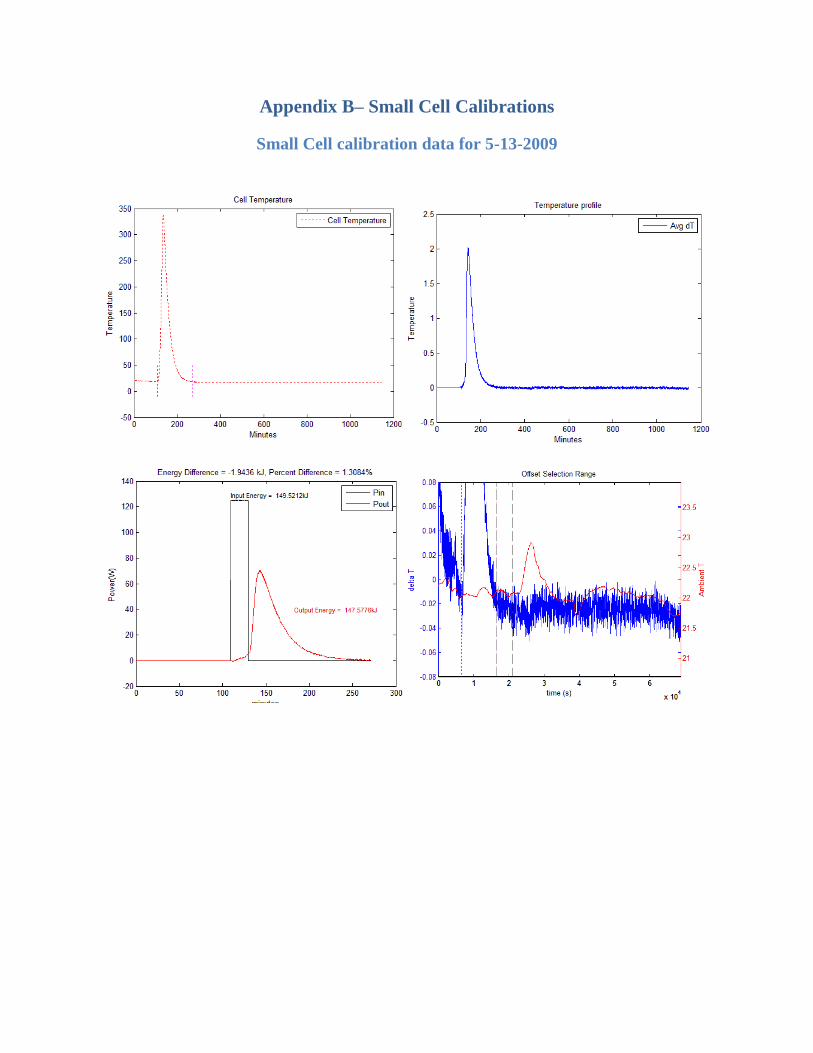
Appendix B– Small Cell Calibrations
Small Cell calibration data for 5-13-2009

Small Cell calibration data for 5-20-2009
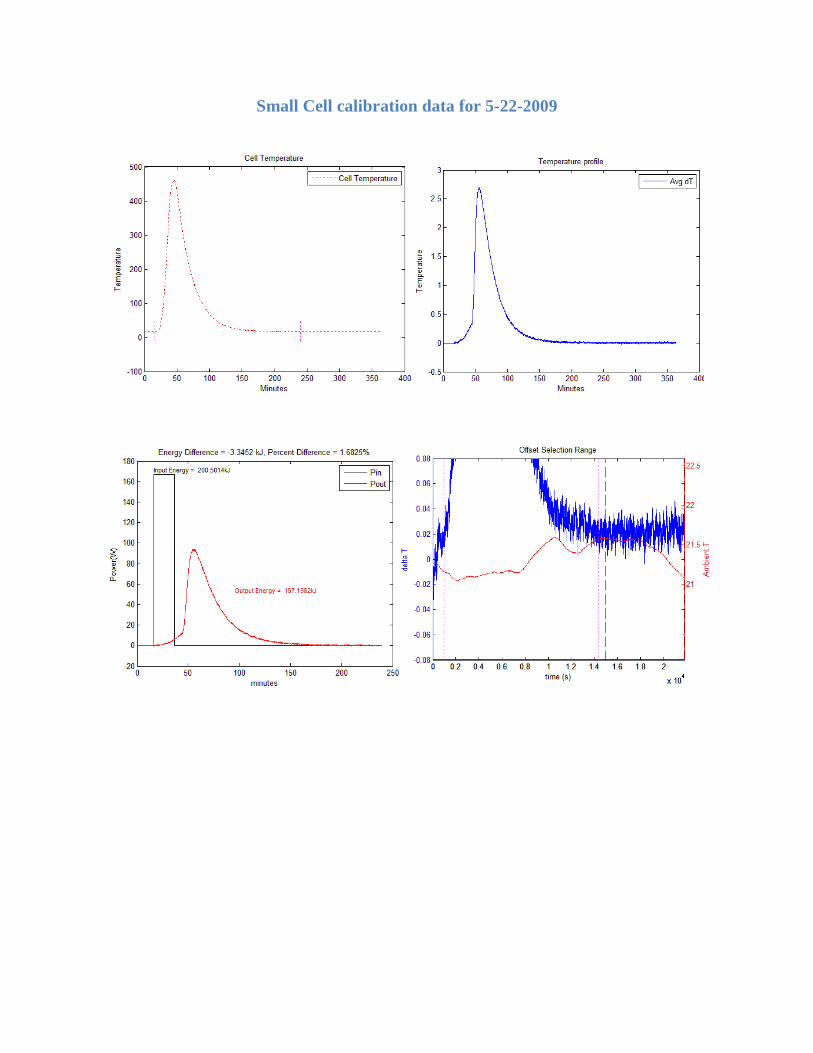
Small Cell calibration data for 5-22-2009

Small Cell calibration data for 5-26-2009
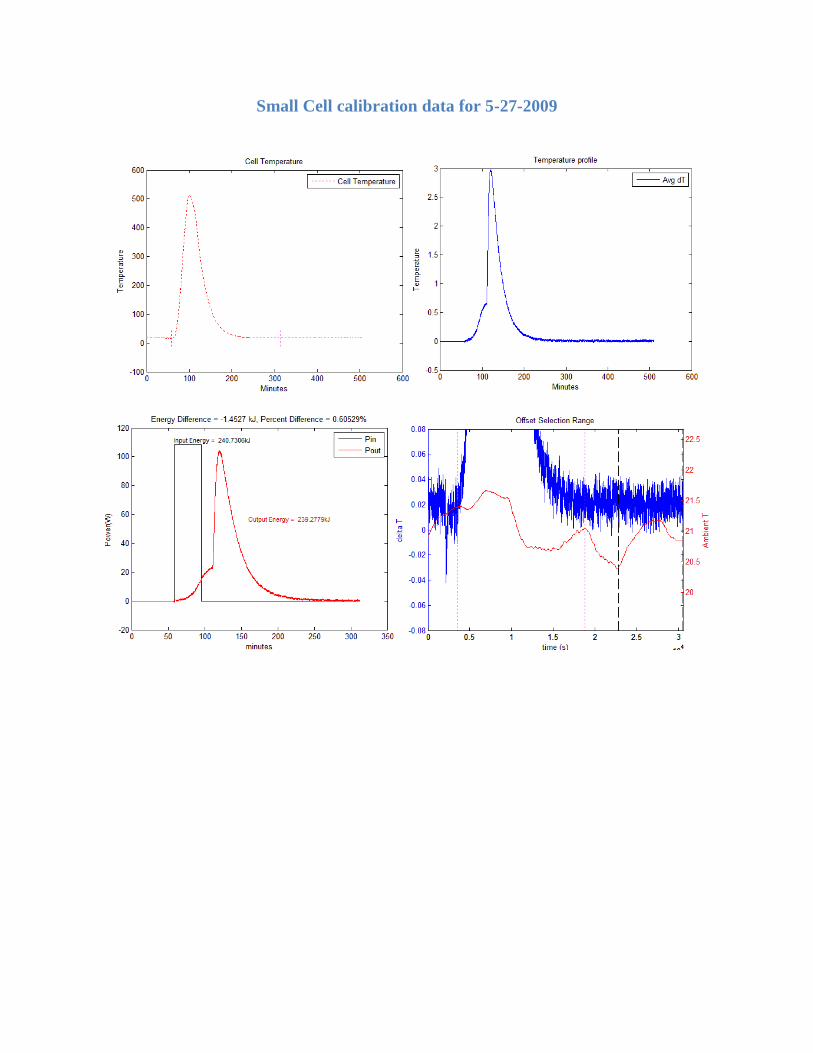
Small Cell calibration data for 5-27-2009

Small Cell calibration data for 5-28-2009
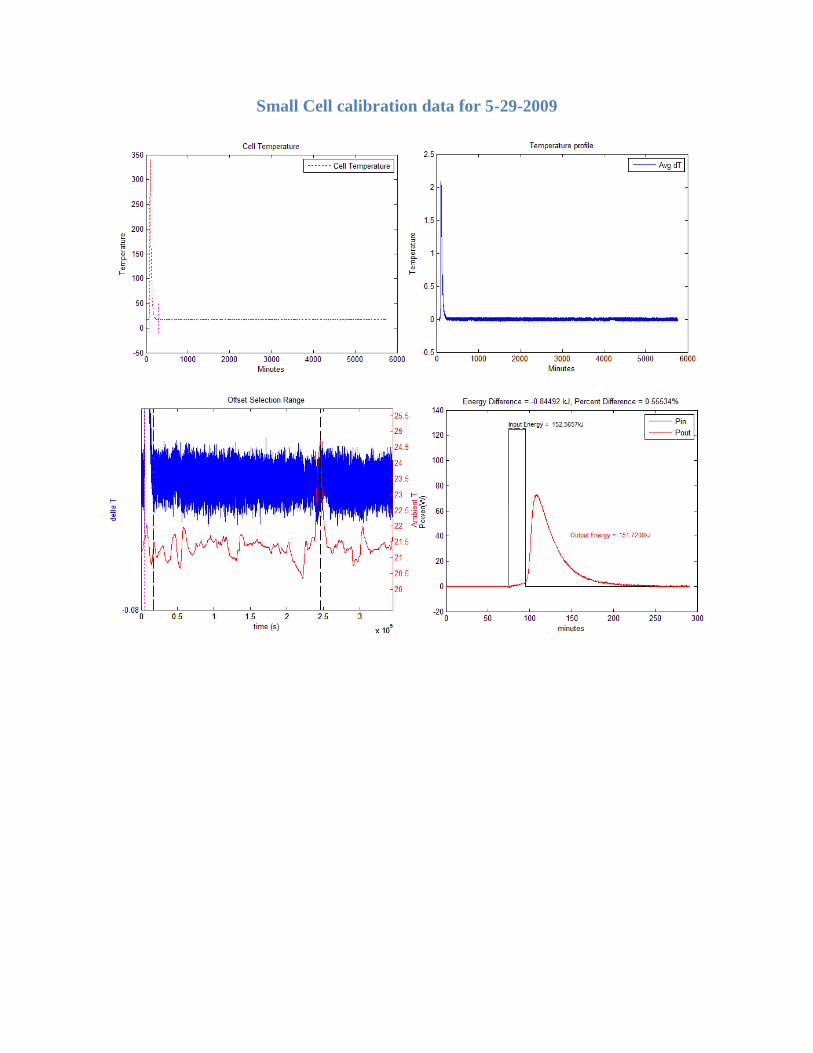
Small Cell calibration data for 5-29-2009

Small Cell calibration data for 6-2-2009

Small Cell calibration data for 6-28-2009

Small Cell calibration data for 7-1-2009

Small Cell calibration data for 7-5-2009

Small Cell calibration data for 7-14-2009

Small Cell calibration data for 7-15-2009

Small Cell calibration data for 7-20-2009
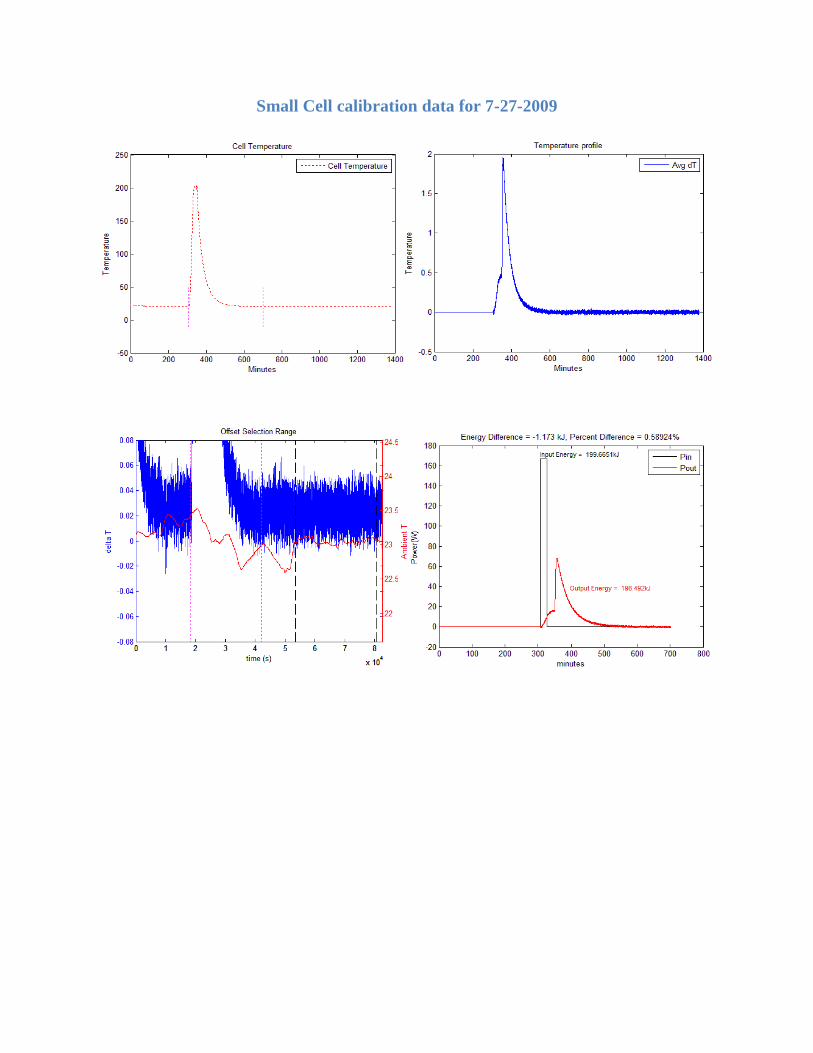
Small Cell calibration data for 7-27-2009

Small Cell calibration data for 7-28-2009

Appendix C – Large Cell Calibrations
Large Cell calibration data for 6-10-2009

Large Cell calibration data for 6-11-2009

Large Cell calibration data for 6-12-2009

Large Cell calibration data for 6-24-2009

Large Cell calibration data for 6-26-2009

Appendix D – Small Cell Heat Runs 6-23-09 Observed by Dr.Jansson & Kevin at BLP
FeBr2

MnI2

Small Cell heat run data for 6-29-2009

Small Cell heat run data for 6-30-2009

Small Cell heat run data for 7-2-2009
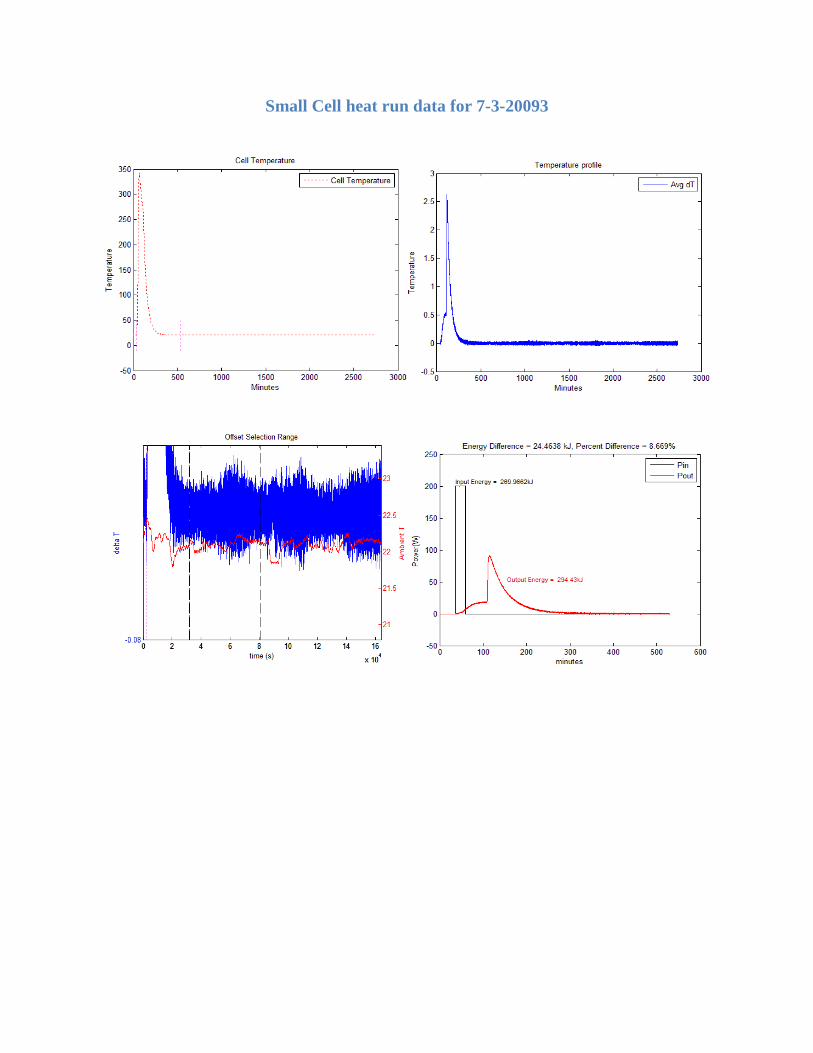
Small Cell heat run data for 7-3-20093

Small Cell heat run data for 7-6-2009

Small Cell heat run data for 7-8-2009

Small Cell heat run data for 7-9-2009

Small Cell heat run data for 7-10-2009
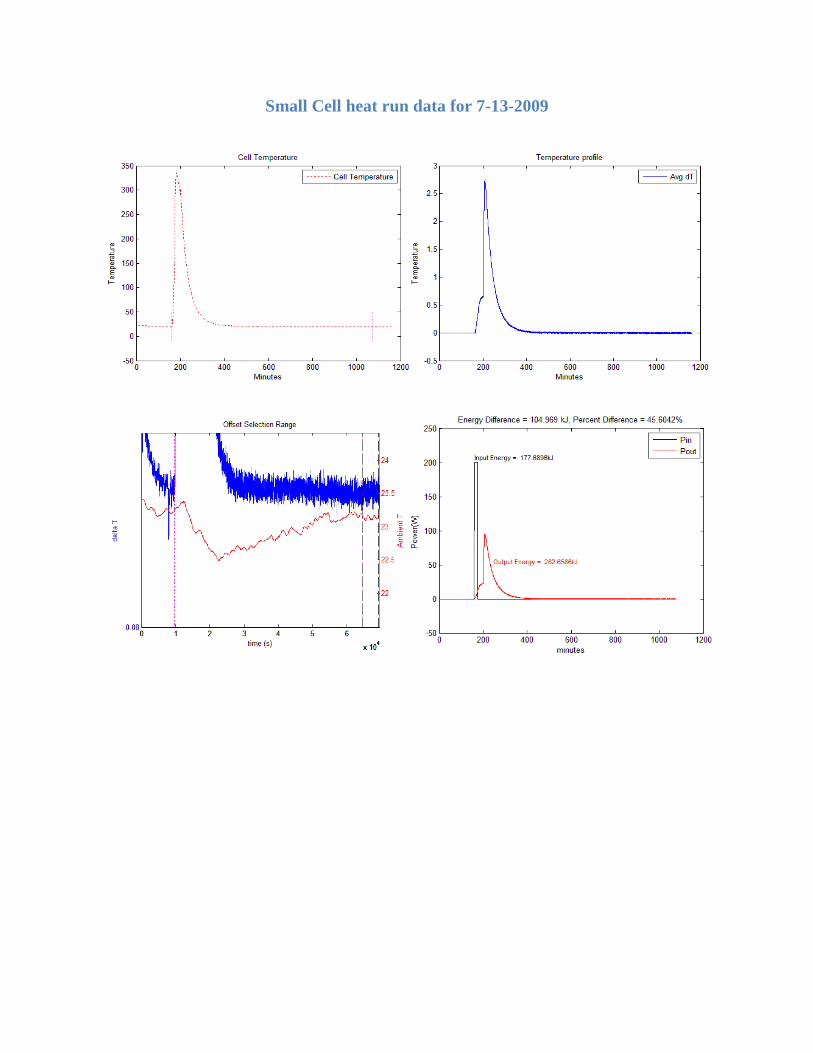
Small Cell heat run data for 7-13-2009

Small Cell heat run data for 7-16-2009

Small Cell heat run data for 7-21-2009
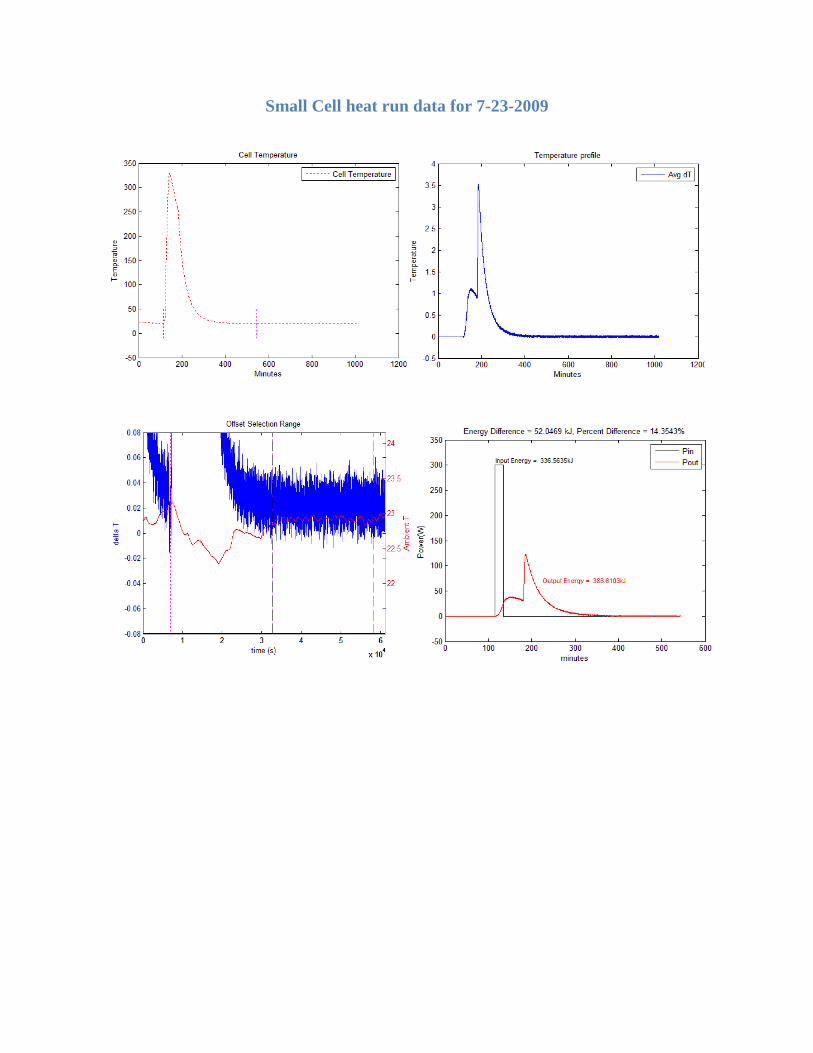
Small Cell heat run data for 7-23-2009
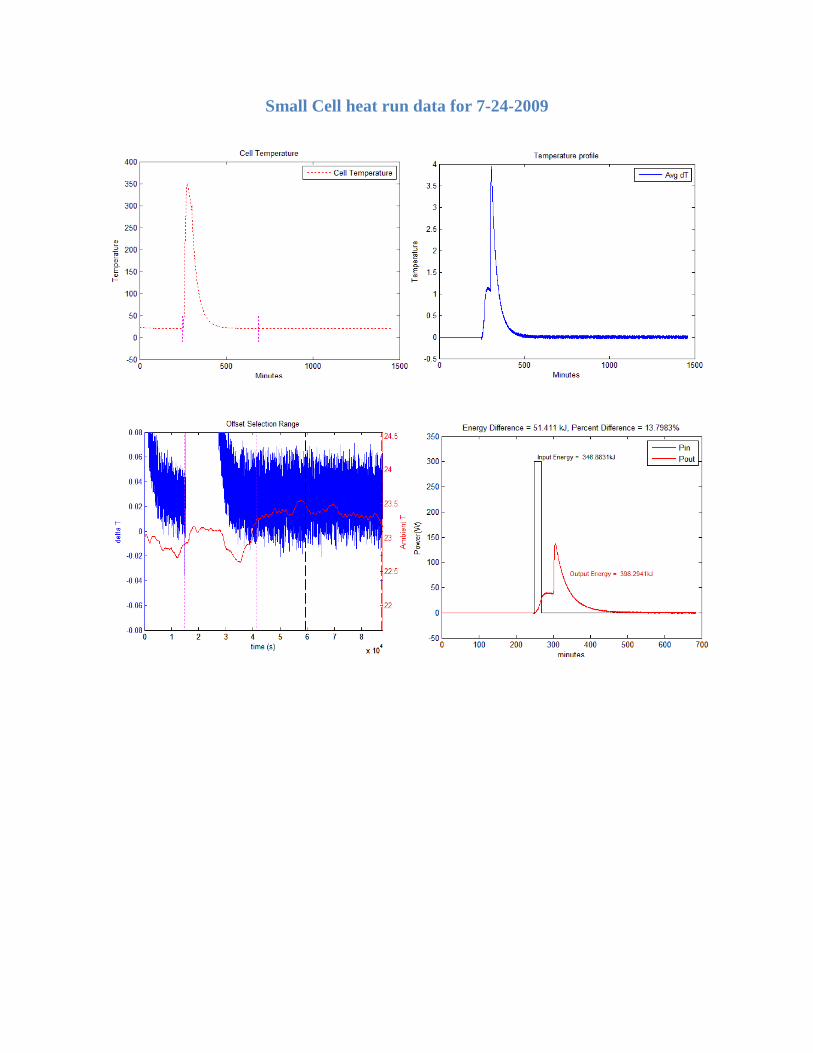
Small Cell heat run data for 7-24-2009

Small Cell heat run data for 7-25-2009

Appendix E – Large Cell Heat Runs
Large Cell heat run data for 6-18-2009

Water Flow Calorimetry, Experimental Runs and
Validation Testing for BlackLight Power Inc.
Performed at Rowan University Glassboro, New Jersey
January 2009 – May 2009
College of Engineering Departments of Electrical, Chemical and Mechanical Engineering
Prof. Peter Mark Jansson PP PE Ulrich K.W. Schwabe BSECE
Matthew Abdallah ChE Nathaniel Downes ECE
Patrick Hoffman ME
May 2009

Confidential and Proprietary Rowan University May 2009 1 1
Table of Contents
Executive Summary ............................................................................................................ 2
Rowan University Laboratory Setup .................................................................................. 2
Materials and Equipment ................................................................................................ 2
Calibration and Experimental Run Procedures ................................................................... 3
Results and Discussion ....................................................................................................... 4
Calibration Results .......................................................................................................... 4
Experimental Results ...................................................................................................... 6
Conclusions ......................................................................................................................... 9

Confidential and Proprietary Rowan University May 2009 2 2
Executive Summary
The company BlackLight Power (BLP) of Cranbury, NJ has been conducting
experiments on the heat generation from materials which demonstrate what they believe
is a proprietary process capable of relaxing the hydrogen atom below its normally
considered ground state. For some time now, teams of engineering professors and their
students at Rowan University have been involved in validating many of the heat
experiments performed by BlackLight Power in our own campus laboratory facilities.
The project described herein is the most recent continuation of previous calorimetry
experiments which were completed over the last few months with the assistance of
professors and students from the Chemistry and Biochemistry departments within the
University. The findings which will be highlighted in this report confirm the water flow
calorimeter can precisely and accurately measure heat from known chemical reactions.
The specific reactions examined were the thermal decomposition of ammonium nitrate
(NH4NO3) to form nitrogen, oxygen and water as well as the reaction of magnesium (Mg)
and iron oxide (Fe2O3) to form magnesium oxide (MgO). By completing these well
known, easily modeled reactions, it was possible to validate the calorimeter’s
performance when its reactants contained a known quantity of energy.
Rowan University Laboratory Setup
Materials and Equipment
The laboratory setup remained unchanged since the last report of our results, being based
around a water flow calorimeter containing a simple test cell. The test cell in which
chemical reactants are loaded is housed inside a vacuum chamber around which is
wrapped ¼” copper tubing. A water chiller in conjunction with a pump supplies a
constant flow of 20°C water to the vacuum chamber tubing. The test cell is surrounded
by an electric resistive heater that is powered by a Xantrex XDC 600-10 power supply. A
second precision power supply (HP) provides power and a reference voltage to the rest of
the instrumentation, such as various thermistors used in the process. Once a test and any
reaction inside the cell has completed, helium is introduced into the vacuum chamber to
allow for a faster cool-down cycle.
All measurements are recorded with the help of a simple LabView program. Time, cell
temperature, inlet and outlet water temperature, water flow rates were all recorded at 5s-
10 s interval. Data are then analyzed to calculate the input energy from DC heater and
the output energy from the water flow rate and change in inlet and outlet water
temperature using a program written in MatLab. Profiles of the change in water
temperature, cell temperature and comparing the input and output energies were plotted.
This work is done mostly with the help of a simple MATLAB program, which analyzes
the many data points and performs all the necessary calculations.

Confidential and Proprietary Rowan University May 2009 3 3
During the course of testing from January 2009 to May 2009, two different cell sizes
were used with the 1 kW BLP reactor for chemical control heat experiments. The first
was the traditional 1” diameter heavy duty cell used for small exothermic reactions, the
second being a new 2” diameter heavy-duty cell used for greater exothermic reactions
(Figure 1). As recommended by BLP, the 1” heavy duty cells were used for the
magnesium and iron-oxide thermite reaction, while the 2” heavy-duty cells were used for
decomposition ammonium nitrate experiment.
Figure 1: Showcasing the 1” (bottom) and 2” (top) heavy duty cell sizes
Calibration and Experimental Run Procedures
Before and after every test or calibration it is crucial to manually measure the water flow
rate to ensure it remains relatively constant throughout each run. The heater power supply
is briefly turned on with low limits to ensure proper and safe connection with the heater
circuit. All valves and lines for the helium and vacuum pump are checked for leaks, and
data is recorded until equilibrium of the cell temperature has been reached.
For all the chemical control heat experiments, the chemistry department procured
chemicals. The graduate students of the chemistry department in the presence of project
team carried out the chemical loading of the cell. In order to improve the conversion rate
of the reaction, magnesium and iron oxide were thoroughly mixed during the cell
loading.
For all runs, after thermal equilibrium of the cell temperature is reached, the vacuum
chamber is pumped down to below 10 mTorr, ensuring that almost none of the supplied
and generated heat is released to the calorimeter during the cell heating stage. Once the
desired vacuum in the chamber is reached, varying methods of heating are applied

Confidential and Proprietary Rowan University May 2009 4 4
depending on the type of run to be completed. During a calibration run a predetermined
amount of energy is supplied to the heater core, which will subsequently be compared to
the energy (in terms of heat) measured by the calorimeter. A heat run is completed in
almost the same fashion, with the exception that the input energy necessary to start the
reaction is unknown. This input energy is recorded as the output voltage and current of
the power supply, along with the output energy (again in terms of output heat) measured
by the calorimeter. For all types of runs these input and output measurements are
compared, providing the researcher with an accurate account of the accuracy of the
calorimeter, and the energy produced by the reaction in the cell. The cool-down process,
consisting of the infusion of helium into the vacated chamber, speeds up the process of
recovering the generated heat, while also reducing observed losses.
Results and Discussion
Calibration Results
A total of 15 successful calibration runs were completed during the spring 2009 semester.
Calibration runs were performed frequently between heat runs to ensure energy coupling
efficiency of the calorimeter ranged in the high 98-99% . Table 1 gives the data for these
calibrations, all of which having a high coupling efficiency. Figures 2, 3 and 4 below
represent the energy profile, cell temperature and delta temperature respectively for a
calibration run with an input energy of 120 kJ.
Table 1: Data recorded from calibration runs
Run Date Input Output (kJ) ∆kJ % Difference Coupling
1 1/21/2009 150.57 152.43 1.86 1.23 1.012
2 1/27/2009 120.16 119.75 -0.41 0.34 0.997
3 1/29/2009 200.72 200.30 -0.42 0.21 0.998
4 1/30/2009 150.32 148.37 -1.95 1.31 0.987
5 2/2/2009 180.22 179.06 -1.16 0.65 0.994
6 2/5/2009 200.21 199.93 -0.27 0.14 0.999
7 2/6/2009 94.03 94.72 0.70 0.74 1.007
8 2/9/2009 120.41 121.53 1.13 0.93 1.009
9 2/10/2009 149.96 152.49 2.53 1.67 1.017
10 2/13/2009 150.32 152.41 2.09 1.38 1.014
11 2/24/2009 49.67 49.99 0.33 0.52 1.007
12 2/27/2009 99.59 99.42 -0.18 0.18 0.998
13 3/23/2009 99.91 99.80 -0.11 0.11 0.999
14 4/7/2009 198.63 194.76 -3.87 1.97 0.981
15 4/16/2009 109.87 109.42 -0.46 0.42 0.996
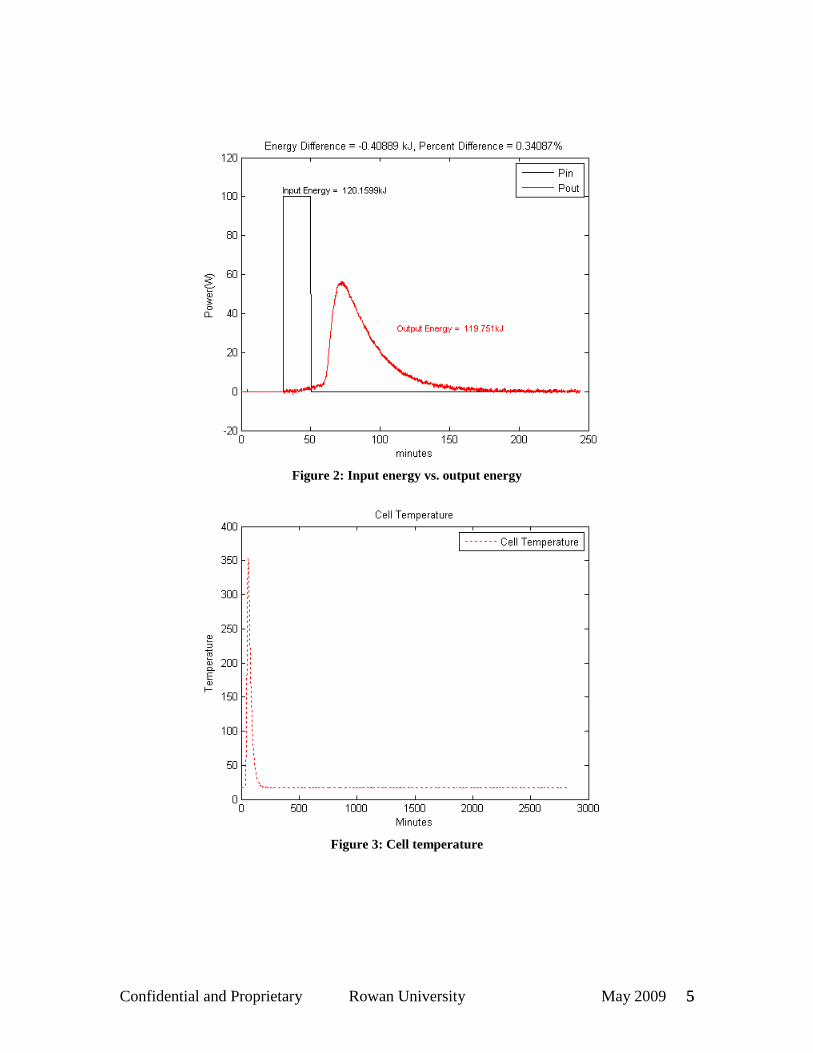
Confidential and Proprietary Rowan University May 2009 5 5
Figure 2: Input energy vs. output energy
Figure 3: Cell temperature

Confidential and Proprietary Rowan University May 2009 6 6
Figure 4: Change in Water Coolant Temperature
It is important to note the difference in the time-span of these figures. When calculating
the output of a given run, the equipment is allowed to cool down for several hours. This
is crucial in determining the offset due to thermocouple inconsistencies, later to be added
or subtracted from the all data. The cool-down period is not incorporated into the final
projections for output energy, as its value consists only of environmental factors such as
ambient temperatures. Figure 2 represents the entire span used in the calculation of output
energy, whereas Figures 3 and 4 plot the entire set of recorded data.
Experimental Results
Example results from control heat runs, three using the reactants Mg and Fe2O3 and one
using the reactant NH4NO3 are listed in Table 2. Figure 5, 6 and 7 represent the energy
profile, cell temperature, and change in water temperature recorded during run 3, the
second control heat run with Mg and Fe2O3.
Table 2: Recorded Heat run data for MgFe2O3 and NH4NO3
Run Date Chemicals Cell Size Input (kJ) Output (kJ) ∆kJ Theoretical
1 3/12/2009 NH4NO3 2" 443.95 481.65 37.691 41.2
2 4/9/2009 MgFe2O3 1" 240.62 271.83 31.70 32.75
3 4/12/2009 MgFe2O3 1" 227.51 256.46 28.95 32.75
4 4/22/2009 MgFe2O3 1" 177.83 210.21 32.37 32.75

Confidential and Proprietary Rowan University May 2009 7 7
Figure 5: Heat run energy profile of Magnesium Iron Oxide on 4/9/09
Figure 6: Cell temperature profile of heat run for MgFe2O3 on 4/9/09

Confidential and Proprietary Rowan University May 2009 8 8
Figure 7: Change in water coolant temperature of heat run for MgFe2O3 on 4/9/09
Background calculations
Two exothermic reactions were considered for testing in the experimental calorimeter set
up as chemical control heat runs. The reactions were (1) thermal decomposition of
ammonium nitrate (NH4NO3) and (2) the reaction of iron oxide (Fe2O3) and magnesium
(Mg). The theoretical heats of reaction provided below are under an assumption of
complete conversion.
2𝑁𝐻4𝑁𝑂3 → 2𝑁2 + 𝑂2 + 4𝐻2𝑂 (1)
𝐹𝑒2𝑂3 + 3𝑀𝑔 → 3𝑀𝑔𝑂 + 2𝐹𝑒 (2)
Reaction 1 is highly exothermic, ΔHrxn=-412 kJ/mol, and occurs at temperatures above
300°C. However, there is a side reaction that occurs during the thermal decomposition of
ammonium nitrate.
NH4NO3 N2O + 2H2O
The side reaction is favored at lower temperatures (200-250°C) and constitutes a net heat
of reaction of -124.4kJ/mol. Therefore, this reaction is only a minor part of the overall
mechanism and can be avoided by heating cell to a temperature where reaction 1 would
be dominant. The second reaction used for the experimental procedure was the reduction
of iron oxide by magnesium. Reaction 2 is also an exothermic reaction with a ΔHrxn=-
980.6 kJ/mol. No significant side reactions were found for this process.
The quantities of reactants used by the team for heat runs during the semester were
identical to those used by BLP in the supplemental materials provided. Reaction 1

Confidential and Proprietary Rowan University May 2009 9 9
required 16 g of ammonium nitrate, which yielded a theoretical energy output of 41.2 kJ.
The quantities of reactants used for reaction 2 were 5.34 g and 2.43 g of iron (III) oxide
and magnesium respectively. The energy released by reaction 2, using reactant quantities
above, was calculated to be 32.75 kJ. These calculations represent the maximum
theoretical amount of energy being generated. In order to ensure the completion of the
reaction, chemical cells were heated to a significantly higher temperature. Still full
completion of the reaction is very difficult to achieve and this is evident from the
calorimetric measurements which are off by a few kJ.
Conclusions
From the experimental results obtained, it can be concluded that the calorimeter system is
both accurate and precise at measuring the heat evolved from a thermal decomposition of
known reactants. The accuracy of the calorimeter was established with heater calibration
runs, since DC current and voltage measurements and hence input power and energy
measurement can be performed more accurately than chemical reactions. It was possible
to provide a measure of the calorimeter accuracy using the energy generated by a known
chemical reaction. All in all, the calibration runs proved that the calorimeter is accurate
within one percent of the power input by a resistive heater, and the chemical control heat
runs gave strong indication that there are no significant differences between heat loss
mechanisms. The Rowan University team is confident that the calorimeter is very
accurate, and will continue to complete calibration, control and heat runs to verify
BlackLight Power’s claims.


![INDEX [] · Web viewAGREEMENT between THE STATE OF NEW JERSEY / ROWAN UNIVERSITY and THE COMMITTEE OF INTERNS AND RESIDENTS November 1, 2012 – October 31, 2016 INDEX ARTICLE TIT](https://img.dokumen.tips/doc/110x75/5ae05a6e7f8b9a6e5c8d45be/index-viewagreement-between-the-state-of-new-jersey-rowan-university-and-the.jpg)