Embed Size (px)
Citation preview
Industrial Research Limited Report
Rotorua Geothermal Reservoir Modelling 2006:
Heat Exchanger Scenarios and Exclusion Zone Assessment
Final Report
John Burnell
For Environment Bay of Plenty
Industrial Research Limited Lower Hutt July 2007

Heat Exchanger Scenario Modelling July 2007 1
Contents
1. Executive Summary _________________________________________________________2
2. Introduction _______________________________________________________________3
2.1 Energy Demands _______________________________________________________3
2.2 Uptake Rates __________________________________________________________4
3. Usage Scenarios ____________________________________________________________4
3.1 Scenario Details ________________________________________________________4
3.2 Implementation in the Model_____________________________________________8
4. Results___________________________________________________________________12
4.1 Discussion____________________________________________________________12
5. Conclusions ______________________________________________________________15
6. References _______________________________________________________________16
Appendix A: EBOP Briefing Document ____________________________________________17
List of Figures
Figure 1: Grid used for the computational model. The coordinates refer to map coordinates with
(2,000, 0) on the diagram corresponding to (2790,000N, 6332,000E) in map
coordinates. The blue lines are local roads, streams and the lakefront, and the red line
approximately shows the 1.5km exclusion zone. _____________________________10
Figure 2: Regions where downhole heat exchangers were added to the model_______________10
Figure 3: Locations of wells used to simulate the new downhole heat exchangers on the model
grid. _______________________________________________________________11
Figure 4: Location of new shallow production and reinjection within the 1.5km Exclusion Zone
used in Scenarios 19 to 23. Red rectangles indicate production and blue rectangles
indicate reinjection. ___________________________________________________11
Figure 5: Percentage reduction in outflow at Whakarewarewa for all the scenarios. The
percentage is calculated from the recovery to the bore closure of 1986, see the text for
details. _____________________________________________________________14
Figure 6: Percentage reduction in outflow at Kuirau Park for all the scenarios. The percentage is
calculated from the recovery to the bore closure of 1986, see the text for details. ___14
Figure 7: Percentage reduction in steam under Whakarewarewa for all the scenarios. The
percentage is calculated from the recovery to the bore closure of 1986, see the text for
details. _____________________________________________________________15

Heat Exchanger Scenario Modelling July 2007 2
1. Executive Summary
In 2005 the computational reservoir model for the Rotorua geothermal field was updated and a
series of usage scenarios was run using the model to test the effects on natural features of the field.
Further scenarios looking at increased downhole heat exchanger use were developed in 2006,
resulting in a preliminary report Burnell (2006). In this report the Rotorua Geothermal Reservoir
Model was used to assess the impact of 30 further scenarios on geothermal surface activity. The
scenarios are a refinement of the 2006 scenarios and are designed to test if there is capacity for
increased heat exchanger use across the field outside the 1.5 exclusion zone whilst protecting
surface features. Some of the scenarios also included an increase in production from shallow levels
in the 1.5km exclusion zone.
The scenarios were prepared by Environment Bay of Plenty Staff and were implemented in the
2004 version of the Rotorua Geothermal Reservoir Model. The scenarios were based on estimates
of the possible uptake of downhole heat exchangers and energy demand. These scenarios were
called “realistic use” scenarios and resulted in an increase in total heat extracted from the field by
32%. To test a range of scenarios, high and low use scenarios were also constructed. Impacts on
the field from the increased use in these scenarios after 30 years included:
• The “low use” scenarios indicated an impact on the outflow at Kuirau Park, of about 6%
and the “realistic use” scenarios had an impact about 11%.
• The “realistic use” scenarios equates to an increase of 106 heat exchanger systems in the
northern area of the field, and 63 in the 1.5 km Exclusion Zone, with half these numbers of
systems included in the “low use” scenarios.
• The high use scenarios were found to have a significant impact on geothermal outflow at
Kuirau Park.
• The impact on Whakarewarewa was found to be small for all scenarios tested,
• Small increases in production from shallow depths of around 50m in the 1.5 km Exclusion
Zone showed a negligible impact on geothermal outflows at Whakarewarewa and Kuirau
Park.
Heat Exchanger Scenario Modelling July 2007 3
2. Introduction
This report follows two reports in 2005 and a preliminary report in 2007 that described the results
of computational modelling of the Rotorua Geothermal System. All reports were commissioned by
Environment Bay of Plenty to support the review of the Rotorua geothermal management plan.
The two reports in 2005 (Burnell and Kissling (2005) and Burnell (2005)) describe the
computational model of the Rotorua geothermal field and consider the effects of 19 scenarios for
possible future production from the field.
In 2006, further work was commissioned to consider further scenarios for future production,
concentrating on the use of downhole heat exchangers. A preliminary report was produced in May
Burnell (2006) which considered 12 scenarios of future downhole heat exchanger use. To develop
these scenarios, estimates were made of heat exchanger uptake rates and energy demands. After
consultation with Environment Bay of Plenty Staff, it was decided to refine these uptake rates and
energy demands based on more robust information and to consider some new scenarios regarding
downhole heat exchanger use in the 1.5 km Exclusion Zone. This resulted in the development of a
further 30 scenarios on future downhole heat exchanger use, which are the subject of this report.
The 30 scenarios considered in this report were prepared by Environment Bay of Plenty Staff, and
are discussed in a briefing document which is attached as Appendix A of this report. They involve
the use of downhole heat exchangers in three categories: “realistic use”, “low use” and “high use”.
• “Realistic use” was estimated using energy demands from various different types of
properties together with uptake rates of new downhole heat exchangers.
• “Low use” would mean half “realistic use”.
• “High use” would mean twice “realistic use”.
2.1 Energy Demands
The energy demands for realistic use scenarios for different types of properties, based on Rotorua
District Plan zoning, are discussed in the brief in Appendix A. The energy demands for each
property zone type are summarised below.
Property Zone Type Energy Demand
Residential 20 kW for 24 hours per day over 8 months per year together with
2 kW for 24 hours per day over 4 months per year
Commercial 40 kW for 24 hours per day over 8 months per year
Industrial 100 kW for 24 hours per day for the full year
Resort 100 kW for 24 hours per day over 8 months per year together with
60 kW for 24 hours per day over 4 months per year
Heat Exchanger Scenario Modelling July 2007 4
2.2 Uptake Rates
Property Type Uptake Rates
Residential 1 in 20 residential properties within the geothermal field boundaries
Commercial 1 in 20 commercial properties within the geothermal field boundaries
Industrial 1 in 40 industrial properties within the geothermal field boundaries
Resort 1 in 10 resort properties within the 1.5 km Exclusion Zone
1 in 20 resort properties outside the 1.5 km Exclusion Zone
These uptake rates were applied to the property database to obtain the number of properties which
were likely to install downhole heat exchangers. This is a further change from the 2006
preliminary report, in that the latest property or cadastral database information combined with the
Rotorua District Council Planning scheme was available as a GIS layer for this purpose.
A further variation used in the scenarios was to consider increased downhole exchanger use in
conjunction with shallow production added to the region inside the 1.5 km Exclusion Zone. There
are currently a few existing production takes within the 1.5 km exclusion zone that take fluid from
the shallow heated groundwater which were excluded from the 1986 closure because they are less
than 61m and 70ºC. The purpose of adding this production to the scenarios is to test if producing
from these shallow depths has an impact on the thermal features.
3. Usage Scenarios
The scenarios were constructed by adding new production and reinjection to the computational
model of the Rotorua Geothermal System described in the report by Burnell and Kissling (2005).
This model provides a good match to the changes seen in the geothermal system since the Bore
Closure Programme of 1986-7. Details of the model and the match to the data are given in that
report.
3.1 Scenario Details
The scenarios considered here were developed with Environment Bay of Plenty staff to test if there
is an opportunity to provide for increased use of heat and/or mass from the field whilst protecting
the field’s surface features. The scenarios can be broken into 10 groups, the scenario numbers
continue from the report Burnell (2006).
Scenario Description
Scenario 14 Group This is a rerun of the Scenario 10 Group using the latest property database
data, heat demand and uptake probabilities. It adds new heat exchanger use
from shallow depths (50m) outside the 1.5km Exclusion Zone.
Scenario 15 Group New heat exchanger use within the 1.5 km Exclusion Zone from shallow
depths (50 m).
Scenario 16 Group New heat exchanger use within the 1.5 km Exclusion Zone from 125m
depth.
Scenario 17 Group A combination of Scenarios 14 and 15. New heat exchanger use within the
1.5 km Exclusion Zone from shallow depths (50 m), together with new heat
exchanger use from shallow depths (50m) outside the 1.5km Exclusion Zone

Heat Exchanger Scenario Modelling July 2007 5
Scenario 18 Group A combination of Scenarios 14 and 16. New heat exchanger use within the
1.5 km Exclusion Zone from 125m depth, together with new heat exchanger
use from shallow depths (50m) outside the 1.5km Exclusion Zone.
Scenario 19 Group Increased production from within the1.5 km Exclusion Zone of 50, 250, 500
tonnes/day from shallow depths (50m).
Scenario 20 Group A combination of Scenarios 17 and 19. Increased production from within
the1.5 km Exclusion Zone of 250 tonnes/day from shallow depths (50m),
together with new heat exchanger use within the 1.5 km Exclusion Zone
from shallow depths (50 m), and new heat exchanger use from shallow
depths (50m) outside the 1.5km Exclusion Zone.
Scenario 21 Group A combination of Scenarios 18 and 19. Increased production from within
the1.5 km Exclusion Zone of 250 tonnes/day from shallow depths (50m),
together with new heat exchanger use within the 1.5 km Exclusion Zone
from 125m depth, and new heat exchanger use from shallow depths (50m)
outside the 1.5km Exclusion Zone.
Scenario 22 Group A combination of Scenarios 17 and 19. Increased production from within
the1.5 km Exclusion Zone of 500 tonnes/day from shallow depths (50m),
together with new heat exchanger use within the 1.5 km Exclusion Zone
from shallow depths (50 m), and new heat exchanger use from shallow
depths (50m) outside the 1.5km Exclusion Zone.
Scenario 23 Group A combination of Scenarios 18 and 19. Increased production from within
the1.5 km Exclusion Zone of 500 tonnes/day from shallow depths (50m),
together with new heat exchanger use within the 1.5 km Exclusion Zone
from 125m depth, and new heat exchanger use from shallow depths (50m)
outside the 1.5km Exclusion Zone.
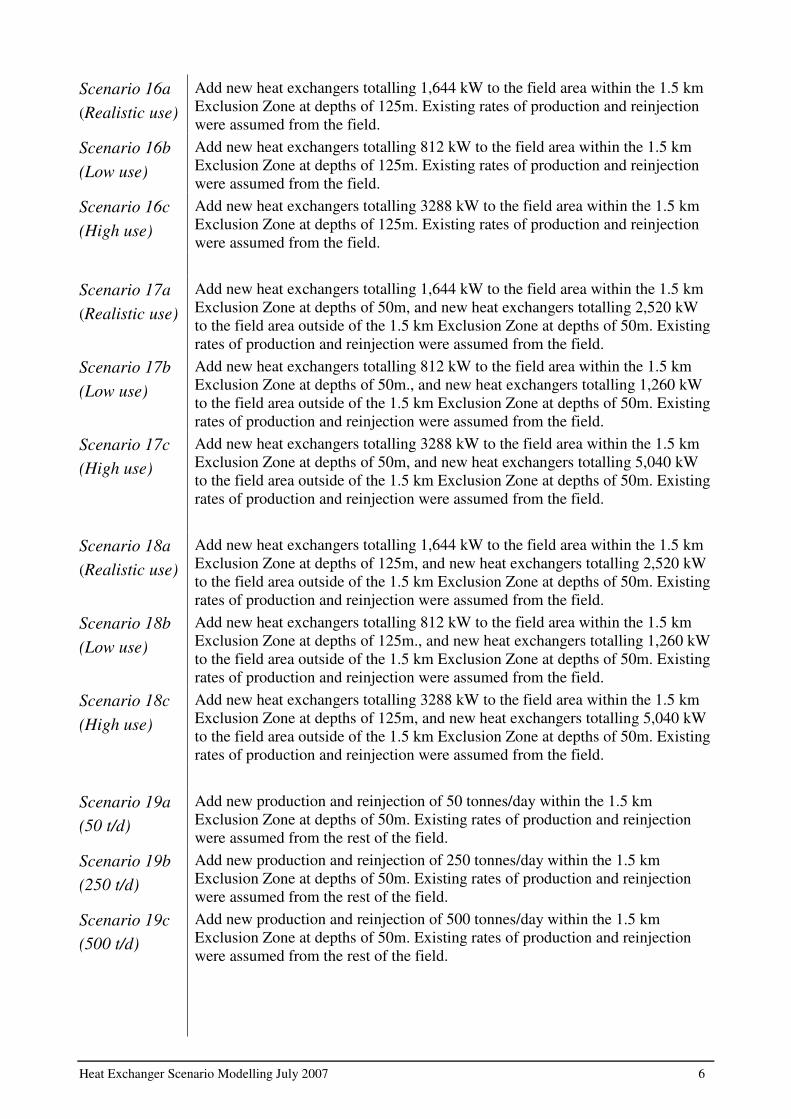
Within each group there are a three of sub-scenarios with realistic, low and high heat exchanger
use (except for Scenario 19, which has 3 production rates). The details of all 30 scenarios are:
Scenario 14a
(Realistic use)
Add new heat exchangers totalling 2,520 kW to the field area outside of the 1.5
km Exclusion Zone at depths of 50m. Existing rates of production and
reinjection were assumed from the field.
Scenario 14b
(Low use)
Add new heat exchangers totalling 1,260 kW to the field area outside of the 1.5
km Exclusion Zone at depths of 50m. Existing rates of production and
reinjection were assumed from the field.
Scenario 14c
(High use)
Add new heat exchangers totalling 5,040 kW to the field area outside of the 1.5
km Exclusion Zone at depths of 50m. Existing rates of production and
reinjection were assumed from the field.
Scenario 15a
(Realistic use)
Add new heat exchangers totalling 1,644 kW to the field area within the 1.5 km
Exclusion Zone at depths of 50m. Existing rates of production and reinjection
were assumed from the field.
Scenario 15b
(Low use)
Add new heat exchangers totalling 812 kW to the field area within the 1.5 km
Exclusion Zone at depths of 50m. Existing rates of production and reinjection
were assumed from the field.
Scenario 15c
(High use)
Add new heat exchangers totalling 3288 kW to the field area within the 1.5 km
Exclusion Zone at depths of 50m. Existing rates of production and reinjection
were assumed from the field.
Heat Exchanger Scenario Modelling July 2007 6
Scenario 16a
(Realistic use)
Add new heat exchangers totalling 1,644 kW to the field area within the 1.5 km
Exclusion Zone at depths of 125m. Existing rates of production and reinjection
were assumed from the field.
Scenario 16b
(Low use)
Add new heat exchangers totalling 812 kW to the field area within the 1.5 km
Exclusion Zone at depths of 125m. Existing rates of production and reinjection
were assumed from the field.
Scenario 16c
(High use)
Add new heat exchangers totalling 3288 kW to the field area within the 1.5 km
Exclusion Zone at depths of 125m. Existing rates of production and reinjection
were assumed from the field.
Scenario 17a
(Realistic use)
Add new heat exchangers totalling 1,644 kW to the field area within the 1.5 km
Exclusion Zone at depths of 50m, and new heat exchangers totalling 2,520 kW
to the field area outside of the 1.5 km Exclusion Zone at depths of 50m. Existing
rates of production and reinjection were assumed from the field.
Scenario 17b
(Low use)
Add new heat exchangers totalling 812 kW to the field area within the 1.5 km
Exclusion Zone at depths of 50m., and new heat exchangers totalling 1,260 kW
to the field area outside of the 1.5 km Exclusion Zone at depths of 50m. Existing
rates of production and reinjection were assumed from the field.
Scenario 17c
(High use)
Add new heat exchangers totalling 3288 kW to the field area within the 1.5 km
Exclusion Zone at depths of 50m, and new heat exchangers totalling 5,040 kW
to the field area outside of the 1.5 km Exclusion Zone at depths of 50m. Existing
rates of production and reinjection were assumed from the field.
Scenario 18a
(Realistic use)
Add new heat exchangers totalling 1,644 kW to the field area within the 1.5 km
Exclusion Zone at depths of 125m, and new heat exchangers totalling 2,520 kW
to the field area outside of the 1.5 km Exclusion Zone at depths of 50m. Existing
rates of production and reinjection were assumed from the field.
Scenario 18b
(Low use)
Add new heat exchangers totalling 812 kW to the field area within the 1.5 km
Exclusion Zone at depths of 125m., and new heat exchangers totalling 1,260 kW
to the field area outside of the 1.5 km Exclusion Zone at depths of 50m. Existing
rates of production and reinjection were assumed from the field.
Scenario 18c
(High use)
Add new heat exchangers totalling 3288 kW to the field area within the 1.5 km
Exclusion Zone at depths of 125m, and new heat exchangers totalling 5,040 kW
to the field area outside of the 1.5 km Exclusion Zone at depths of 50m. Existing
rates of production and reinjection were assumed from the field.
Scenario 19a
(50 t/d)
Add new production and reinjection of 50 tonnes/day within the 1.5 km
Exclusion Zone at depths of 50m. Existing rates of production and reinjection
were assumed from the rest of the field.
Scenario 19b
(250 t/d)
Add new production and reinjection of 250 tonnes/day within the 1.5 km
Exclusion Zone at depths of 50m. Existing rates of production and reinjection
were assumed from the rest of the field.
Scenario 19c
(500 t/d)
Add new production and reinjection of 500 tonnes/day within the 1.5 km
Exclusion Zone at depths of 50m. Existing rates of production and reinjection
were assumed from the rest of the field.

Heat Exchanger Scenario Modelling July 2007 7
Scenario 20a
(Realistic use)
Add new heat exchangers totalling 1,644 kW to the field area within the 1.5 km
Exclusion Zone at depths of 50m; new heat exchangers totalling 2,520 kW to the
field area outside of the 1.5 km Exclusion Zone at depths of 50m; and new
production and reinjection of 250 tonnes/day within the 1.5 km Exclusion Zone
at depths of 50m. Existing rates of production and reinjection were assumed
from the rest of the field.
Scenario 20b
(Low use)
Add new heat exchangers totalling 812 kW to the field area within the 1.5 km
Exclusion Zone at depths of 50m; new heat exchangers totalling 1,260 kW to the
field area outside of the 1.5 km Exclusion Zone at depths of 50m; and new
production and reinjection of 250 tonnes/day within the 1.5 km Exclusion Zone
at depths of 50m. Existing rates of production and reinjection were assumed
from the rest of the field.
Scenario 20c
(High use)
Add new heat exchangers totalling 3288 kW to the field area within the 1.5 km
Exclusion Zone at depths of 50m; new heat exchangers totalling 5,040 kW to the
field area outside of the 1.5 km Exclusion Zone at depths of 50m; and new
production and reinjection of 250 tonnes/day within the 1.5 km Exclusion Zone
at depths of 50m. Existing rates of production and reinjection were assumed
from the rest of the field.
Scenario 21a
(Realistic use)
Add new heat exchangers totalling 1,644 kW to the field area within the 1.5 km
Exclusion Zone at depths of 125m; new heat exchangers totalling 2,520 kW to
the field area outside of the 1.5 km Exclusion Zone at depths of 50m; and new
production and reinjection of 250 tonnes/day within the 1.5 km Exclusion Zone
at depths of 50m. Existing rates of production and reinjection were assumed
from the rest of the field.
Scenario 21b
(Low use)
Add new heat exchangers totalling 812 kW to the field area within the 1.5 km
Exclusion Zone at depths of 125m; new heat exchangers totalling 1,260 kW to
the field area outside of the 1.5 km Exclusion Zone at depths of 50m; and new
production and reinjection of 250 tonnes/day within the 1.5 km Exclusion Zone
at depths of 50m. Existing rates of production and reinjection were assumed
from the rest of the field.
Scenario 21c
(High use)
Add new heat exchangers totalling 3288 kW to the field area within the 1.5 km
Exclusion Zone at depths of 125m; new heat exchangers totalling 5,040 kW to
the field area outside of the 1.5 km Exclusion Zone at depths of 50m; and new
production and reinjection of 250 tonnes/day within the 1.5 km Exclusion Zone
at depths of 50m. Existing rates of production and reinjection were assumed
from the rest of the field.
Scenario 22a
(Realistic use)
Add new heat exchangers totalling 1,644 kW to the field area within the 1.5 km
Exclusion Zone at depths of 50m; new heat exchangers totalling 2,520 kW to the
field area outside of the 1.5 km Exclusion Zone at depths of 50m; and new
production and reinjection of 500 tonnes/day within the 1.5 km Exclusion Zone
at depths of 50m. Existing rates of production and reinjection were assumed
from the rest of the field.
Scenario 22b
(Low use)
Add new heat exchangers totalling 812 kW to the field area within the 1.5 km
Exclusion Zone at depths of 50m; new heat exchangers totalling 1,260 kW to the
field area outside of the 1.5 km Exclusion Zone at depths of 50m; and new
production and reinjection of 500 tonnes/day within the 1.5 km Exclusion Zone
at depths of 50m. Existing rates of production and reinjection were assumed
from the rest of the field.
Heat Exchanger Scenario Modelling July 2007 8
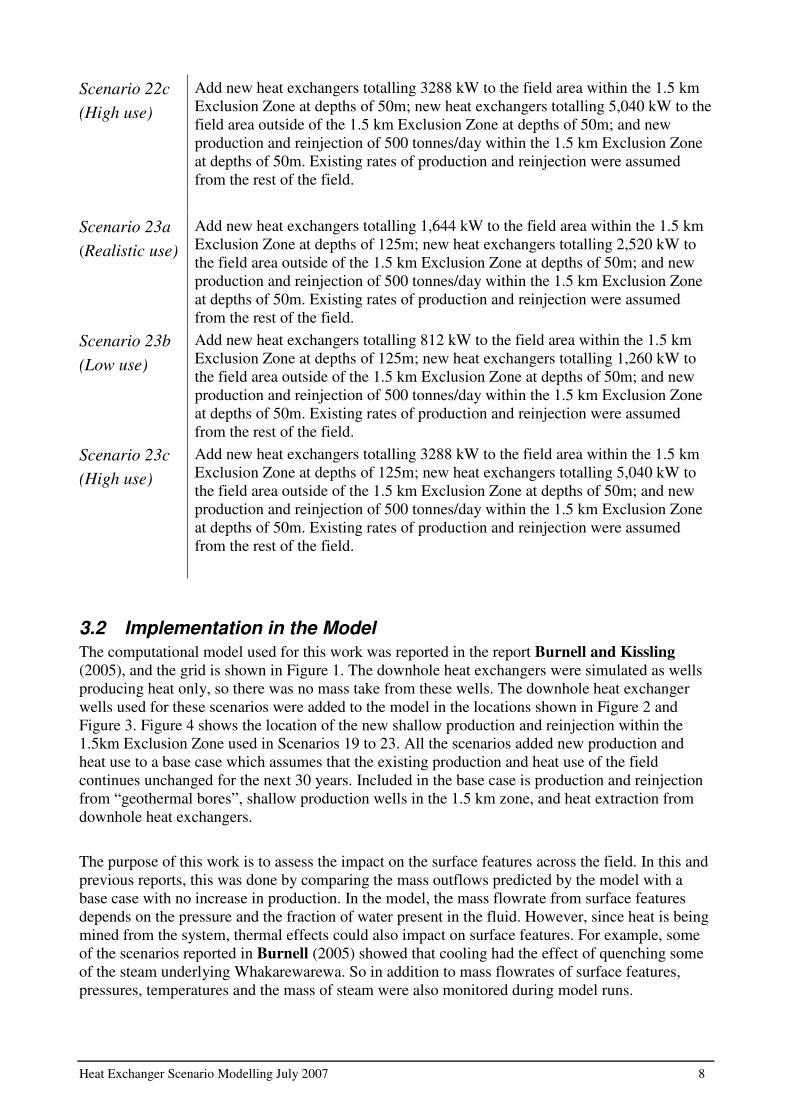
Scenario 22c
(High use)
Add new heat exchangers totalling 3288 kW to the field area within the 1.5 km
Exclusion Zone at depths of 50m; new heat exchangers totalling 5,040 kW to the
field area outside of the 1.5 km Exclusion Zone at depths of 50m; and new
production and reinjection of 500 tonnes/day within the 1.5 km Exclusion Zone
at depths of 50m. Existing rates of production and reinjection were assumed
from the rest of the field.
Scenario 23a
(Realistic use)
Add new heat exchangers totalling 1,644 kW to the field area within the 1.5 km
Exclusion Zone at depths of 125m; new heat exchangers totalling 2,520 kW to
the field area outside of the 1.5 km Exclusion Zone at depths of 50m; and new
production and reinjection of 500 tonnes/day within the 1.5 km Exclusion Zone
at depths of 50m. Existing rates of production and reinjection were assumed
from the rest of the field.
Scenario 23b
(Low use)
Add new heat exchangers totalling 812 kW to the field area within the 1.5 km
Exclusion Zone at depths of 125m; new heat exchangers totalling 1,260 kW to
the field area outside of the 1.5 km Exclusion Zone at depths of 50m; and new
production and reinjection of 500 tonnes/day within the 1.5 km Exclusion Zone
at depths of 50m. Existing rates of production and reinjection were assumed
from the rest of the field.
Scenario 23c
(High use)
Add new heat exchangers totalling 3288 kW to the field area within the 1.5 km
Exclusion Zone at depths of 125m; new heat exchangers totalling 5,040 kW to
the field area outside of the 1.5 km Exclusion Zone at depths of 50m; and new
production and reinjection of 500 tonnes/day within the 1.5 km Exclusion Zone
at depths of 50m. Existing rates of production and reinjection were assumed
from the rest of the field.
3.2 Implementation in the Model
The computational model used for this work was reported in the report Burnell and Kissling
(2005), and the grid is shown in Figure 1. The downhole heat exchangers were simulated as wells
producing heat only, so there was no mass take from these wells. The downhole heat exchanger
wells used for these scenarios were added to the model in the locations shown in Figure 2 and
Figure 3. Figure 4 shows the location of the new shallow production and reinjection within the
1.5km Exclusion Zone used in Scenarios 19 to 23. All the scenarios added new production and
heat use to a base case which assumes that the existing production and heat use of the field
continues unchanged for the next 30 years. Included in the base case is production and reinjection
from “geothermal bores”, shallow production wells in the 1.5 km zone, and heat extraction from
downhole heat exchangers.
The purpose of this work is to assess the impact on the surface features across the field. In this and
previous reports, this was done by comparing the mass outflows predicted by the model with a
base case with no increase in production. In the model, the mass flowrate from surface features
depends on the pressure and the fraction of water present in the fluid. However, since heat is being
mined from the system, thermal effects could also impact on surface features. For example, some
of the scenarios reported in Burnell (2005) showed that cooling had the effect of quenching some
of the steam underlying Whakarewarewa. So in addition to mass flowrates of surface features,
pressures, temperatures and the mass of steam were also monitored during model runs.
Heat Exchanger Scenario Modelling July 2007 9
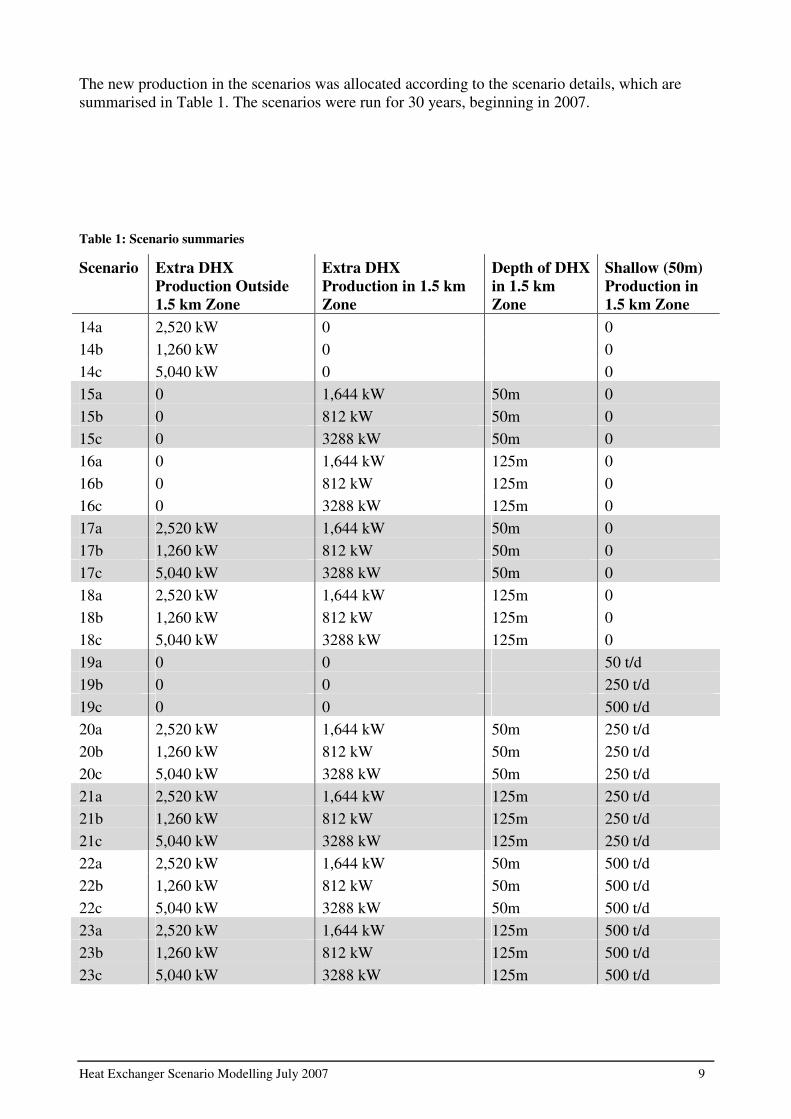
The new production in the scenarios was allocated according to the scenario details, which are
summarised in Table 1. The scenarios were run for 30 years, beginning in 2007.
Table 1: Scenario summaries
Scenario Extra DHX
Production Outside
1.5 km Zone
Extra DHX
Production in 1.5 km
Zone
Depth of DHX
in 1.5 km
Zone
Shallow (50m)
Production in
1.5 km Zone
14a 2,520 kW 0 0
14b 1,260 kW 0 0
14c 5,040 kW 0 0
15a 0 1,644 kW 50m 0
15b 0 812 kW 50m 0
15c 0 3288 kW 50m 0
16a 0 1,644 kW 125m 0
16b 0 812 kW 125m 0
16c 0 3288 kW 125m 0
17a 2,520 kW 1,644 kW 50m 0
17b 1,260 kW 812 kW 50m 0
17c 5,040 kW 3288 kW 50m 0
18a 2,520 kW 1,644 kW 125m 0
18b 1,260 kW 812 kW 125m 0
18c 5,040 kW 3288 kW 125m 0
19a 0 0 50 t/d
19b 0 0 250 t/d
19c 0 0 500 t/d
20a 2,520 kW 1,644 kW 50m 250 t/d
20b 1,260 kW 812 kW 50m 250 t/d
20c 5,040 kW 3288 kW 50m 250 t/d
21a 2,520 kW 1,644 kW 125m 250 t/d
21b 1,260 kW 812 kW 125m 250 t/d
21c 5,040 kW 3288 kW 125m 250 t/d
22a 2,520 kW 1,644 kW 50m 500 t/d
22b 1,260 kW 812 kW 50m 500 t/d
22c 5,040 kW 3288 kW 50m 500 t/d
23a 2,520 kW 1,644 kW 125m 500 t/d
23b 1,260 kW 812 kW 125m 500 t/d
23c 5,040 kW 3288 kW 125m 500 t/d

Heat Exchanger Scenario Modelling July 2007 10
0.
2000.
4000.
6000.
8000.
10000.
2000. 4000. 6000. 8000. 10000.
Figure 1: Grid used for the computational model. The coordinates refer to map
coordinates with (2,000, 0) on the diagram corresponding to (2790,000N, 6332,000E)
in map coordinates. The blue lines are local roads, streams and the lakefront, and
the red line approximately shows the 1.5km exclusion zone.
Figure 2: Regions where downhole heat exchangers were added to the model

Heat Exchanger Scenario Modelling July 2007 11
3000.
4000.
5000.
6000.
7000.
8000.
3500. 4000. 4500. 5000. 5500. 6000. 6500. 7000.
Figure 3: Locations of wells used to simulate the new downhole heat exchangers on the
model grid.
2000.
3000.
4000.
5000.
6000.
7000.
Figure 4: Location of new shallow production and reinjection within the 1.5km
Exclusion Zone used in Scenarios 19 to 23. Red rectangles indicate production
and blue rectangles indicate reinjection.

Heat Exchanger Scenario Modelling July 2007 12
4. Results
The modelled scenarios were run for 30 years from 2007 until 2037. A base case was firstly run
using the existing production rates out to 2037. For each scenario, the results in 2037 were
compared to the base case. In particular, comparisons were made with:
• The mass flowrate at Whakarewarewa;
• The mass flowrate at Kuirau Park;
• The amount of steam under Whakarewarewa between elevations 210 and 250 m.a.s.l.;
• Temperatures at Whakarewarewa and Kuirau Park.
Because the downhole heat exchangers are mining heat from the system, there is the potential for
significant cooling to occur. This is why the amount of steam under Whakarewarewa and
temperatures were also considered.
For the base case in 2037, the mass flowrate at Whakarewarewa is 29,526 tonnes/day and 1,563
tonnes/day at Kuirau Park. The amount steam under Whakarewarewa between 210 and 250
m.a.s.l. is 4,380 tonnes. Temperatures are around 174ºC at Whakarewarewa and 120ºC at Kuirau
Park.
The results of the scenarios are summarised in Table 2, and Figure 5 to Figure 7.
4.1 Discussion
It is important to appreciate that the results presented here are only indicative of the possible field
response. The results only show the response to the particular pattern of heat production used in
the model. Different patterns of production may produce different results. However the results do
show the magnitude of the impact that can be expected from the various scenarios.
To assist in the assessment of the impact of these scenarios it is helpful to consider a benchmark
provided by the response to the Bore Closure Programme. Any scenario that has an impact that is a
significant fraction of that response is likely to be unacceptable. Relevant aspects of the response
to the Bore Closure Programme from 1986 to 1990 as calculated from the model are:
• The mass flowrate at Whakarewarewa increased by 7,780 tonnes/day;
• The mass flowrate at Kuirau Park increased by 1,380 tonnes/day.
• The amount of steam under Whakarewarewa increased by 100 tonnes.
All the scenarios are mining heat from the system so will result in some cooling. However the
amount of heat being produced in most scenarios is only a fraction of the total heat being extracted
from the system from existing production and reinjection wells. It is difficult to estimate exactly
how much heat is being extracted as production and reinjection temperatures are not very well
known. We can obtain an estimate from the model which suggests that 25 MW of heat is being
extracted from production in 2005. In comparison, the “High Use” scenarios such as 17c produce
another 8.3 MW.

Heat Exchanger Scenario Modelling July 2007 13
Table 2: Scenario results. The results show the amount of reduction in 2037 of outflow from the base case at
Whakarewarewa, Kuirau Park, and the reduction in the mass of steam under Whakarewarewa from the base
case. The positive values mean that the scenarios had reduced values compared to the base case. The
percentage change is a percentage of the response to the Bore Closure Programme – see previous page.
Scenario Reduction in Outflow
at Whakarewarewa
Reduction in Outflow
at Kuirau Park
Reduction in Steam
under Whakarewrewa
Tonnes/day % Tonnes/day % Tonnes %
14a – Realistic 53 0.7 148 10.8 0.3 0.3
14b – Low 21 0.3 86 6.2 0.1 0.1
14c - High 1 1.5 346 25.0 0.7 0.7
15a – Realistic 2 0.0 7 0.5 1.4 1.4
15b – Low 0 0.0 3 0.2 0.7 0.7
15c – High 17 0.2 16 1.2 2.9 2.9
16a – Realistic -19 -0.2 6 0.4 2.0 2.0
16b – Low -3 0.0 2 0.2 0.8 0.8
16c – High 16 -0.2 16 1.1 4.3 4.3
17a – Realistic 58 0.8 153 11.1 1.8 1.8
17b – Low 21 0.3 88 6.4 0.8 0.8
17c – High 135 1.7 358 25.9 3.6 3.6
18a – Realistic 37 0.5 152 11.0 2.4 2.4
18b – Low 18 0.2 87 6.3 0.95 1.0
18c – High 106 1.4 359 26.0 5.0 5.0
19a – 50 t/d 4 0.1 1 0.1 0.1 0.1
19b – 250 t/d 20 0.3 6 0.4 0.9 0.9
19c – 500 t/d 43 0.6 13 0.9 2.1 2.1
20a – Realistic 91 1.2 159 11.5 2.6 2.6
20b – Low 48 0.6 93 6.7 1.7 1.7
20c – High 159 2.0 364 26.4 4.2 4.2
21a – Realistic 82 1.0 159 11.5 3.4 3.4
21b – Low 43 0.6 92 6.7 1.9 1.9
21c – High 153 2.0 366 26.6 5.9 5.9
22a – Realistic 110 1.4 162 11.7 3.4 3.4
22b – Low 104 1.3 109 7.9 3.0 3.0
22c – High 178 2.3 368 26.7 4.9 4.9
23a – Realistic 106 1.4 164 11.9 4.5 4.5
23b – Low 73 0.9 99 7.2 3.1 3.1
23c – High 163 2.1 372 27.0 7.0 7.0

Heat Exchanger Scenario Modelling July 2007 14
0.0
0.5
1.0
1.5
2.0
2.5%
Re
du
cti
on
in
Ma
ss
Flo
w
14 15 16 17 18 19 20 21 22 23
Scenario
Whakarewarewa
A
B
C
Figure 5: Percentage reduction in outflow at Whakarewarewa for all the scenarios. The percentage is
calculated from the recovery to the bore closure of 1986, see the text for details.
0.0
5.0
10.0
15.0
20.0
25.0
30.0
% R
ed
uc
tio
n i
n M
as
s F
low
14 15 16 17 18 19 20 21 22 23
Scenario
Kuirau Park
A
B
C
Figure 6: Percentage reduction in outflow at Kuirau Park for all the scenarios. The percentage is calculated
from the recovery to the bore closure of 1986, see the text for details.

Heat Exchanger Scenario Modelling July 2007 15
0.0
1.0
2.0
3.0
4.0
5.0
% R
ed
uc
tio
n i
n S
tea
m
14 15 16 17 18 19 20 21 22 23
Scenario
A
B
C
Figure 7: Percentage reduction in steam under Whakarewarewa for all the scenarios. The percentage is
calculated from the recovery to the bore closure of 1986, see the text for details.
All the scenarios reduce the mass flowrate at Kuirau Park. This is due to the cooling of the system,
which results in slightly lower pressures around the Kuirau Park area. The scenarios with new heat
exchanger outside the 1.5 km Exclusion Zone show an impact on Kuirau Park. These are Scenarios
14, 17, 18, 20, 21, 22 and 23. The “Low Use” B versions of these scenarios result in a reduction of
flow at Kuirau Park of around 6% of the Bore Closure recovery. The “Realistic Use” A scenarios
reduce the Kuirau Park flow by about 11%, and the “High Use” C scenarios by about 26% of the
Bore Closure recovery.
Scenario groups 15, 16 and 19, which just considered new production in the 1.5 km Exclusion
Zone had a minimal impact on the flow at Kuirau Park. This is due to the distance of the new
production in these scenarios from Kuirau Park.
The impact of the scenarios on Whakarewarewa is smaller, with largest impact on the flow from
Whakarewarewa being 2% of the recovery due to the Bore Closure Programme. None of the
scenarios have a noticeable impact on the temperatures at Whakarewarewa or amount of steam
present under Whakarewarewa, being up to 7% of the recovery due to the Bore Closure
Programme for the high use scenarios.
5. Conclusions
1. 30 scenarios considering downhole heat exchanger use were simulated using the Rotorua
Geothermal Reservoir Model. The results of these simulations were used to assess the
impact on the surface features at Rotorua. The impact was assessed by considering mass
flows at Whakarewarewa and Kuirau Park and the amount of steam under Whakarewarewa.
The scenarios considered in this report provide an indication of the likely response to
increased use of downhole heat exchangers in various parts of the field outside the 1.5 km
exclusion zone.

Heat Exchanger Scenario Modelling July 2007 16
2. The “realistic use” scenarios equate to an increase of about 106 heat exchanger systems in
the northern area of the field, and 63 in the 1.5 km Exclusion Zone. The “low use” scenarios
equateto an increase of 53 and 32, and the “high use” scenario to 212 and 126 heat
exchangers systems in the northern area and 1.5 km Exclusion Zone respectively.
3. Scenarios with downhole heat exchanger use outside the 1.5 km Exclusion Zone showed
some impact on the outflow at Kuirau Park. Impacts ranged from 6 to 26% of the recovery
due to the Bore Closure programme in 1986.
4. The “high use C” scenarios were found to have a significant impact on geothermal outflow
at Kuirau Park.
5. “Realistic use” scenarios with heat exchangers outside the 1.5 km Exclusion Zone showed a
reduction of about 10% of the geothermal outflow at Kuirau Park.
6. Small increases in production from shallow depths of around 50m in the 1.5 km Exclusion
Zone showed a negligible impact on geothermal outflows at Whakarewarewa and Kuirau
Park.
7. The impact of all scenarios on Whakarewarewa was found to be small.
6. References
Burnell and Kissling (2005) Burnell, J. and Kissling, W. Rotorua Geothermal Reservoir
Modelling Part 1: Model Update 2004, Report to Bay of Plenty Regional Council
Burnell (2005) Burnell, J. Rotorua Geothermal Reservoir Modelling Part 2: Scenario Modelling,
Report to Bay of Plenty Regional Council
Burnell (2006) Burnell, J. Rotorua Geothermal Reservoir Modelling 2006: Heat Exchanger
Scenarios, Preliminary Report, Report to Bay of Plenty Regional Council,
December 2006.

EBOP Briefing Document 17
Appendix A: EBOP Briefing Document
Brief for Further Modelling Scenarios for the Rotorua Geothermal Field
For Industrial Research Limited
2007
Prepared by Dougall Gordon - Environmental Scientist
Environment Bay of Plenty
EBOP Briefing Document 18
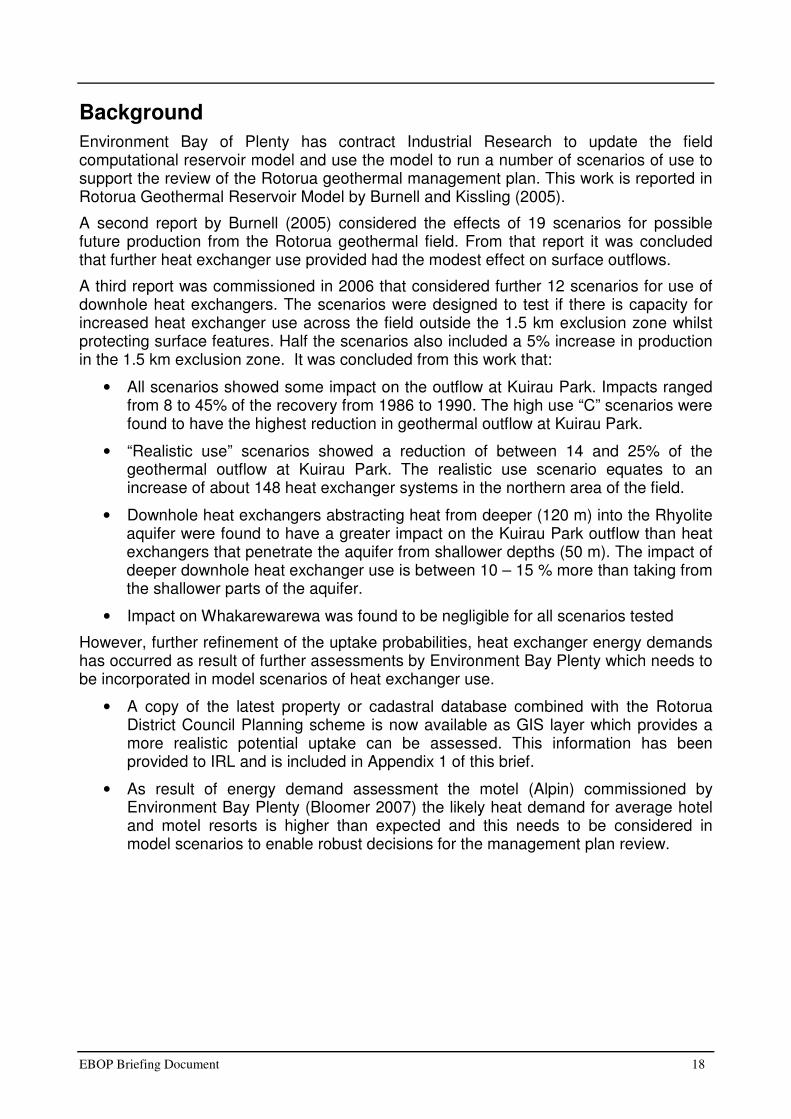
Background
Environment Bay of Plenty has contract Industrial Research to update the field computational reservoir model and use the model to run a number of scenarios of use to support the review of the Rotorua geothermal management plan. This work is reported in Rotorua Geothermal Reservoir Model by Burnell and Kissling (2005).
A second report by Burnell (2005) considered the effects of 19 scenarios for possible future production from the Rotorua geothermal field. From that report it was concluded that further heat exchanger use provided had the modest effect on surface outflows.
A third report was commissioned in 2006 that considered further 12 scenarios for use of downhole heat exchangers. The scenarios were designed to test if there is capacity for increased heat exchanger use across the field outside the 1.5 km exclusion zone whilst protecting surface features. Half the scenarios also included a 5% increase in production in the 1.5 km exclusion zone. It was concluded from this work that:
• All scenarios showed some impact on the outflow at Kuirau Park. Impacts ranged from 8 to 45% of the recovery from 1986 to 1990. The high use “C” scenarios were found to have the highest reduction in geothermal outflow at Kuirau Park.
• “Realistic use” scenarios showed a reduction of between 14 and 25% of the geothermal outflow at Kuirau Park. The realistic use scenario equates to an increase of about 148 heat exchanger systems in the northern area of the field.
• Downhole heat exchangers abstracting heat from deeper (120 m) into the Rhyolite aquifer were found to have a greater impact on the Kuirau Park outflow than heat exchangers that penetrate the aquifer from shallower depths (50 m). The impact of deeper downhole heat exchanger use is between 10 – 15 % more than taking from the shallower parts of the aquifer.
• Impact on Whakarewarewa was found to be negligible for all scenarios tested
However, further refinement of the uptake probabilities, heat exchanger energy demands has occurred as result of further assessments by Environment Bay Plenty which needs to be incorporated in model scenarios of heat exchanger use.
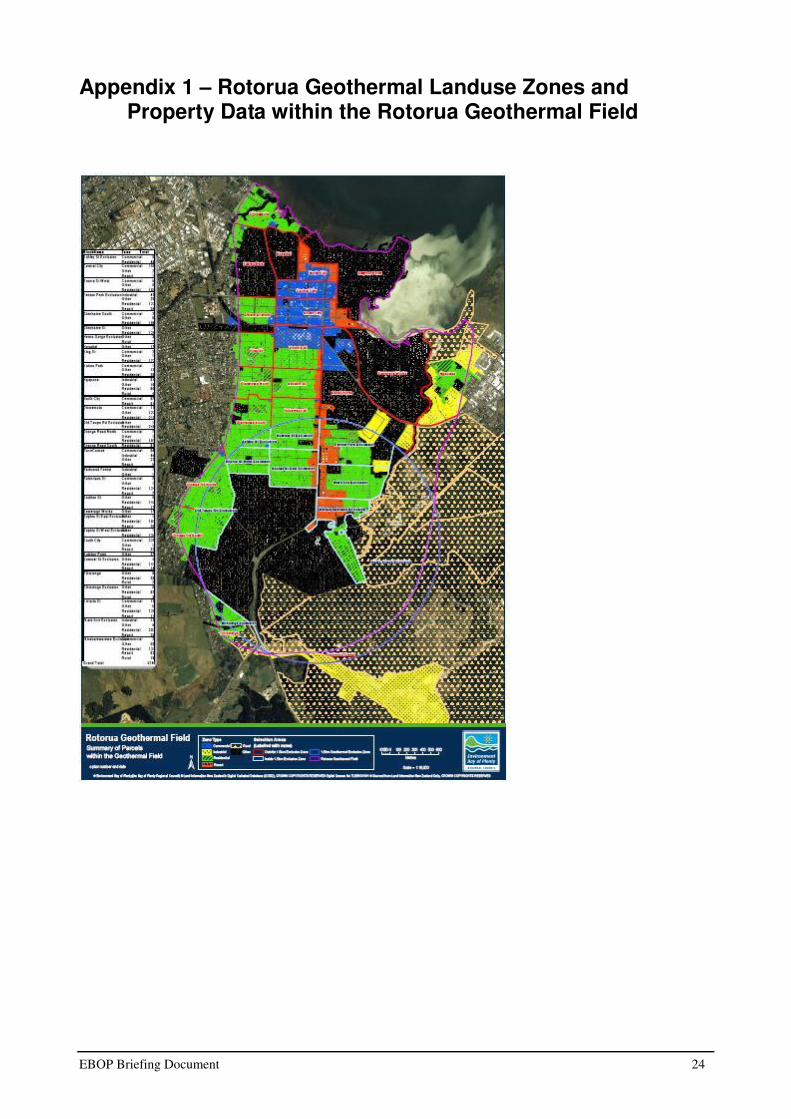
• A copy of the latest property or cadastral database combined with the Rotorua District Council Planning scheme is now available as GIS layer which provides a more realistic potential uptake can be assessed. This information has been provided to IRL and is included in Appendix 1 of this brief.
• As result of energy demand assessment the motel (Alpin) commissioned by Environment Bay Plenty (Bloomer 2007) the likely heat demand for average hotel and motel resorts is higher than expected and this needs to be considered in model scenarios to enable robust decisions for the management plan review.

EBOP Briefing Document 19
Further work is required to test the impact of downhole heat exchangers use within the 1.5 km zone and small increase in production from the shallow zones (nominally up to 50 m in depth) within the 1.5 km exclusion zone. The increased heat exchanger use and production within the 1.5 km exclusion zone have been posed as further scenarios by the consents group at Environment Bay of Plenty to be run in the model.
Scope
Rerun scenarios 10 using the latest property or cadastral database information and new scenarios of heat exchanger use within the 1.5 km zone using the following criteria of uptake and heat demand for each landuse zone. Heat demand for each landuse as described below.
Heat Demand and Landuse
1. Residential zones
Domestic use is typically allocated 20 kW. Domestic energy is mainly for space heating, some hot water heating use and spa pool. Space heating peak load for a 180 - 200 m2 floor area for the average family house N.Z statistics (Appendix II) and using ECCA heat loading of 50 W per m3 the energy required is 200 m2 x 1.8 m x 50 W = 18 kW. This assumes that space heating is used for 24 hours per day for 8 months of the year (BRANZ 2006). Hot water heating accounts for about for the remainder. From recent energy consumption studies Bloomer (2007) BRANZ (2006) show that domestic hot water(DHW) use of 8 kW/h per day and spa pool of 30 kW/h per day with total for these uses of 2 kW (DHW 0.33 kW + spa 1.6 kW) per day. On this basis the model scenarios will use 20kW for 8 months of the year and 2 kW for 4 months of the year.
Figure 1.1 – Energy use through the year (BRANZ 2006).

EBOP Briefing Document 20
2. Commercial zones
In this zone energy is mainly used for space heating of retail shops and light industry. The allocation for this use is 40 kW. However energy for space heating is generally only used for 8 months of the year and this will need to be considered in the model scenarios.
3. Industrial zones
In this zone the energy used is estimated to be 100 kW for most industrial application such as timber drying and is considered a constant load year around.
4. Resort zones
This is for hotels and motels type operations. From recent studies of energy use by Bloomer (2007) an average motel/hotel operation the load is estimated to be 100 kW that for 8 months of the year and 60 kW for 4 months it is used for hot water and spa pools and this will need to be considered in the model scenarios.

EBOP Briefing Document 21
Heat Exchanger Uptake
Heat exchanger uptake is the number of probable properties that may proceed with using geothermal heat exchanger for there energy needs. The update is difficult to predict and can only be assessed as a “realistic” case estimate.
1. Uptake of heat exchanger use within the 1.5 km zone:
• 1:20 properties that are zoned residential
• 1:10 properties that are zoned for resort use
• 1:20 for properties that are zoned for commercial use
• 1:40 properties that are zoned for industry use
Uptake of the geothermal is likely to be high for resort uses as there is currently no opportunity for use of the geothermal in the 1.5 km exclusion zone.
2. Uptake of heat exchanger use out side the 1.5 km zone.
• 1:20 properties that are zoned residential
• 1:20 properties that are zoned for resort use
• 1:20 for properties that are zoned for commercial use
• 1:40 properties that are zoned for industry use To provide a range of uptake can be further subdivided as “Low use” would mean half “realistic use” and “High use” would mean twice “realistic use”. The effect of taking heat from shallow depth (50m) compared to deeper depths (125 m) also needs to be considered for scenarios within the 1.5 km zone.
Fluid Production
There is also a few existing production takes within the 1.5 km exclusion zone that essentially take fluid from the shallow heated groundwater were excluded from the 1986 closure because they are less than 61m and 70oC. This production is mainly low temperature uses for mineral pools and some space heating. Therefore the question is can the model predict the effects of taking fluid from shallow depths within the 1.5 km exclusion zone? It is likely that talking fluid from shallow depths less than 50m is perhaps heated groundwater in permeable strata within the Huka Formation rather than the production zones within the ignimbrite based on work by Wood (1992). Wood (1992) suggested that there is separate aquifer in the SE area of the field known as the Fenton Park aquifer but this been never really been verified. The taking of fluid from shallow depths within with the Huka formation is likely to have a small effect of surface features as it is not within the main geothermal aquifer contained within the Rhyloite and Ignimbrite formations. Therefore Environment Bay of Plenty would like IRL to consider scenarios to assess the impact of increased production of 50, 250, 500 tonnes/day from shallow depth (nominally 50 m). The new production uptake could be spatially distributed in a similar way as the heat exchanger and according to the planning zones. Scenarios of increased production assume full reinjection as this best practice to minimise mass losses and fluid disposal by re injection also minimises the effects and costs of surface disposal. Table 1.1 Proposed Model Scenarios

EBOP Briefing Document 22
Scenarios Runs
A. Rerun scenario 10 Group previously report May, 2007. New heat exchanger use from shallow depth (50m) outside the 1.5km exclusion zone using the latest property database data, heat demand and uptake probabilities.
3
B. New heat exchanger use within the 1.5 km zone from shallow depths (50 m) and deeper in the field (125 m) using the latest property database data, heat demand and uptake probabilities
6
C. New heat exchanger use from shallow depths (50m) outside the 1.5km exclusion zone, using the latest property database data, heat demand and uptake probabilities AND new heat exchanger use within the 1.5 km zone from shallow depth (50m) and deeper in the field (125 m) using the latest property database data, heat demand and uptake probabilities. This is a combination of scenarios A & B above.
6
D. Increased production from within the1.5 km zone of 50, 250, 500 tonnes/day from shallow depths (50m) using the latest property data and associated uptake probabilities as used in A -C above as a guide to locating new production.
3
E. Choose two production rates from scenario D which shows minimal impact on surface outflows AND combine with heat exchanger use within 1.5 km zone and the remainder of the field as outlined in scenario C above.
12
Total Scenarios 30
Deliverables
Run the Rotorua reservoir model for the scenarios listed in table 1.1 using the heat demand, landuse zone data and heat update probabilities outlined in the above brief scope. Amendments to the scenarios will be in writing by agreement. Provide a short report on results and conclusions with respect to the potential impacts of surface outflows from the Rotorua geothermal field. Please provide 3 hard copies of the report and an electronic PDF version. The short report tile is suggested to be “Final Report Rotorua Geothermal Reservoir Modelling 2006: Heat Exchanger Scenarios and Exclusion Zone Assessment”.
Timing
Draft Report by July 16th 2007 and final report model scenarios by July 20th, 2007.
EBOP Briefing Document 23
References
Bloomer A. 2007: Energy Assessment and Feasibility DHE Trial at Alpin Motel 16 Sala
Street Rotorua. Report prepared for Environment Bay of Plenty. BRANZ 2006: Energy Use in New Zealand Households – Report on the year 10 analysis
for the Household Energy Enduse Project (HEEP). Burnell, J. and Kissling, W. 2005: Rotorua Geothermal Reservoir Modelling Part 1: Model
Update 2004, Report to Bay of Plenty Regional Council. Burnell, J. 2005: Rotorua Geothermal Reservoir Modelling Part 2: Scenario Modelling,
Report to Bay of Plenty Regional Council. Burnell, J 2006: Rotorua Geothermal Reservoir Modelling 2006 Heat Exchanger
Scenarios Preliminary Report. Wood, C.P. 1992: Geology of the Rotorua Geothermal System. Geothermics 21 Special
Issue: Rotorua Geothermal Field, New Zealand. No. (1/2). 25-41.
EBOP Briefing Document 24
Appendix 1 – Rotorua Geothermal Landuse Zones and Property Data within the Rotorua Geothermal Field

EBOP Briefing Document 25
Appendix II – New Average House Floor Area – Statistics New Zealand
6.1 http://www2.stats.govt.nz/domino/external/web/prod_serv.nsf/092edeb76ed5aa6bcc256afe0081d84e/d70c691e793cd3e4cc256dd50070b951?OpenDocument
6.2 Discussion
Of all the territorial authorities, Porirua City recorded one of the highest average floor areas for new residential dwellings for the 2001 calender year (236 m2). Buller District recorded one of the lowest at 113 m2, while at 177 m2 Whangarei District was closer to the national average of 178 m2.
Figure 12-1
• Data source: Statistics New Zealand, Building Consents
• Frequency: Annually (available from 1991 onwards)
• Geographic level of data availability: New Zealand, regional council and territorial
authority.

EBOP Briefing Document 26
Floor Area of Rotorua New Dwellings
0
20
40
60
80
100
120
140
160
180
200
1991
1993
1995
1997
1999
2001
Year
Flo
or
are
a (
m2)