Embed Size (px)
Citation preview

Final Technical Report
for
Rotordynamic Analysis and Feasibility Study of a Disk Spin Test Facility for Rotor Health Monitoring
NASA Grant Number NAG 3-2573
Grant Duration March 15, 2001 to December 31, 2004
Jerzy T. Sawicki Principal Investigator
Department of Mechanical Engineering Cleveland State University
Cleveland, Ohio 44115
April 2005
https://ntrs.nasa.gov/search.jsp?R=20050180244 2020-02-26T23:04:21+00:00Z

Rotordynamic Analysis and Feasibility Study of a Disk Spin Test Facility for Rotor Health Monitoring
NAG 3-2573
Introduction Recently, National Aeronautics and Space Administration (NASA) initiated a program to achieve the significant improvement in aviation safety. One of the technical challenges is the design and development of accelerated experiments that mimic critical damage cases encountered in engine components. The Nondestructive Evaluation (NDE) Group at the NASA Glenn Research Center (GRC) is currently addressing the goal concerning propulsion health management and the development of propulsion system specific technologies intended to detect potential failures prior to catastrophe. For this goal the unique disk spin simulation system was assembled at NASA GRC, which allows testing of rotors with the spinning speeds up to 10K RPM, and at the elevated temperature environment reaching 540°C (1000°F). It is anticipated that the facility can be employed for detection of Low Cycle Fatigue disk cracking and further High Cycle Fatigue blade vibration. The controlled crack growth studies at room and elevated temperatures can be conducted on the turbine wheels, and various NDE techniques can be integrated and assessed as in-situ damage monitoring tools. Critical rotating parts in advanced gas turbine engines such as turbine disks frequently operate at high temperature and stress for long periods of time. The integrity of these parts must be proven by non-destructive evaluation (NDE) during various machining steps ranging from forging blank to finished shape, and also during the systematic overhaul inspections. Conventional NDE methods, however, have unacceptable limits. Some of these techniques are time-consuming and inconvenient for service aircraft testing. Almost all of these techniques require that the vicinity of the damage is known in advance. These experimental techniques can provide only local information and no indication of the structural strength at a component and/or system level. The shortcomings of currently available NDE methods lead to the requirement of new damage detection techniques that can provide global information on the rotating components/system, and, in addition, they do not require direct human access to the operating system. During this period of research considerable effort was directed towards the further development of experimental facility and development of the vibration-based crack detection methodology for rotating disks and shafts. A collection of papers and reports were written to describe the results of this work. The attached captures that effort and represents the research output during the grant period.

The 9th International Symposium on Transport Phenomena and Dynamics of Rotating Machinery
Honolulu, Hawaii, February 10-14, 2002
APPLICATION OF VIBRATION MONITORING TECHNIQUES FOR DAMAGE DETECTION IN ROTATING DISKS
Andrew L. Gyekenyesi Ohio Aerospace Institute/NASA GRC
21000 Brookpark Road, MS 6-1 Cleveland, Ohio 44135
Jerzy T. Sawicki Department of Mechanical Engineering
Cleveland State University Cleveland, Ohio 44115 [email protected]
George Y. Baaklini NASA Glenn Research Center
21000 Brookpark Road, MS 6-1 Cleveland, Ohio 44135
ABSTRACT
Rotor health monitoring and on-line damage detection are increasingly gaining the interest of manufacturers of aircraft engines. This is primarily due to the fact that there is a necessity for improved safety during operation as well as a need for lower maintenance costs. Applied techniques for damage detection and health monitoring of rotors are essential for engine safety, reliability and life prediction.
This paper describes experimental techniques and preliminary analytical results related to crack detection in rotating disks. The concept behind the undertaken crack detection approach is based on the fact that the development of a crack results in a distorted strain field within the component. This in turn is associated with a minute unbalance. By conducting on-line monitoring of the disk’s radial vibration amplitude and phase, it is possible to see changes in the center of mass of the rotor system.
To achieve the experimental set-up necessary to verify and study this crack detection technique, a unique disk spin simulation system was recently assembled by the nondestructive evaluation (NDE) group at NASA Glenn Research Center. The system allows for precision controlled spin tests that can facilitate the application of various sensing technologies for in-situ detection of rotor damage. A new, innovative capacitive sensing system was implemented to monitor blade tip clearance and the corresponding change in the center of mass of the rotor system. Two, separate 25.4 cm (10 in.) diameter disks were utilized for this study. The disks had machined teeth for imitating compressor or turbine blades. One was composed of titanium, while the second was nickel. In addition, the results of an FE analyses examined the behavior of healthy disks as well as cracked disks.
The FE analyses were carried out utilizing various crack sizes and locations. The solutions focused on finding the changes in the maximum radial deflections as a function of rotational speed and crack characteristics. Utilizing the analytical results, the feasibility of measuring the changes of center of mass due to cracks in disks was defined for the given rotor system.
INTRODUCTION Recently, the United States set the ambitious goal of
reducing the fatal accident rate for commercial aviation by 80% within ten years [1]. In turn, the National Aeronautics and Space Administration (NASA) in collaboration with Federal Aviation Administration (FAA) and other federal agencies, universities, as well as airline and aircraft industries, responded by developing the Aviation Safety Program (AvSP). The AvSP provides research and technology products needed to help the aerospace industry achieve the challenge to improve aviation safety. The Nondestructive Evaluation Group at the NASA Glenn Research Center at Lewis Field in Cleveland, Ohio is currently addressing the development of propulsion system specific technologies intended to detect damage prior to catastrophe under the propulsion health management task.
A unique disk spin simulation system was assembled at NASA Glenn Research Center. The system allows for disks up to 46 cm (18 in.) in diameter and rotational speeds in excess of 10000 revolutions per minute (RPM). In addition, the system has elevated temperature capabilities of 540°C (1000°F). Various NDE techniques can be integrated and assessed as in-situ damage monitoring tools. Furthermore, controlled crack growth studies at room and elevated temperatures can be conducted on subscale spinning rotors.
Currently, the focus of experimentation is the utilization of a non-contact capacitive method to measure the gap between the sensor and the rotating disk [2]. The sensor and the accompanying software are packaged as the HiBand Vibration Monitoring System by Exsell Inc [2]. The sensor’s accompanying software calculates the blade tip clearance, the radial vibration, the blade time-of-arrival, the circumferential vibration, as well as the change in the center of mass of the rotor system. The change in the center of mass, calculated utilizing the displacement data, has been shown to be sensitive to cracks as small as 1.27 mm (0.05 in.) in jet engine rotors tested in spin pits [3]. Although, at this point in time, the changes seen in this parameter have only been characterized in a subjective fashion. A deeper understanding of the relationship between crack progression and the change in the center of mass can be
1

achieved with the implementation of highly controlled crack initiation and growth tests on subscale spinning rotors. With the current disk spin simulation system such controlled tests can be conducted. In addition, other NDE sensing technologies like thermal acoustics and eddy current can be assessed. Before an experimental program can be initiated, an analytical modeling campaign must be undertaken. First, the current disks supplied with the spin system were analyzed. The disks were required to achieve rotational speeds of up to 10,000 RPM. In addition, the disks were analyzed concerning the in-plane compliance. There needed to be enough flexibility that if a crack exists in the disk, crack opening would occur as the rotational forces are increased. This crack opening would reveal itself as a shift in the center of mass of the rotor system or as a change in the maximum radial displacement.
The goals of this study were first to assemble the disk spin simulation system. To address the concerns of rotor health monitoring, an innovative capacitive sensor was integrated to monitor the radial displacement of a spinning disk. Examples of the software and its success at monitoring damage in previous spin pit tests are shown in later sections. In addition, a finite element study was conducted to investigate the feasibility of the current disk design as well as the behavior when presented with a crack. In an effort to examine damage, various crack sizes at a given location were introduced into the disk model. The FE analyses were employed to track changes in the maximum radial deflections due to the various types of crack damage. Lastly, rotor dynamics analyses were conducted by integrating the shaft, bearings, and support structure. This was done to assure that the current experimental set-up simulates a real aviation turbine with operating speeds beyond the first critical.
Lastly, it should be noted that the experimental set-up is rather unique in the arena of spin testing due to the fact that the horizontal shaft is supported by bearings on both ends of the rotor. This is a more realistic representation of an actual turbine as compared to a traditional spin pit. In spin pits, a vertical, hanging shaft is utilized with only the top having a bearing support. The rotor of interest is located between the top bearing and the bottom end of the shaft. Because the bottom end of the shaft is unconstrained, it is relatively free to move as a result of any dynamic forces. Therefore, it is assumed that any physical changes in the rotor will induce larger displacement variations in a spin pit set-up than in the more rigid, two bearing system employed here. EXPERIMENTAL METHODS AND PRELIMINARY SPIN PIT RESULTS
The disk spin simulation system is shown in Figure 1. The major components of the system consist of an inverter driven induction motor (2.2 kW: 3 HP), double belt drive, rotating shaft with mandrel, ceramic element heater, and containment shielding. The motor pulley to shaft pulley ratio is 2:1. This allows for rotor speeds of up to 10,000 RPM. As mentioned above, the ceramic element heater can achieve rotor temperatures of 540°C (1000°F).
Figure 1 Photograph displaying disk spin simulation system. Note that left side containment cover is removed for viewing rotor.
A non-contact capacitive probe, shown in Figure 2, is utilized to measure the radial gap between the sensor and a rapidly moving grounded target. The rapidly moving object is the disk. The sensor is attached to the base of the spin system, approximately 2.03 mm (0.08 in.) from the tip of the blade. The innovative capacitive sensor is based on a DC offset rather than using modulation techniques. The DC voltage, in conjunction with the motion of the rotor, allows for bandwidths up to 50 MHz [2]. These high acquisition rates are advantageous for monitoring individual blade vibrations in turbines, which in turn, assist in the quantification of high cycle fatigue in blades. By using an auto calibration technique, the sensor system eliminates most cable, vibration and temperature noise sources, thereby, allowing it to operate in harsh turbine environments. This auto calibration occurs during the null periods when no blades are in the vicinity of the probe. During this time, zero voltage is present. For a technical description of the capacitive sensor, the reader is advised to see reference [2].
Figure 2 Photograph of capacitive sensor attached to the base of the spin system.
The DC signal from the capacitive probe pre-amp is digitized using a 20 MHz, 12-bit A/D card. The voltage is
2

calibrated and then employed to calculate the blade tip clearance, the radial vibration, the blade time-of-arrival, the circumferential vibration, as well as the change in the center of mass of the rotor system. For this study, the focus was on the change in the center of mass calculation. As mentioned in the Introduction, this value shows promise as a rotor crack detection tool. The change in the center of mass is based on analyzing the magnitude and phase of the first harmonic, which is synchronous with the frequency of the disk rotation. The values for the magnitude and phase are obtained by applying a Fast Fourier Transform (FFT) to the blade displacement data. As mentioned above, when no blades are present the preamp produces zero voltage. Therefore, an absolute measure of the distance to the disk valleys between the teeth cannot be obtained because they are beyond the sensor’s range. The only real displacement data are at the blade tips where true voltages are induced in the sensor system. As a result, the FFT analysis is not applied to the raw data, but to the plots representing the individual gear teeth displacements. This will become more apparent in the discussion of the previous spin pit results on actual fan disks from turbine engines.
Displayed in Figure 3 are unpublished results provided by
Exsell, Inc. The figure provides a sampling of how the sensor and its software have been applied in the past. Shown are the data from a spin test of a large fan in an evacuated chamber using a multiple element capacitive sensor inside a spin pit. As a result of the multiple elements, each blade passing was represented by three pulses. The low cycle fatigue spin test was designed to induce cracks in an aircraft fan by cycling the part from top speed to a substantially lower speed, then continuously repeating the cycle. The sensor system was measuring and displaying the raw signal, blade tip clearance, time-of-arrival of the individual blades, and processing the vibration signal to produce plots that tracked the small changes in the balance of the system. Under the controlled conditions of the spin pit, the
Figure 3 Display for capacitive probe software. Example of data collected during a spin test of a fan rotor. The four plots on the right are data for a single rotation. The three peaks for each blade are due to the fact that the probe has three elements. The left side plots are based on the magnitude and phase of the first harmonic that is synchronous with the rotation of the rotor.
change in the balance of the rotor system was assumed to be a function of low cycle fatigue cracks in the fan disk.
The three graphs on the right hand side of Figure 3 monitor the change in the balance of the part. The change was later confirmed to be due to a crack that initiated in the disk. The unbalance of the disk was measured in real time. The change in the center of mass measurement (i.e., the change in the magnitude and phase of the first harmonic) displayed the difference between the initial balance of the rotating system and the current location of the center of mass. It is assumed that when cracks form, a distortion in the strain field occurs, in turn causing minute changes in the balance of the system. These changes are then displayed in the graphs on the right side of Figure 3. The top graph is a polar plot of the change in balance of the system, and the bottom two plots are the amplitude and phase of the difference in unbalance as compared to the baseline data. The polar plot simply shows the x and y components of the vector defined by the magnitude and phase of the first harmonic. A rise in amplitude and a stabilizing of the phase are typical indications of crack initiation and growth. This is assuming some internal movement of the rotating structure does not cause the unbalance. Again, for this particular case, the system was tracking a crack as it initiated and propagated within the disk. Because the data of Figure 3 has not yet been published, further details cannot be given at this time.
At this point, the reader is reminded that the objective of this report was to assemble a disk spin simulation system. The description of the experimental methods provides an understanding for the directions taken during the analytical studies. The analytical results will allow for controlled experimentation concerning damage detection in cracked disks. Such results will be reported in future publications. FINITE ELEMENT ANALYSIS OF DISK WITH CRACK
The finite element analyses were directed at understanding the behavior of the isolated disk as a function of crack size. Plots of the maximum radial displacement were constructed as functions of crack characteristics and rotational speed. Changes in the maximum displacement give an indication of the expected magnitude change in the center of mass.
The 30-blade disks utilized in this study were made of CP titanium, grade 2, and nickel CM 400. For each disk, the outside diameter was 25.4 cm (10 in.); the bore and outside rim thickness was 0.953 cm (0.375 in.); the thickness of the web was 0.318 cm (0.125 in.), and the cross-section and height dimensions of the blades were 0.318 cm × 0.953 cm (0.125 in. × 0.375 in.) and 1.27 cm (0.50 in.), respectively. Lastly, eight threaded holes, 0.635 cm (0.25 in.) diameter each, were drilled through the disk; four holes were located at a radius of 10.2 cm (4 in.), and four additional holes were at a radius of 8.9 cm (3.5 in.). The eight holes were spaced every 45°. The holes are utilized for possible mass attachments. The finite element analyses (FEA) of the rotating disk were conducted using the COSMOS FE software. In the analyses, parabolic tetrahedral elements were used with a non-dimensional global size of 0.19462.
3

Figure 4 Geometry of the tested disk.
For this study, a circumferentially oriented crack was selected and placed in the web portion of the disk. A crack oriented in this way is opened and propagated by radial stresses. This particular crack was chosen on the assumption that it would cause the most dramatic shift in radial displacement and, hence, change in center of mass. The crack tip was tapered and the non-dimensional crack element size was 0.097309. The radial distance from the disk center to the plane of the crack was 4.70 cm (1.85 in.). This corresponds to the location of the maximum radial stress as obtained utilizing a plane stress solution [4]. Three different types of circumferential cracks were defined and investigated in order to find the resulting radial in-plane deformations at multiple rotational speeds (see Table 1).
Table 1. Crack dimensions utilized in FE analysis.
Crack Geometry Crack Type Circumferential
Length (in.) Radial Width
(in.) Depth
Through Thickness
(in.) I 0.3 1/64 1/32 II 0.3 1/64 1/16 III 0.3 1/64 1/8
Figure 5 Maximum displacements of uncracked disks.
The radial tip displacements of the healthy, un-cracked, disks are shown in Figure 5 for both the nickel and the titanium disks. These are the FE calculated maximum radial displacements due to the centrifugal expansion of the disk under
rotational forces. As expected, the relatively stiff disks had rather small centrifugal expansions.
Next, FE analyses were conducted utilizing the crack characteristics from Table 1. Figure 6 shows the difference in the maximum displacements between the cracked and un-cracked titanium disks. Since the behaviors of the nickel and titanium disks were very similar, only the titanium data is shown. The calculated values are extremely small, and cannot be experimentally measured with the available capacitive sensors.
0
0.001
0.002
0.003
0.004
0.005
0 5000 10000 15000 20000
Rotating Speed (RPM)R
elat
ive
Rad
ial D
ispl
acem
ent
(x 0
.001
) in.
Crack I
Crack II
Crack III
Figure 6 Maximum relative displacement of un-cracked and cracked titanium disk.
Based on the crack analyses concerning the given geometry
of the disk, the selected size, the location, and the geometry of cracks, the types of cracks listed in Table 1 generate changes in the radial displacements that are very small and experimentally immeasurable. In order to simulate a more realistic scenario, a new disk imitating a turbine disk has been designed and is shown in Figure 7. The design was based on the stress results of the FE analysis, and optimized in terms of crack-induced potential in-plane deformations. Future work will involve a more in depth crack analysis as well as experimentation with cracked disks.
0
0.0005
0.001
0.0015
0.002
0.0025
0 5000 10000 15000 20000Speed (RPM)
Max
. Dis
plac
emen
t (in
.)
TitaniumNickel
Figure 7 Optimized design of the simulated disk.
4

ROTORDYNAMIC ANALYSIS OF DISK SPIN SIMULATION SYSTEM
The following rotordynamic analysis was conducted to further understand the dynamical behavior of the experimental set-up. As stated earlier, the system is meant to simulate a real turbine system. In most aviation based turbines, the system is expected to operate at some speed above the first critical. The disk spin simulation system consists of a shaft having a diameter of 1.27 cm (0.5 in.) and a length of 45.72 cm (18 in.), running on rolling element, deep-groove, single row bearings, which can be considered as isotropic with speed independent characteristics. The disk shown in Figure 4 (i.e., the original design) is mounted at the midspan of the shaft.
The equations of motion for a rotor system are ( ) ( )Mq C q Kq F t+ Ω + = (a)
where q denotes the displacement vector, M is the symmetric mass matrix, the C(Ω) is an asymmetric matrix which includes an antisymmetric, speed-dependent gyroscopic matrix, and K is the symmetric (in this case) stiffness matrix. The right hand side of Equation (a) represents the force excitation vector resulting from the system’s residual imbalance as well as any additional imbalance which might be induced by a crack.
The system’s natural frequencies are the result of the solution of homogeneous version of Equation (a), and can be written as
i iu jviλ = − + (b) or, in a single degree of freedom form as
21i di
i
i
jξ ωdiλ ω
ξ= − ±
− (c)
where di iω ν= is the ith damped natural frequency, and
2 2i
i
i
u
u v+
di
iξ = the corresponding modal damping ratio. The
values of ω are directly used for construction of the Campbell diagram. The real part of iλ indicates the possible instability of the system.
Figure 8 Campbell diagram for rotor test rig.
For the rotor with the disk made of nickel alloy, the Campbell diagram is shown in Figure 8. The intersection points of synchronous excitation line 1X with the natural frequencies loci determine critical speeds.
The disk’s diametral and polar moments of inertia are
29.209 and 58.34 lbm-in2, respectively. The mass of the nickel disk is 2.13 kg (4.7 lbm). The first and second critical speeds are approximately 4070 RPM and 37575 RPM, respectively. For the system with the titanium-based disk, the corresponding critical speeds are 5461 RPM and 37787 RPM.
Figure 9 Mode shape of vibration for the rotor with nickel disk at speed 4070 RPM.
The FE model of the rotor system with nickel disk with
indicated stations and disk locations, and the overlapped vibration mode shape corresponding to the first critical speed, are illustrated in Fig. 9. These results show that for the current system, it is practical to operate in a region beyond the first critical. DISCUSSION AND CONCLUDING REMARKS
A disk spin simulation system was assembled in order to deal with the goals of damage detection in aircraft engines. The two bearing system allows for subscale component testing at room and elevated temperatures. To address the concerns of rotor health monitoring, an innovative capacitive sensor was implemented as a tool for monitoring the radial displacement of a spinning disk. The radial displacement data can be utilized to calculate the change in the center of mass of the system. Preliminary data from spin pit tests of actual fan rotors have shown this to be feasible.
Next, FE and rotordynamic analyses were conducted in order to fully understand the experimental set-up. Cracks of various sizes were introduced in the web portion of the current disk design. The FE results indicated that the selected circumferential cracks had little impact on the radial displacements of the disks at rotational speeds up to 15,000 RPM. This would indicate that the changes in the center of mass due to cracks would probably be impossible to experimentally measure for the current simulated disk design and selected crack scenario. As a result a new disk was designed in order to optimize crack induced in-plane deformations. In addition, the new disk more closely resembles an actual turbine disk.
The rotordynamic analysis was carried out to assure that the experimental set-up would operate in a speed regime beyond the first critical. The results demonstrated that the system is
5

properly designed and can traverse the first critical speed. Again, this simulates the operating regime of actual aircraft turbines.
Future work in the area of rotor health monitoring will involve further analytical modeling of cracked rotors. As stated in the Introduction, the current methods of turbine rotor health monitoring are relatively subjective. Hence, there is a need to conduct an in depth modeling campaign to predict disk behavior in the presence of cracks. Such models will increase the understanding and reduce the subjectivity of this crack monitoring technique. The results of the models can then be compared to experimental crack growth data produced using subscale, spinning disks. In addition, the models can lead to the optimization of sensor location as well as assisting in the data analysis. ACKNOWLEGDEMENTS
The authors would like to thank Mr. Michael Drumm and Dr. Wayne Haase of Exsell Inc., for their assistance in the set-up of the capacitive sensor and its accompanying software. In addition, the authors thank Mr. Richard Martin of Cleveland State University and Mr. Edward Leffel of Analex Inc. for their technical support during the assembly of the disk spin system. REFERENCES 1. Shin, J., “The NASA Aviation Safety Program Overview,”
Proceedings of ASME Turbo Expo 2000, May 8-11, 2000, Munich, Germany.
2. Haase, W.C., Roberge, J.K., and Drumm, M.J., “High Bandwidth, Capacitive Sensing Preamplifier for Engine Health Monitoring,” www.Exsell.org, January, 2000.
3. Drumm, M.J., “Nondestructive, Real-Time Measurement of Cracks in Jet Engine Rotors,” www.testdevices.com, 1998.
4. Timoshenko, S., and Goodier, J.N., “Theory of Elasticity,” McGraw-Hill, 1951.
6

Modal-Based Diagnostics of Cracked Rotors
Jerzy T. Sawicki*1, Andrew L. Gyekenyesi **, George Y. Baaklini†
*Cleveland State University, Dept. of Mechanical Engineering, Cleveland, OH 44115
**OAI/NASA Glenn Research Center, 21000 Brookpark Road, MS 6-1, Cleveland, OH 44135 †NASA Glenn Research Center, 21000 Brookpark Road, MS 6-1, Cleveland, OH 44135
ABSTRACT Different approaches are used to sense and to localize a damage of rotating structures. Most of the methods take advantage of the dynamic behavior of the structural model [1-7]. This paper uses the modal and sensor norms, as defined in [8], to determine damage locations. The proposed approach allows localization of damaged elements within a structure, and provides information concerning the impact of the damage on the structure’s natural modes of vibration. Keywords: modal approach, damage detection, turbine disks.
1. INTRODUCTION
Current design practice for high-energy aircraft gas turbine rotors is based on an approach called “safe-life” method, which assumes that all material and manufacturing conditions that may influence the fatigue life of a rotor have been accounted for in prior laboratory specimen and full-scale testing. In addition, the final design is usually based on minimum properties. However, aircraft gas turbine industry experience has shown that the presence of certain material and manufacturing anomalies can potentially degrade the structural integrity of high-energy rotors. These anomalies occur infrequently and, therefore, are generally not present at critical locations during the testing of laboratory-based specimens or actual components. Undetected material and manufacturing anomalies represent a departure from the assumed nominal conditions and have resulted in several incidents, including the loss of a DC-10 at Sioux City in 1989 [9].
Critical rotating parts in advanced gas turbine engines such as turbine disks frequently operate at high temperature and stress for long periods of time. The integrity of these parts must be proven by non-destructive evaluation (NDE) during various machining steps ranging from forging blank to finished shape, and also during the systematic overhaul inspections. Conventional NDE methods, however, have unacceptable limits. Some of these techniques are time-consuming and inconvenient for service aircraft testing. Almost all of these techniques require that the vicinity of the damage is known in advance. These experimental techniques can provide only local information and no indication of the structural strength at a component and/or system level. The shortcomings of currently available NDE methods lead to the requirement of new damage detection techniques that can provide global information on the rotating components/system, and, in addition, they do not require direct human access to the operating system. However, early damage (e.g., cracks) detection is not easily achieved during the operation of rotating machinery. The principal difficulty lies with the fact that incipient damage can propagate inside a part of machinery without producing detectable changes in its operational parameters. A crack initiating at a critical location within a rotating machinery component (e.g., shaft or disk) can be fatal for its operation. Typically, such a crack produces an undetectable change in the overall structural frequency response. For this reason, advanced failure detection methods are sought that can improve the detection of local structural changes in vital areas of rotating machinery [10].
1 Correspondence: Email: [email protected]; phone 1.216.433.2467; fax 1.216.977.7150

The objective of this paper is to demonstrate the feasibility of detecting and locating flaws in rotating components utilizing the approach of modal norms and sensor norms [8]. The proposed method allows for localizing the damaged portions of a rotating structure. It addition, it provides information about the impact of the damage on the natural modes of the damaged structure.
2. MATHEMATICAL MODEL A rotating turbine disk is an example of disk-like structure which is cyclically symmetric in that its geometry can be defined by a sector which is repeated an integer number of times in the circumferential direction. For these periodic disk-like structures, no simple equation of motion or closed-form solution is available for the modal properties. However, this structure, as all others, can be approximated by a discrete, finite element, type of model. Such a structural model is characterized by its mass, stiffness, and damping matrices, as well as by the locations of the sensors and actuators. It is represented by the following second-order differential equation:
,Mq Dq Kq Bu+ + = (1a)
q vy C q C q= + (1b) In this equation q is the structural displacement vector of dimension ; u is the input vector of dimension r; y is the output vector of dimension s; and M, D, K are the mass, damping, and stiffness matrices, respectively, with dimensions
. The input matrix B, characterizes the actuator locations, the output displacement and rate matrices and of dimensions
dn
dn n× d dn r× qC
vC ds n× characterize the displacement and rate sensor locations, respectively. The mass matrix is positive definite, and the stiffness and damping matrices are positive semidefinite; is the number of degrees of freedom, r is the number of actuators, and s is the number of sensors.
dn
The above equation can also be obtained in the modal coordinates using the modal transformation. For a small proportional damping let iω be the ith natural frequency and iφ be the ith natural mode, or mode shape. Define the matrix of natural frequencies 1 2( , , , )ndiag ω ω ωΩ = … , and the modal matrix [ ]1 2 nφ φΦ = … φ , of dimensions dn n× , consists of n natural modes of a structure. A new variable, , called the modal displacement vector is introduced, such that . This transformation produces the modal mass matrix
mq
mq q= Φ TmM M= Φ Φ , and the modal stiffness
matrix . Both matrices are diagonal. If the damping is proportional the modal damping matrix TmK K= Φ Φ T
mD D= Φ Φ is diagonal as well. Pre-multiplying Eq. (1) by , and subsequently by TΦ 1
mM − gives the following modal model (see e.g., [11])
22m m mq q q B+ ΖΩ +Ω = mu , (2a)
mq m mv my C q C q= + , (2b)
The term is a diagonal matrix of the modal damping, is the modal input matrix, , while and are the modal displacement and rate matrices, respectively.
10.5 m mM D−Ζ = Ω 1−
u
i
mB 1 Tm mB M B−= Φ
mq qC C= Φ mv vC C= Φ The modal equations (2a,b) can be re-written as a set of n independent equations for each modal displacement
22mi i i mi i mi miq q q bζ ω ω+ + = , (3a)
i mqi mi mvi my c q c q= + , (3b) 1,...,i = n

where iζ is the ith diagonal entry of . In the above equations is the system output due to the ith mode dynamics; is the ith row of ; and and are the ith columns of , and , respectively. Next, is defined as the
equivalent output matrix of the ith mode
Ζ iy
mib mB mqic mvic mqC mvC mic
mqimi mvi
i
cc c
ω= + (4)
The terms 2mib and 2mic are the input and output gains of the ith mode (see [7]), and 2
x denotes the Frobenius norm
of x, i.e., 2( T )x tr x x= . In the case of multiple sensors consists of s entries , j=1,…,s, that correspond to each
sensor. mic mijc
3. MODAL NORMS APPROACH
System norms, such as H2, H∞, or Hankel serve as a measure of system “size”. The basis of the undertaken approach is decomposition of the system norms in terms of its modal norms [8]. In other words, norm of a MIMO (Multi Input Multi Output) system/structure can be represented as the root-mean-square (rms) sum of norms of a SISO (Single Input Single Output) system/structure. The H2 norm of a system is used to characterize the system itself, along with its modes, and its sensors. Let ( )G ω be a transfer function of a system. The H2 norm of the system is defined as
2 *2
1 ( ( ) ( ))2
G tr G G dω ω ωπ
+∞
−∞= ∫ (5)
When utilizing modal coordinates, the equations of a flexible structure are uncoupled (see (3)). In turn, the norms of the ith mode and jth sensor can be approximated by the following equations:
2 22 2
mi mijij
i i
b cG
ζ ω≅ , (6)
Define the H2 norm of the ith mode, 2miG , as the root-mean-square sum over all sensors (see [7]):
22
2 21
s
mi ijj
G G=
= ∑ , i = 1, …, n. (7)
Define also the H2 norm of the jth sensor,
2sjG , as the root-mean-square sum over all modes:
2 2
2 21
n
sj iji
G G=
= ∑ j = 1, …, s. (8)
The H2 norm of the total system is approximately the root-mean-square sum over either all its modal norms, or all its sensor norms:
2
21
n
mii
G G=
≅ ∑ 2
2 , or 22
2 21
s
sjj
G G=
≅ ∑ (9)
The modal and sensor norms are used in the following damage detection procedure.

4. DAMAGE DETECTORS Denote the jth sensor norm of a healthy structure by
2shjG , and the jth sensor norm of a damaged structure by2sdjG .
The jth sensor index of the structural damage is defined as a weighted difference between the jth sensor norm of a healthy and damaged structure, i.e.,
2 2
2 2
2
2
shj sdj
sj
shj
G G
Gσ
−= (10)
The sensor index reflects the impact of the structural damage on the jth sensor. Similarly, denote the ith mode norm of a healthy structure by
2mhiG , and the ith mode norm of a damaged structure
by2mdiG . The ith mode index of the structural damage is defined as a weighted difference between the ith mode norm
of a healthy and damaged structure, i.e.,
2 2
2 2
2
2
mhi mdi
mimhi
G G
Gσ
−= (11)
The ith mode index reflects the impact of the structural damage on the ith mode. The question arises how to measure the sensor and modal norms. It follows from Eq.(6) that the norm is determined from the system’s natural frequencies, modal damping ratios, and the modal input and output gains. The gains, on the other hand, are determined from the natural mode shapes at the actuator and sensor locations. Thus the measurements of natural frequencies, modal damping, and the modal displacements at the locations of actuators and sensors for healthy and damaged structures allows for the localization of structural damage. Note that the natural mode shapes characterize the structure itself, since they are determined from the modal matrixΦ . Thus, they do not depend on the input time history, u(t), nor on the actual system deformations, q(t).
5. EXAMPLE A disk of uniform thickness, which imitates a model of turbine disk, is rotating with constant angular velocity ω. Stresses are generated in the disk due to centrifugal forces given by 2rρ ω , where ρ is the mass density per unit volume, and r is the radial distance from the center. Treating the centrifugal force as the body force in the radial direction, a finite element analysis can be conducted. As a numerical example, a disk with an inner diameter of 5.08×10⁻² m (2 in.), an outer diameter of 0.508 m (20 in.), and uniform thickness of 0.635×10⁻² m (0.25in.) is considered. The disk is rotating at ω=1,047 rad/sec (10,000 rpm). The material properties are as follows: E=210 GPa, G=79 GPa, ν=0.28, and ρ=7700 Kg/m3. The finite element (FE) model consists of 64 shell elements, each having 6 degrees of freedom, and 80 nodes, as is shown in Fig. 1. The equivalent nodal force vector is calculated as ([12]):
2rb
zr z
brdrdz
bπ
⎛ ⎞= ⎜ ⎟
⎝ ⎠∫ ∫r N (12)
where N is the shape function of the elements, and br, bz are the body forces in radial and axial direction, respectively. The damage case is considered as a 20% reduction in element No. 9’s stiffness. Thirty four strain-gage sensors are placed within the first quarter of the disk. The body forces, described previously, are considered the excitation forces.

-10 -8 -6 -4 -2 0 2 4 6 8 10
-10
-8
-6
-4
-2
0
2
4
6
8
10
1 2
3 4 5
6
7
8 9 10
12
13
1415
16
17
18
19
20
21
22
23
2425
26
27
28
2930
31
32
33
34
35
36
37 38
39
40 41
42
4344
45
46
47
48
49
50
51
52
53
54 55
56
57
58
59
60
61
62
63
64
65 66
67
68
69
70
71
72
73
74
75
76 77
78
79
80
1 2
3 4
5
6
7 8
9
10
11
12
13
14
15
16
1718
1920
2122
23
24
25
26
27
28
29
30
31
32
3334
3536
37
38
3940
41
42
43
44
45
46
47
48
4950
5152
5354
55
56
57
58
59
60
61
62
63
64
11
s2
s11
s5
s12
Fig 1. Finite element model of the disk.
The sensor and the modal indices are shown in Fig.2a,b. The sensor indices in Fig.2a indicate that the sensors s2, s5, s11, and s12, all located at the damaged element No 9, exhibited the largest changes. The modal indices in Fig.2b show that the first mode was heavily affected by the damage.
Fig 2. Sensor and modal indices for the damaged disk.

6. CONCLUSIONS AND FUTURE DIRECTIONS The illustrated modal norm approach is based on decomposition of the system norms in terms of its modal norms. The presented results show that the method is capable to locate the damage and to provide information about the impact of the damage on the natural modes of the damaged structure. The factor which might limit the application of this method is the requirement of a number of available sensors distributed over the structure. For practical utilization in real structures, extensive testing using valid assessment of the NDE techniques is necessary. Future work in the area of rotor health monitoring will involve further analytical modeling of damaged (cracked) rotors. Since the current methods of turbine rotor health monitoring are relatively subjective, there is a need to conduct an in depth modeling campaign to predict disks behavior in the presence of cracks. Such models will increase the understanding and reduce the subjectivity of crack monitoring techniques. The results of the models can then be compared to experimental crack growth data produced using subscale, spinning disks. In addition, the models can lead to the optimization of sensor location as well as assisting in the data analysis.
REFERENCES 1. M.I. Friswell, J.E.T. Penny, and S.D. Garvey, “A combined genetic and sensitivity algorithm for the location of
damage in structures,” Computers and Structures, 69, pp. 547-556, 1998. 2. C.-P. Fritzen, D. Jennewein, and T. Kiefer, “Damage detection based on model updating methods,” Mechanical
Systems and Signal Processing, 12, pp. 163-186, 1998. 3. T. Marwala, and P.S. Heyns, “Multiple-criterion method for determining structural damage,” AIAA Journal, 36, pp.
1494-1501, 1998. 4. A. Messina, E.J. Williams, and T. Contursi, “Structural damage detection by a sensitivity and statistical-based
method,” Journal of Sound and Vibration, 216, pp. 791-808. 1998. 5. Z.Y. Shi, and S.S. Law, “Structural damage localization from modal strain energy change,” Journal of Sound and
Vibration, 218, pp. 825-844, 1998. 6. S.K. Thyagarajan, M.J. Schultz, and P.F. Pai, “Detecting structural damage using frequency response function,”
Journal of Sound and Vibration, 210, pp. 162-170, 1998. 7. W. Gawronski, and J.T. Sawicki, “Structural Damage Detection Using Modal Norms,” Journal of Sound and
Vibration, 229(1), pp. 194-198, Academic Press, 2000. 8. W. Gawronski, Dynamics and Control of Structures: A Modal Approach, Springer-Verlag, New York, 1998. 9. D. Learmount, “Engine Breakup Suspected in DC-10 Crash,” Flight International, p 4, 1989. 10. A. Gyekenyesi, J.T. Sawicki, and G.Y. Baaklini, “Application of Vibration Monitoring Techniques for Damage
Detection in Rotating Disks,” The 9th International Symposium on Transport Phenomena and Dynamics of Rotating Machinery Honolulu, Hawaii, February 10-14, 2002.
11. J.T. Sawicki, and W. Gawronski, “Balanced Model Reduction and Control of Rotor-Bearing Systems,” ASME Journal of Engineering for Gas Turbines and Power, 119, 1997.
12. K.-J. Bathe, Finite Element Procedures, Prentice Hall, Englewood Cliffs, 1996.

For the Title Page Structural Health Monitoring for On-Wing Engine Diagnostics _______________________________________________________________ G.Y. Baaklini+, D. Raulerson∗, K.D. Smith∗, A.L. Gyekenyesi∗∗, J. T. Sawicki♦, and L. Brasche++ + George Y. Baaklini, NASA Glenn Research Center, 21000 Brookpark rd. MS6-1, Brookpark, OH 44135, [email protected] ∗ Kevin D. Smith and David Raulerson, Materials & Process Engineering MS 702-06, Pratt & Whitney, P O Box 109600, West Palm Beach, Fla. 33410-9600, [email protected], and [email protected] ∗∗ Andrew L. Gyekenyesi, Ohio Aerospace Institute, 22800 Cedar Point rd., Cleveland, OH 44142, [email protected] ♦Jerzy T. Sawicki, Ph.D., P.E., Cleveland State University, 1960 East 24th Street, Cleveland, OH 44115-2425, [email protected] ++ Lisa Brasche, Iowa State University,185 Applied Sciences Complex II,1915 Scholl Road, Ames, IA 50011-3042, [email protected]

ABSTRACT
This effort is being pursued in the Propulsion System Health Management (PSHM) area of the Single Aircraft Accident Prevention under the NASA Aviation Safety Program (AvSP). The goal of the AvSP is to reduce the aircraft accident rate by a factor of five within 10 years and a factor of 10 within 20 years. The PSHM goal is to eliminate propulsion system malfunctions as a primary or contributing factor to the cause of aircraft accidents. The purpose of this work is to establish /improve the tools for engine diagnostics and prognostics for measuring deformation and damage of rotating engine components at the ground level and for intermittent or continuous monitoring in engine environment.
In this work nondestructive evaluation (NDE)- based technology is combined with model-dependent disk spin experimental simulation systems to monitor rotor damage in real time. In addition wireless eddy current is being developed for on-wing and just-in-time NDE engine inspection to provide deeper access and higher sensitivity that extends on-wing capabilities and improves inspection readiness. In the long run, these methods can establish the base for prognostic sensing while the engine is running without any overt action like inspection. This damage detection strategy includes experimentally acquired vibration- and capacitance-based displacement measurements, and analytically computed FEM- and modal norms-based models of well defined damages and critical mass imbalances in rotating disks/rotors. ______________________________________________________________________________ + George Y. Baaklini, NASA Glenn Research Center, 21000 Brookpark rd. MS6-1, Brookpark, OH 44135, [email protected] ∗ Kevin D. Smith and David Raulerson, Materials & Process Engineering MS 702-06, Pratt & Whitney, P O Box 109600, West Palm Beach, Fla. 33410-9600, [email protected], and [email protected] ∗∗ Andrew L. Gyekenyesi, Ohio Aerospace Institute, 22800 Cedar Point rd., Cleveland, OH 44142, [email protected] ♦Jerzy T. Sawicki, Ph.D., P.E., Cleveland State University, 1960 East 24th Street, Cleveland, OH 44115-2425, [email protected] ++ Lisa Brasche, Iowa State University,185 Applied Sciences Complex II,1915 Scholl Road, Ames, IA 50011-3042, [email protected]

BACKGROUND
Uncontained engine failures and engine shut downs, relatively rare occurrences, can be very costly and may lead to tragic loss of lives. In the life management strategy and practices of commercial engine hardware, the safe life design philosophy dictates minimal inspections and “inspections of opportunity”, and requires specific inspections mainly in response to a field durability issue.
Complete teardown of an engine can cost in excess of one million dollars. Hence, the capability to perform additional inspections on wing has both safety and economic benefits. Development of cost effective, on-wing inspection techniques for the detection of deformation, fatigue damage, and cracking can have significant economic and safety benefits to the engine and airline industries and the general public through the prevention of propulsion system malfunctions.
“Inspections of opportunity” includes florescent penetrant and advanced inspection techniques such as eddy current and ultrasonic scanning on engine parts when in the shop environment. In most cases, the defect of concern is fatigue cracking that may occur around complicated features and in difficult to access locations while in the on-wing configuration. To improve on-wing inspection effectiveness, requires development of both the sensor and the delivery mechanism to bring the probe to the inspection location and the proper modeling and simulation of the effect of defects for accurate remaining life estimates.
Herein, newly established disk spin simulation systems and modal norms approach to modeling are described. Also preliminary results from wireless eddy current NDE technique are being reported on. HEALTH MONITORING OF ROTATING SUBSCALE ENGINE DISKS Two dual-bearing spin systems with horizontal shafts have been built at NASA Glenn for NDE-based and model-dependent disk spin simulation and analysis in order to improve the understanding of rotor/disk health monitoring by 1) mimicking damage in engines with actual subscale experiments, 2) optimizing the use of sensors type and locations, and 3) validating different modeling approaches.
Figure 1. High temperature disk spin facility for rotor/disk health monitoring

In figure 1, one of the disk spin systems with high temperature capabilities is shown, and figure 2 shows typical results from capacitive type sensors, when monitoring tip blade displacements, due to center of mass changes initiated by deliberate mass imbalances that simulate crack initiation and propagation. Details on the disk spin systems can be found in [1].
Polar Plot (in. by in.) Magnitude Plot (in. by cycles) Phase Plot (in. by degree)
Figure 2. Display showing the results from mass imbalance tests More details on the modeling side can be found in [2] and in the following section. The NDE sensors employed in these facilities are capacitive DC type sensors for displacement measurements, eddy current and accelerometers for vibration measurements, and acoustic sensors for damage detection. MODAL NORMS APPROACH: AN EXAMPLE Different analytical approaches are used to sense and to localize damage in rotating structures. Most of these methods take advantage of the dynamic behavior of the structural model [3-9]. This work uses the modal and sensor norms, as defined in [10], to determine damage locations. The proposed approach allows localization of damaged elements within a structure, and provides information concerning the impact of the damage on the structure’s natural modes of vibration.
A crack initiating at a critical location may produce an undetectable change in the overall structural frequency response. For this reason, advanced failure detection methods are sought that can improve the detection of local structural changes in vital areas of rotating machinery [11&12].
Since the current methods of turbine rotor health monitoring are relatively subjective, there is a need to conduct an in depth modeling campaign to predict disks behavior in the presence of cracks. Such models will increase the understanding and reduce the subjectivity of crack monitoring techniques. The results of the models can then be compared to experimental crack growth data produced using subscale spinning disks as discussed in the previous section. In

addition, the models can lead to the optimization of sensor location as well as assisting in the data analysis. A disk of uniform thickness, which imitates a model of turbine disk, is rotating with constant angular velocity ω. Stresses are generated in the disk due to centrifugal forces given by 2rρ ω , where ρ is the mass density per unit volume, and r is the radial distance from the center. Treating the centrifugal force as the body force in the radial direction, a finite element analysis can be conducted. As a numerical example, a disk with an inner diameter of 5.08×10⁻² m (2 in.), an outer diameter of 0.508 m (20 in.), and uniform thickness of 0.635×10⁻² m (0.25in.) is considered. The disk is rotating at ω=1,047 rad/sec (10,000 rpm). The material properties are as follows: E=210 GPa, G=79 GPa, ν=0.28, and ρ=7700 Kg/m3. The finite element (FE) model consists of 64 shell elements, each having 6 degrees of freedom, and 80 nodes, as is shown in Fig. 3. The equivalent nodal force vector is calculated as [13]:
2rb
zr z
brdrdz
bπ
=
∫ ∫r N (1)
where N is the shape function of the elements, and br, bz are the body forces in radial and axial direction, respectively. The damage case is considered as a 20% reduction in element No. 9’s stiffness. Thirty four strain-gage sensors are placed within the first quarter of the disk. The body forces are considered the excitation forces.
-10 -8 -6 -4 -2 0 2 4 6 8 10
-10
-8
-6
-4
-2
0
2
4
6
8
10
s2
s11
s5
s12
1 2
3 4 5
6
7
8 9 10
12
13
1415
16
17
18
19
20
21
22
23
2425
26
27
28
2930
31
32
33
34
35
36
37 38
39
40 41
42
4344
45
46
47
48
49
50
51
52
53
54 55
56
57
58
59
60
61
62
63
64
65 66
67
68
69
70
71
72
73
74
75
76 77
78
79
80
1 2
3 4
5
6
7 8
9
10
11
12
13
14
15
16
1718
1920
2122
23
24
25
26
27
28
29
30
31
32
3334
3536
37
38
3940
41
42
43
44
45
46
47
48
4950
5152
5354
55
56
57
58
59
60
61
62
63
64
11
Fig 3. Finite element model of the disk The illustrated modal norm approach is based on decomposition of the
system norms in terms of its modal norms. The presented results show that the

method is capable to locate the damage and to provide information about the impact of the damage on the natural modes of the damaged structure (Figure 4).
0 5 10 15 20 25 30 350
0.05
0.1
0.15
0.2
Sensor Number
Sen
sor I
ndex
0 5 10 15 20 250
0.1
0.2
0.3
0.4
Mode Number
Mod
al In
dex
(a)
(b)
Fig 4. Sensor and modal indices for the damaged disk WIRELESS EDDY CURRENT FOR REMOTE CRACK DETECTION Coupling eddy current (EC) probe technology, with that of wireless communication, allows the insertion of the EC probe into existing access ports of jet engines. Using readily available borescope access ports, provides for internal inspections deep in the engine with un-tethered EC (Figure 7). Figure 7. Current eddy current practices showing access limitations and possible cable failures that need to be replaced with un-tethered access deep in the engine

The power source for the EC probe can be a small "watch" size battery capable of powering the RF/microwave sub system for the time necessary for a measurement. A wireless probe module with the criteria of compactness, low noise, low cost, and compatibility with selected instrumentation is being fabricated. The Design considerations for the EC remote communication include immunity to jamming, power dissipation, frequency allocations, interface to detector probe, modulation format and reliability of transmission. The technology demonstration will include eddy current functionality as well as remote communication. The goal is for the eddy current inspection sensitivity to be comparable to a current similar ‘wired’ inspection. Measurements were made in a PW2037 from port to port with and without engine rotation. Databases were taken from AP1 to the engine front, AP1 to AP2, AP2 to AP3, AP3 to AP4, AP9 to AP11 to the tail of the engine, where AP indicated “access port”. Transmission losses and “suckout” regions where transmission is very low due to resonance in the structures were identified. Phase data were corrected. Typical magnitude plots as a function of frequency are shown in figures 8 and 9 for several AP configurations. Figure 8. Magnitude plot between ports from 2 to 3 GHz
Region of interest
Results indicate that the data can be acquired in frequency bands, which are reserved for industrial, scientific and medical purposes bands, called ISM bands. Also, it was found that since the frequency, is dependent on blade size, separation, and position, which varies throughout the engine, one frequency range is not sufficient for communication between all sets of ports. The data processor design is

being studied and a prototype RF transmitting system for the remote probe is being built.
Region of interest
Figure 9. Magnitude plot between ports from 5 to 6 GHz Alert Service Bulletins (ASB), Airworthiness Directives (AD), and candidate parts with cracks have been identified for technology transition activities.
CONCLUSION The approach to health monitoring of rotating subscale engine disks adapted at NASA Glenn was briefly described. In addition, modeling cracked disks with modal norms demonstrated that the method is capable to locate the damage and to qualify its impact from changes in the natural modes of the damaged structure. These rotor/disk health-monitoring facilities can now provide the opportunities to improve the understanding of field damage issues by experimentally simulating them with a whole campaign of modeling approaches like the center of mass changes, conventional rotor dynamics, and modal norms analysis. Further, wireless eddy current (EC) was found to be feasible for remote communication and on-wing inspection deep in the engine. It was also demonstrated, that communication data between ports can be acquired in frequency bands reserved for industrial, scientific, and medical purposes, called the ISM bands. More work is planned for wireless EC inspection sensitivity to be comparable to current “wired” inspection.

REFERENCES 1. A.L. Gyekenyesi, and G.Y. Baaklini, “Rotor Health Monitoring and Damage Detection
Utilizing a Disk Spin Simulation System,” SPIE vol. 4336, pp. 160-166, March 2001. 2. J.T. Sawicki, A.L. Gyekenyesi, and G.Y. Baaklini, “Vibration-Based Diagnostics of Cracked
Rotors,” SPIE 4704, March 2002. 3. M.I. Friswell, J.E.T. Penny, and S.D. Garvey, “A combined genetic and sensitivity algorithm
for the location of damage in structures,” Computers and Structures, 69, pp. 547-556, 1998. 4. C.P. Fritzen, D. Jennewein, and T. Kiefer, “Damage detection based on model updating
methods,” Mechanical Systems and Signal Processing, 12, pp. 163-186, 1998. 5. T. Marwala, and P.S. Heyns, “Multiple-criterion method for determining structural damage,”
AIAA Journal, 36, pp. 1494-1501, 1998. 6. A. Messina, E.J. Williams, and T. Contursi, “Structural damage detection by a sensitivity and
statistical-based method,” Journal of Sound and Vibration, 216, pp. 791-808. 1998. 7. Z.Y. Shi, and S.S. Law, “Structural damage localization from modal strain energy change,”
Journal of Sound and Vibration, 218, pp. 825-844, 1998. 8. S.K. Thyagarajan, M.J. Schultz, and P.F. Pai, “Detecting structural damage using frequency
response function,” Journal of Sound and Vibration, 210, pp. 162-170, 1998. 9. W. Gawronski, and J.T. Sawicki, “Structural Damage Detection Using Modal Norms,” Journal
of Sound and Vibration, 229(1), pp. 194-198, Academic Press, 2000. 10. W. Gawronski, Dynamics and Control of Structures: A Modal Approach, Springer-Verlag,
New York, 1998. 11. A. Gyekenyesi, J.T. Sawicki, and G.Y. Baaklini, “Application of Vibration Monitoring
Techniques for Damage Detection in Rotating Disks,” The 9th International Symposium on Transport Phenomena and Dynamics of Rotating Machinery Honolulu, Hawaii, February 10-14, 2002.
12. J.T. Sawicki, and W. Gawronski, “Balanced Model Reduction and Control of Rotor-Bearing Systems,” ASME Journal of Engineering for Gas Turbines and Power, 119, 1997.
13. K.J. Bathe, Finite Element Procedures, Prentice Hall, Englewood Cliffs, 1996.

Vibration-based crack diagnosis in rotating shafts during acceleration through resonance
Jerzy T. Sawicki*1, Xi Wu∗ , George Y. Baaklini†, Andrew L. Gyekenyesi **
*Cleveland State University, Dept. of Mechanical Engineering, Cleveland, OH 44115; †NASA Glenn Research Center, 21000 Brookpark Road, MS 6-1, Cleveland, OH 44135;
**OAI/NASA Glenn Research Center, 21000 Brookpark Road, MS 6-1, Cleveland, OH 44135
ABSTRACT
The dynamic response of a cracked Jeffcott rotor passing through the critical speed with constant acceleration is investigated analytically and numerically. The nonlinear equations of motion are derived and include a simple hinge model for small cracks and Mayes’ modified function for deep cracks. The equations of mo tion are integrated in the rotating coordinate system. The angle between the crack centerline and the shaft vibration (whirl) vector is used to determine the closing and opening of the crack, allowing one to study the dynamic response with and without the rotor weight dominance. Vibration phase response is used as one of possible tools for detecting the existence of cracks. The results of parametric studies of the effect of crack depth, unbalance eccentricity orientation with respect to crack, and the rotor acceleration on the rotor’s response are presented. Keywords: crack, rotor, diagnosis, acceleration, resonance, unbalance, nonsynchronous response.
1. INTRODUCTION In recent years, there has been an increasing interest for the development of rotating machinery shaft crack detection methodologies and on-line techniques1-9. Shaft crack problems present a significant safety and loss hazard in nearly every application of modern turbomachinery, particularly in the power generation industry, but not only. Recently, the Federal Aviation Administration (FAA), following several reports of shaft cracks, called10 for additional NDE inspections of certain main rotor shafts in helicopters. Conventional NDE methods, however, have unacceptable limits. Some of these techniques are time-consuming and inconvenient for turbomachinery service testing. Almost all of these techniques require that the vicinity of the damage is known in advance, and they can provide only local information and no indication of the structural strength at a component and/or system level. Also, the effectiveness of these experimental techniques is affected by the high measurement noise levels existing in complex turbomachine structures. Therefore, the use of vibration monitoring along with vibration analysis have recently received increasing attention. An extensive review of the early literature on cracked shafts was published by Wauer11. Dimentberg3 was apparently the first to report the effect of the rotating asymmetry on the shaft lateral vibration. Henry and Okah-Avae4 presented the results of analog computer study and reported the subcritical resonance due to an interaction between the crack and the rotor’s weight. Mayes and Davies5 studied the behavior of a cracked shaft model which took into account opening and closing of the crack as a stiffness step function. Later, they extended their work and suggested a method for calculation of change in stiffness due to a deep crack6. Gasch7-8 modeled the breathing crack by a spring-loaded hinge, and numerically demonstrated a subharmonic resonance. Grabowski9 used modal approach to the problem and demonstrated numerically strong dependence of the rotor vibrational behavior on the crack position. The previously published research results focused primarily on the study of cracked shafts subjected to constant angular speed. However, it has been well recognized10 that vibration monitoring during startup or shutdown can reveal important
[email protected]; phone 1.216.433.2467; fax 1.216.977.7150

machine malfunctions, especially for machines such as aircraft engines, which are subjected to frequent starts and stops as well as high speeds and acceleration rates. The topic of transient cracked rotor response has been treated by only a few authors. Plaut et al.13 analyzed the transient response of a simply supported, rotating, Euler-Bernoulli shaft with a breathing transverse crack, during its passage through a critical speed at constant acceleration or deceleration. Recently Sekhar14-15 investigated the transient vibration response of a cracked rotor passing through its critical speed, utilizing a simple hinge model for small cracks. He made an assumption that the vibrations remain small in comparison to the sag of the rotor under its own weight. If a cracked shaft rotates slowly under the load of its own weight, then the crack will open and close once per revolution. He noted oscillations which are developed near critical speed. In this paper, the Jeffcott rotor model is analyzed and a transverse crack is assumed at the middle of the shaft. The characteristic changes in the accelerating rotor phase response due to the crack and are presented as a possible diagnostic tool for crack detection in the accelerated rotors. The criterion for the opening and closing of the crack has been developed based on the angle between the crack centerline and the shaft vibration vector which makes possible one to ignore the rotor weight-dominance assumption. Stiffness weakening effects of cracked rotor in both strong and weak axes are taken into consideration for deep cracks.
2. ROTOR AND CRACK MODEL The theoretical model, called the Jeffcott rotor, employs a flexible rotor composed of a centrally located unbalanced disk attached to a massless elastic shaft which is, in turn, mounted symmetrically on rigid bearings (see Fig. 1(a). The shaft does have a transverse crack running across its section and located close to the disk. The stiffness of the uncracked rotor system is symmetric (isotropic) and the damping due to the air resistance effect is assumed to be viscous.
Z
β
rθξ
η
ψ
sO
z
yΦ
bO
θ
ε
ω
Φ
(a) (b)
Figure 1: (a) Model of Jeffcott rotor with crack, (b) shaft and crack position described in inertial and rotating coordinate systems. The origins of the inertial (x,y,z) and body-fixed rotating (ζ,η ,ξ) coordinate frames coincide with each other and are “attached” to the center line of the bearing supports. At any instant of time, the ξ-axis remains perpendicular to the face of the crack, causing that (ζ,η,ξ) frame rotates with the same velocity as the rotor. The crack position with respect to the vibration vector is determined by angle ψ, which changes continuously with the rotor’s speed. Finally, the rotor’s unbalance eccentricity ε is oriented at constant angle β with respect to the crack or ξ-axis. For a rotor subjected to

constant acceleration α, the spin angle changes, i.e., 2
0( ) (0)2t
t tα
ωΦ = Φ + + , where 0ω is the initial speed (assumed to
be zero) and (0) βΦ = − . The opening and closing or “breathing” of the crack, as the rotor rotates, results in a periodic change in the rotor stiffness. In order to not be restricted to the weight dominance assumption, where the dynamic displacement is smaller than the rotor’s sag, the angle ψ (see Fig. 1(b)) is used to judge the opening and closing of the crack. This angle more practically describes the “breath” of the crack by taking into consideration the influence of the whirl speed on the closing and opening of crack. The rotor stiffness in the crack and cross directions can be written as8:
0 00
( )0 00
K KKf
K KKξ ξ
η η
ψ∆
= − ∆ (1)
For linearly elastic crack and rotor deflections, the changes in the stiffness Kξ∆ and Kη∆ may be assumed to be
constant. For all but very large cracks, the stiffness change Kη∆ is small and often assumed to be zero. However, in this
study, for the case of the deep crack, its effect is included assuming that6 6
KK ξ
η
∆∆ = . The steering function ( )f ψ is a
periodic function depending on both, the rotor spin and whirl speed, and is shown on Fig. 2 for small and deep cracks.
1 Open
0 90 180 270
Closed
I
II
(degree)ψ
)(ψf
Y
ξ
η
ψ
Z
CLOSED
OPEN
ψ
ORBIT OFTHE SHAFT
(a) (b)
Figure 2: Crack model; (a) the closing behavior of (I) the hinge model for small cracks and (II) Mayes’ modified function for deep
cracks, (b) opening and closing of the crack as a function of the shaft position along its orbit. For small cracks, the rectangular function for the hinge model8 is used (see Fig. 2(a)), which describes the crack’s sudden opening and closing, by switching from 1 (open) to 0 (closed). This function can be approximated by the Fourier expansion as follows:
1 2 2 2( ) cos cos3 cos5 ...2 3 5
f ψ ψ ψ ψπ π π
= + − + − (2)

In the case of deep cracks, there is a smooth transition between the opening and closing of the crack and this is reflected by the Mayes’ modified function6, i.e.,
1 cos( )
2f
ψψ
+= (3)
3. EQUATIONS OF MOTION The equations of motion for a Jeffcott rotor, with a cracked shaft, in a presence of gravity forces and unbalance excitation, and subjected to constant acceleration, can be expressed in inertial coordinate frame as follows:
2
11 12
221 22
0 0 cos sin0 0 0 sin cos
K KM z C z z MgM
K KM y C y yθ θ θ θεθ θ θ θ
+ + + = + −
& &&&& && &&&& & (4)
where z and y are the displacements of the disk. The stiffness matrix ( , )tK q (where ( ) Tz y=q ) is nonlinear, depending
not only on time, but also on the position of the shaft center along the orbit. The above equations of motion in the rotating coordinate can be written as
2
2
2
( )0 2( )0 2
cos cos sin;
sin sin cos
K f K M C MM C MC M K f K MM M C
Mg M M
ξ
η
ψ ω ω αω ξξ ξω α ψ ωω ηη η
β βεω εα
β β
− ∆ − − −− + + + − ∆ − Φ
= + + − Φ −
&& &&& &
(5)
where the transformation between the inertial and rotating coordinate frames takes the form:
cos sinsin cos
zy
ξη
Φ − Φ = Φ Φ
(6)
Incorporating the hinge model for small cracks into Eq. (5) ( 0Kη∆ = ), normalizing displacements with respect to static
deflection, and using nondimensional time yields:
2
2 2
2
2 2
2
2 2
2
2 2
1 ( ) 22 21 00 1 2 2 2 1
cos sincossin
sin
nn n n
n n n n
st stn n
st stn n
f Kω ω αω
ψ ζζωω ω ωξ ξ ξ
ωη η ηωω αζ ζω ω ω ω
ε ω ε αβ β
η ηω ω
ε ω ε αβ
η ηω ω
− ∆ − − −− ′′ ′ + + = ′′ ′ + −
+Φ
+ − Φ −;
cosβ
(7a)
where here ( )f ψ is a rectangular steering function (see Fig. 2(a)).

Similarly, one can incorporate into the equations of motion (Eq. (5)) the model for deep crack, assuming 6
KK ξ
η
∆∆ = ,
and Meyes6 modified steering function 1 cos( )
( )2
fψ
ψ+
= (see Fig. 2(a)), and write that
2
2 2
2
2 2
2
2 2
2
2
1 ( ) 22 21 00 1 ( )2 2 2 1
6
cos sincossin
sin
nn n n
n n n n
st stn n
st n
f K
f K
ω ω αωψ ζζ
ωω ω ωξ ξ ξωη η ηωω α ψζ ζω ω ω ω
ε ω ε αβ β
η ηω ω
ε ωβ
η ω
− ∆ − − −− ′′ ′ + + = ′′ ′ ∆ + − −
+Φ
+ − Φ − 2 cosst n
ε αβ
η ω
(7b)
In the above equations the following definitions and nondimensional variables were employed (see Nomenclature section):
22, , ,
2nn n
KK CK
M K Mξ α
ω ζ γω ω
∆= ∆ = = =
2 , , , , st nst st nn
Mg gt
Kξ η ω
η ξ η τ ω γτη η ωω
= = = = = =
0 0
2 2
0 0 0
, for 0
, for 02 2
t t
tt
ω ω α α ω
α γτω
= + = =
Φ = Φ + + = Φ =
2 2, , ,
, n n n n
g g g g
g g
ξ η ξ ηξ η ξ η
ω ω ω ω
ξ ξ η η
′ ′= = = =
′′ ′′= =
& &
&& &&
where
2 2
2 2 2
( ) 1 ( ) ( ) 1 ( )( ) , ( )
n n
d d d dd dt d dtτ ω τ ω
⋅ ⋅ ⋅ ⋅′ ″⋅ = = ⋅ = =
; arctanyz
θ β ψ = Φ + = Φ − (see Fig. 1(b)).
4. RESULTS AND DISCUSSION The presence of a crack on the shaft results in the stiffness variation as a function of time. In most rotor dynamic analysis, the system response is obtained in the form of steady state amplitude data at each operational speed. In the case of transient analysis, the dynamic response can be obtained using time marching techniques. In this study Runge-Kutta method was employed to numerically solve equations of motion (Eq. (7a) and (7b)). The nonlinear responses of rotor
passing through the critical speed with several values of constant angular acceleration ratios ( 2n
αγ
ω= ) and different

crack depths ( K∆ ) were evaluated. For all cases it was assumed that damping ratio 0.05ζ = and normalized unbalance
eccentricity is 0.05st
εη
= .
The change in the rotor phase response due to the acceleration and crack is presented in Fig. 4. In general, due to the crack the amplitude of the phase angle decreases for the given speed ratio and acceleration rate. In addition, it can be seen that the crack induces significant oscillations in the rotor phase response (see Fig. (4b)), especially for higher acceleration rates. Such a characteristic “saw-cut” pattern of the phase waveform can find potential application in the crack on-line detection monitoring systems.
0 0.05 0.1 0.15 0.2 0.25 0.3 0.35 0.40
50
100
150
200
250
300
350
SPEED RATIO
PH
AS
E A
NG
LE
γ = 10-4
γ = 0.8×10⁻³
γ =0.01
0 0.05 0.1 0.15 0.2 0.25 0.3 0.35 0.40
50
100
150
200
250
300
350
SPEED RATIO
PH
AS
E A
NG
LE
γ = 10-4
γ = 0.8×10⁻³
γ = 0.01
crack depth 0.4
(a) no crack (b) ∆K = 0.4
Figure 4: Phase angle of the accelerated rotor passing through the critical speed for γ =0.01, 0.8×10⁻³, and 10-4, and β = 0.
0.2 0.4 0.6 0.8 1 1.20.4
0.6
0.8
1
1.2
1.4
1.6
Speed Ratio (ω/ωn)
Am
plitu
de in
Z-d
irect
ion
0.1 0.2 0.3 0.4 0.5 0.6 0.7 0.8 0.9 1 1.1
-8
-6
-4
-2
0
2
4
6
8
10
Speed Ratio (ω/ωn)
Am
plitu
de in
Z-d
irect
ion
(a) no crack (b) ∆K = 0.32
Figure 5: Vibration amplitude in Z-direction of the accelerated rotor passing through the critical speed for γ = 0.8×10⁻³ and β = 0.
0.2 0.4 0.6 0.8 1 1.20.4
0.6
0.8
1
1.2
1.4
1.6
Speed Ratio (ω/ωn)
Vib
ratio
n A
mpl
itude
0.1 0.2 0.3 0.4 0.5 0.6 0.7 0.8 0.9 1 1.10
1
2
3
4
5
6
7
8
9
Speed Ratio (ω/ωn)
Vib
ratio
n A
mpl
itude
(a) no crack (b) ∆K = 0.32
Figure 6: Vibration amplitude of the accelerated rotor passing through the critical speed for γ = 0.8×10⁻³, β = 0 and ∆K = 0.32.
Figures 5 and 6 show nondimensional vibration amplitude in Z-direction and the overall amplitude, respectively, for the crack depth of ∆K = 0.32. It is apparent that the shaft crack reduces the stiffness of the system, shifting the resonance to a lower speed. It can be noticed the presence of sub-critical (1/3, 1/2) response peaks and large increase of vibration response at the fundamental resonance peak when the crack exists.
0.2 0.3 0.4 0.5 0.6 0.7 0.8 0.9 1 1.1 1.2-1
0
1
2
3
0.2 0.3 0.4 0.5 0.6 0.7 0.8 0.9 1 1.1 1.2-5
0
5
Am
plitu
de in
Z-d
irect
ion
0.2 0.3 0.4 0.5 0.6 0.7 0.8 0.9 1 1.1 1.2
-20
0
20
40
Speed Ratio (ω/ωn)
0.2 0.3 0.4 0.5 0.6 0.7 0.8 0.9 1 1.1 1.20
1
2
3
0.2 0.3 0.4 0.5 0.6 0.7 0.8 0.9 1 1.1 1.20
2
4
6
Vib
ratio
n A
mpl
itude
0.2 0.3 0.4 0.5 0.6 0.7 0.8 0.9 1 1.1 1.20
20
40
Speed Ratio (ω/ωn)
crack depth = 0.15
crack depth = 0.28
crack depth = 0.37
(a) (b)
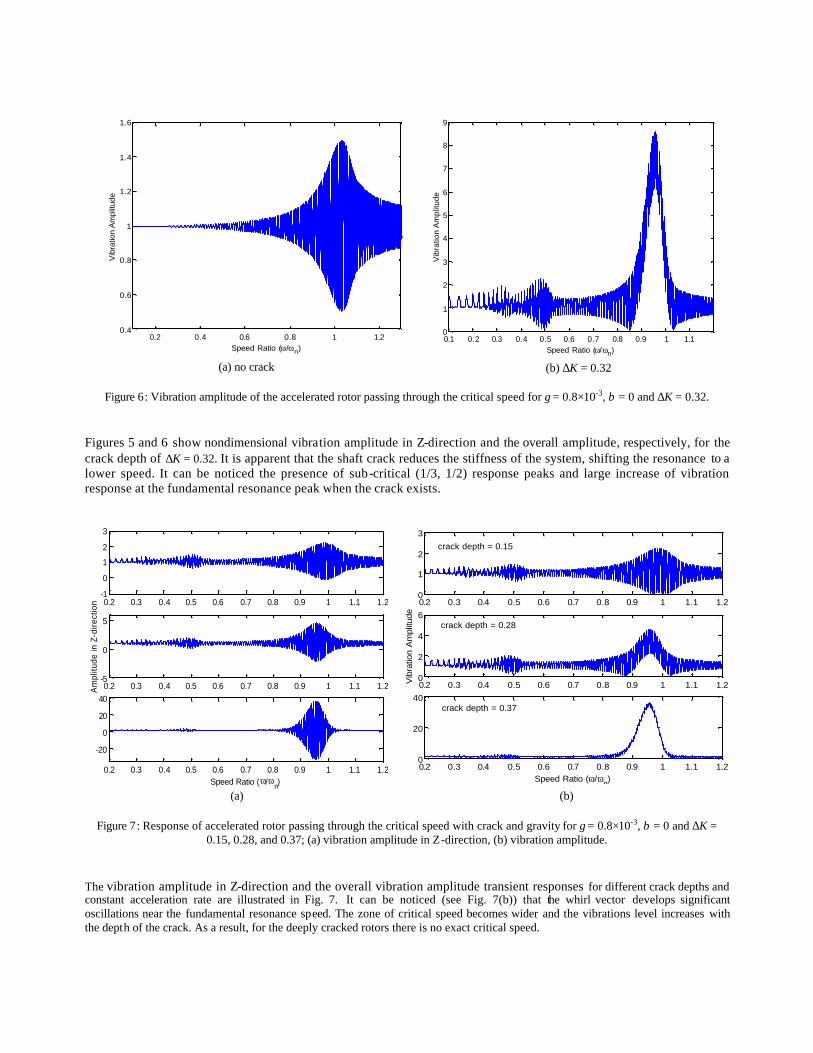
Figure 7: Response of accelerated rotor passing through the critical speed with crack and gravity for γ = 0.8×10⁻³, β = 0 and ∆K =
0.15, 0.28, and 0.37; (a) vibration amplitude in Z-direction, (b) vibration amplitude.
The vibration amplitude in Z-direction and the overall vibration amplitude transient responses for different crack depths and constant acceleration rate are illustrated in Fig. 7. It can be noticed (see Fig. 7(b)) that the whirl vector develops significant oscillations near the fundamental resonance speed. The zone of critical speed becomes wider and the vibrations level increases with the depth of the crack. As a result, for the deeply cracked rotors there is no exact critical speed.

Presentation of the rotor transient response in rotating coordinates also provides useful information. Thus, Fig. 9 shows vibration amplitude in -directionξ of the accelerated rotor passing through the critical speed for crack depths ∆K =0.32 and 0.36. In the absence of the crack the resonant vibration amplitude almost does not show-up. However, if there is a crack then the fundamental resonance is apparent and additionally the second and third harmonics are present, which is a crack-characteristic phenomenon. It can be seen that even small change in the crack depth causes that the rise of amplitude.
0.2 0.4 0.6 0.8 1 1.2 1.4 1.6-4
-2
0
2
4
6
8
10
12
14
Speed Ratio (ω/ωn)
Am
plitu
de in
ζdi
rect
ion
0.2 0.4 0.6 0.8 1 1.2 1.4 1.6-4
-2
0
2
4
6
8
10
12
14
Speed Ratio ( ω/ωn)
Am
plitu
de in
ζdi
rect
ion
0.2 0.4 0.6 0.8 1 1.2 1.4 1.6
-4
-2
0
2
4
6
8
10
12
14
Speed Ratio ( ω/ωn)
Am
plitu
de in
ζdi
rect
ion
(a) (b) (c) Figure 9: Vibration amplitude in -directionξ of the accelerated rotor passing through the critical speed for γ = 0.8×10⁻³ and β = 0; (a)
no crack, (b) ∆K = 0.32, (c) ∆K = 0.36. The effect of unbalance eccentricity orientation on vibration amplitude of a cracked rotor is shown in Fig. 10. Orientation of unbalance affects the amplitude of the fundamental resonance, but does have a little influence on the sub-harmonics. The maximum resonant vibration amplitude exists when the eccentricity vector is along the crack centerline ( 0β = ). When the unbalance is on the opposite side of the crack ( 180β = o ), then the effect of the crack is significantly diminished. In this situation, the resonance amplitude is only about 1/6 of the corresponding amplitude for the case when
0β = .
0.2 0.4 0.6 0.8 1 1.20
10
20
0.2 0.4 0.6 0.8 1 1.20
10
20
Vib
ratio
n A
mpl
itude
0.2 0.4 0.6 0.8 1 1.20
2
4
Speed Ratio (ω/ωn)
β = 0°
β = 90°
β = 180°
Figure 10: The effect of eccentricity orientation on vibration amplitude of a cracked rotor for 0, 90 and 180β = o o o , 0.35K∆ = , and γ = 0.8×10⁻³.
5. CONCLUSIONS The presence of a crack in the shaft of the rotor system affects the dynamic response significantly. The changes of vibrational behavior can be used to predict and/or detect the crack in the shaft. The following conclusions can be drawn based on the results presented in this paper: 1. The developed model enables to study the cracked rotor dynamic response with and without weight dominance. The
model includes small and deep cracks, as well as cross stiffness effect (for deep cracks). 2. Characteristics “saw-cut” pattern in the phase response waveform can find potential application in the on-line crack
detection monitoring systems. 3. The crack reduces stiffness of the system, shifting the resonance to lower speeds. This effect is magnified by the
depth of the crack. It can be noticed the presence of subcritical (1/3, ½) response peaks and large increase of fundamental vibration response when the crack exists.
4. For the accelerating rotor the zone of critical speed becomes wider and the vibration level increases with the depth of the crack. The whirl vector develops oscillation near the critical speed.
5. The orientation of unbalance eccentricity with respect to the crack centerline affects fundamental resonance and does have much less effect on subharmonics.
NOMENCLATURE
C external damping coefficient g gravitational acceleration K uncracked shaft stiffness Kξ cracked shaft stiffness in ξ -direction
Kη cracked shaft stiffness in η -direction
M mass of the disk
bO position of bearing centers line
sO shaft center
,z y , ,Z Y inertial coordinate system; ,st stZ z Y yη η= = α constant angular acceleration β angle between ξ and unbalance
γ acceleration ratio; 2nγ α ω=
K∆ stiffness change ratio ( /K Kξ= ∆ )
Kξ∆ variation of stiffness in ξ -direction caused by crack
Kη∆ variation of stiffness in η -direction caused by crack
ε unbalance eccentricity of the disk ζ external damping ratio
stη static deflection of uncracked rotor; 2st ngη ω=
θ orientation of unbalance eccentricity with respect to and z-axis
rθ whirling angle corresponding to whirling speed ,ξ η rotating coordinate system; ξ is in the crack direction
ψ angle between ξ and the line connecting bearing and shaft center Φ angle between ξ and z axes ω angular velocity of rotation
nω critical speed of uncracked rotor

REFERENCES 1. Bently Nevada, “Early Shaft Crack Detection on Rotating Machinery Using Vibration Monitoring and Diagnostics,”
Technical Bulletin No. L1036-00, No. 1, 1986. 2. I. Imam, et al., “Development of an On-Line Crack Detection and Monitoring System,” ASME Journal of
Vibration, Acoustics, Stress, and Reliability in Design, 111, pp. 241-250, 1989. 3. F.M. Dimentberg, “Flexural Vibration of Rotating Shafts,” Butterworth, London, 1961. 4. T.A. Henry and B.E. Okah-Avae, “Vibrations in Cracked Shafts,” Paper C162/76, Proc. of I.Mech.E. Conference on
Vibrations in Rotating Machinery, pp. 15-19, 1976. 5. I.W. Mayes and W.G.R. Davies, “The Vibrational Behaviour of a Rotating Shaft System Containing a Transverse
Crack,” Paper C168/76, Proc. of I.Mech.E. Conference on Vibrations in Rotating Machinery, pp. 53-64, 1976. 6. I.W. Mayes and W.G.R. Davies, “Analysis of the Response of a Multi-Rotor-bearing System Containing a
Transverse Crack in a Rotor,” ASME Journal of Vibration, Acoustics, Stress, and Reliability in Design, 106, pp 139-145, 1984.
7. R. Gasch, “Dynamic Behavior of a Simple Rotor with a Cross-sectional Crack”, Paper C178/76, Proc of I.Mech.E. Conference on Vibrations in Rotating Machinery, pp. 123-128, 1976.
8. R. Gasch, “A Survey of the Dynamic Behavior of a Simple Rotating Shaft with a Transverse Crack,” Journal of Sound and Vibration, 160(2), pp. 313-332, 1993.
9. B. Grabowski, “The Vibrational Behavior of a Turbine Rotor Containing a Transverse Crack,” ASME Journal of Mechanical Design, Vol. 102, pp. 140-146, 1980.
10. Sawicki, J.T., “Some Advances in Diagnostics of Rotating Machinery Malfunctions,” Invited Paper, Proc. of International Symposium on Machine Condition Monitoring and Diagnosis, The Japan Society of Mechanical Engineers, pp. 138-144, 2002.
11. Federal Aviation Administration, “Rules Docket No. 2001-SW-01-AD,” Federal Register, March 2, 2001. 12. J. Wauer, “On the Dynamics of Cracked Rotors: A Literature Survey,” Applied Mechanics Review, 43(1), pp. 13-17,
1990. 13. R.H. Plaut, R.H. Andruet, and S. Suherman, “Behavior of a Cracked Rotating Shaft During Passage Through a
Critical Speed,” Journal of Sound and Vibration , 173(5), pp. 577-589, 1994. 14. A.S. Sekhar and B.S. Prabhu, “Transient Analysis of Cracked Rotor Passing Through Critical Speed,” Journal of
Sound and Vibra tion, 173(3), pp. 415-421, 1994. 15. A.S. Sekhar and B.S. Prabhu, “Condition Monitoring of Cracked Rotors Through Transient Response,” Mechanism
and Machine Theory, 33(8), pp. 1167-1175, 1998.

Andrew L. GyekenyesiOhio Aerospace Institute, Brook Park, Ohio
Jerzy T. SawickiCleveland State University, Cleveland, Ohio
George Y. BaakliniGlenn Research Center, Cleveland, Ohio
Vibration Based Crack Detectionin a Rotating DiskPart 1—An Analytical Study
NASA/TM—2003-212624
September 2003

The NASA STI Program Office . . . in Profile
Since its founding, NASA has been dedicated tothe advancement of aeronautics and spacescience. The NASA Scientific and TechnicalInformation (STI) Program Office plays a key partin helping NASA maintain this important role.
The NASA STI Program Office is operated byLangley Research Center, the Lead Center forNASA’s scientific and technical information. TheNASA STI Program Office provides access to theNASA STI Database, the largest collection ofaeronautical and space science STI in the world.The Program Office is also NASA’s institutionalmechanism for disseminating the results of itsresearch and development activities. These resultsare published by NASA in the NASA STI ReportSeries, which includes the following report types:
• TECHNICAL PUBLICATION. Reports ofcompleted research or a major significantphase of research that present the results ofNASA programs and include extensive dataor theoretical analysis. Includes compilationsof significant scientific and technical data andinformation deemed to be of continuingreference value. NASA’s counterpart of peer-reviewed formal professional papers buthas less stringent limitations on manuscriptlength and extent of graphic presentations.
• TECHNICAL MEMORANDUM. Scientificand technical findings that are preliminary orof specialized interest, e.g., quick releasereports, working papers, and bibliographiesthat contain minimal annotation. Does notcontain extensive analysis.
• CONTRACTOR REPORT. Scientific andtechnical findings by NASA-sponsoredcontractors and grantees.
• CONFERENCE PUBLICATION. Collectedpapers from scientific and technicalconferences, symposia, seminars, or othermeetings sponsored or cosponsored byNASA.
• SPECIAL PUBLICATION. Scientific,technical, or historical information fromNASA programs, projects, and missions,often concerned with subjects havingsubstantial public interest.
• TECHNICAL TRANSLATION. English-language translations of foreign scientificand technical material pertinent to NASA’smission.
Specialized services that complement the STIProgram Office’s diverse offerings includecreating custom thesauri, building customizeddatabases, organizing and publishing researchresults . . . even providing videos.
For more information about the NASA STIProgram Office, see the following:
• Access the NASA STI Program Home Pageat http://www.sti.nasa.gov
• E-mail your question via the Internet [email protected]
• Fax your question to the NASA AccessHelp Desk at 301–621–0134
• Telephone the NASA Access Help Desk at301–621–0390
• Write to: NASA Access Help Desk NASA Center for AeroSpace Information 7121 Standard Drive Hanover, MD 21076

Andrew L. GyekenyesiOhio Aerospace Institute, Brook Park, Ohio
Jerzy T. SawickiCleveland State University, Cleveland, Ohio
George Y. BaakliniGlenn Research Center, Cleveland, Ohio
Vibration Based Crack Detectionin a Rotating DiskPart 1—An Analytical Study
NASA/TM—2003-212624
September 2003
National Aeronautics andSpace Administration
Glenn Research Center
Acknowledgments
The authors would like to thank Richard Martin, Cleveland State University, for his technical support during theassembly of the disk spin system to be utilized in the upcoming experimental verification study.
Available from
NASA Center for Aerospace Information7121 Standard DriveHanover, MD 21076
National Technical Information Service5285 Port Royal RoadSpringfield, VA 22100
This report contains preliminaryfindings, subject to revision as
analysis proceeds.
Available electronically at http://gltrs.grc.nasa.gov

NASA/TM—2003-212624 1
Vibration Based Crack Detection in a Rotating Disk Part 1—An Analytical Study
Andrew L. Gyekenyesi
Ohio Aerospace Institute Brook Park, Ohio
Email: [email protected]
Jerzy T. Sawicki Cleveland State University
Department of Mechanical Engineering Cleveland, Ohio
Email: [email protected]
George Y. Baaklini National Aeronautics and Space Administration
Glenn Research Center Cleveland, Ohio
Email: [email protected]
Abstract This paper describes the analytical results concerning the detection of a crack in a rotating disk. The
concept of the approach is based on the fact that the development of a disk crack results in a distorted strain field within the component. As a result, a minute deformation in the disk’s geometry as well as a change in the system’s center of mass occurs. Finite element analyses were conducted concerning a notched disk in order to define the sensitivity of the method. The notch was used to simulate an actual crack and will be the method utilized for upcoming experiments. Various notch sizes were studied. The geometric deformations and shifts of center of mass were documented as a function of rotational speed. In addition, a rotordynamic analysis of a 2-bearing, disk and shaft system was conducted. The overall response of the system was required in order to design the experimental system for operation beyond the first critical. The results of the FE analyses of the disk indicated that the overall changes in the disk’s geometry and center of mass were rather small. The difference between the maximum centrifugal radial displacements between the undamaged and damaged disks at 8000 RPM was 0.00014 in. for a 0.963 in. notch length. The shift in center of mass was also of this magnitude. The next step involves running experiments to verify the analysis.
Introduction
Rotor health monitoring and on-line damage detection are increasingly gaining the interest of manufacturers of aircraft engines. This is primarily due to the fact that there is a necessity for improved safety during operation as well as a need for lower maintenance costs. Applied techniques for damage detection and health monitoring of rotors are essential for engine safety, reliability and life prediction. Recently, the United States set the ambitious goal of reducing the fatal accident rate for commercial aviation by 80% within ten years [1]. In turn, the National Aeronautics and Space Administration (NASA) in collaboration with Federal Aviation Administration (FAA) and other federal agencies, universities, as well as airline and aircraft industries, responded by developing the Aviation Safety Program (AvSP). The AvSP provides research and technology products needed to help the aerospace

NASA/TM—2003-212624 2
industry achieve the challenge to improve aviation safety. The Nondestructive Evaluation (NDE) Group at the NASA Glenn Research Center at Lewis Field in Cleveland, Ohio is currently addressing the development of propulsion system specific technologies intended to detect damage prior to catastrophe under the propulsion health management task.
Currently, the NDE group is assessing the feasibility of utilizing real-time vibration data for detecting cracks in turbine disks. The data is obtained from radial blade tip clearance and shaft clearance measurements using capacitive or eddy current probes. The concept of the approach is based on the fact that the development of a disk crack results in a distorted strain field within the component. This, in turn, causes a small deformation in the disk’s geometry as well as a possible change in the system’s center of mass. The geometric change and the center of mass shift are indirectly characterized by monitoring the amplitude and phase of the first harmonic (i.e., the 1x component) of the vibration data. Spin pit experiments and full scale engine tests have been conducted while monitoring for crack growth using the above crack detection methodology [2, 3]. Even so, published data is extremely limited and the basic foundation of the methodology has not been fully studied. This foundation should include a theoretical basis and experimental data to support the models. In addition, the few tests that claimed success have been limited mostly to the spin pit facilities. In spin pits, a vertical, hanging shaft is utilized with only the top having a bearing support. The disk or disks of interest are usually located near the bottom end of the shaft. Because the bottom end of the shaft is unconstrained, it is relatively free to move as a result of any dynamic forces. Therefore, it is assumed that any physical changes in the rotor will induce larger displacement variations in a spin pit set-up than in a more constrained, two bearing system. The analytical model studied here, and the upcoming related experiments, deal with a horizontal shaft supported with end bearings and a centrally located disk. It should be noted that this system is somewhat unique in the arena of spin testing due to the fact that the horizontal shaft is supported by bearings on both ends of the rotor. This is a more realistic representation of an actual turbine as compared to a traditional spin pit.
As mentioned above, the crack detection methodology has only been characterized in a subjective fashion. In addition, the methodology is lacking an in depth modeling campaign. A deeper understanding of the relationship between damage progression and the change in the rotor’s center of mass due to the geometric modifications of the damaged disk can be achieved with the implementation of subscale rotor tests with controlled damage levels. The objectives of this study included the design of an optimal subscale disk to represent a full scale turbine disk; finite element analyses of undamaged and damaged disks in order to define the disk’s deformation and the resulting shift in center of mass; and rotordynamic modeling of the complete disk and shaft assembly to confirm operation beyond the first critical. The analytical results will be verified in an upcoming experimental study focusing on the design of the laboratory and the implementation of unique and innovative sensors along with the accompanying acquisition/analysis software packages.
Finite Element Analysis: Disk Design and Damage Behavior The finite element analyses had two goals. The first goal was to design a disk that will achieve the
experimental objectives of flaw detection and at the same time be representative of an actual bladed, turbine disk. The second goal was to understand the behavior of the isolated disk as a function of damage state. For this study, the damage was in the form of a notch to be placed in a high stress area of the disk. Such a location allows for maximum geometric deformation. Plots of the maximum radial displacement and shift in center of mass while imposing centrifugal loads were constructed as functions of notch characteristics and rotational speed. Notch tip stresses were documented and will be utilized to define the load limits during the experimental stage of the continuing study.
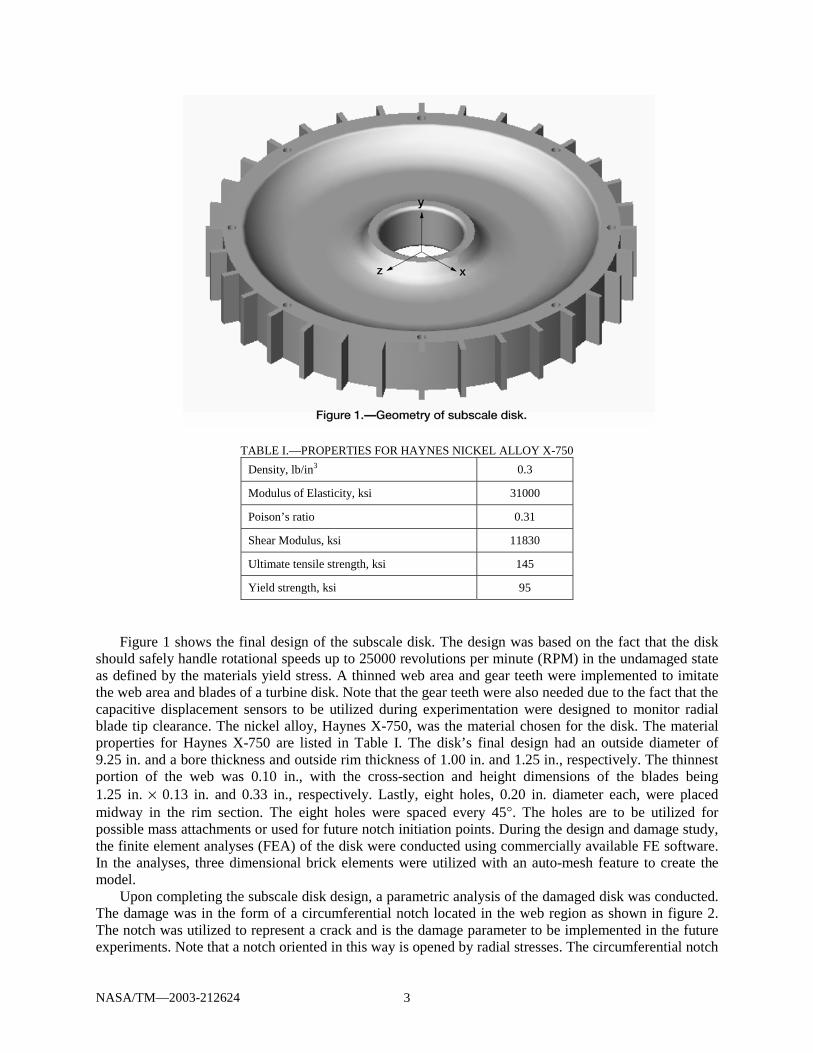
NASA/TM—2003-212624 3
TABLE I.—PROPERTIES FOR HAYNES NICKEL ALLOY X-750
Density, lb/in3 0.3
Modulus of Elasticity, ksi 31000
Poison’s ratio 0.31
Shear Modulus, ksi 11830
Ultimate tensile strength, ksi 145
Yield strength, ksi 95
Figure 1 shows the final design of the subscale disk. The design was based on the fact that the disk should safely handle rotational speeds up to 25000 revolutions per minute (RPM) in the undamaged state as defined by the materials yield stress. A thinned web area and gear teeth were implemented to imitate the web area and blades of a turbine disk. Note that the gear teeth were also needed due to the fact that the capacitive displacement sensors to be utilized during experimentation were designed to monitor radial blade tip clearance. The nickel alloy, Haynes X-750, was the material chosen for the disk. The material properties for Haynes X-750 are listed in Table I. The disk’s final design had an outside diameter of 9.25 in. and a bore thickness and outside rim thickness of 1.00 in. and 1.25 in., respectively. The thinnest portion of the web was 0.10 in., with the cross-section and height dimensions of the blades being 1.25 in. × 0.13 in. and 0.33 in., respectively. Lastly, eight holes, 0.20 in. diameter each, were placed midway in the rim section. The eight holes were spaced every 45°. The holes are to be utilized for possible mass attachments or used for future notch initiation points. During the design and damage study, the finite element analyses (FEA) of the disk were conducted using commercially available FE software. In the analyses, three dimensional brick elements were utilized with an auto-mesh feature to create the model.
Upon completing the subscale disk design, a parametric analysis of the damaged disk was conducted. The damage was in the form of a circumferential notch located in the web region as shown in figure 2. The notch was utilized to represent a crack and is the damage parameter to be implemented in the future experiments. Note that a notch oriented in this way is opened by radial stresses. The circumferential notch

NASA/TM—2003-212624 4
was chosen on the assumption that it would cause the most dramatic change in radial displacement and change in center of mass. The notch width of 0.15 in. was based on the wire thickness and burn area of the electrical discharge machining (EDM) wire.
Figure 2 and Table II list the dimensions associated with the various notch lengths studied. For all cases, the radial distance from the disk center to the plane of the notch was 2.12 in. This corresponded to the location of the maximum radial stress as obtained utilizing the FE stress analysis of the undamaged disk. Figure 3 shows the stress state at the notch tip as a function of notch length and the disk’s rotational speed in terms of RPM. The results of the figure will be utilized in defining the experimental notch length and disk speed required to maintain a safe test environment.
TABLE II.—NOTCH DIMENSIONS UTILIZED FOR FINITE ELEMENT ANALYSIS
Angle, degrees 6 12 18 24 26 28 32
Length, in. 0.222 0.444 0.666 0.888 0.962 1.036 1.184
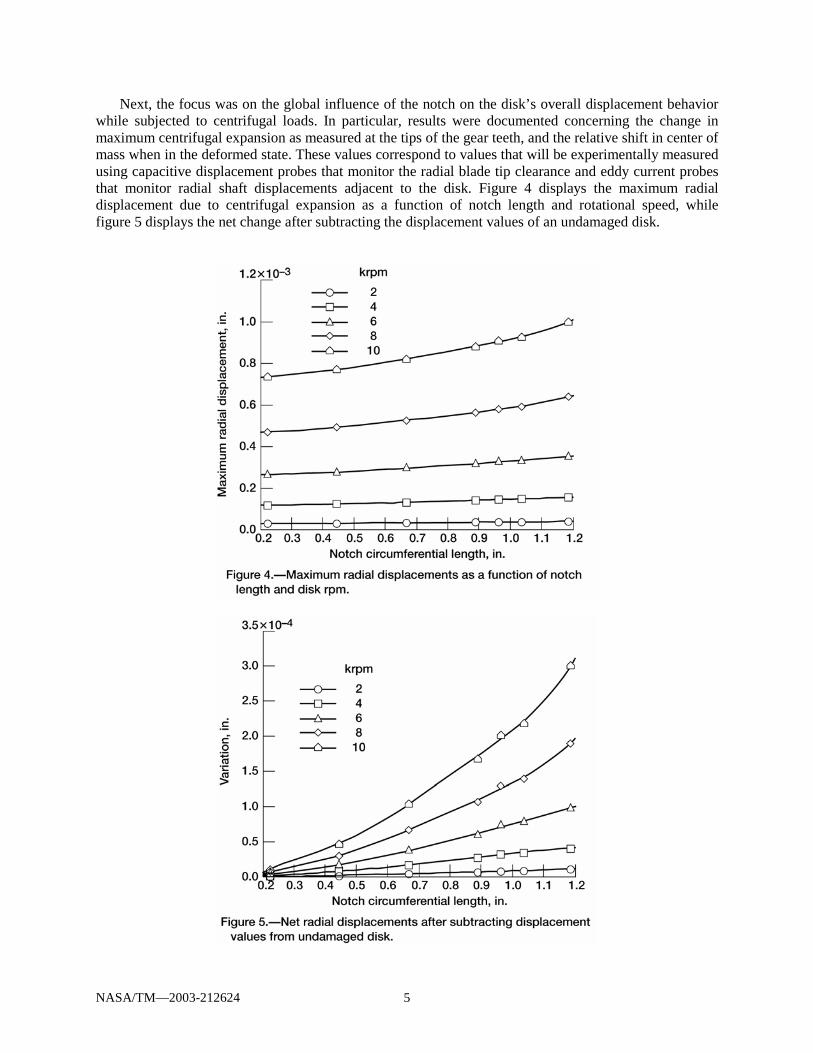
NASA/TM—2003-212624 5
Next, the focus was on the global influence of the notch on the disk’s overall displacement behavior while subjected to centrifugal loads. In particular, results were documented concerning the change in maximum centrifugal expansion as measured at the tips of the gear teeth, and the relative shift in center of mass when in the deformed state. These values correspond to values that will be experimentally measured using capacitive displacement probes that monitor the radial blade tip clearance and eddy current probes that monitor radial shaft displacements adjacent to the disk. Figure 4 displays the maximum radial displacement due to centrifugal expansion as a function of notch length and rotational speed, while figure 5 displays the net change after subtracting the displacement values of an undamaged disk.

NASA/TM—2003-212624 6
Viewing figures 4 and 5, it was apparent that the notch induced changes in maximum displacement
were rather small. For example, the net change in the maximum radial displacement of a notched disk (notch length = 0.962 in.) at 8000 RPM was 0.00014 in. This particular set of parameters was of interest due to the fact that it will be experimentally feasible to test these conditions since the notch tip stress was maintained below the yield strength of the material (see figure 3).
Next, parameters from the FE model (e.g., the mass matrix and node displacements while in the deformed state) were utilized together with the equations of basic engineering mechanics to calculate the disk’s shift in center of mass [4]. Figure 6 shows the approximate shift in the center of mass as a function of notch length and rotational speed. The values were similar in scale to the net change in radial displacement (see figure 5). Therefore, the global influence of the notch was revealed both in the deformation of the disk, as indicated by the change in the disk’s maximum radial displacement, and in the isolated disk’s center of mass shift. If other factors relating to the single disk system studied here were to remain unchanged (e.g., shaft, bearings, etc.), the change in the disk’s center of mass should equivalently influence the center of mass shift for the total rotor system.
Rotordynamic Analysis
The following rotordynamic analysis was conducted to further understand the dynamic behavior of the experimental set-up. In most aviation based turbines, the system is expected to operate at some speed above the first critical. The disk spin simulation system being assembled for this continuing study consists of a shaft having a diameter of 0.79 in. and a length of 30.75 in., supported by precision angular contact ball bearings that are assumed to provide isotropic stiffness. The single disk, as seen in figure 1, is mounted at the mid-span of the shaft. The disk’s diametral and polar moments of inertia are 63.27 and 126.53 lbm-in2, respectively. The weight of the disk is 10.75 lbf.

NASA/TM—2003-212624 7
The equations of motion for the rotor system are
( ) ( )Mq C q Kq F t+ Ω + =&& & (1) where q denotes the displacement vector; M is the symmetric mass matrix; C(Ω) is an asymmetric matrix that includes an antisymmetric, speed-dependent gyroscopic matrix; and K is the symmetric stiffness matrix. The right hand side of equation (1) represents the force excitation vector resulting from the system’s residual imbalance as well as any additional imbalance that may result from the disk damage (i.e., notch).
The system’s natural frequencies are the result of the solution of homogeneous version of equation (1), and can be written as
i i iu jvλ = − + (2) or, in a single degree of freedom form as
21
i dii di
i
jξ ωλ ω
ξ= − ±
− (3)
where di iω ν= is the ith damped natural frequency, and 2 2i
ii
i
u
u vξ =
+ the corresponding modal damping
ratio. The values of diω are directly used for the construction of the whirl speed map (i.e., Campbell diagram). The real part of iλ indicates the possible instability of the system.
Figure 7 is the Campbell diagram for the current experimental system. The intersection points of synchronous excitation line 1X with the loci of natural frequencies determine the critical speeds. It should be noted that the rotor set-up utilized here resembles a Jeffcott rotor [5] with the rigid disk located at the center of the flexible shaft, and therefore, the translational and rotational motions were statically and dynamically decoupled. Concerning the translational motion, the first two natural frequencies of whirl (forward and backward) were independent of the rotor spin speed due to the absence of gyroscopic moments. The first synchronous critical speed, i.e., the rotor spin speed associated with a resonance condition, was 2610 RPM. During this condition, the maximum shaft displacement was at the shaft midpoint as seen in Figure 8. The second forward critical speed was at 28153 RPM. This value was beyond the operational speed of the test system which is approximately 10000 RPM. Figure 9 displays the amplitude and phase of the 1x component in the form of Bode plots. The first critical at 2610 RPM is indicated by the frequency at which the amplitude peaks and a phase inversion occurs. Also, note that for this particular system that the radial displacements at the disk location settled to a relatively constant value after the first critical speed was traversed.

NASA/TM—2003-212624 8

NASA/TM—2003-212624 9
The critical speed map, which plots the critical speeds of the system versus the range of bearing stiffness, is presented in figure 10. It is a log-log plot showing the variation of critical speeds for a bearing stiffness range of 1×10³ to 1×10⁷ lb/in. Note that for values above a stiffness of 1×10⁷ lb/in., the first critical speed did not increase.
Based on the results of the rotordynamic analysis, the experimental system was correctly assembled to operate beyond the first critical speed. Note that the second critical speed was defined by the shaft having an “S” shape with zero displacements at the shaft mid-point and the end bearings. Therefore, similar to the Jeffcott rotor analysis [5], the system’s synchronous radial displacement at the center of the shaft should stay constant beyond the first critical and be a function of the system’s residual imbalance. It has been proposed that a cracked disk may have a changing imbalance due to the crack opening as a function of rotational speed [2]. This is contrary to the assumption of a rigid disk. As a result, the amplitude of the synchronous displacement may grow as a function of speed when operating beyond the first critical as opposed to being constant. This also will be explored during the experimentation as a possible indicator of disk damage. An upcoming analytical study by the authors will address the speed dependence of the disk’s eccentricity vector and the influence it may have on the post critical speed behavior.
Based on the results of the rotordynamic analysis, the experimental system was correctly assembled to operate beyond the first critical speed. Note that the second critical speed was defined by the shaft having an “S” shape with zero displacements at the shaft mid-point and the end bearings. Therefore, similar to the Jeffcott rotor analysis [5], the system’s synchronous radial displacement at the center of the shaft should stay constant beyond the first critical and be a function of the system’s residual imbalance. It has been proposed that a cracked disk may have a changing imbalance due to the crack opening as a function of rotational speed [2]. This is contrary to the assumption of a rigid disk. As a result, the amplitude of the synchronous displacement may grow as a function of speed when operating beyond the first critical as opposed to being constant. This also will be explored during the experimentation as a possible indicator of disk damage. An upcoming analytical study by the authors will address the speed dependence of the disk’s eccentricity vector and the influence it may have on the post critical speed behavior.

NASA/TM—2003-212624 10
Conclusions
Due to an increased interest concerning the health monitoring of cracked disks in turbine engines, a study was required to address the feasibility of utilizing vibration data as a tool for recognizing disk damage prior to catastrophic failure. The concept of the approach is based on the fact that the development of a disk crack results in a distorted strain field within the component. This may cause a measurable deformation in the disk’s geometry and a corresponding change in the system’s center of mass. The geometric change and the center of mass shift are indirectly characterized by monitoring the amplitude and phase of the first harmonic (i.e., the 1x component) of the vibration data. The experimental data can be captured by monitoring displacements at either the shaft or blade tips. Because of the limited publications concerning the technique and the lack of a basic methodology, the authors undertook the task of conducting a modeling campaign as well as preparing the ground work for the experimentation.
The objectives were met by designing a subscale disk and analyzing the stress states in the undamaged state and the notched condition. The disk’s maximum radial displacements and shifts in center of mass were defined as functions of notch length and rotational speed. It was seen that the relative changes in these parameters were on the order of 0.00014 in. for a 0.962 in. notch in the web area of the disk while rotating at 8000 RPM. This value is close to the resolution limits of the displacement sensors to be used during the experimentation. The rotordynamic analysis revealed that the experimental system’s first critical, assuming a flexible shaft and rigid disk, is 2610 RPM. At this point, it is assumed that the experiments will be operated in the range of 0 to 8000 RPM. This allows for plenty of post critical operation and at the same time staying within the notched disk’s material limits.
Upcoming studies from the authors concerning this topic, will include an in depth experimental study to verify the above analytical results as well as modifying the Jeffcott rotor analysis to include a speed dependent eccentricity vector for the disk. As mentioned above the finite element modeling effort indicated relatively small global deformations close to the resolution limits of the existing sensors. The subscale experiments, with the inclusion of naturally existing mechanical and electronic noise, will help define the true sensitivity of the damage detection methodology.
References 1. Shin, J., “The NASA Aviation Safety Program Overview,” Proceedings of ASME Turbo Expo 2000,
May 8-11, 2000, Munich, Germany. 2. Haase, W.C., and Drumm, M.J., “Detection, Discrimination, and Real-Time Tracking of Cracks in
Rotating Disks,” SPIE’s NDE and Health Monitoring of Aerospace Materials and Civil Infrastructures, San Diego, California, March, 2002.
3. Sonnichsen, H.E., and Milatovic, B., “Detecting Anomalies in Rotating Components,” United States Patent 6456945 B1, September 24, 2002.
4. Beer, F.P. and Johnston, Jr., E.R., “Vector Mechanics for Engineers,” New York, McGraw-Hill Book Company, 1984.
5. Vance, J.M., “Rotordynamics of Turbomachinery,” New York, A Wiley-Interscience Publication, 1988.

This publication is available from the NASA Center for AeroSpace Information, 301–621–0390.
REPORT DOCUMENTATION PAGE
2. REPORT DATE
19. SECURITY CLASSIFICATION OF ABSTRACT
18. SECURITY CLASSIFICATION OF THIS PAGE
Public reporting burden for this collection of information is estimated to average 1 hour per response, including the time for reviewing instructions, searching existing data sources,gathering and maintaining the data needed, and completing and reviewing the collection of information. Send comments regarding this burden estimate or any other aspect of thiscollection of information, including suggestions for reducing this burden, to Washington Headquarters Services, Directorate for Information Operations and Reports, 1215 JeffersonDavis Highway, Suite 1204, Arlington, VA 22202-4302, and to the Office of Management and Budget, Paperwork Reduction Project (0704-0188), Washington, DC 20503.
NSN 7540-01-280-5500 Standard Form 298 (Rev. 2-89)Prescribed by ANSI Std. Z39-18298-102
Form Approved
OMB No. 0704-0188
12b. DISTRIBUTION CODE
8. PERFORMING ORGANIZATION REPORT NUMBER
5. FUNDING NUMBERS
3. REPORT TYPE AND DATES COVERED
4. TITLE AND SUBTITLE
6. AUTHOR(S)
7. PERFORMING ORGANIZATION NAME(S) AND ADDRESS(ES)
11. SUPPLEMENTARY NOTES
12a. DISTRIBUTION/AVAILABILITY STATEMENT
13. ABSTRACT (Maximum 200 words)
14. SUBJECT TERMS
17. SECURITY CLASSIFICATION OF REPORT
16. PRICE CODE
15. NUMBER OF PAGES
20. LIMITATION OF ABSTRACT
Unclassified Unclassified
Technical Memorandum
Unclassified
National Aeronautics and Space AdministrationJohn H. Glenn Research Center at Lewis FieldCleveland, Ohio 44135–3191
1. AGENCY USE ONLY (Leave blank)
10. SPONSORING/MONITORING AGENCY REPORT NUMBER
9. SPONSORING/MONITORING AGENCY NAME(S) AND ADDRESS(ES)
National Aeronautics and Space AdministrationWashington, DC 20546–0001
Available electronically at http://gltrs.grc.nasa.gov
September 2003
NASA TM—2003-212624
E–14182
WBS–22–728–30–06
16
Vibration Based Crack Detection in a Rotating DiskPart 1—An Analytical Study
Andrew L. Gyekenyesi, Jerzy T. Sawicki, and George Y. Baaklini
Health monitoring; Crack detection; Center of mass
Unclassified -UnlimitedSubject Categories: 31, 05, 07, 35, and 03 Distribution: Nonstandard
Andrew L. Gyekenyesi, Ohio Aerospace Institute, Brook Park, Ohio 44142; Jerzy T. Sawicki, Cleveland StateUniversity, Cleveland, Ohio 44115; and George Y. Baaklini, NASA Glenn Research Center. Responsible person,Andrew L. Gyekenyesi, organization code 5520, 216–433–8155.
This paper describes the analytical results concerning the detection of a crack in a rotating disk. The concept of theapproach is based on the fact that the development of a disk crack results in a distorted strain field within the compo-nent. As a result, a minute deformation in the disk’s geometry as well as a change in the system’s center of massoccurs. Finite element analyses were conducted concerning a notched disk in order to define the sensitivity of themethod. The notch was used to simulate an actual crack and will be the method utilized for upcoming experiments.Various notch sizes were studied. The geometric deformations and shifts of center of mass were documented as afunction of rotational speed. In addition, a rotordynamic analysis of a 2-bearing, disk and shaft system was con-ducted. The overall response of the system was required in order to design the experimental system for operationbeyond the first critical. The results of the FE analyses of the disk indicated that the overall changes in the disk’sgeometry and center of mass were rather small. The difference between the maximum centrifugal radial displace-ments between the undamaged and damaged disks at 8000 rpm was 0.00014 in. for a 0.963 in. notch length. The shiftin center of mass was also of this magnitude. The next step involves running experiments to verify the analysis.

ISCORMA-2, Gdansk, Poland, 4-8 August 2003
1
Dynamic Analysis of a Dual Rotor-Bearing System in Support of the TF-41 Seeded-Fault Testing
Jerzy T. Sawicki Rotor-Bearing Dynamics & Diagnostics Laboratory, Fenn College of Engineering
Cleveland State University, Cleveland, OH 44115, U.S.A.
John P. Gyekenyesi NASA Glenn Research Center, 21000 Brookpark Road, Cleveland, OH 44135 , U.S.A.
George Y. Baaklini
NASA Glenn Research Center, 21000 Brookpark Road, Cleveland, OH 44135 , U.S.A.
Andrew L. Gyekenyesi NASA Glenn Research Center, 21000 Brookpark Road, Cleveland, OH 44135 , U.S.A.
ABSTRACT This paper presents the partial results of a dynamic analysis in combination with baseline experimental data of a two-spool TF-41, gas turbine aircraft engine. The engine was utilized for a government sponsored seeded fault test. By implementing a seeded fault in the form of a crack emulating from a notch into the fan stage disk, new sensor technologies were assessed in their ability to identify disk cracks in real time. The critical speed analysis of the complex engine conducted within this paper was in support of the vibration data captured during the full-scale fault tests. Comparisons were conducted between the critical speeds predicted by the model and the apparent critical speeds obtained from displacement sensors monitoring the fan blade tip clearance in the radial direction. Both the analysis and the experimental data indicated multiple critical speeds in the domains of operation, although, there were differences in the defined critical speeds. It is assumed that discrepancies were introduced by the fact that the sensors were monitoring the blades as opposed to the shaft. Therefore, the dynamics of the blades may have dominated the actual overall dynamic displacements of the system. In addition, disagreement s may be due to the modeling assumptions concerning the bearing mounts and case rigidity. Keywords: Aircraft engine, two-spool rotor, critical speeds, unbalance.
1. INTRODUCTION
Recently, the United States set the ambitious goal of reducing the fatal accide nt rate for commercial aviation by 80% within ten years [1]. In turn, the National Aeronautics and Space Administration (NASA) in collaboration with Federal Aviation Administration (FAA) and other federal agencies, universities, as well as airline and

ISCORMA-2, Gdansk, Poland, 4-8 August 2003
2
aircraft industries, responded by developing the Aviation Safety Program (AvSP). The AvSP provides research and technology products needed to help the aerospace industry achieve the challenge to improve aviation safety. The Nondestructive Evaluation Group at the NASA Glenn Research Center at Lewis Field in Cleveland, Ohio is currently addressing the development of propulsion system specific technologies intended to detect damage prior to catastrophe under the propulsion health management task. Currently, the NDE group is assessing the feasibility of utilizing vibration data for detecting cracks in disks. The data is obtained from radial tip clearance measurements of blades in turbine engines. The concept of the approach is based on the fact that the development of a disk crack results in a distorted strain field within the component. This, in turn, causes a minute deformation in the disk’s geometry as well as a possible change in the system’s center of mass. In order to evaluate emerging real-time sensor technologies for detecting disk cracks in turbine engines, the Navy provided an Allison TF-41 turbofan engine. In addition, the Navy allowed for the use of a test site at the Naval Air Warfare Center (NAWC) located at China Lake, California (see Fig. 1). The TF-41 engine was used by several aircrafts during the 1960s and 1970s. It replaced the TF-30 in the A and B model of the Navy A-7 aircraft and provided 35% more thrust and a much improved surge margin at high power. It is still operational today with the Taiwanese and Greek governments. A cross section of the TF-41 engine is shown in Fig. 2. The engine produces about 15,000 pounds of thrust and consists of two coaxial rotors. For the China Lake tests, a seeded fault was implemented in the fan stage disk. The fault was in the form of a notch in the web area of the disk. A crack was initiated at the notch tip by running the disk in a spin pit facility. Once a crack was initiated and propagated in the spin pit, the disk was reassembled in the engine for the full scale tests. The objective of the partial rotordynamic analysis conducted in this study was to provide a basic understanding of the TF-41’s dynamic behavior. Rotor synchronous vibration experienced on this multi-shaft engine results directly from rotor unbalance exciting the numerous critical speeds inherent in light-weight, high-speed engine structure. Such information was in support of the China Lake experiments that focused on using real time vibration data to detect disk cracks. Because of the age of the engine, difficulties arose when aiming to acquire original specifications and design data, therefore, the need for the modeling presented in this paper. At the time of this writing, baseline experimental data was collected at China Lake prior to the implementation of the seeded fault. A comparison between the model and the baseline data is provided.

ISCORMA-2, Gdansk, Poland, 4-8 August 2003
3
Figure 1. T F-41 engine and test stand at China Lake, CA.
Figure 2. Cross -section of the TF-41 engine.

ISCORMA-2, Gdansk, Poland, 4-8 August 2003
4
2. DUAL ROTOR-BEARING SYSTEM MODEL
The requirement of high specific power output for gas turbine aircraft engines has resulted in highly flexible rotor designs. These rotors typically operate above several critical speeds. The application of rolling element bearings, with low inherent damping, makes it difficult to reduce vibrational amplitudes and dynamical loads transmitted to the rotor supporting structure. Additionally, the potential dynamic problems are amplified by the operation over a wide range of speed and power levels. The typical gas turbine engine requires a complex analysis to accurately predict response from rotor unbalance throughout the entire engine power range.
In respect to the TF-41 engine modeled here, the two rotor system consists of compressor and turbine stages which are connected by flexible shafting. The inner rotor, called the low-pressure rotor (LP rotor), is supported by three rolling-element bearings, each of which is mounted to the flexible case structure. The low pressure-intermediate pressure compressor (see Fig. 2, [2]) is driven by a two-stage low-pressure turbine. The outer rotor, called the high-pressure rotor (HP rotor), is supported principally by three rolling-element bearings. There is one inter-shaft differential rolling-element bearing connecting the LP and HP rotors. In addition, the LP rotor design does have two spline couplings and HP rotor does have one spline joint.
The schematic of a two-rotor-bearing system is shown in Fig. 3. The two rotors are aerodynamically coupled, and have a bilinear low/high speed relationship.
Figure 3. Schematic of computer model of TF41 engine.
The analysis presented herein includes both flexible rotors, the effect of intershaft bearing, and the bearings connecting the rotors to the engine case. The case is considered rigid, although casing flexibility may be an important effect in certain applications. The analysis includes critical speeds and unbalance response. Since the two rotors each have different speeds at a given power setting, a separate critical speed analysis is necessary for the frequency range of each rotor. For the given unbalance condition, the speed of the exciting (unbalanced) rotor is varied over its entire range. The speeds of the excited (balanced) rotor are determined from the provided rotor speed relationships [2,3] and determine its gyroscopic effects. Thus, the dynamic analysis

ISCORMA-2, Gdansk, Poland, 4-8 August 2003
5
considers the spin and whirl speeds of each rotor and defines the LP-excited and HP-excited critical speeds.
The equation of motion for ith rotor can be obtained using Lagrange approach and
written in the following form:
( ) ( ) , for 1,2i i i i i i i i iM q C G q K q F t iω+ + + = =&& & (1)
where iq is the vector of nodal displacements; iM is the symmetric mass matrix; iC is
the asymmetric damping matrix including bearings damping; iG is an antisymmetric gyroscopic matrix; iK is the asymmetric stiffness matrix including bearings stiffness;
iω is the rotor speed; and iF is the excitation vector. Combining equations (1) for each rotor, the equation of motion for the dual rotor-bearing sys tem can be formulated as:
( ) ( )1 1 2 2Mq C G G q Kq F tω ω+ + + + =&& & (2)
where , and M C K result from the assembly of matrices 1 2 1 2 1 2, ; , ; and ,M M C C K K , respectively. In addition, due to aerodynamic rotor coupling, the speeds are related as
1 2a bω ω= + (3)
where a and b are scalars. Defining the state vector 1 2( ) ( )T T T T T T Tx x x q q= = & , the state-space representation of
homogenous version of Eq. (2) can be written as first order matrix equation
x Ax=& , where ( )1 11 1 2 2
0 IA
M K M C G Gω ω− −
= − − + +
(4)
which can be solved for critical speeds.
3. NUMERICAL SIMULATION RESULTS Figure 4 shows the HP rotor exc ited critical speeds (Fig. 4(a)) and the LP rotor excited critical speeds (Fig. 4(b)) for the case when all bearings are rigidly mounted to the support structure. The summary of critical speed values is presented in Table 1. The first two HP-excited critical speeds occur early in the starting transient and the rotors will pass rapidly through these speeds conditions. These modes consist primarily of pitching and bouncing of the entire engine and pitching of the HP rotor about its spline joint. The next two HP-excited critical speeds occur near idle speed and consist of
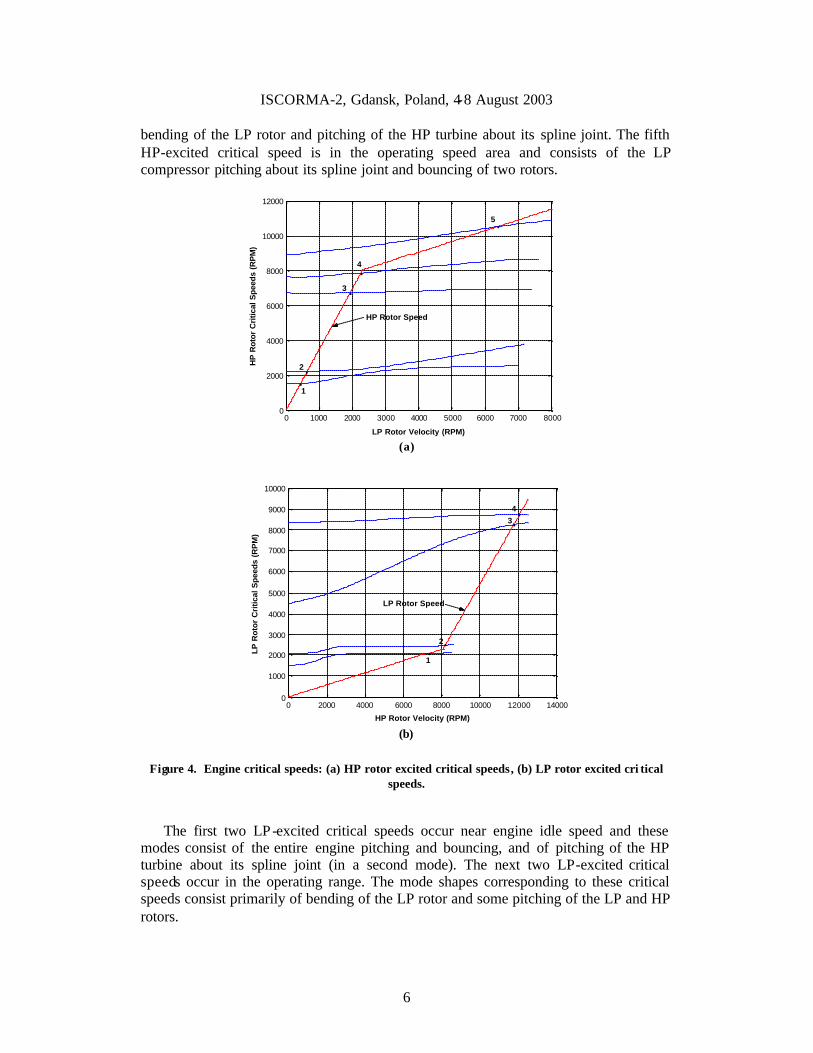
ISCORMA-2, Gdansk, Poland, 4-8 August 2003
6
bending of the LP rotor and pitching of the HP turbine about its spline joint. The fifth HP-excited critical speed is in the operating speed area and consists of the LP compressor pitching about its spline joint and bouncing of two rotors.
0 1000 2000 3000 4000 5000 6000 7000 80000
2000
4000
6000
8000
10000
12000
LP Rotor Velocity (RPM)
HP
Rot
or C
ritic
al S
peed
s (R
PM
)
•1
2
3
4
5
HP Rotor Speed
•
•
•
•
(a)
0 2000 4000 6000 8000 10000 12000 140000
1000
2000
3000
4000
5000
6000
7000
8000
9000
10000
HP Rotor Velocity (RPM)
LP
Ro
tor
Cri
tica
l Sp
eed
s (R
PM
)
•1
2
4 3
LP Rotor Speed
•
••
(b)
Figure 4. Engine critical speeds: (a) HP rotor excited critical speeds, (b) LP rotor excited cri tical
speeds.
The first two LP-excited critical speeds occur near engine idle speed and these modes consist of the entire engine pitching and bouncing, and of pitching of the HP turbine about its spline joint (in a second mode). The next two LP-excited critical speeds occur in the operating range. The mode shapes corresponding to these critical speeds consist primarily of bending of the LP rotor and some pitching of the LP and HP rotors.
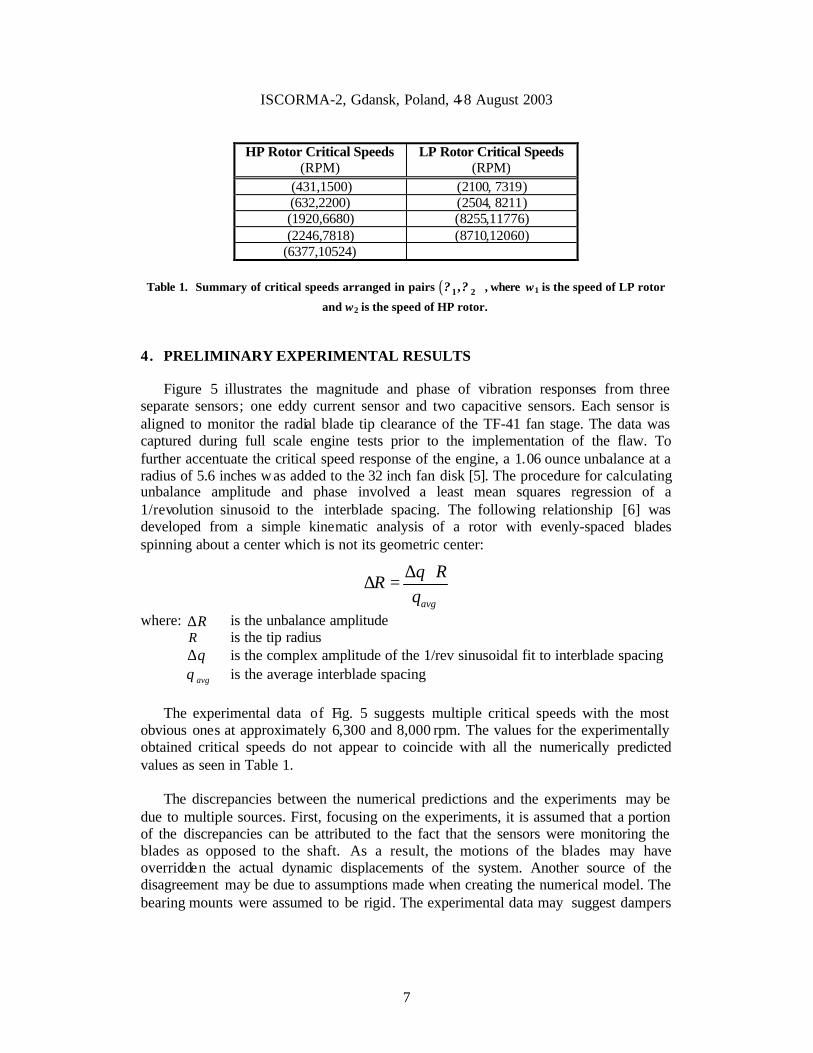
ISCORMA-2, Gdansk, Poland, 4-8 August 2003
7
HP Rotor Critical Speeds
(RPM) LP Rotor Critical Speeds
(RPM) (431,1500) (2100, 7319) (632,2200) (2504, 8211) (1920,6680) (8255,11776) (2246,7818) (8710,12060)
(6377,10524)
Table 1. Summary of critical speeds arranged in pairs ( )? ,?1 2 , where ω1 is the speed of LP rotor
and ω2 is the speed of HP rotor.
4. PRELIMINARY EXPERIMENTAL RESULTS Figure 5 illustrates the magnitude and phase of vibration responses from three separate sensors; one eddy current sensor and two capacitive sensors. Each sensor is aligned to monitor the radial blade tip clearance of the TF-41 fan stage. The data was captured during full scale engine tests prior to the implementation of the flaw. To further accentuate the critical speed response of the engine, a 1.06 ounce unbalance at a radius of 5.6 inches was added to the 32 inch fan disk [5]. The procedure for calculating unbalance amplitude and phase involved a least mean squares regression of a 1/revolution sinusoid to the interblade spacing. The following relationship [6] was developed from a simple kinematic analysis of a rotor with evenly-spaced blades spinning about a center which is not its geometric center:
avg
RR θθ
∆ ⋅∆ =
where: R∆ is the unbalance amplitude R is the tip radius θ∆ is the complex amplitude of the 1/rev sinusoidal fit to interblade spacing avgθ is the average interblade spacing
The experimental data of Fig. 5 suggests multiple critical speeds with the most obvious ones at approximately 6,300 and 8,000 rpm. The values for the experimentally obtained critical speeds do not appear to coincide with all the numerically predicted values as seen in Table 1.
The discrepancies between the numerical predictions and the experiments may be due to multiple sources. First, focusing on the experiments, it is assumed that a portion of the discrepancies can be attributed to the fact that the sensors were monitoring the blades as opposed to the shaft. As a result, the motions of the blades may have overridden the actual dynamic displacements of the system. Another source of the disagreement may be due to assumptions made when creating the numerical model. The bearing mounts were assumed to be rigid. The experimental data may suggest dampers

ISCORMA-2, Gdansk, Poland, 4-8 August 2003
8
at some of the bearing mounts. Lastly, due to a lack of information, the engine case was modeled as a rigid structure.
Figure 5. Unbalance magnitude and phase calculated from interblade spacing. (30gms of
unbalance mass added at a 5.6” radius for this run) [4].
5. CONCLUSIONS
In summary, this study provided a numerical dynamic analysis and compared the results with the available baseline experimental data concerning a two-spool TF-41, gas turbine aircraft engine. The engine was utilized for a government sponsored seeded fault test. The overall goal of the full scale testing was to assess new sensor technologies for detecting cracks in an actual fan disk during engine operation. The critical speed analysis of the complex engine conducted within this paper was in support of the vibration data captured during the full-scale fault tests.
Both the numerical model and the experimental data indicated multiple critical
speeds in the region of operation. When comparing the modeling results with the data, it was apparent that there were differences in the defined critical speeds. It is assumed that these discrepancies were introduced by the fact that the sensors were monitoring the blades as opposed to the shaft. The motions of the blades may have overridden the actual dynamic displacements of the system. In addition, discrepancies may be due to

ISCORMA-2, Gdansk, Poland, 4-8 August 2003
9
the modeling assumptions concerning the rigidity of the bearing mounts as well as the engine case. ACKNOWLEGDEMENTS The authors would like to thank Peter Tappert and Andy von Flotow of Hood Technology Corporation and Mr. Michael Drumm of Exsell Inc., for providing the baseline experimental data. The data was captured during the preliminary tests at China Lake. REFERENCES 1. Shin, J., The NASA Aviation Safety Program Overview, Proc. ASME Turbo Expo
2000, May 8-11, 2000, Munich, Germany. 2. Materials from TF41Engine Operational Check & Test Participants Meeting, Naval
Air Warfare Center, China Lake, CA, May 23, 2002. 3. Watts, B., Allison Advanced Development Co. , Personal Communication. 4. Owen, P., Rolls-Royce Corporation, Indianapolis, IN, Personal Communication
(2002). 5. Sawicki, J.T., Modeling of TF-41 Engine Rotor -Bearing System for Fan Disk Crack
Detection Seeded Fault Test, NASA GRC Faculty Fellowship Report, (2002). 6. Tappert, P. and von Flotov, A., Summary of TF-41 Baseline Measurements, China
Lake, CA, May 7-8, 2002, Hood Technology Corporation, Hood River, OR.

Analysis of transient response of cracked flexible rotor
Jerzy T. Sawicki*1, Andrew L. Gyekenyesi **, George Y. Baaklini†,
*Cleveland State University, Dept. of Mechanical Engineering, Cleveland, OH 44115; **OAI/NASA Glenn Research Center, 21000 Brookpark Road, MS 6-1, Cleveland, OH 44135;
†NASA Glenn Research Center, 21000 Brookpark Road, MS 6-1, Cleveland, OH 44135
ABSTRACT
The transient vibration response of a cracked flexible rotor passing through its critical speed is analyzed for crack detection and monitoring. The effects of different factors such as various crack depths, acceleration, damping, torque, unbalance eccentricity, and rotor weight on the rotor vibrational response are studied. The breathing types of cracks are analyzed using simple hinge model in a case of shallow cracks, and the cosine function is employed in the case of deep cracks. The developed strategy enables the analysis of cracked rotor vibrational response with and without weight dominance, taking into account also the nonsynchronous rotor whirl. In addition, the local cross-flexibility for deep cracks is taken into account. Lastly, the effect of the crack depth on “stalling” of the rotor due to the limited driving torque is investigated. Keywords: rotor, crack, acceleration, vibrational response, detection, monitoring.
1. INTRODUCTION In many cases the rotors of modern machines are rapidly accelerated from rest to operating speed to reduce the excessive vibrations at the critical speeds. Also, the vibration monitoring during startup or shutdown has been receiving growing attention, especially for machines such as aircraft engines, which are subjected to frequent starts and stops as well as high speeds and acceleration rates [1]. It has been recognized that the presence of angular acceleration strongly affects the rotor’s maximum response to unbalance and the speed at which it occurs. The topic of transient cracked rotor response has been treated by number of published works [2-4]. They have been focused on studying the dynamic behavior of a rotor with the so-called breathing crack while passing through a critical speed at constant angular acceleration or deceleration. Sekhar [2-3] investigated the transient vibration response of a cracked rotor passing through the critical speed utilizing a simple hinge model for small cracks. He followed an assumption that the vibrations remain small in comparison to the rotor’s sag. If a cracked shaft rotates under the load of its weight, then the crack will open and close once per revolution, in a case of synchronous whirl. Sawicki et al. [4] studied accelerating cracked rotor response using the angle between the crack centerline and the rotor whirl vector to determine the closing and opening of the crack. This allowed for studying the rotor dynamic response with and without the rotor weight dominance by taking into account nonsynchronous whirl. A few authors [5-7] have studied the dynamic response of uncracked rotors subjected to a constant driving torque. Markert et al. [5] determined the maximum deflection of a Jeffcot rotor during the acceleration through the critical speed or during stalling in resonance as function of the three nondimensional system parameters, i.e., damping ratio, eccentricity ratio and driving torque. Later, Gasch et al. [6] applied these strategies to a practical flexible rotor with a continuous mass distribution passing through its critical speeds while subjected to a constant driving torque. Genta and Delprete [7] developed a mathematical finite element–based model to study the nonlinear behavior of complex anisotropic rotors with non-constant angular speed.
[email protected]; phone 1.216.433.2467; fax 1.216.977.7150

There is a wealth of published research results on cracked rotors. Bently [8] presented a rotor crack detection procedure based on the start-up and shutdown vibration monitoring. Wauer [9] provided a comprehensive literature review concerning the state-of-the-art vibration methodologies related to cracked structures. Gasch [10] provided a comprehensive investigation of the stability behavior of a cracked Jeffcott rotor and the forced vibration due to unbalance and crack at constant rotational speed. Penny and Friswell [11] demonstrated the influence of the crack model on the response of the Jeffcott rotor. In this paper the effect of a breathing crack on the unbalance response of a accelerating rotor subjected to a constant driving torque is studied. The equations for the rotor’s lateral motion are supplemented by an additional equation relating the angular displacement and the driving torque. Torsional elasticity of the shaft is neglected due to the assumption that the torque is applied to a torsionally stiff rotor. In addition, the behaviors of a stalled rotor’s angular velocity as well as the rotor’s maximum amplitude of unbalance are presented as functions of the crack characteristics. The consequences of torsionally induced slant cracks are not considered in this study.
2. CRACK MODELS AND STIFFNESS MATRIX The theoretical model, called the Jeffcott rotor, employs a flexible rotor composed of a centrally located, unbalanced disk attached to a massless elastic shaft. In turn, the shaft is mounted symmetrically on rigid bearings (see Fig. 1(a)). For this study, the shaft has a transverse crack running across its cross-section located near the disk. The stiffness of the uncracked rotor system is symmetric (isotropic) and the damping due to the air resistance effect is assumed to be viscous. The rotor is driven by a constant external drive torque. The angle between the crack centerline and the line connecting the bearings and shaft center (Fig. 1(b)), ( )arctan y zψ = Φ − , is used to determine the closing and opening of the crack. At any instant of time, the ξ-axis remains perpendicular to the face of the crack. This allows the body-fixed rotating coordinate frame (ζ,η,ξ) to spin with the same velocity as the rotor. The weight dominance, assumed in almost all previous analyses of horizontal cracked rotors, is not required. Furthermore, the influence of the whirl speed on the closing and opening of the crack is included. This nonlinear system with time-varying stiffness coefficients is studied numerically, with particular focus on the effect of different crack depths on the rotor stalling.
x
y
z
T
β
rθξ
η
ψ
sO
z
yΦ
bO
θ
ε
ω
Φ
(a) (b)
Figure 1. Model of Jeffcott rotor with crack and constant driving torque (a), crack section in inertial and rotating coordinates (b).
The stiffness matrix for a Jeffcott rotor with a cracked shaft in rotating coordinates can be written as:

( )00
00RkK
fkK
ξ
ηψ
∆⎛ ⎞⎛ ⎞= − ⎜⎜ ⎟ ⎜ ∆⎝ ⎠ ⎝ ⎠
K ⎟⎟ (1)
where the first matrix refers to the stiffness of the uncracked shaft, and the second defines the changes in stiffness kξ∆
and kη∆ in ξ and η directions, respectively. The function ( )f ψ is a crack steering function which depends on the angular position of the crack ψ and the selected crack model. The simplest representation of a crack is defined as the hinge model. In this representation, the crack is assumed to change from its closed to open state suddenly as the shaft rotates. The steering function for this model is defined as
( ) 0 for 01 for 0
fξ
ψξ<⎧
= ⎨ ≥⎩ (2)
or, using Fourier expansion is
( ) 1 2 2 2cos cos3 cos5 ...2 3 5
f ψ ψ ψπ π π
ψ= + − + − (2a)
While the hinge model might be proper representation for very small cracks, Mayes and Davies [12-13] proposed a model with a smooth transition between the opening and closing of the crack, which is more appropriate for larger cracks. In this case the crack steering function, or the Mayes modified function, takes the following form:
1 cos( )( )2
f ψψ += (3)
Next, the stiffness matrix for a Jeffcott rotor with a cracked shaft in inertial coordinates, is given by IK
1I R
−=K TK T (4)
where the transformation matrix is T
cos sinsin cos
Φ − Φ⎛ ⎞= ⎜ ⎟Φ Φ⎝ ⎠
T (5)
Thus
1 2 21
2 1 2
cos 2 sin 20 ( )sin 2 cos 20 2I R
k k kK f Kk k kK
ψ− ∆ + ∆ Φ ∆ Φ⎛ ⎞⎛ ⎞= = − ⎜ ⎟⎜ ⎟ ∆ Φ ∆ −∆ Φ⎝ ⎠ ⎝ ⎠
K TK T (6)
where 1k k
kK
ξ η∆ + ∆∆ = and 2
k kk
Kξ η∆ − ∆
∆ = .
3. EQUATIONS OF MOTION OF CRACKED ROTOR UNDER CONSTANT DRIVING TORQUE
The nonlinear coupled equations of motion for the accelerating Jeffcott rotor with a cracked shaft, subjected to constant driving torque, Ta, unbalance force, and gravitational force due to its weight, can be written in the inertial coordinate frame as:

( )( )
( ) ( )
2
2
2
cos sin
0sin cos
sin cos
I
p a
M Mg
M
J M M z y T
ε θ θ
ε θ θ
ε θ ε θ θ
⎧ ⎛ ⎞Φ +Φ ⎛ ⎞⎪ ⎜ ⎟+ + = + ⎜ ⎟⎪ ⎜ ⎝⎜ Φ −Φ⎨ ⎝⎪⎪ + + − + =⎩
Mq Cq K q ⎟ ⎠⎟⎠
(7.1)
The matrices, 0
0M
M⎛ ⎞
= ⎜ ⎟⎝ ⎠
M and , are the rotor mass and damping matrices, respectively; is
the vector of the disk’s displacements; and is the rotor spin angle (see Fig. 1(b)).
00C
C⎛ ⎞
= ⎜⎝ ⎠
C ⎟ ( ) Tz y=q
Φ Using Eq. (7.1) one can obtain the following equation relating torque and the angular displacement:
( ) ( )
( )( ) ( ) ( )2 1 2 1 2
( )sin cos sin cos sin2
sin 2 sin cos cos 2 sin cos 2 cos
p af KJ T Mg K y z C y z
k y z k k z k k y
ε ψε θ ε θ θ ε θ θ
θ θ θ
Φ = + + − + − + ×
⎡ ⎤∆ Φ − + ∆ + ∆ Φ − ∆ −∆ Φ⎣ ⎦θ (7.2)
where θ β= Φ − , arctan yz
ψ ⎛ ⎞= Φ − ⎜ ⎟⎝ ⎠
, , and , θ θ= Φ = Φ 2pJ Mr= .
Normalizing displacements with respect to unbalance eccentricity, and introducing nondimensional time, damping, and torque, the equations (7.1) and (7.2) take the following nondimensional form:
1 2 2
2 1 2
22
2
cos 2 sin 21 0 2 0 1 0 ( )sin 2 cos 20 1 0 2 0 1 2
cos sin
sin cos 0n
k k kZ Z Zfk k kY Y
g
ς ψς
θ θεω
θ θ
′′ ′ ⎧ ⎫∆ + ∆ Φ ∆ Φ⎛ ⎞⎛ ⎞⎛ ⎞ ⎛ ⎞⎛ ⎞ ⎛ ⎞ ⎛⎪ ⎪+ + −⎨ ⎬⎜ ⎟⎜ ⎟⎜ ⎟ ⎜ ⎟⎜ ⎟ ⎜ ⎟ ⎜′′ ′ ∆ Φ ∆ − ∆ Φ⎪ ⎪⎝ ⎠⎝ ⎠ ⎝ ⎠⎝ ⎠ ⎝ ⎠ ⎝⎝ ⎠⎩ ⎭⎛ ⎞⎛ ⎞′ ′′Φ +Φ ⎜ ⎟= +⎜ ⎟ ⎜ ⎟⎜ ⎟′ ′′Φ −Φ ⎜ ⎟⎝ ⎠ ⎝ ⎠
Y⎞⎟⎠
(8.1)
( ) ( ) ( )
( ) ( )
( )
2 2 2
2
2
1 2 2
1 2
( )cos sin 2 cos sin sin 22
( ) sin cos ( cos 2 sin sin2
( ) cos 2 cos )2
n
fT Y Z Y Z kr r r
f gY Z k k Zr
f k k Y
ε ε ε ψθ θ ς θ θ
ε ψθ θ θ θεω
ψ θ
⎛ ⎞ ⎛ ⎞ ⎛ ⎞′′ ′ ′Φ = + − + − + ∆ Φ ×⎜ ⎟ ⎜ ⎟ ⎜ ⎟⎝ ⎠ ⎝ ⎠ ⎝ ⎠
⎛ ⎞− + ∆ + ∆ Φ +⎜ ⎟⎝ ⎠
− ∆ −∆ Φ
(8.2)
The following definitions for nondimensional variables were employed in Eqs. (8.1) and (8.2):
( ) ( )
2
2 2
2 2 2
, , , , , 2
( ) 1 ( ) ( ) 1 ( ), ,
an n
n p n
n n
Tz y K CZ Y t TM M J
k d d d dKK d dt d dtξ
τ ω ω ςε ε ω ω
τ ω τ ω
= = = = = =
∆ ⋅ ⋅ ⋅ ⋅′ ″∆ = ⋅ = = ⋅ = =
(8.3)
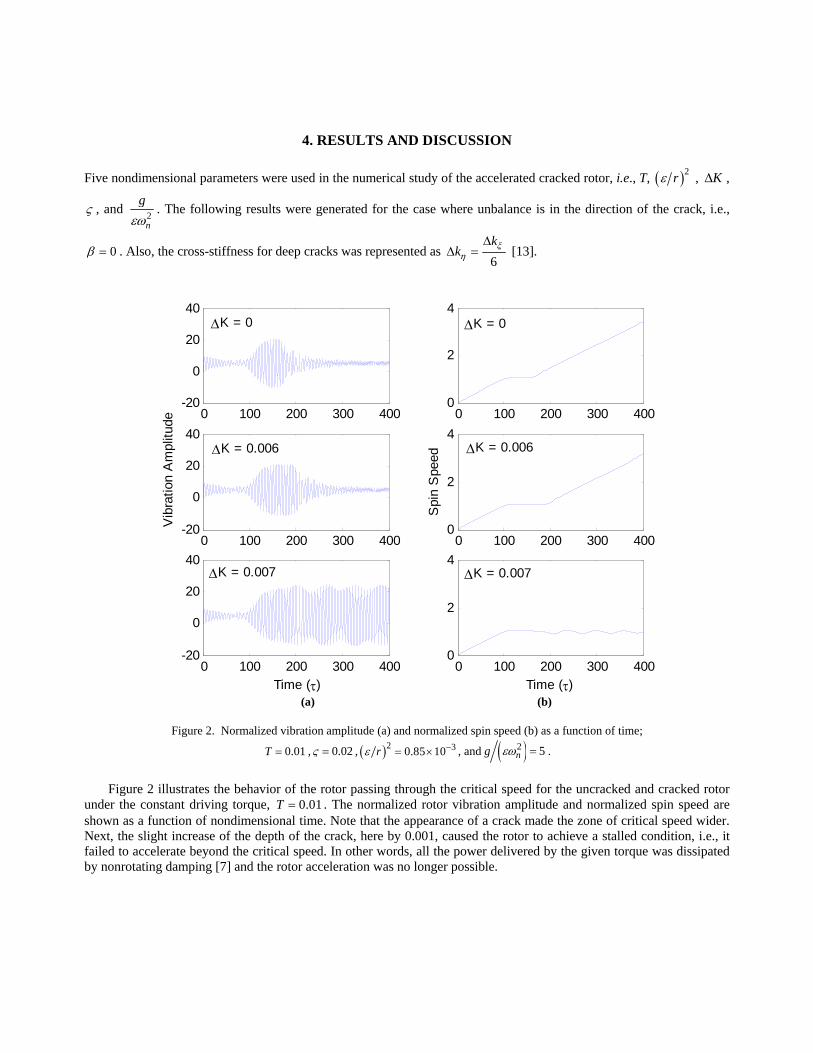
4. RESULTS AND DISCUSSION
Five nondimensional parameters were used in the numerical study of the accelerated cracked rotor, i.e., T, ( )2rε , K∆ ,
ς , and 2n
gεω
. The following results were generated for the case where unbalance is in the direction of the crack, i.e.,
0β = . Also, the cross-stiffness for deep cracks was represented as 6k
k ξη
∆∆ = [13].
0 100 200 300 400-20
0
20
40
0 100 200 300 4000
2
4
0 100 200 300 400-20
0
20
40
Vib
ratio
n A
mpl
itude
0 100 200 300 4000
2
4S
pin
Spe
ed
0 100 200 300 400-20
0
20
40
Time (τ)0 100 200 300 400
0
2
4
Time (τ)
∆K = 0 ∆K = 0
∆K = 0.006 ∆K = 0.006
∆K = 0.007 ∆K = 0.007
(a) (b)
Figure 2. Normalized vibration amplitude (a) and normalized spin speed (b) as a function of time;
,0.01T = 0.02ς = , ( )2 30.85 10rε −= × , and ( )2 5ng εω = .
Figure 2 illustrates the behavior of the rotor passing through the critical speed for the uncracked and cracked rotor under the constant driving torque, . The normalized rotor vibration amplitude and normalized spin speed are shown as a function of nondimensional time. Note that the appearance of a crack made the zone of critical speed wider. Next, the slight increase of the depth of the crack, here by 0.001, caused the rotor to achieve a stalled condition, i.e., it failed to accelerate beyond the critical speed. In other words, all the power delivered by the given torque was dissipated by nonrotating damping [7] and the rotor acceleration was no longer possible.
0.01T =

0 100 200 300 4000
1
2
3
4
Time (τ)
Spi
n S
peed
0 100 200 300 400-40
-20
0
20
40
60
Time (τ)
Vib
ratio
n A
mpl
itude
0 100 200 300 4000
1
2
3
4
Time (τ)
Spi
n S
peed
0 100 200 300 400-40
-20
0
20
40
60
Time (τ)V
ibra
tion
Am
plitu
de
(a) (b)
Figure 3. Normalized shaft deflection and spin speed as a function of time for 0.02ς = (a), 0.04ς = (b);
( ) ( )2 3 20.1, 0.01, r 0.85 10 , g 5nK T ε ε−∆ = = = × =ω .
The effect of damping is illustrated in Fig. 3. The increased damping suppressed the stall mechanism and allowed the rotor to traverse through the critical speed. Figure 4 illustrates that the appearance of crack caused 1/3 and ½ subharmonic peaks to show up and also significantly increased the amplitude of vibration of the “stalled” rotor. In this case the large vibration amplitudes of the stalled cracked rotor might well exceed the rotor static deflection and therefore violate the common weight dominance assumption made in the past studies concerning breathing cracks.
200 400 600 800 1000 1200 1400-4
-2
0
2
4
6
8
10
12
14
16
Time (τ)
Vib
ratio
n A
mpl
itude
∆K = 0
200 400 600 800 1000 1200 1400
-4
-2
0
2
4
6
8
10
12
14
16
Time (τ)
Vib
ratio
n A
mpl
itude
∆K = 0.25
(a) (b)
Figure 4. Time history of normalized vibration amplitude for uncracked rotor (a) and with crack (b) at the stalled
condition;
0.25K∆ =
( ) ( )2 20.03, 0.001, r 0.001, g 5nTς ε= = = εω = .
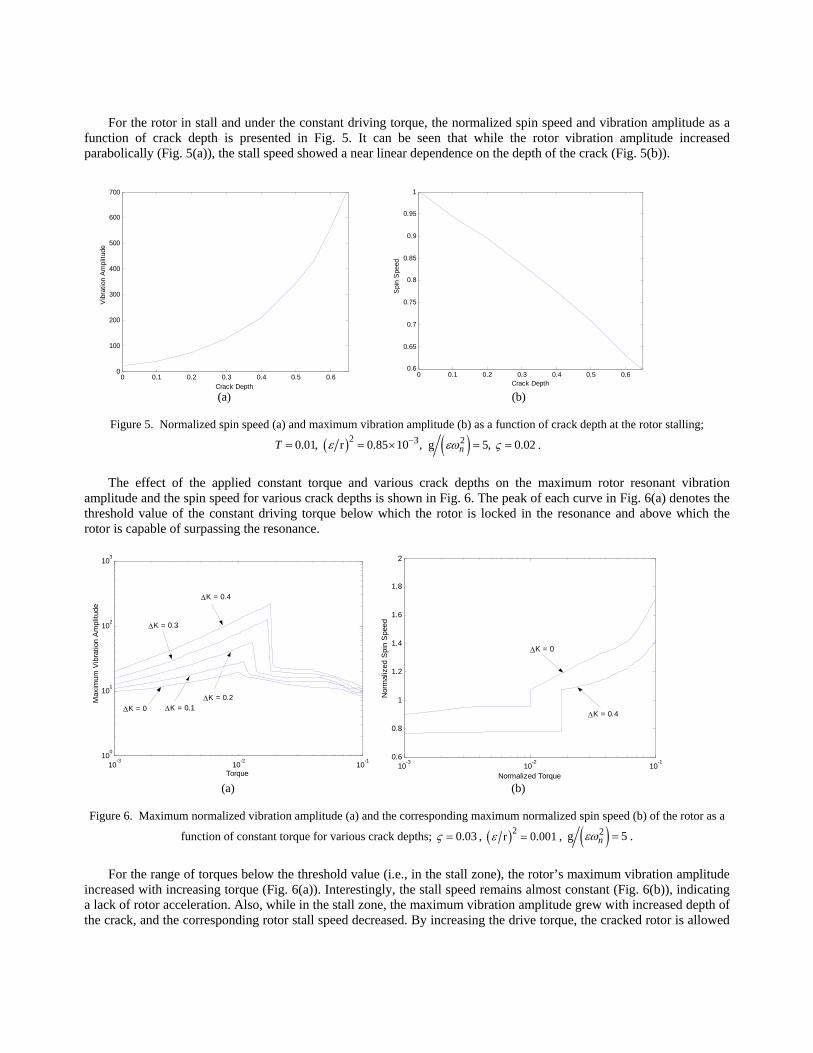
For the rotor in stall and under the constant driving torque, the normalized spin speed and vibration amplitude as a function of crack depth is presented in Fig. 5. It can be seen that while the rotor vibration amplitude increased parabolically (Fig. 5(a)), the stall speed showed a near linear dependence on the depth of the crack (Fig. 5(b)).
0 0.1 0.2 0.3 0.4 0.5 0.60
100
200
300
400
500
600
700
Crack Depth
Vib
ratio
n A
mpl
itude
0 0.1 0.2 0.3 0.4 0.5 0.6
0.6
0.65
0.7
0.75
0.8
0.85
0.9
0.95
1
Crack Depth
Spi
n S
peed
(a) (b)
Figure 5. Normalized spin speed (a) and maximum vibration amplitude (b) as a function of crack depth at the rotor stalling;
( ) ( )2 3 20.01, r 0.85 10 , g 5, 0.02nT ε εω−= = × = ς = .
The effect of the applied constant torque and various crack depths on the maximum rotor resonant vibration amplitude and the spin speed for various crack depths is shown in Fig. 6. The peak of each curve in Fig. 6(a) denotes the threshold value of the constant driving torque below which the rotor is locked in the resonance and above which the rotor is capable of surpassing the resonance.
10-3
10-2
10-1
100
101
102
103
Max
imum
Vib
ratio
n A
mpl
itude
Torque
∆K = 0 ∆K = 0.1
∆K = 0.3
∆K = 0.4
∆K = 0.2
10-3
10-2
10-1
0.6
0.8
1
1.2
1.4
1.6
1.8
2
Normalized Torque
Nor
mal
ized
Spi
n S
peed
∆K = 0.4
∆K = 0
(a) (b)
Figure 6. Maximum normalized vibration amplitude (a) and the corresponding maximum normalized spin speed (b) of the rotor as a
function of constant torque for various crack depths; 0.03ς = , ( )2r 0.001ε = ( ), 2g 5nεω = .
For the range of torques below the threshold value (i.e., in the stall zone), the rotor’s maximum vibration amplitude increased with increasing torque (Fig. 6(a)). Interestingly, the stall speed remains almost constant (Fig. 6(b)), indicating a lack of rotor acceleration. Also, while in the stall zone, the maximum vibration amplitude grew with increased depth of the crack, and the corresponding rotor stall speed decreased. By increasing the drive torque, the cracked rotor is allowed

to accelerate through resonance, reduce its maximum resonance vibration amplitude, and shift the resonance peak to higher spin speeds.
5. CONCLUSIONS The following conclusions can be drawn based on the results presented in this paper: 1. The developed model enables the study of the cracked rotor dynamic response with and without weight dominance
in the presence of nonsynchronous whirl. The model includes small and deep cracks, as well as cross stiffness effect (for deep cracks).
2. The stalling effect of the rotor is crack sensitive, i.e., even a minute increase in crack depth can cause the rotor to stall. This is accompanied by the presence of subcritical (1/3, ½) response peaks and a large increase in the fundamental vibration response.
3. For a rotor in stall, the maximum vibration amplitude increases for increasing value of torque while the corresponding stall spin speed remains almost constant.
4. In addition, the maximum vibration amplitude during stall grows parabollically with increased crack depth. The corresponding rotor stall speed decreases almost linearly with crack depth.
NOMENCLATURE
C external damping coefficient ( )f ψ crack steering function
pJ moment of inertia of the disk K stiffness of uncracked shaft M mass of the disk r radius of gyration t,τ time; ntτ ω=
Ta, T driving torque; 2a p nT T J ω=
z, y, Z, Y inertial coordinates; , Z z Y yε ε= = α acceleration ratio β angle between crack and unbalance eccentricity
kξ∆ the largest stiffness change ratio in ξ -direction caused by crack kη∆ the largest stiffness change ratio in η -direction caused by crack
K∆ stiffness change ratio ( )/k Kξ= ∆
ε eccentricity of the disk ς external damping ratio θ angular position of the eccentricity ε in the inertial system
,ξ η body fixed rotating coordinates, ξ is in the crack direction
nω undamped critical speed of uncracked rotor
REFERENCES 1. Sawicki, J.T., Some Advances in Diagnostics of Rotating Machinery Malfunctions, Invited Paper, Proc. of
International Symposium on Machine Condition Monitoring and Diagnosis, The Japan Society of Mechanical Engineers, (2002) 138-144.
2. Sekhar, A. S., Prabhu, B. S., Transient Analysis of Cracked Rotor Passing Through Critical Speed, Journal of Sound and Vibration, Vol. 173 (3) (1994) 415-421
3. Sekhar, A. S., Prabhu, B. S., Condition Monitoring of Cracked Rotors Through Transient Response, Mechanism and Machine Theory, Vol. 33, Issue 8 (1998) 1167-1175.
4. Sawicki, J. T., Wu, X., Baaklini, G.Y. and Gyekenyesi, A., Vibration-Based Crack Diagnosis in Rotating Shafts During Acceleration Through Resonance, Proceedings of SPIE, Vol. 5046 (2003).
5. Markert R., Pfützner H. and Gasch R., Biegeschwingungsverhalten rotierenden Wellen beim Durchlaufen der kritischen Drehzahlen, Konstruktion, 29 (1977) 355-365.
6. Gasch R, Markert R. and Pfutzner H., Acceleration of Unbalance Flexible Rotors Through the Critical Speeds, Journal of Sound and Vibration, 63(3), (1979) 393-409.
7. Genta, G. and Delprete, C., Acceleration Through Critical Speeds of an Anisotropic, Non-Linear, Torsionally Stiff Rotor with Many Degrees of Freedom, Journal of Sound and Vibration, 180(3), (1995) 369-386.
8. Bently, D. E., Detecting Cracked Shafts at Earlier Levels, Orbit Magazine, Bently Nevada, Vol. 3, No. 2, (1982). 9. Wauer, J., On the Dynamics of Cracked Rotors: A Literature Survey, Applied Mechanics Reviews, Vol. 43(1) 1990
13-17. 10. Gasch, R. A, 1993, Survey of the Dynamic Behavior of a Simple Rotating Shaft with a Transverse Crack. Journal of
Sound and Vibration, 160(2), (1993) 313-332. 11. Penny, J. E. T. and Friswell,, M.I., Simplified Modelling of Rotor Cracks, Proc. ISMA 27, Leuven, Belgium, (2002)
607-615. 12. Mayes, I. W. and Davies, W. G. R., A Method of Calculating the Vibrational Behavior of Coupled Rotating Shafts
Containing a Transverse Crack, Proc. of International Conference on Vibrations in Rotating Machinery, Paper C254/80, IMechE, (1980) 12-27.
13. Mayes, I. W. and Davies, W. G. R., Analysis of the Response of a Multi-Rotor-bearing System Containing a Transverse Crack in a Rotor, Journal of Vibration, Acoustics, Stress, and Reliability in Design, Trans. ASME, Vol. 106, (1984) 139-145.

Proceedings of ASME Turbo Expo 2004 Power for Land, Sea, and Air
June 14-17, 2004, Vienna, Austria
GT2004-54095
COUPLED LATERAL AND TORSIONAL VIBRATIONS OF A CRACKED ROTOR
Jerzy T. Sawicki Rotor-Bearing Dynamics & Diagnostics Laboratory
Fenn College of Engineering, Cleveland State University Cleveland, OH 44115-2214
George Y. Baaklini NASA Glenn Research Center
21000 Brookpark Road, MS 77-1 Cleveland, OH 44135
Andrew L. Gyekenyesi OAI/NASA Glenn Research Center
21000 Brookpark Road, MS 6-1 Cleveland, OH 44135
ABSTRACT
Rotor crack problems present a significant safety and loss hazard in nearly every application of modern turbomachinery, particularly in the power generation industry. However, early crack detection is not easily achieved during the operation of machinery. The difficulty is based on the fact that a crack produces an undetectable change in the overall structural response. This paper analyzes the coupling of torsional and lateral vibrations for an unbalanced cracked rotor. The rotor equations of motion for a system with cracked shaft, obtained using Lagrangian dynamics, show coupling and nonlinear interaction between the torsional and lateral vibrations. To investigate the effect of a transverse surface crack on the dynamic rotor response the breathing crack model was employed. By applying an external torsional excitation together with the excitation due to unbalance, signature responses were observed in the rotor vibration spectrum at sum and difference frequencies. These signature responses were due to the nonlinear effect of the crack. The observed phenomena, analytically defined here, offers a new methodology concerning crack detection and prognosis in rotors.
INTRODUCTION
In many cases of rotating machinery the rotors have the lowest torsional natural frequency higher than the second or third bending natural frequency. The lateral rotor vibrations are always an important consideration for virtually all types of rotating machinery. Conversely, the torsional rotor vibration is often not an important consideration for many machinery types, especially machines with single uncoupled rotors. In addition, the measurement of torsional vibrations, even those having amplitudes close to the destructive level, is rather difficult task, since complex and specialized transducers need to be employed. Consequently, the attention paid to the monitoring
of torsional vibration, as well as to the dynamic coupling between the torsional and lateral rotor vibration characteristics is typically discounted.
A study by Tondl [1] was one of the first to investigate the
effect of the coupled lateral and torsional vibrations on turbogenerator rotor stability. He concluded that the combined effect of torsional stiffness and bending stiffness results in speed intervals where the rotor vibrations due to residual unbalance become unstable. Loewy and Piarulli [2] also analyzed the problem of coupled vibrations, but due to incorrect derivation of the rotor equations of motion they arrived at the wrong conclusions.
The online monitoring of machine dynamic behavior
cannot be overestimated. Any new advancement in detection and diagnosis of critical malfunctions in rotating machinery can be extremely beneficial to industry [3]. This especially applies to fatigue cracks within the shaft, which present a potential source for catastrophic failures of rotating machinery. Most reported studies are focused on two crack signatures, i.e., twice the running frequency component (2X) and the subharmonic component at approximately half of the shaft critical speed.
Papadopoulos and Dimarogonas [4] used a non-rotating
cracked Timoshenko shaft to demonstrate the existence of an apparent coupling of torsional and bending vibration. They modeled crack using the local flexibility matrix, and then proceeded to study the vibration spectra in the presence of harmonic excitations. Other researchers [5-9] also dealt with the problem of coupled vibration. Recently, Muszynska et al. [5] analytically and experimentally analyzed lateral/torsional coupling mechanisms resulting from combinations of the unbalance, shaft stiffness asymmetry, and radial sideload.
1 Copyright © 2004 by ASME

Muszynska experimentally observed torsional resonance at speeds equal to 1/8, 1/6, 1/4, and 1/2 of the lowest torsional natural frequency. Bently et al. [6] continued this study with special attention paid to the analysis of a “snapping” action that occurs when during rotation the rotor experiences a peak of torsional acceleration.
The topic of cracked rotor vibrations has been analyzed in
a number of published works [9-13]. They have been focused on the study of dynamic behavior of rotors with the so-called breathing type of crack during the passage through a critical speed at constant angular acceleration or deceleration. For example, Sawicki et al. [10] studied the accelerating cracked rotor response using the angle between the crack centerline and the rotor whirl vector, to determine the closing and opening of the crack. This allows one to study the rotor dynamic response with or without the rotor weight dominance by taking into account nonsynchronous whirl. Gasch [12] provided a comprehensive investigation of the stability behavior of a cracked Jeffcott rotor. The cracked shaft analysis of Gasch assumed a constant rotational speed and a forced vibration resulting from the system’s residual unbalance.
In this paper, an analytical solution of a Jeffcott rotor with
a breathing crack is developed in order to show coupling between the torsional and lateral vibrations. The equations for the rotor’s lateral motion are supplemented by the third equation for torsional vibration. Though the assumed model for the cracked rotor is based on an idealized Jeffcott rotor, the generated results provide a new approach for understanding the complex vibration response of cracked rotors.
NOMENCLATURE LC Rotor lateral damping
TC Rotor torsional damping ,z yF F External forces
( )f ψ Crack steering function J Moment of inertia of the disk
IK Shaft stiffness matrix in inertial coordinates
RK Shaft stiffness matrix in rotating coordinates K Lateral stiffness of uncracked shaft
TK Shaft torsional stiffness M Mass of the disk z, y Inertial coordinates
kξ∆ Stiffness change ratio in ξ -direction due to crack kη∆ Stiffness change ratio in η -direction due to crack
K∆ Stiffness change ratio ( ) /k Kξ= ∆
T Transformation matrix eT External torque excitation
t Instantaneous time β Angle between crack and unbalance vector ε Eccentricity of the disk ζ,η,ξ Rotor-fixed rotating coordinates
,L Tξ ξ Lateral and torsional damping ratio θ Angular position of the eccentricity vector
Φ Angle between ξ and z axes ( )tψ Torsional angle
ω Rotor angular speed eω Torsional excitation frequency
CRACKED ROTOR MATHEMATICAL MODEL The theoretical model, called the Jeffcott rotor, employs a
flexible rotor composed of a centrally located unbalanced disk attached to a massless elastic shaft which, in turn, is mounted symmetrically on rigid bearings. Here, the shaft has a transverse crack running across its section and located adjacent to the disk. The sectioned view of the cracked rotor, in both inertial and rotating coordinates, is shown in Fig. 1. The stiffness of the uncracked rotor system is symmetric (isotropic), and the damping due to the air resistance effect is assumed to be viscous. The angle between the crack centerline and the line connecting the bearings and shaft center, ( )- arctan y zψ = Φ , (see Fig. 1) is used to determine the closing and opening of the crack. At any instant of time, the ξ-axis remains perpendicular to the face of the crack, causing the body-fixed rotating coordinate frame (ζ,η,ξ) to rotate with the same velocity as the rotor.
β
tωξ
η
ψ
sO
z
y
Φ
bO
θ
ε
ω
Figure 1. Rotor crack section in inertial and rotating coordinates.
The angular position of the unbalance vector can be
expressed as ( ) ( )t t tθ ω ψ β= + + , where ω is a constant spin speed of the shaft, ( )tψ is a torsional angle, and β is the fixed angle between the unbalance vector and the centerline of the transverse shaft surface crack. The kinetic and potential energy for the rotor system subjected to lateral and torsional vibrations can be expressed as follows:
[ ] 2 2 2 21 12 sin cos2 2 pT M z y z y J 2ε θ εθ θ θ θ= + + + − + + (1)
212 2I
zU z y K
y1
Tψ⎧ ⎫
= +⎨ ⎬⎩ ⎭
K (2)
where zz zy
Iyz yy
K K
K K⎡ ⎤
= ⎢⎢ ⎥⎣ ⎦
K ⎥ (3)
2 Copyright © 2004 by ASME

is the shaft stiffness matrix, with the off-diagonal elements corresponding to asymmetry induced either by a crack or the geometry of the system. Utilizing the Lagrange approach, the nonlinear, coupled equations for transverse and torsional motion for the rotor system take the following form:
(( )
2
2
cos sin
sin cos
L zz zy z
L yz yy y
Mz C z K z K y F M
My C y K z K y F M
)ε θ θ θ θ
ε θ θ θ θ
+ + + = + +
+ + + = + − (4)
( ) ( )
( ) ( )
sin cos sin cos
sin cos ( )
p T L z y
zz zy yz yy e
J C C z y F F
UK z K y K z K y T t
ψ ψ ε θ θ ε θ θ
ε θ θψ
+ + − − −
∂⎡ ⎤+ − + + =⎣ ⎦ ∂
+ (5)
Uncracked (symmetric) shaft
For the uncracked rotor the following conditions related to potential energy and stiffness components are satisfied:
TU K ψψ∂
=∂
, zz yyK K= ≡ K
⎟
and (6) 0zy yzK K= ≡
Cracked shaft
The stiffness matrix for a Jeffcott rotor with a cracked shaft in rotating coordinates can be written as:
( )00
00R
kKf
kKξ
η
ψ∆⎛ ⎞⎛ ⎞
= − ⎜⎜ ⎟ ∆⎝ ⎠ ⎝ ⎠K (7)
where the first matrix refers to the stiffness of the uncracked shaft, and the second defines the changes in stiffness kξ∆ and
kη∆ in ξ and η directions, respectively. The function ( )f ψ is a crack steering function which depends on the angular position of the crack,ψ , and the selected crack model.
The simplest crack model is the hinge model, where the crack is assumed to change from its closed to open state suddenly as the shaft rotates. The steering function for this model is defined as:
( ) 0 for 01 for 0
fξ
ψξ<⎧
= ⎨ ≥⎩ (8)
While the hinge model might be an appropriate
representation for very small cracks, Mayes and Davies [12-13] proposed a model with a smooth transition between the opening and closing of the crack that is more adequate for larger cracks. In this case the crack steering function, or the Mayes modified function, takes the following form:
1 cos( )( )2
f ψψ += (9)
The stiffness matrix for a Jeffcott rotor with a cracked shaft
in inertial coordinates, IK is derived as
1
1 2 2
2 1 2
cos 2 sin 20 ( )sin 2 cos 20 2
zz zyI R
yz yy
K KK K
k k kK f Kk k kK
ψ
− ⎛ ⎞= = =⎜ ⎟
⎝ ⎠∆ + ∆ Φ ∆ Φ⎛ ⎞⎛ ⎞
− ⎜ ⎟⎜ ⎟ ∆ Φ ∆ − ∆ Φ⎝ ⎠ ⎝ ⎠
K TK T (10)
where the transformation matrix T is
cos sinsin cos
Φ − Φ⎛= ⎜ Φ Φ⎝ ⎠
T⎞⎟ (11)
and
1
k kk
Kξ η∆ + ∆
∆ = and 2
k kk
Kξ η∆ − ∆
∆ = . (12)
The cross-stiffness for deep cracks has been accounted for
as 6k
k ξη
∆∆ = , which yields 1
76
kk
Kξ∆
∆ = and 256
kk
Kξ∆
∆ = .
The derivative of the potential energy term Uψ∂∂
in Eq. (4)
takes the following form:
( ) ( )2 21 2 2 1 2
2 22
( )4
cos 2 2 sin 2 cos 2
( )sin 2 2 cos 2 sin 2
2 T
U K f
k k z zy k k k y
f K kz zy y K
ψ ψ
ψ
∂ ∂ Φ= − ×
∂ ∂
⎡ ⎤∆ + ∆ Φ + ∆ Φ + ∆ −∆ Φ⎣ ⎦Φ ∆ ⎡ ⎤+ Φ − Φ − Φ +⎣ ⎦
(13)
NUMERICAL SIMULATIONS To investigate coupling of the rotor bending and torsional
vibrations induced by lateral excitation (unbalance) and/or a rotor’s crack, a number of numerical simulations were conducted. The realistic physical parameters, listed in Table 1, were selected for the model, in order to highlight the relevance of the study to real life applications. Runge-Kutta integration was applied to obtain numerical solutions of the nonlinear coupled equations of motion (4)-(5). The integration time sampling frequency was selected as 200kHz.
Table 1: Numerical Model Physical Parameters.
Physical parameter Value Units
M Disk mass 20 kg J Disk polar moment of inertia 0.3 kg m2
K Shaft stiffness 8.82×10⁵ N/m ε Unbalance eccentricity 1.5×10⁻³ m β Unbalance phase angle 0.0 degrees
Lξ Lateral damping ratio 0.01
Tξ Torsional damping ratio 0.001
Lω Lateral natural frequency 210 rad/sec
Tω Torsional natural frequency 630 rad/sec
3 Copyright © 2004 by ASME

Figure 2 illustrates the vibrational spectra for the uncracked rotor running at the constant speed ω=100 rad/sec, i.e., below the bending critical speed, and subjected only to unbalance and gravitational forces. The nonlinear dynamic coupling between the lateral and torsional modes can be seen clearly in the torsional response spectrum (Fig. 2(a)), where the sum and difference of lateral natural frequency ( Lω ) and the running speed (ω ), Lω ω± , are centered with respect to lateral natural frequency. In addition, the torsional natural frequency component is present. It can be shown that when the running speed is higher than the bending critical speed, the two frequency components Lω ω± show up and are located symmetrically with respect to running speed.
0 110 210 310 630 8000
0.2
0.4
0.6
0.8
1
1.2
1.4
1.6
1.8
2 x 10⁻⁵
Frequency (rad/sec)
Tors
iona
l Ang
le
ωL- ω
ωL+ ω
ωT
(a) Torsional vibration spectrum.
0 100 210 3000
0.5
1
1.5
2
2.5
3
3.5
4
4.5
x 10-3
Frequency (rad/sec)
Verti
cal D
ispl
acem
ent
ω
ωL
(b) Lateral vibration spectrum.
Figure 2. Vibrational spectra due to unbalance for uncracked rotor at speed ω=100 rad/sec.
The corresponding lateral vibration spectrum (Fig. 2(b)) shows primarily a strong synchronous frequency component and small amplitude peak corresponding to the bending critical speed.
Next, a harmonic torsional excitation, ( ) 2sin(210 )eT t t= , is applied to the rotor, in order to investigate its effect on lateral vibration in a context of coupling between torsional and lateral vibrations. This torsional excitation is in addition to the unbalance and gravitational forces. From Fig. 3(a) it can be seen that the frequency content and the amplitude of torsional vibrations show negligible change (as compared with Fig. 2(a)), except the appearance of the torsional excitation frequency of 210 rad/sec. The torsional excitation has no affect concerning the lateral vibration spectrum, as seen in Fig. 3(b).
It can be concluded that for the case of an uncracked Jeffcott rotor (supplemented with the third equation of torsional vibration), the existing unbalance excitation in the lateral direction generates a torsional response, while the effect of
0 110 210 310 630 8000
0.2
0.4
0.6
0.8
1
1.2
1.4
1.6
1.8
2 x 10⁻⁵
Frequency (rad/sec)
Tors
iona
l Ang
le
ωL -ω
ωL +ω
ωe
ωT
(a) Torsional vibration spectrum.
0 100 210 3000
0.5
1
1.5
2
2.5
3
3.5
4
4.5
x 10-3
Frequency (rad/sec)
Ver
tical
Dis
plac
emet
ω
ωL
(b) Lateral vibration spectrum.
Figure 3. Vibrational spectra due to unbalance and torsional excitation ( ) 2sin(210 )eT t t= for uncracked rotor at
speed ω=100 rad/sec. applied torsional excitation on the lateral vibrations is negligible.
4 Copyright © 2004 by ASME

The next step involves the case of a cracked rotor subjected to forces related to unbalance and gravity (i.e., no torsional excitation). The assumed cracked depth is and the rotor speed is ω=21 rad/sec. The torsional and lateral frequency vibration spectra are shown in Fig. 4. It can be noted that both the torsional and lateral spectrum indicate 1X, 2X, and 3X frequency components. This is due to the nonlinear mechanism of the crack. The coupling between the torsional and lateral vibrations is manifested by the presence of synchronous frequency and its higher harmonics in the torsional spectrum (see Fig. 4(a)) in the absence of torsional excitation. Note that for the uncracked rotor, there were no synchronous components in the torsional vibration spectrum (see Fig. 2a).
0.4K∆ =
0 100 200 300 400 500 600 700 8000
1
2
3
4
5
6
7
8
9 x 10⁻⁷
Frequency (rad/sec)
Tors
iona
l Ang
le
ω
2ω 3ω
ωT
ωL -3ω/2
ωL -5ω/2
ωL -7ω/2
ωL +3ω/2
ωL +5ω/2
ωL -ω/2
ωL +ω/2
(a) Torsional vibration spectrum.
0 50 100 150 200 250 3000
0.5
1
1.5
2
2.5
3 x 10⁻⁴
Frequency (rad/sec)
Verti
cal D
ispl
acem
ent
ω
2ω
3ω
(b) Lateral vibration spectrum.
Figure 4. Vibrational spectra due to unbalance for cracked rotor at speed ω=21 rad/sec.
The detailed analysis of the torsional vibration spectrum in Fig. 4(a) reveals, in addition to torsional resonance frequency
630Tω = rad/sec., the presence of the sum and difference frequencies ( 2)Lω ω± , ( 3 2)Lω ω± , ( 5 2L )ω ω± , and ( 7 2L )ω ω± , which are located around the bending natural frequency ( Lω ). These frequencies, being the result of interaction between the lateral natural frequency and rotational
frequency, are generated by the coupling between the torsional and lateral vibrations, induced by the presence of the crack in the rotor.
Finally, a torsional excitation of ( ) 200sin(210 )eT t t= was applied to the case of the cracked rotor, again, in addition to the unbalance and gravity forces. These results are shown in Fig. 5. Figure 5(a) indicates that the rotational frequency component and its higher harmonics are suppressed by the large amplitude of the harmonic torsional excitation. The only visible responses are at the torsional excitation frequency and the torsional natural frequency. A different scenario is presented by the rotor’s lateral vibration spectrum, as shown in Fig. 5(b). In
0 100 200 300 400 500 600 700 8000
0.2
0.4
0.6
0.8
1
1.2
1.4
1.6 x 10⁻³
Frequency (rad/sec)To
rsio
nal A
ngle
ωe
ωT
(a) Torsional vibration spectrum.
0 50 100 150 200 250 3000
1
2
x 10-4
Frequency (rad/sec)
Ver
itcal
Dis
plac
emen
t
ω
2ω
3ω
ωL
ωL-ω ωL+ω
ωL-2ω ωL+2ω
ωL-3ω ωL+3ω
(b)
(b) Lateral vibration spectrum.
Figure 5. Vibrational spectra due to unbalance and torsional excitation ( ) 200sin(210 )eT t t= for cracked rotor at
speed ω=21 rad/sec. addition to such crack “indicators” as the 2X and 3X components, the torsional excitation frequency eω =210 rad/sec. is seen along with the side frequencies eω ω± ,
2eω ω± , and 3eω ω± , which are located around eω . These frequencies are generated as a result of the non-linear mechanism of the breathing crack under the influence of
5 Copyright © 2004 by ASME

unbalance, gravity, and harmonic torsional excitation. Again, the differences concerning the torsional and lateral vibration spectrums between the uncracked and cracked cases are quite obvious as discussed above.
CONCLUSIONS An analytical solution was developed for the Jeffcott rotor
taking into account coupling between the torsional and bending vibrations. This was achieved by the inclusion of the third equation for torsional vibration. The modeling was further enhanced by considering the nonlinearities associated with a breathing crack located on the shaft adjacent to the disk. Numerical simulations of the uncracked and cracked cases were carried out by applying an unbalance excitation, gravity forces, and a torsional excitation.
When comparing the torsional and lateral frequency
spectrums for the uncracked and cracked cases, very clear distinctions were noticed. In each case (uncracked and cracked), the system was excited by the residual unbalance and gravitational forces, and then by the addition of a torsional excitation (i.e., 4 cases total). The sum and difference frequencies have been observed in a response of cracked rotor due to unbalance alone and due to unbalance and external torsional excitation. In the case of unbalance excitation only, the torsional spectrum exhibits the sum and difference frequencies located symmetrically around the bending critical speed. In a case of applied torsional excitation, in addition to the present unbalance, the lateral vibration spectrum shows sum and difference frequencies located symmetrically around the bending critical speed.
The uniqueness of the observed crack signatures, captured
by the analytical approach, demonstrates an improvement in early diagnosis of rotor cracks.
ACKNOWLEDGMENTS This research was conducted under grant NAG 3-2573 of
the NASA Glenn Research Center. This support is gratefully acknowledged.
REFERENCES [1] Tondl, A., 1965, Some Problems of Rotor Dynamics,
Chapman & Hall, London. [2] Loewy, R.G., and Piarulli, V.J., 1969, Dynamics of
Rotating Shafts, The Shock and Vibration Information Center, United States Department of Defense.
[3] Sawicki, J.T., 2002, “Some Advances in Diagnostics of Rotating Machinery Malfunctions,” Invited Paper, International Symposium on Machine Condition Monitoring and Diagnosis, Annual Meeting of the Japan Society of Mechanical Engineers, Tokyo.
[4] Papadopoulos, P. and Dimarogonas, A.D., 1987, “Coupling of Bending and Torsional Vibration of a Cracked Timoshenko Shaft,” Ingenieur-Archive, 57, pp. 257-266.
[5] Muszynska, A., Goldman, P., and Bently, D.E., 1992, “Torsional/Lateral Vibration Cross-Coupled Responses Due to Shaft Anisotropy: A New Tool in Shaft Crack Detection,” 5th International Conference on Vibrations in
Rotating Machinery, Bath, U.K., Paper C432/090, pp. 257-262.
[6] Bently, D.E., Goldman, P., and Muszynska, A., 1997, ““Snapping” Torsional Response of an Anisotropic Radially Loaded Rotor,” ASME Journal of Engineering for Gas Turbines and Power, 119, pp.397-403.
[7] Cohen, R., and Porat, I., 1985, “Coupled Torsional and Transverse Vibration of Unbalanced Rotor,” ASME Journal of Applied Mechanics, 52, pp. 701-705.
[8] Bernasconi, O., 1987, “Bisynchronous Torsional Vibrations in Rotating Shafts,” ASME Journal of Applied Mechanics, 54, pp. 893-897.
[9] Gasch, R., Markert, R., and Pfutzner, H., 1979, “Acceleration of Unbalanced Flexible Rotors through the Critical Speeds,” Journal of Sound and Vibration, 63, pp. 393-409.
[10] Sawicki, J.T., Wu, X., Baaklini, G., and Gyekenyesi, A.L., 2003, “Vibration-Based Crack Diagnosis in Rotating Shafts During Acceleration through Resonance,” Proceedings of SPIE 10th Annual International Symposium on Smart Structures and Materials, San Diego, California.
[11] Sawicki, J.T., Bently, D.E., Wu, X., Baaklini, G., and Friswell, M.I., 2003, “Dynamic Behavior of Cracked Flexible Rotor Subjected to Constant Driving Torque,” Proceedings of the 2nd International Symposium on Stability Control of Rotating Machinery, Gdansk, Poland, pp. 231-241.
[12] Gasch, R. A, 1993, “Survey of the Dynamic Behavior of a Simple Rotating Shaft with a Transverse Crack,” Journal of Sound and Vibration, 160, pp. 313-332.
[13] Mayes, I. W. and Davies, W. G. R., 1984, “Analysis of the Response of a Multi-Rotor-Bearing System Containing a Transverse Crack in a Rotor,” ASME Journal of Vibration, Acoustics, Stress, and Reliability in Design, 106, pp. 139-145.
6 Copyright © 2004 by ASME

1
Application of Nonlinear Dynamics Tools for Diagnosis of Cracked Rotor Vibration Signatures
Jerzy T. Sawicki*, Xi Wu*, Andrew L. Gyekenyesi **, George Y. Baaklini†
*Cleveland State University, Dept. of Mechanical Engineering, Cleveland, OH 44115;
**OAI/NASA Glenn Research Center, Cleveland, OH 44135; †NASA Glenn Research Center, Cleveland, OH 44135
ABSTRACT
The nonlinear model of the cracked Jeffcott rotor is investigated, with the particular focus on study of rotor’s vibrational response using tools of nonlinear dynamics. The considered model accounts for nonlinear behavior of the crack and coupling between lateral and torsional modes of vibrations. Load torque is applied to the rotor which is laterally loaded with a constant radial force (gravity force) and unbalance excitation. The co-existence of frequencies of lateral modes in the frequency spectra of torsional mode are characteristics of the coupling response of lateral and torsional vibrations. When only the lateral excitations are applied, vibration amplitude bifurcation plot with the shaft speed as a control parameter, demonstrates some speed ranges for which vibrations of the rotor dramatically increase. Furthermore, the torsional response amplitude at the same speed ranges also increases and chaotic behavior can be observed due to the lateral excitations. These phenomena cannot be observed for pure lateral vibration response with the torsionally rigid rotor assumption. Keywords: Jeffcott rotor, crack, nonlinear dynamics, vibration signatures, bifurcation diagram, detection.
INTRODUCTION The tendency to higher speeds in turbomachinery results in design of more flexible shafts, which spin at speeds above several of their natural frequencies. Due to stress concentration and high spin speed, rotor dynamic system is more prone to cracks which propagate faster due to low-cycle fatigue loading. In many rotating machinery, the lateral natural frequencies are far much lower than the lowest torsional natural frequency. That’s why most of the condition monitoring methods is based on lateral vibrations. Without proper transducer, it’s very difficult to detect torsional vibrations even when their amplitudes are close to dangerous level. However, in order to capture the whole picture of the cracked dynamic system, and develop a high efficiency on on-line condition monitoring method, the lateral and torsional coupling must be taken into consideration, because torsional excitation generate not only torsional responses, but also cause lateral vibrations due to the mechanism of torsional and lateral coupling. Finite Element Method is basically a linear approach, which ignores the lateral and torsional coupling mechanism of the uncracked rotor. It is only due to the crack, which introduces nonlinearity and produces coupling terms of cracked rotor in the FEM-based model. But, the coupling does exist in an uncracked rotor dynamic system. Tondl [1], Cohen and Porat [2] and Bernasconi [3] concluded that typical lateral excitations, such as unbalance, may result in both lateral and torsional responses of uncracked rotor. Furthermore, Muszynska et al. [4] and Bently et al. [5] discuss rotor coupled lateral and torsional vibrations due to unbalance, as well as due to shaft anisotropy and radial constant preload force. Their experimental results exhibited the existence of significant torsional vibrations, due to coupling with the lateral modes. Sawicki et al. [6,7] studied transient response of the cracked rotor, including the stalling effect under the constant driving torque.
EQUATION OF MOTION OF A CRACKED JEFFCOT ROTOR A cracked Jeffcott rotor with lateral and angular (torsional) degrees of freedom is considered. The rotor is subjected to a constant radial load (gravity force), rotating unbalance force, and the externally applied torque. The coupled torsional-
Please verify that (1) all pages are present, (2) all figures are acceptable, (3) all fonts and special characters are correct, and (4) all text and figures fit within themargin lines shown on this review document. Return to your MySPIE ToDo list and approve or disapprove this submission.
5767-38 V. 3 (p.1 of 12) / Color: No / Format: Letter / Date: 2005-03-19 06:20:09
SPIE USE: ____ DB Check, ____ Prod Check, Notes:

2
flexural vibrations are studied for a rotor with a breathing crack model. The sectioned view of the cracked rotor, in both inertial and rotating coordinates, is shown in Fig. 1. The stiffness of the uncracked rotor system is symmetric (isotropic), and the damping due to the air resistance effect is assumed to be viscous.
β
tωξ
η
ψ
sO
z
y
Φ
bO
θ
ε
ω
Figure 1. Section view of cracked Jeffcot rotor.
The angular position of the unbalance vector can be expressed as ( ) ( )t t tθ ω ψ β= + + , where ω is a constant spin speed of the shaft, ( )tψ is a torsional angle, and β is the fixed angle between the unbalance vector and the centerline of the transverse shaft surface crack. It should be noted that
( ) ( ), , and t t tω ψ θ ω ψ θ ψΦ = + ≡ Φ = + = Φ = (1)
where Φ is the spin angle of the rotor. The kinetic and potential energy for the rotor system subjected to lateral and torsional vibrations can be expressed as follows:
( ) ( )2 2 2 2 21 1 1 sin cos2 2 2pT J M z y M M z yθ ε θ εθ θ θ= + + + + − + (2)
21 12 2I t
zU z y k
yψ
= +
K (3)
where zz zy
Iyz yy
k k
k k
=
K (3a)
is the shaft stiffness matrix in inertial coordinates, with the off-diagonal elements corresponding to the asymmetry introduced either by a crack. Using the Lagrange approach, the nonlinear, coupled equations for transverse and torsional motion for the rotor system take the following form:
( )( )
2
2
cos sin
sin cos
l zz zy z
l yz yy y
Mz C z k z k y F M
My C y k z k y F M
ε θ θ θ θ
ε θ θ θ θ
+ + + = + +
+ + + = + − (4)
( ) ( ) ( ) ( )sin cos sin cos + sin cos ( )p t l z y zz zy yz yy eUJ C C z y F F k z k y k z k y T tψ ψ ε θ θ ε θ θ ε θ θψ∂ + + − − − + − + + = ∂
(5)
Please verify that (1) all pages are present, (2) all figures are acceptable, (3) all fonts and special characters are correct, and (4) all text and figures fit within themargin lines shown on this review document. Return to your MySPIE ToDo list and approve or disapprove this submission.
5767-38 V. 3 (p.2 of 12) / Color: No / Format: Letter / Date: 2005-03-19 06:20:09
SPIE USE: ____ DB Check, ____ Prod Check, Notes:

3
where Fz and Fy are the external forces (including gravity) in z and y directions, respectively, tC is torsional damping coefficient and Te is the externally applied torque. Uncracked shaft For the uncracked shaft the following conditions related to potential energy and stiffness components are satisfied:
tU kψψ∂
=∂
, zz yyk k k= ≡ and 0zy yzk k= ≡ (6)
Cracked shaft The stiffness matrix for a Jeffcott rotor with a cracked shaft in rotating coordinates can be written as:
( )0 00
0 00Rk kk
fk kk
ξ ξ
η η
∆ ≡ = − Φ ∆
K (7)
where the first matrix refers to the stiffness of the uncracked shaft, and the second defines the variations in shaft stiffness kξ∆ and kη∆ in ξ and η directions, respectively. The function ( )f Φ is a crack steering function which depends on the angular position of the crack,Φ , and the selected crack model. The simplest crack model is the hinge model, where the crack is assumed to change from its closed to open state suddenly as the shaft rotates. The steering function for this model is defined as:
( )0 for 01 for 0
fξξ<
Φ = ≥ (8)
While the hinge model might be an appropriate representation for very small cracks, Mayes and Davies [8] proposed a model with a smooth transition between the opening and closing of the crack that is more adequate for larger cracks. In this case the crack steering function, or the Mayes modified function, takes the following form:
1 cos( )( )2
f + ΦΦ = (9)
The stiffness matrix for a Jeffcott rotor with a cracked shaft in inertial coordinates, IK is derived as
1 2 21
2 1 2
cos 2 sin 20 ( )sin 2 cos 20 2
zz zyI R
yz yy
k k k k kk f kk k kk k k
− ∆ + ∆ Φ ∆ Φ Φ= = = − ∆ Φ ∆ − ∆ Φ
K TK T (10)
where the transformation matrix T is
cos sinsin cos
Φ − Φ = Φ Φ
T (11)
and
1k k
kk
ξ η∆ + ∆∆ = and 2
k kk
kξ η∆ − ∆
∆ = . (12)
The cross-stiffness for deep cracks has been accounted for assuming 6k kη ξ∆ = ∆ , which based on relationship in Eq.
(12), yields 176
kk
kξ∆
∆ = and 256
kk
kξ∆
∆ = . The derivative of the potential energy term Uψ∂∂
in Eq. (5) takes the
following form:
Please verify that (1) all pages are present, (2) all figures are acceptable, (3) all fonts and special characters are correct, and (4) all text and figures fit within themargin lines shown on this review document. Return to your MySPIE ToDo list and approve or disapprove this submission.
5767-38 V. 3 (p.3 of 12) / Color: No / Format: Letter / Date: 2005-03-19 06:20:09
SPIE USE: ____ DB Check, ____ Prod Check, Notes:
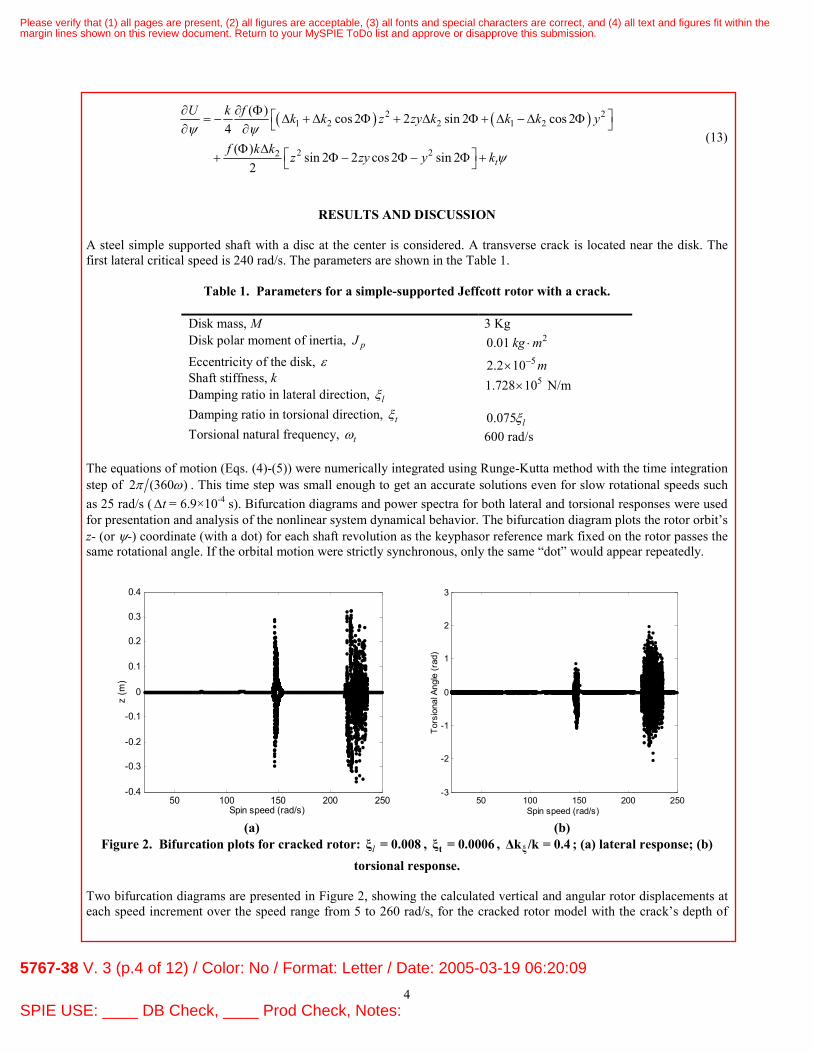
4
( ) ( )2 21 2 2 1 2
2 22
( ) cos 2 2 sin 2 cos 24
( ) sin 2 2 cos 2 sin 2
2 t
U k f k k z zy k k k y
f k kz zy y k
ψ ψ
ψ
∂ ∂ Φ = − ∆ + ∆ Φ + ∆ Φ + ∆ −∆ Φ ∂ ∂Φ ∆ + Φ − Φ − Φ +
(13)
RESULTS AND DISCUSSION A steel simple supported shaft with a disc at the center is considered. A transverse crack is located near the disk. The first lateral critical speed is 240 rad/s. The parameters are shown in the Table 1.
Table 1. Parameters for a simple-supported Jeffcott rotor with a crack.
Disk mass, M Disk polar moment of inertia, pJ Eccentricity of the disk, ε Shaft stiffness, k Damping ratio in lateral direction, lξ Damping ratio in torsional direction, tξ Torsional natural frequency, tω
3 Kg 20.01 kg m⋅
52.2 10 m−× 51.728 10× N/m
0.075 lξ 600 rad/s
The equations of motion (Eqs. (4)-(5)) were numerically integrated using Runge-Kutta method with the time integration step of 2 (360 )π ω . This time step was small enough to get an accurate solutions even for slow rotational speeds such as 25 rad/s ( t∆ = 6.9×10⁻⁴ s). Bifurcation diagrams and power spectra for both lateral and torsional responses were used for presentation and analysis of the nonlinear system dynamical behavior. The bifurcation diagram plots the rotor orbit’s z- (or ψ-) coordinate (with a dot) for each shaft revolution as the keyphasor reference mark fixed on the rotor passes the same rotational angle. If the orbital motion were strictly synchronous, only the same “dot” would appear repeatedly.
50 100 150 200 250-0.4
-0.3
-0.2
-0.1
0
0.1
0.2
0.3
0.4
Spin speed (rad/s)
z (m
)
50 100 150 200 250
-3
-2
-1
0
1
2
3
Spin speed (rad/s)
Tors
iona
l Ang
le (r
ad)
(a) (b)
Figure 2. Bifurcation plots for cracked rotor: lξ = 0.008 , tξ = 0.0006 , ξ∆k /k = 0.4 ; (a) lateral response; (b) torsional response.
Two bifurcation diagrams are presented in Figure 2, showing the calculated vertical and angular rotor displacements at each speed increment over the speed range from 5 to 260 rad/s, for the cracked rotor model with the crack’s depth of
Please verify that (1) all pages are present, (2) all figures are acceptable, (3) all fonts and special characters are correct, and (4) all text and figures fit within themargin lines shown on this review document. Return to your MySPIE ToDo list and approve or disapprove this submission.
5767-38 V. 3 (p.4 of 12) / Color: No / Format: Letter / Date: 2005-03-19 06:20:09
SPIE USE: ____ DB Check, ____ Prod Check, Notes:

5
0.4, and lateral and torsional damping ratios 0.008lξ = and 0.0006tξ = , respectively. The bifurcation plots appear to be alike; the results for the two different vibrational responses are comparable in terms of their general shapes. Resonances occur just below the lateral natural frequency and slightly above the half of lateral natural frequency, which one would expect for a non-linear system of this kind. Spanning the rotor spin speed in the range of 145-149 rad/sec and 216-234 rad/sec, reveals the presence of a wide variety of the excited response characteristics. This is demonstrated in Figs. 3 and 4, showing the magnified “snapshots” of the sections of bifurcation diagram presented in Figure 2(a), and the corresponding orbital motions. During the chaotic behavior the lateral vibration amplitudes increase more than 1000 times, which would be equivalent to the system failure. Figure 2(b) shows torsional response of the rotor which is not subjected to any externally applied torque excitation, and provides clear evidence for the existence of lateral/torsional coupling in the system due to presence of lateral excitations and crack.
-0.5 0 0.5-0.5
0
0.5orbit at 146 rad/s
y (m)
z (m
)
-0.5 0 0.5-0.5
0
0.5orbit at 150 rad/s
y (m)
z (m
)
-.0005 0 .0005 -.0005
0
.0005 orbit at 156 rad/s
y (m)
z (m
)
140 142 144 146 148 150 152 154 156 158 160-0.4
-0.3
-0.2
-0.1
0
0.1
0.2
0.3
0.4
Spin speed (rad/s)
z (m
)
Figure 3. Bifurcation plot for the cracked rotor: lξ = 0.008 , tξ = 0.0006 , ξ∆k /k = 0.4 .
Please verify that (1) all pages are present, (2) all figures are acceptable, (3) all fonts and special characters are correct, and (4) all text and figures fit within themargin lines shown on this review document. Return to your MySPIE ToDo list and approve or disapprove this submission.
5767-38 V. 3 (p.5 of 12) / Color: No / Format: Letter / Date: 2005-03-19 06:20:09
SPIE USE: ____ DB Check, ____ Prod Check, Notes:

6
-.0007 0 .0007 .0007
0
0007 orbit at 210 rad/s
y (m)
z (m
)
-0.7 0 0.7 -0.7
0
0.7
y (m)
z (m
)
orbit at 225 rad/s
-.0007 0 .0007
-.0007
0
.0007
orbit at 240 rad/s
y (m)
z (m
)
200 210 220 230 240 250 260-0.6
-0.4
-0.2
0
0.2
0.4
0.6
z (m
)
Spin speed (rad/s)
Figure 4. Bifurcation plot for the cracked rotor: lξ = 0.008 , tξ = 0.0006 , ξ∆k /k = 0.4 .
Figure 5 illustrates the lateral vibration responses for the uncracked and cracked rotor running at speed of 225 rad/s. There is no external torsional excitation applied to the rotor. It can be seen that uncracked rotor vibrates around its static deflection position with the small vibration amplitude (Fig. 5(a)). The corresponding power spectrum shows only synchronous frequency component due to unbalance excitation. In the presence of transverse crack of depth of 0.4, the rotor vibration amplitudes increase significantly, and the power spectrum illustrates the apparent system nonlinearity, indicating the multi-frequency content present in the vibration signal (Fig. 5(b)). Note the window of the FFT is taken to be the last steady state 50 system rotations. This condition was reached by allowing the inherent system hysteresis damp out all starting effects in the first 200 revolutions. If the motion is periodic or quasi-periodic, then the power spectrum will consist of a sequence of spikes at the fundamental frequencies, their harmonics, and the frequencies that are the sums and differences of the various frequencies. For the chaotic motion (e.g., non-periodic but non-random), the power spectrum shows a random broadband character. Figure 6 shows the torsional vibration responses for the uncracked and cracked rotor running at speed of 225 rad/s., without external torsional excitation applied to the rotor. Due to the nonlinear lateral/torsional coupling the unbalance excitation induces the uncracked rotor torsional response at predominantly torsional resonance frequency (600 rad/sec) and superharmonic frequency (2ω), (see Fig. 6(a)). After introducing transverse crack, the nonlinearities caused by the
Please verify that (1) all pages are present, (2) all figures are acceptable, (3) all fonts and special characters are correct, and (4) all text and figures fit within themargin lines shown on this review document. Return to your MySPIE ToDo list and approve or disapprove this submission.
5767-38 V. 3 (p.6 of 12) / Color: No / Format: Letter / Date: 2005-03-19 06:20:09
SPIE USE: ____ DB Check, ____ Prod Check, Notes:
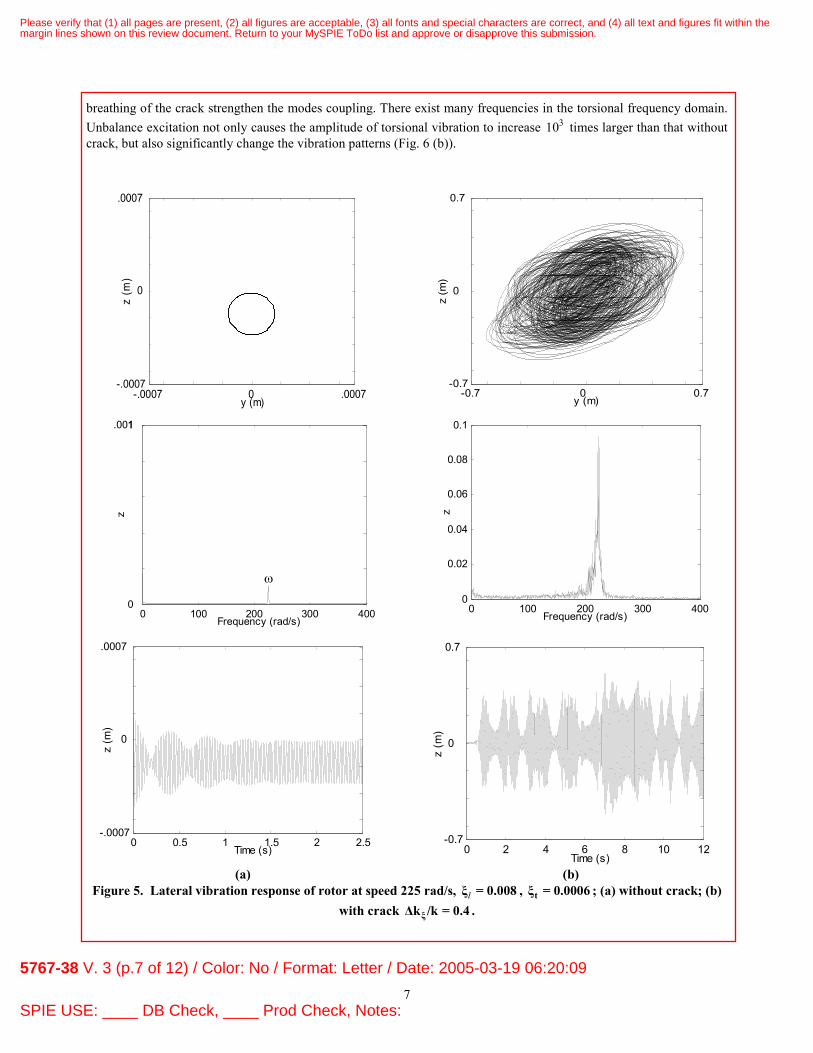
7
breathing of the crack strengthen the modes coupling. There exist many frequencies in the torsional frequency domain. Unbalance excitation not only causes the amplitude of torsional vibration to increase 310 times larger than that without crack, but also significantly change the vibration patterns (Fig. 6 (b)).
-.0007 0 .0007 -.0007
0
.0007
y (m)
z (m
)
-0.7 0 0.7
-0.7
0
0.7
y (m)
z (m
)
0 100 200 300 4000
.001 1
Frequency (rad/s)
z
ω
0 100 200 300 400
0
0.02
0.04
0.06
0.08
0.1
Frequency (rad/s)
z
0 0.5 1 1.5 2 2.5-.0007
0
.0007
Time (s)
z (m
)
0 2 4 6 8 10 12-0.7
0
0.7
Time (s)
z (m
)
(a) (b)
Figure 5. Lateral vibration response of rotor at speed 225 rad/s, lξ = 0.008 , tξ = 0.0006 ; (a) without crack; (b) with crack ξ∆k /k = 0.4 .
Please verify that (1) all pages are present, (2) all figures are acceptable, (3) all fonts and special characters are correct, and (4) all text and figures fit within themargin lines shown on this review document. Return to your MySPIE ToDo list and approve or disapprove this submission.
5767-38 V. 3 (p.7 of 12) / Color: No / Format: Letter / Date: 2005-03-19 06:20:09
SPIE USE: ____ DB Check, ____ Prod Check, Notes:

8
0 200 400 600 800 10000
0.5
1
1.5
2
2.5
3x 10
-7
Frequency (rad/s)
Tors
iona
l Ang
leωt
0 200 400 600 800 10000
0.05
0.1
0.15
0.2
0.25
0.3
Frequency (rad/s)
Tors
iona
l Ang
le ω
2ω
ωt
3ω
0 0.5 1 1.5 2-3
-2
-1
0
1
2
3x 10
-6
Time (s)
Tors
iona
l def
lect
ion
(rad
)
0 2 4 6 8 10 12
-3
-2
-1
0
1
2
3
Time (s)
Tors
inal
ang
le (r
ad)
(a) (b) Figure 6. Torsional vibration response of rotor at speed 225 rad/s, lξ = 0.008 , tξ = 0.0006 ; (a) without crack; (b)
with crack ξ∆k /k = 0.4 .
The comparison of lateral and torsional response for the cracked rotor is presented in Figure 7. Here, the values of parameters used for simulation are the same as those used for Figures 5 and 6, except for the increased value of damping, i.e., 0.048lξ = and 0.075t lξ ξ= . By comparing responses shown in Figs. 5(b) and 6(b) with the ones on Fig. 7, one can observe that the chaotic behavior of the response disappear for this values of the increased damping. Figures 8 and 9 illustrate bifurcation diagrams showing the response for different damping levels ( 0.005 0.05lξ = − ) and depth of the crack ( / 0.2 0.4k kξ∆ = − ), respectively. These results clearly suggest the possibility of the use of chaos mapping of monitored vibration signals as a diagnostic tool to detect some rotating machinery malfunctions. As the damping ratio or crack depth are ranged over the interval illustrated in Figs. 8 and 9, a wide variety of response characteristics are excited. Finally, a torsional excitation of ( ) 800sin(240 )eT t t= was applied to the case of the cracked rotor, again, in addition to the unbalance and gravity forces. These results are shown in Fig. 10. The selected rotor spin speeds are an integer and not-integer fraction of the bending natural frequency, i.e., 0.1 nω =24 rad/s and 0.13 nω =31 rad/s, respectively. For both speed cases the power spectra look similar, in addition to such crack “indicators” as the 2X and 3X components, the
Please verify that (1) all pages are present, (2) all figures are acceptable, (3) all fonts and special characters are correct, and (4) all text and figures fit within themargin lines shown on this review document. Return to your MySPIE ToDo list and approve or disapprove this submission.
5767-38 V. 3 (p.8 of 12) / Color: No / Format: Letter / Date: 2005-03-19 06:20:09
SPIE USE: ____ DB Check, ____ Prod Check, Notes:

9
0 100 200 300 400 500 6000
0.2
0.4
0.6
0.8
1x 10
-4
Frequency (rad/s)
z
ω
2ω
0 200 400 600 800 1000 1200
0
1
2
3
4
5x 10
-7
Frequency (rad/s)
Tors
iona
l Ang
le
ω
2ω
3ω
4ω
5ω ωt
0 0.5 1 1.5 2
-4
-2
0
2
x 10-4
Time (s)
Ampl
itude
in z
dire
ctio
n
0 0.5 1 1.5 2-1.5
-1
-0.5
0
0.5
1
1.5x 10
-6
Time (s)
Tors
iona
l ang
le (r
ad)
(a) (b)
Figure 7. Vibration of cracked rotor at speed 225 rad/s; lξ = 0.048 , ltξ = 0.075ξ , ξ∆k /k = 0.4 ; (a) lateral response; (b) torsional response.
0.01 0.02 0.03 0.04 0.05-0.6
-0.4
-0.2
0
0.2
0.4
0.6 p
z
Damipng ratio 0.01 0.02 0.03 0.04 0.05
-2
-1
0
1
2
Damping ratio
Tors
iona
l Ang
le (r
ad)
(a) (b)
Figure 8. Bifurcation plots for cracked rotor at speed /=ω 225 rad s ; t lξ = 0.075ξ , ξ∆k /k = 0.4 ; (a) lateral response; (b) torsional response.
Please verify that (1) all pages are present, (2) all figures are acceptable, (3) all fonts and special characters are correct, and (4) all text and figures fit within themargin lines shown on this review document. Return to your MySPIE ToDo list and approve or disapprove this submission.
5767-38 V. 3 (p.9 of 12) / Color: No / Format: Letter / Date: 2005-03-19 06:20:09
SPIE USE: ____ DB Check, ____ Prod Check, Notes:

10
0.2 0.25 0.3 0.35 0.4-0.4
-0.3
-0.2
-0.1
0
0.1
0.2
0.3
0.4p
Depth of the crack
z
0.2 0.25 0.3 0.35 0.4
-2
-1
0
1
2
Depth of the crack
Tors
iona
l Ang
le (r
ad)
(a) (b)
Figure 9. Bifurcation plots for cracked rotor at speed /=ω 225 rad s , lξ = 0.01 ; t lξ = 0.075ξ , ξ∆k /k = 0.4 ; (a) lateral response; (b) torsional response.
-8 -6 -4 -2 0 2 4 6 8
x 10-5
-3.5
-3
-2.5
-2
-1.5
-1
-0.5x 10
-4
y (m)
z (m
)
-8 -6 -4 -2 0 2 4 6 8
x 10-5
-3.5
-3
-2.5
-2
-1.5
-1
-0.5x 10
-4
y (m)
z (m
)
0 50 100 150 200 250 300 350 4000
1
2
3
4
5
6x 10
-5
Frequency (rad/s)
z
ω
2ω
3ω
ωe
ωe-ω
ωe+ω
ωe-2ω
ωe-4ω
ωe+2ω
ωe+3ω
ωe-3ω
0 100 200 300 400
0
1
2
3
4
5
6x 10
-5
Frequency (rad/s)
z
ω
3ω
ωe
ωe+ω ωe
+2ω
ωe+3ω
ωe-ω
ωe-2ω
ωe-3ω
2ω
(a) (b)
Figure 10. Orbits and power spectra of cracked rotor; lξ = 0.008 , t lξ = 0.075ξ , ξ∆k /k = 0.4 , Te(t) = 800sin(240t); (a) speed 24 rad/s; (b) speed 31 rad/s.
Please verify that (1) all pages are present, (2) all figures are acceptable, (3) all fonts and special characters are correct, and (4) all text and figures fit within themargin lines shown on this review document. Return to your MySPIE ToDo list and approve or disapprove this submission.
5767-38 V. 3 (p.10 of 12) / Color: No / Format: Letter / Date: 2005-03-19 06:20:09
SPIE USE: ____ DB Check, ____ Prod Check, Notes:
11
torsional excitation frequency eω =240 rad/sec is seen along with the side frequencies eω ω± , 2eω ω± , and 3eω ω± , which are located around eω . These frequencies are generated as a result of the non-linear mechanism of the breathing crack under the influence of unbalance, gravity, and harmonic torsional excitation. However, the analysis of the orbital motion reveals that in the case of speed of 31 rad/s the orbit rotates in the opposite direction of the rotor’s rotating direction. Simulations of orbits considering frequencies shown in corresponding to this case FFT spectrum (see Fig. 10(b)) have shown presence of frequency components being backward whirl fraction. Therefore, for this speed, the rotor vibration in the presence of the applied external torque is not periodic but quasi-periodic, where the ratios of the involved frequencies are not the ratios of integers.
CONCLUSIONS
An analytical solution was developed for the Jeffcott rotor taking into account coupling between the torsional and bending vibrations. This was achieved by the inclusion of the third equation for torsional vibration. The modeling was further enhanced by considering the nonlinearities associated with a breathing crack located on the shaft adjacent to the disk. Numerical simulations of the uncracked and cracked cases were carried out by applying an unbalance excitation, gravity forces, and a torsional excitation.
When comparing the torsional and lateral frequency spectrums for the uncracked and cracked cases, very clear distinctions were noticed. In each case (uncracked and cracked), the system was excited by the residual unbalance and gravitational forces, and then by the addition of a torsional excitation. The sum and difference frequencies have been observed in a response of cracked rotor due to unbalance and external torsional excitation. By employing nonlinear vibration theory, some phenomena evolving out of crack in rotating systems have been addressed, such as the numerical study of the bifurcation of the parameter dependent system. The uniqueness of the observed crack signatures, captured by the analytical approach, demonstrates an improvement in early diagnosis of rotor cracks.
NOMENCLATURE
lC Damping coefficients in z and y direction, respectively
lC Torsional damping coefficient , z yF F External forces in z and y directions, respectively
pJ Disk polar moment of inertia M Disk mass ω Constant spin speed of the shaft ψ Torsional angle β Angle between the unbalance vector and the crack center line k Stiffness of uncracked rotor.
, zz yyk k Direct stiffness terms in z and y direction, respectively.
zyk Cross stiffness term introduced by the shaft asymmetry
tk Torsional stiffness ε Eccentricity of the disk
lξ Damping ratio in lateral direction
tξ Damping ratio in torsional direction
tω Torsional natural frequency
nω Lateral natural frequency ( )eT t External torque , ,ζ ξ η Rotor-fixed coordinates system
Please verify that (1) all pages are present, (2) all figures are acceptable, (3) all fonts and special characters are correct, and (4) all text and figures fit within themargin lines shown on this review document. Return to your MySPIE ToDo list and approve or disapprove this submission.
5767-38 V. 3 (p.11 of 12) / Color: No / Format: Letter / Date: 2005-03-19 06:20:09
SPIE USE: ____ DB Check, ____ Prod Check, Notes:

12
,z y Inertia coordinate system , k kξ η∆ ∆ Reduced stiffness in and ξ η direction, respectively
REFERENCES
1. Tondl, A., “Some Problems of Rotor Dynamics”, Publishing House of Czechoslovakia Academy of Science,
Praque, 1965. 2. Cohen, R. and Porat, I., “Coupled Torsional and Transverse Vibration of Unbalanced Rotor,” ASME Journal of
Applied Mechanics, Vol. 52, pp. 701-705, 1985. 3. Bernasconi, O., “Bisynchronous Torsional Vibrations in Rotating Shafts,” ASME Journal of Applied Mechanics,
Vol. 54, pp. 893-897, 1987. 4. Muszynska, A., Goldman, P. and Bently, D. E., “Torsional/Lateral Cross-Coupled Responses Due to Shaft
Anisotropy: A New Tool in Shaft Crack Detection”, I. Mech. E., C432-090, Bath, United Kingdom, pp. 257-262, 1992.
5. Bently, D. E., Goldman, P. and Muszynska, A., ““Snapping” Torsional Response of an Anisotropic Radially Loaded Rotor,” Journal of Engineering for Gas Turbines and Power, Vol. 119, pp. 397-403, 1997.
6. Sawicki, J.T., Wu, X., Baaklini, G., and Gyekenyesi, A.L., “Vibration-Based Crack Diagnosis in Rotating Shafts During Acceleration through Resonance,” Proceedings of SPIE 10th Annual International Symposium on Smart Structures and Materials, San Diego, California, 2003.
7. Sawicki, J.T., Bently, D.E., Wu, X., Baaklini, G., and Friswell, M.I., “Dynamic Behavior of Cracked Flexible Rotor Subjected to Constant Driving Torque,” Proceedings of the 2nd International Symposium on Stability Control of Rotating Machinery, Gdansk, Poland, pp. 231-241, 2003.
8. Mayes, I. W. and Davies, W. G. R., “Analysis of the Response of a Multi-Rotor-Bearing System Containing a Transverse Crack in a Rotor”, ASME Journal of Vibration, Acoustics, Stress, and Reliability in Design, Vol. 106, pp 139-145, 1984.
Please verify that (1) all pages are present, (2) all figures are acceptable, (3) all fonts and special characters are correct, and (4) all text and figures fit within themargin lines shown on this review document. Return to your MySPIE ToDo list and approve or disapprove this submission.
5767-38 V. 3 (p.12 of 12) / Color: No / Format: Letter / Date: 2005-03-19 06:20:09
SPIE USE: ____ DB Check, ____ Prod Check, Notes:

Structural Damage Assessment of Propulsion System Components by Impedance Based Health Monitoring
Richard E. Martin*, Andrew L. Gyekenyesi **,Jerzy T. Sawicki†, George Y. Baaklini††,
*Cleveland State University, Dept. of Civil and Environmental Eng., Cleveland, OH 44115;
**OAI/NASA Glenn Research Center, Cleveland, OH 44135; †Cleveland State University, Dept. of Mechanical Engineering, Cleveland, OH 44115;
††NASA Glenn Research Center, Cleveland, OH 44135
ABSTRACT Critical components of propulsion systems frequently operate at high stress levels for long periods of time. The integrity of these parts must be proven by non-destructive evaluation (NDE) during various manufacturing steps and also during systematic overhaul inspections. Conventional NDE methods, however, have unacceptable limits. Some of these techniques are time-consuming and inconvenient for service aircraft testing. Impedance-based structural-health-monitoring (SHM) uses piezoelectric (PZT) patches that are bonded onto or embedded in a structure; each individual patch both actuates the surrounding structural area and senses the resulting structural response. The size of the excited area varies with the geometry and material composition of the structure. A series of experiments on simple geometry specimens (thin-gage aluminum square plates) was conducted for assessing the potential of E/M impedance method for structural damage detection. Based on the results of this preliminary study, further testing was conducted on a subscale disk specimen. Based on the results it can be concluded that the E/M impedance method has the potential to be used for damage detection of structures. The experimental method, signal processing, and damage detection algorithm should be tuned to the specific method used for structural interrogation.
INTRODUCTION
Structural health monitoring (SHM) is an essential element of modern structural components. The idea of equipping structures with sensors and actuators in an attempt to impart “smartness” has great potential for establishing a cost effective, in-situ maintenance routine1. This is especially true for critical high performance, aerospace components where accessibility using traditional nondestructive evaluation techniques is limited (e.g., turbine propulsion components) or even impossible (e.g., long duration space exploration vehicles). Some examples of manual and time consuming nondestructive evaluation techniques (NDE), which are typically utilized off-wing in the aerospace industry, include eddy current, ultrasonic, fluorescent penetrant, magnetic particle, optical, and radiographic inspection2. Regarding the cost effectiveness of reduced manual inspections, it is estimated that nearly 27% of an aircraft’s life cycle cost is spent on inspections and repairs3. With an on-line, self actuated system such costs can be dramatically reduced. Furthermore, the impact of such an in-situ SHM system is that it not only increases safety and performance, but also enables converting schedule based into condition based maintenance, thus reducing both down time and costs4. The impedance based approach has demonstrated unique features that meet the requirements of an on-line SHM system. This form of structural health monitoring is based on the use of a sensor/actuator patch to obtain real-time and continuous measurements that reflect the health status of the monitored structure. This paper describes the development of an impedance based SHM system from hardware acquisition, to software development, to procedural methodology and, lastly, experimentation using undamaged and damaged aluminum plates and disks.
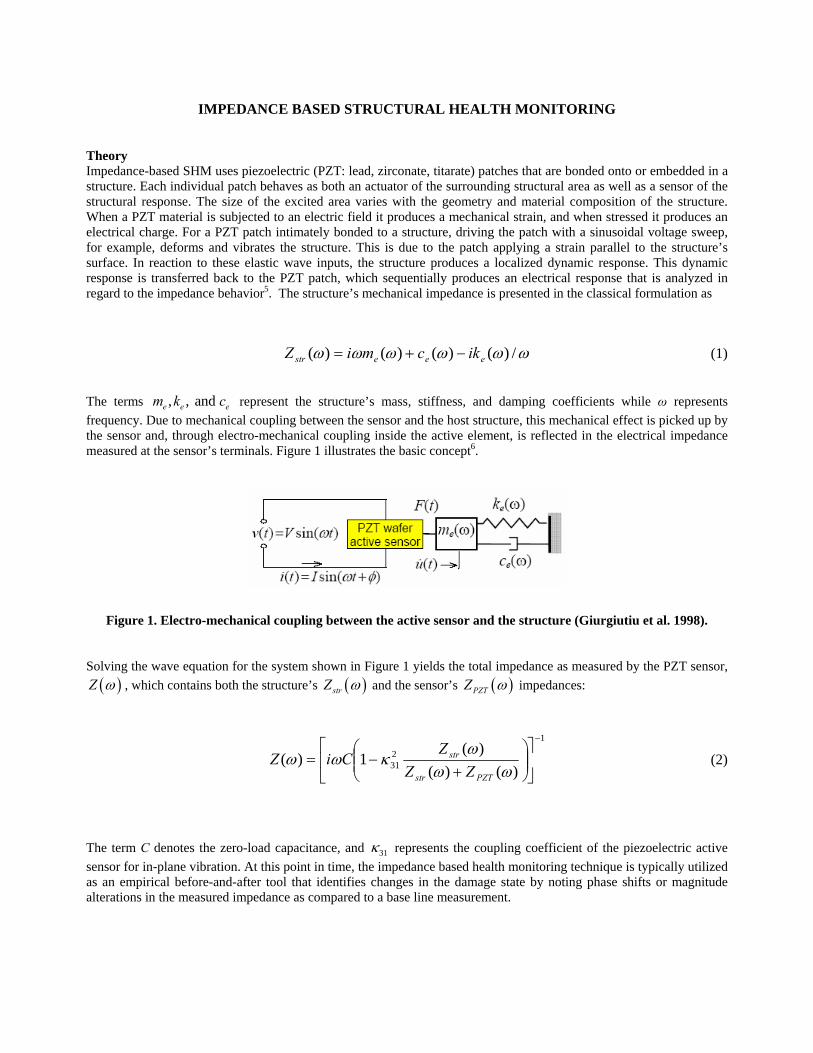
IMPEDANCE BASED STRUCTURAL HEALTH MONITORING Theory Impedance-based SHM uses piezoelectric (PZT: lead, zirconate, titarate) patches that are bonded onto or embedded in a structure. Each individual patch behaves as both an actuator of the surrounding structural area as well as a sensor of the structural response. The size of the excited area varies with the geometry and material composition of the structure. When a PZT material is subjected to an electric field it produces a mechanical strain, and when stressed it produces an electrical charge. For a PZT patch intimately bonded to a structure, driving the patch with a sinusoidal voltage sweep, for example, deforms and vibrates the structure. This is due to the patch applying a strain parallel to the structure’s surface. In reaction to these elastic wave inputs, the structure produces a localized dynamic response. This dynamic response is transferred back to the PZT patch, which sequentially produces an electrical response that is analyzed in regard to the impedance behavior5. The structure’s mechanical impedance is presented in the classical formulation as
ωωωωωω /)()()()( eeestr ikcmiZ −+= (1)
The terms , , and e e em k c represent the structure’s mass, stiffness, and damping coefficients while ω represents frequency. Due to mechanical coupling between the sensor and the host structure, this mechanical effect is picked up by the sensor and, through electro-mechanical coupling inside the active element, is reflected in the electrical impedance measured at the sensor’s terminals. Figure 1 illustrates the basic concept6.
Figure 1. Electro-mechanical coupling between the active sensor and the structure (Giurgiutiu et al. 1998).
Solving the wave equation for the system shown in Figure 1 yields the total impedance as measured by the PZT sensor, ( )Z ω , which contains both the structure’s ( )strZ ω and the sensor’s ( )PZTZ ω impedances:
1
231 )()(
)(1)(
−
⎥⎦
⎤⎢⎣
⎡⎟⎟⎠
⎞⎜⎜⎝
⎛+
−=ωω
ωκωω
PZTstr
str
ZZZ
CiZ (2)
The term C denotes the zero-load capacitance, and 31κ represents the coupling coefficient of the piezoelectric active sensor for in-plane vibration. At this point in time, the impedance based health monitoring technique is typically utilized as an empirical before-and-after tool that identifies changes in the damage state by noting phase shifts or magnitude alterations in the measured impedance as compared to a base line measurement.

Experimental Set-up Figure 2 shows the experimental set-up utilized for capturing electromechanical (E/M) impedance data. The E/M impedance data were taken using an HP 4194A impedance analyzer connected to a computer via the GPIB interface. A custom software program was developed for control of the impedance analyzer functions as well as acquisition, processing and display of the collected data. Of particular importance was the ability to modify the frequency sweep range, step size, excitation voltage, and equivalent circuit mode (series or parallel) for a given test. For each test, impedance data were acquired at every discrete excitation frequency within the sweep. In this study, only the real portion of the impedance was collected and analyzed as this has been shown to be the most sensitive in regard to damage identification7. Following data acquisition, the software provided functions for displaying collected data, averaging, performing damage metric calculations and exporting raw and reduced data.
Figure 2. Experimental setup.
Damage Metric In order to quantify damage, a metric was employed that examines the change in the E/M impedance response with regard to the baseline condition. This damage metric, D, is expressed as ( )21 ρ−=D (3)
where,
)()(
)cov(YX
XYσσ
ρ = (4)
The term ρ represents the correlation coefficient concerning the baseline, (X), and damaged, (Y), E/M impedance responses. It is a function of the covariance, cov(XY), and standard deviations, σ(X) and σ(Y), of the response values8. The damage metric will range from 0 for the undamaged case to 1 for fully damaged case (i.e., no correlation between the before-and-after impedance measurements). Similar approaches have been utilized in other studies (e.g., Giurgiutiu et al. 1998).
Aluminum plate
PZT patch
Impedance Analyzer
Computer

EXPERIMENTAL PROCEDURE Plate Specimens A series of experiments on two, simple geometry specimens (thin-gage aluminum square plates) were conducted for assessing the potential of the impedance based health monitoring system. The plate specimens, each measuring 100×100-mm with a thickness of 1.5-mm, were made from 6061-T6 aluminum alloy sheet. Each plate was instrumented with one 10×10-mm PZT patch (material PSI-5A4E, thickness 0.19-mm attached using cyanoacrylate adhesive) purposely located at a vibration-sensitive location. This location was determined by conducting a finite element analysis focusing on the modal response of the plate and placing the patch in an area suspect to maximum displacements. After capturing baseline data for each of the undamaged plates, a single 10-mm straight, through-thickness EDM notch (0.3 mm width) was utilized to simulate a crack. The notch locations for each plate are shown in Figure 3. As was the case for the patch placement, the notches were located in areas of maximum displacement as defined by the finite element analyses. During the experiments, the specimens were supported on foam to simulate free-free conditions. Preliminary tests were conducted to determine the frequency range best suited for measuring the damage dependent changes in the impedance response. Impedance values were collected for 15 repetitions over a wide, 20 – 200 kHz, frequency range for each specimen in the undamaged state. The 15 repetitions were then averaged (i.e., a single impedance plot using the 15 repeats) and compared to one of the 15 samples (randomly chosen) from within the same data set. This was done for each of the two plates. The intent was to look for a frequency window that produced the best repeatability over the 15 measurements in the undamaged state by avoiding noisy frequency regions that lack consistency between measurements. To this end, the damage metric was calculated for a 10 kHz wide, sliding window starting at 20 kHz and ending at 200 kHz. The step size for the window and the accompanying damage calculation was 1 kHz. Once a suitable frequency range was selected, a second set of measurements utilizing this range were made on the plates following the introduction of the notch.
Plate 1 Plate 2
Figure 3. Schematic of specimens with simulated cracks and PZT sensors. Disk Specimen A second set of tests were conducted on a subscale disk that will be used to evaluate various propulsion system damage detection methodologies. The disk, shown in figure 4 was constructed of titanium with an outside diameter of 235 mm. and a bore diameter of 46 mm. The disk was supported in the same manner as the plate specimens. In this proof of concept evaluation, a 10mm square PZT patch was placed on the web of the disk. A set of 5 baseline impedance measurements were made over a range of 20-40 kHz. This range was selected using the same procedure as the plate samples. Following the baseline measurements, a small, 2.2 g., mass was attached the disk in order to simulate a change in the structural response of the disk. The mass was placed at 90 degree increments from the patch at the same
20mm Position of simulated crack
PZT
20mm
Position of simulated crack
PZT

distance from the center as the sensor and the impedance measurements repeated. Following the application of the mass, another set of measurements were made to determine the repeatability of the baseline E/M impedance response.
Figure 4. Disk specimen with mass and PZT sensor locations.
RESULTS
Plate Specimens Figure 5 shows a plot of the damage metric versus the central frequency of the windowed region in the undamaged plates. As mentioned above, this procedure was done in order to search for frequency regions that offered good repeatability under constant conditions (i.e., undamaged case). It can be seen from this plot that the damage metric was consistently valued at zero from 20 kHz to approximately 45 kHz, meaning that the two plots correlate well in that frequency range. The damage metric, in regions of good repeatability, should be close to zero, since the material state was maintained (zero damage in this case). Beyond 45 kHz, however, there was a measurable increase in the damage parameter. Based on these results, a frequency range of 20-40 kHz was chosen for subsequent E/M impedance measurements.

0
0.01
0.02
0.03
0.04
0.05
0.06
20 40 60 80 100 120 140 160 180 200
Frequency (kHz)
Dam
age
met
ric, E
q. (3
)
Plate #1 Damage Metric
Plate #2 Damage Metric
Figure 5. Windowed correlation coefficient (20-200 kHz, 10 kHz window, 1 kHz step) for two uncracked plates.
Next, a comparison was made between the baseline of plate 1 and the baseline of plate 2. Figure 6 shows the E/M impedance plots as well as indicating the damage parameter value based on the correlation of the two plates (Equation 3). Each of the impedance plots was an average of 15 repetitions. The damage metric (D=0.965) indicated that there was much discrepancy between the two baseline measurements. As stated earlier, the large specimen to specimen variations dictate that the method be utilized as a comparison of baseline and subsequent measurements within the same specimen. Similar observations were made by Winston et al. 20012.
Plate # 1 and # 2 D = 0.965
0
200
400
600
800
1000
1200
1400
1600
20 25 30 35 40
Frequency (kHz)
Real
par
t of i
mpe
danc
e (O
hm) Plate # 1 Baseline
Plate # 2 Baseline
Figure 6. Comparison of undamaged plates 1 and 2 (20-40 kHz). Damage metric, D, was 0.965 indicating a lack of correlation between the two plates.

Figure 7 shows the results of comparing the baseline and the notched (i.e., damaged) cases for plate 1. The presence of the notch did modify the frequency response function. This was indicated by the shifting of the resonant frequencies and by the appearance of new resonances. The calculated correlation coefficient for this case was ρ=0.497, and the damage metric was D= 0.253 based on Equation (3). Next, Figure 8 shows the results for plate 2 comparing the undamaged baseline with the damaged case, again, calculated using 15 repetitions for each plot. The correlation coefficient for plate 2 was ρ=0.365, and the damage metric was D= 0.403. Note that plate 2 before-and-after notch comparisons showed a larger damage metric as compared to the plate 1 case, even though the plate 2 notch was located farther from the PZT patch. At this point there is no explanation for this behavior, although, the uniqueness of the plate to plate behaviors probably plays a part. Furthermore, the changes in the E/M impedance could also be influenced by the notch location as it relates to the plate’s vibration displacement response and node locations. Further research needs to be conducted concerning these results.
Plate #1 D = 0.253
0
200
400
600
800
1000
1200
20 25 30 35 40
Frequency (kHz)
Rea
l par
t of i
mpe
danc
e (O
hm)
Plate #1 BaselinePlate #1 With Notch
Figure 7. Averaged E/M impedance results for plate 1 with and without a notch.
Plat e # 2D = 0 .4 0 3
0
200
400
600
800
1000
1200
1400
1600
20 25 30 35 40
Frequency (kHz)
Plate #2 Basel ine
Plate #2 With Notch
Figure 8. Averaged E/M impedance results for plate 2 with and without a notch.

Disk Specimen Figure 9 shows a comparison between the baseline E/M impedance response of the disk and the disk with the mass applied at one of previously specified locations. Examination of the response plot shows both changes in amplitude and shifting of response peaks. Figure 10 displays a summary of the calculated damage parameters at the various locations compared to the baseline condition. Results show that application of the added mass produces a measurable change in the damage parameter at each location. Measurement of the E/M response after testing indicates that the system returns to the baseline values (i.e. a zero damage parameter). Based on these results, it seems that the damage parameter is smaller (indicates less damage) with the mass at the farthest location. This appears to indicate that the location and number of sensors in an application must be considered in choosing a health monitoring scheme in order to assure full coverage of the structure with adequate sensitivity.
0
100
200
300
400
500
600
700
800
900
20 25 30 35 40
Frequency (KHz)
Rea
l par
t of i
mpe
danc
e (O
hm)
BaselineMass Location #1
Figure 9. Averaged E/M impedance results for disk with and without added mass.
0
0.05
0.1
0.15
0.2
0.25
0.3
0.35
Mass Location #1 Mass Location #2 Mass Location #3 Return to Baseline
Dam
age
met
ric E
q.(3
)
Figure 10. Damage metric with added mass at various locations.
CONCLUSIONS
The results of this study demonstrate the ability of impedance based health monitoring to detect damage and structural changes in both aluminum plates and subscale propulsion type components. In addition, a methodology was developed that assists in choosing a frequency range for E/M impedance measurements in order to reduce test time and increase
data integrity. This method was based on finding frequency ranges that offered the best repeatability (i.e., lowest noise) as expressed by either a high test to test correlation or low damage value. Next, simulated cracks, in the form of narrow notches, were analyzed using PZT patches as impedance measuring transducers. Conclusions from the experiments on the two aluminum plates were as follows: The assessment of the impedance behavior regarding the two undamaged plates indicated that variations between specimens overrode changes due to damage. Therefore, it was shown that the impedance method was best utilized as a comparison of baseline and subsequent measurements concerning the same specimen. Next, the E/M impedance measurements were able to recognize the changes between the undamaged and damaged (i.e., notched) cases for each plate, although, larger changes were observed for plate 2 even though the notch was located farther from the PZT patch as compared to plate 1. This may have been due the uniqueness of the plate to plate behaviors, as well as the influence of notch and patch locations as it relates to the plate’s displacement response and node locations. Further research is needed regarding this observation. Based on the results of the plate tests, the method was applied to a subscale turbine disk. The results from these tests indicate that the method described above has potential application in the structural health monitoring of propulsion system components. Although the tests were conducted on an idealized component in a static condition, it is reasonable to assume that, based on the demonstrated sensitivity, the method can be extended to larger scale components subjected to dynamic loads. Due to the sensitivity of the measurements, however, it may be necessary to consider utilizing an unbounded damage parameter such as the one employed by Peairs5. With the establishment of the hardware and software as well as success concerning the preliminary experiments, the system will be further tuned to the various material systems (e.g., composites or thermal protection system materials) and structures that are of most interest to NASA. This includes the application of the technique to rotor components (either aero or space propulsion) by utilizing slip ring connections or interrupted testing. In addition, in cooperation with the Virginia Polytechnic Institute and State University, research is being conducted regarding wireless and self powering applications especially relating to space exploration vehicles. This will allow impedance based SHM to be applied in a vast array of applications. Lastly, the same PZT patches can be utilized as ultrasonic transducers, thereby creating a layered health monitoring system that is permanently attached to a structure allowing for continuous feedback regarding system health. This will allow for the identification of a damage condition and, based on ultrasonic response, identify the size, location and type of damage.
REFERENCES 1. Bhalla, S. and Soh, C. K., “Structural Health Monitoring by Piezo-Impedance Transducers. I: Modeling,” Journal
of Aerospace Engineering, October, 2004. 2. Winston, H.A., Sun F., and Annigeri, B.S., “Structural Health Monitoring With Piezoelectric Active Sensors,”
Journal of Engineering for Gas T 3. Kessler, S.S., Spearing, S.M., Atala, M.J., Cesnik, C.E.S., and Soutis, C., “Damage Detection in Composite
Materials Using Frequency Response Methods,” Composites Part B, Volume 33, 2002. 4. Bray, D.E. and Roderick S.K., “Nondestructive Evaluation”, McGraw-Hill, New York, 1989. 5. Peairs, D.M., Park, G., and Inman D.J., “Improving Accessibility of the Impedance-Based Structural Health
Monitoring Method,” Journal of Intelligent Material Systems and Structures, Volume 15, February, 2004. 6. Giurgiutiu, V., Reynolds, A., and Rogers, C.A., “Experimental Investigation of E/M Impedance Health Monitoring
for Spot-Welded Structural Joints,” Journal of Intelligent Material Systems and Structures, September, 1998. 7. Kabeya, K., “Structural Health Monitoring Using Multiple Piezoectric Sensors and Actuators,” Masters Thesis,
Virginia Polytechnic Institute and State University, 1998. 8. Miller, I. and Freund, J.E., “Probability and Statistics for Engineers,” Prentice Hall, Englewood Cliffs, New Jersey,
1985.

1 Copyright © 2005 by ASME
Proceedings of GT2005 ASME Turbo Expo 2005: Power for Land, Sea and Air
June 6-9, 2005, Reno-Tahoe, Nevada, USA
GT2005-68839
FINITE ELEMENT ANALYSIS OF COUPLED LATERAL AND TORSIONAL VIBRATIONS OF A ROTOR WITH MULTIPLE CRACKS
Xi Wu Rotor-Bearing Dynamics & Diagnostics Laboratory
Cleveland State University Cleveland, OH 44115-2214
Jerzy T. Sawicki Rotor-Bearing Dynamics & Diagnostics Laboratory
Cleveland State University Cleveland, OH 44115-2214
Michael I. Friswell
University of Bristol, Department of Aerospace Engineering, Bristol BS8 1TR, UK
George Y. Baaklini NASA Glenn Research Center
21000 Brookpark Road, MS 77-1 Cleveland, OH 44135
ABSTRACT
The coupling between lateral and torsional vibrations has been investigated for a rotor dynamic system with breathing crack model. The stiffness matrix has been developed for the shaft element which accounts for the effect of the crack and all six degrees of freedom per node. Since the off-diagonal terms of the stiffness matrix represent the coupling of the respective modes, the special attention has been paid on accurate determination of their values. Based on the concepts of fracture mechanics, the variation of the stiffness matrix over the full shaft revolution is represented by the truncated cosine series where the fitting coefficient matrices are extracted from the stiffness matrices of the cracked shaft for a number of its different angular positions. The variation of the system eigenfrequencies and dynamic response of the rotor with two cracks have been studied for various shaft geometries, crack axial locations, and relative phase of cracks.
INTRODUCTION
Any new advancement in on-line detection and diagnosis of critical malfunctions in rotating machinery can be extremely beneficial to industry [1]. This especially applies to fatigue cracks on the shaft, which present a potential source for catastrophic failures of rotating machinery. Most reported studies are focused on two crack signatures, i.e., twice the running frequency component (2X) and the subharmonic component at approximately half of the shaft critical speed. A study done by Tondl [2] was one of the first to investigate the effect of the coupled lateral and torsional vibrations on turbogenerator rotor stability. He concluded that the combined effect of torsional stiffness and bending stiffness results in speed intervals where the rotor vibrations due to residual unbalance become unstable. A comprehensive literature review
of various crack modeling techniques and system behavior of cracked rotor is given by Wauer [3]. Papadopoulos and Dimarogonas [4] used a non-rotating cracked Timoshenko shaft to demonstrate the existence of an apparent coupling of torsional and bending vibration. They modeled crack using the local flexibility matrix, and then proceeded to study the vibration spectra in the presence of harmonic excitations. Other researchers also dealt with the problem of coupled vibrations, for example Plaut and Wauer [5] investigated resonances and instabilities in coupled flexural and torsional vibrations of a rotating shaft. Muszynska et al. [6] analytically and experimentally analyzed lateral/torsional coupling mechanisms resulting from combinations of unbalance, shaft stiffness asymmetry, and radial sideload. Muszynska experimentally observed torsional resonance at speeds equal to 1/8, 1/6, 1/4, and 1/2 of the lowest torsional natural frequency. Bently et al. [7] continued this study with special attention paid to the analysis of a “snapping” action which occurs when during rotation the rotor experiences a peak torsional acceleration.
The topic of cracked rotor vibrations has been analyzed in a number of published works [8-16]. They have been focused on the study of dynamic behavior of rotors with the so-called breathing type of crack during the passage through the critical speed at the constant angular acceleration or deceleration. For example, Sawicki et al. [9, 10] studied the accelerating cracked rotor response using the angle between the crack centerline and the rotor whirl vector to determine the closing and opening of the crack. This allows one to study the rotor dynamic response with or without the rotor weight dominance by taking into account nonsynchronous whirl. Henry [11] investigated how the gravity and the unbalance affect the vibration response of a cracked shaft. A theoretical and experimental study of the effects of a transverse crack on the rotor dynamic system was

2 Copyright © 2005 by ASME
given by Mayes [12]. From the experimental results, it is observed that the crack has most significant effects on the response of the rotor dynamic system when the phase angle between unbalance and crack is in the range of 45o and 135o. Out of this range, the rotor behaves like an un-cracked rotor. Gash [13, 14] provided a comprehensive investigation of the stability behavior and insightful study of harmonic resonances of a cracked Jeffcott rotor with the hinge model of the crack. Mayes and Davies [15] modified hinge model to account for deep cracks, by introducing the crack cross flexibility. Collins et al. [16] used axial impulses for crack detection in rotating shafts.
Practical simulation of cracked rotordynamic systems calls for application of finite element analysis to account for geometric characteristics of the rotor. Papadopoulos and Dimarogonas [17] derived flexibility matrix for the shaft element with open crack. Later, they studied [18] coupling between bending, longitudinal and torsional modes of vibration for non-rotating shaft with an open crack. Sekhar [19] presented results of finite element analysis of the flexural vibration response of the cracked rotor with two open transverse cracks, focusing mainly on the stability study and eigenfrequency analysis. However, an open crack model in a case of rotating shaft is not practical. The rotor vibration characteristics with such crack model can be very different than with the breathing crack model. Darpe et al. [20] presented study of coupled longitudinal, lateral, and torsional vibrations for the cracked rotating shaft using a response-dependent non-linear breathing crack model. The signs of the overall stress intensity factors (SIF) at any point along the crack edge are used to judge whether the crack is open or close, thus determining the crack closure line position.
In this paper, the coupled lateral and torsional vibrations of a rotating shaft with two breathing cracks are investigated using the finite element approach. Based on the concepts of fracture mechanics, the variation of the stiffness matrix over one rotor revolution is expressed by the truncated cosine series, in which the fitting coefficient matrices are determined from the stiffness matrices of the cracked shaft at five different angular positions. The method accurately predicts not only the direct stiffness terms, but also the off-diagonal terms which account for coupling mechanisms of the respective modes. The developed approach accurately describes crack breathing action and can be effectively applied to the frequency analysis of the rotor with two cracks at two different angular and/or axial positions, and for different shaft geometric ratios. Coupled lateral and torsional vibrations of a rotating shaft with two breathing cracks of different relative phase, under unbalance, gravity and external torque excitations are studied.
NOMENCLATURE a Depth of the crack a Normalized depth of the crack ( /a R ) b Half-width of the crack
b Normalized half-width of the crack 22a a− cc Cracked element flexibility matrix
C Global damping matrix D Shaft diameter E Modulus of elasticity F Global force vector
G Shear modulus of elasticity 6 6×I Identity matrix
J Strain Energy Density Function PJ Polar moment of inertia
DJ Diametral moment of inertia , c ck K Cracked element stiffness matrix in rotor-fixed
and inertial coordinate systems, respectively ( )tωK Global stiffness matrix
l Length of shaft element L Length of rotor M Disk mass M Global mass matrix q Displacement nodal vector R Shaft radius t Instantaneous time
eT Torsional excitation κ Shape coefficient for circular cross section ν Poisson’s ratio ρ Material density ε Unbalance eccentricity ω Shaft spinning speed
eω External excitation frequency θ Rotational angle of the rotor
, ,x η ξ Rotor-fixed rotating coordinate system , ,x y z Inertial coordinate system
MODEL OF THE CRACKED SHAFT ELEMENT Figure 1 shows a shaft element with a transverse crack of depth a, at distance x from node 1, loaded with axial forces
1 7, P P , shear forces 2 3, P P , 8 9, P P , bending moments 5 6, P P ,
11 12, P P , and torsional moments 4P , 10P . All six degrees of freedom per node are considered.
X
Z Y3P
5P4P
6P
2P
1P
9P
11P
10P
12P
8P
7P
x
1
2
Figure 1. Cracked shaft element in general loading. Since the strain energy induced at the tip of the loaded crack introduces the considerable local flexibility in the specific cracked beam element, the crack affects only the stiffness matrix of the given finite element. The geometry of shaft section with partially open crack is shown in Fig. 2, where a is the depth of the fully open crack and b is the half-width of the crack. The node displacement in the direction of load iP , induced only due to the presence of the crack with depth α, can be

3 Copyright © 2005 by ASME
calculated as follows [19]:
( )ci
Aiu J A dA
P∂ ⎡ ⎤= ⎢ ⎥⎣ ⎦∂ ∫ (1)
α
ξ
η
β dβ
Figure 2. Geometry of the shaft section with partially open crack.
where A is the area of the cracked section of the shaft (see Figure 2) and J is the Strain Energy Density Function expressed as [21]:
( ) ( )2 2 26 6 6
1 1 1
1 1Ii IIi IIIii i i
J A K K KE
ν= = =
⎡ ⎤⎛ ⎞ ⎛ ⎞ ⎛ ⎞⎢ ⎥= + + +⎜ ⎟ ⎜ ⎟ ⎜ ⎟⎜ ⎟ ⎜ ⎟ ⎜ ⎟⎢ ⎥⎝ ⎠ ⎝ ⎠ ⎝ ⎠⎣ ⎦∑ ∑ ∑ (2)
Here, E is the modulus of elasticity, ν is the Poisson ratio, ijK are the crack Stress Intensity Factors (SIF) for i = I, II, III crack displacement modes and load index j = 1,2,…,6. For a strip of unit thickness with a transverse crack the values of SIF are known [19] and thus, employing integration along the tip of the crack with the variable crack depth, yields the approximate values for SIF in Eq. (2). Based on Eq. (1), the local flexibility due to the crack is calculated as [22]:
( )2
ijAi j
c J A dAP P∂ ⎡ ⎤= ⎢ ⎥⎣ ⎦∂ ∂ ∫ (3)
The expressions for terms of the total flexibility matrix of the cracked element c ijc⎡ ⎤= ⎣ ⎦c (i,j =1,2,...,6) are given in Appendix A.
MODEL OF THE CRACK BREATHING ACTION For the majority of rotating machinery, the static deflection
is much larger than the rotor’s vibration amplitude. Under this assumption, the instantaneous shaft angular position can be employed to determine the amount of crack opening. Two extreme scenarios exist when the crack is either closed ( 0θ = ) or open (θ π= ). For the spinning rotor at constant speed, a truly breathing crack behavior is represented by gradual opening of the crack from its fully closed to the fully open state and visa-versa. Since the flexibility of the cracked shaft section changes with different amount of crack opening, the concept of Crack Transition Line (CTL) is introduced. The CTL, which separates the open and closed portions of the crack, as illustrated in Fig. 2, is an imaginary line perpendicular to the crack edge. The integration limits for evaluation of flexibility coefficients depend on the amount of crack opening.
The crack edge is divided into (N+1) points. For any shaft angular position ( )180i Nθ = , the CTL is located at
2b ib N− ( )0...i N= along the crack edge. The terms of flexibility matrix are continuously updated for each angle
180 Nθ = . In this way CTL keeps changing with different angles of shaft rotation, and thus reflecting the true crack “breathing” action. The stiffness matrix for the shaft cracked element in the rotor-fixed coordinates system is calculated as:
[ ] [ ] 1mn mni ik c −= , 1, 2,...,6; 0...m n i N= = (4)
where formulas for [ ]mn ic are given in Appendix A. In order to ensure the effectiveness of simulation, the variation of the cracked element stiffness with time (angular position), can be expressed by the truncated cosine series [23]:
( )4
01
cos tc ii
iω=
= +∑k k k (5)
The coefficient stiffness matrices , 0,1,...4j j =k , are calculated based on the assumed amount of the crack’s opening at its specific (five) angular positions. Let define that stiffness matrices ,uck ,qk 2 ,qk 3 ,qk and
opk to correspond to the rotor angular location at 0, 4π , 2π ,
3 4π , and π , respectively. They are calculated by assigning value of 0i = , 4 ,N 2 ,N 3 4N , and N , respectively, in Eqs. (A2), i.e., by solving the following set of equations:
0c t ucω = =k k , 4
|c qt πω ==k k , 2
2
|c qt πω ==k k
3 34
|c qt πω ==k k , |c t opω π= =k k (6)
As a result, the fitting coefficient matrices take the following form:
2 30 4 8 8 4 4
q op q quc= + + + +k k k kk
k
( )1 31 2 24 uc op q q= − + −k k k k k
( )2 21 24 q uc op= − + +k k k k (7)
( )3 31 2 24 uc op q q= − − +k k k k k
2 34 4 8 8 4 4
q op q quc= + + − −k k k kk
k
The developed method predicts very well the variations of all terms of cracked element stiffness matrix due to the “breathing” action of the crack, over one shaft revolution (see Fig. 31). Papadopoulos and Dimarogonas [17, 23] proposed similar approach but they assumed that the stiffness terms reach minimum values for the fully open crack, which is correct for
1 Figure 3 is shown in Appendix B.

4 Copyright © 2005 by ASME
diagonal coefficients ( , 1,...,6iik i = ) but not for all cross-coupled terms. Some of the cross-coupled stiffness coefficients reach maximum or minimum values when the crack is half-open or half-closed, and become zero when the crack is fully open (see Fig. 3). From the finite element static equilibrium conditions, 12 degrees of freedom of one element can be written as
( ) ( )1 2 12 1 2 6, ,..., , ,..., TTq q q q q q= T (8) where
6 6
1 0 0 0 0 00 1 0 0 0 00 0 1 0 0 00 0 0 1 0 00 0 0 1 00 0 0 0 1
ll
×⎡ ⎤⎢ ⎥−⎢ ⎥⎢ ⎥−⎢ ⎥
−= ⎢ ⎥⎢ ⎥−⎢ ⎥
− −⎢ ⎥⎢ ⎥−⎣ ⎦
I
T (9)
Next, the stiffness of the cracked element in inertial coordinates system can be found as
T Tc e c eK = TT k T T (10)
where eT is the transformation matrix from rotor-fixed coordinates system to the inertial coordinates system
ae
a
⎛ ⎞= ⎜ ⎟⎝ ⎠
T 0T
0 T (11)
and:
( ) ( )( ) ( )
1 0 00 cos sin0 sin cos
a t tt t
ω ωω ω
⎛ ⎞⎜ ⎟= ⎜ ⎟⎜ ⎟−⎝ ⎠
T (12)
When assembling the global stiffness matrix for the shaft,
the cracked element stiffness matrix cK replaces the stiffness matrix of the corresponding uncracked element. The equations of motion for the complete rotor system in an inertial coordinates system take the following form:
( )tωMq + Cq + K q = F (13)
where M, C, and ( )tωK are the mass, damping and stiffness matrices, respectively, for the whole rotor system. The stiffness matrix is continuously updated with the angular position tω of the shaft. The force vector F can contain any kind of forces and moments applied at any nodes in the global inertial coordinate system.
NUMERICAL SIMULATIONS A two-disk rotor system considered for numerical studies is shown in Fig. 4. Physical parameters of the model are listed in Table 1. The boundary conditions for the model follow the same conditions as for simply supported beam except constrain imposed on torsional degree of freedom at the right support.
The shaft is divided into 8 equal-length finite elements and two shown cracks shown are located at element 6 and 7, near the right disk (see Fig. 4). Table 1: Numerical Model Physical Parameters.
Physical parameter Value Units
L Shaft length 1.12 m D Shaft diameter 0.03 m ρ Material density 7750 Kg/m3
ν Poisson’s ratio 0.3 E Modulus of elasticity 2.07×10¹¹ N/m2
G Shear modulus of elasticity 7.96×10¹⁰ N/m2 M Disk mass 3 kg JP Disk polar moment of inertia 0.018 kg m2
JD Diametral moment of inertia 0.01 kg m2 ε Unbalance eccentricity 5.4×10⁻⁵ m
Figure 4. A two-disk rotor system with two cracks near the right disk. Frequency Analysis Frequency analysis is carried out for an undamped non-rotating rotor. Three cases are considered for the cracks located at different axial locations, different phases, depth, and shaft geometric ratios. Case1: Two open cracks of depths of 1 2 0.4a D a D= = ; the position of one crack is fixed (0.756 m from the left support, see Fig. 4) while the position of the other one keeps changing from the left to right end.
The variation of the first two mode frequencies, as a function of axial position of the second crack, is illustrated in Fig. 5(a). When the second crack is near the ends of the rotor the frequencies are almost the same as for the rotor with only one crack. The effect of the second crack on the rotor first two mode frequencies gradually increases, reaching the maximum as the crack’s position approaches the middle of the shaft. The third mode frequency, shown in Fig. 5(b), predominantly torsional, is very little affected by the position of the second crack. One can observe that when this position is between the left support and the left disk, the mode frequency is almost identical as for the rotor with one crack, i.e., 598 rad/s. For the position anywhere between two disks, the frequency drops to 595 rad/s, and for the position between right

5 Copyright © 2005 by ASME
disk and the right support the frequency is reduced further to 591.5 rad/s.
0 0.2 0.4 0.6 0.8 1 1.12200
202
204
206
208
210
212
214
Second crack position (m)
Freq
uenc
ies
(rad
/s)
1st
2nd
(a)
0 0.2 0.4 0.6 0.8 1 1.12
592
594
596
598
600
Second crack position (m)
Third
fre
quen
cy (r
ad/s
)
(b)
Figure 5. Variation of mode frequencies for various positions of the second crack: (a) first two mode frequencies, and (b) third mode frequency. Case 2: Two cracks have fixed axial positions; one crack at the distance 0.756 m and the second one at 0.896 m, measured from the left support (see Fig. 4). The first crack, of fixed depth
1 0.4a D = , is always open, while the second is allowed to be oriented at any angle (phase) with respect to the positive z-axis, and have different depths. The changes of rotor mode frequencies with different depths and angular position of the second crack are illustrated in Fig. 6. It should be noted that the crack center line is defined as a line perpendicular to the crack edge, and here, the crack phase angle is defined as the angle between the positive z-axis and the crack’s centerline (see Fig. 2). As expected, that the maximum reduction of frequencies happens to be when both cracks are fully open (phase 180°). Also, with the growing depth of the second crack, the rotor frequency reduction becomes more significant.
0 45 90 135 180 225 270 315 360200
202
204
206
208
210
Second crack phase (deg.)
Firs
t fre
quen
cy (r
ad/s
)
0.2
0.3
0.4
0.49
(a)
0 45 90 135 180 225 270 315 360586
588
590
592
594
596
598
600
Second crack phase (deg.)
Third
freq
uenc
y (r
ad/s
)
0.2
0.3
0.4
0.49
(b)
Figure 6. Variation of mode frequencies for various values of phase and depth of second crack: (a) first mode frequency, and (b) third mode frequency.
Case 3: Two cracks are located at fixed axial positions. Both cracks have fixed depths ( 1 2/ / 0.4a D a D= ≡ ), but the shaft has different geometric ratios, i.e., for the given length of the shaft (L = 1.12 m) the shaft diameter is varied (D = 0.2, 0.08, 0.06, 0.04, 0.02 m). Also, the phase of the second crack keeps changing. As can be seen on Fig. 7(a), the third, predominantly torsional mode frequency is not much affected by the crack’s phase. To emphasize the scale of possible changes Figs. 7(b) and 7(c) show changes of the normalized frequency (with respect to its maximum value). For the rotor with smaller geometric ratios (i.e., larger shaft diameter), the variation of the frequencies is more sensitive to the phase change of the crack.

6 Copyright © 2005 by ASME
0 45 90 135 180 225 270 315 3600
1000
2000
3000
4000
5000
Second crack phase (deg.)
Third
freq
uenc
y (r
ad/s
)
L/D = 5.6
L/D = 14
L/D = 18.6
L/D = 28
L/D = 56
(a)
0 45 90 135 180 225 270 315 3600.93
0.94
0.95
0.96
0.97
0.98
0.99
1
1.01
Second crack phase (deg.)
Nor
mal
ized
third
freq
uenc
y
L/D = 5.6 L/D = 14
L/D = 18.6
L/D = 28
L/D = 56
(b)
0 45 90 135 180 225 270 315 3600.93
0.94
0.95
0.96
0.97
0.98
0.99
1
1.01
Second crack phase (deg.)
Nor
mal
ized
firs
t fre
quen
cy
L/D = 5.6
L/D = 14
L/D = 18.6
L/D = 28
L/D = 56
(c)
Figure 7. Variation of mode frequencies for different shaft geometric ratios: (a) variation of the third mode frequency (b) variation of the normalized frequency for the third mode, (c) variation of the normalized frequency for the first mode. Lateral and Torsional Vibration Response
In this part of investigation two breathing cracks (rotating rotor) located at element 6 and 7 have the same depth
1 2/ / 0.4a D a D= ≡ . The stiffness variation property of the cracked element has been described in the previous section. The bending and torsional frequencies of the uncracked rotor are 214.4 rad/s and 601.3 rad/s, respectively.
In order to explore the crack-induced mode coupling phenomenon, an external sinusoidal excitation torque
( )600sine eT tω= is applied at the first disk (node 3), with 322eω = rad/s as an excitation frequency. The selected shaft
spinning speed is 43ω = rad/s. The purpose is to investigate how the torsional excitation affects the lateral vibration response of cracked rotor. Vibration responses for the three different phases of the two cracks are shown in Fig. 82. In all these plots of Fig. 8, the existence of the first harmonic (1X) and super-harmonics (2X, 3X, 4X,) of the shaft running frequency in lateral frequency spectrum provide strong indication of the cracks’ presence. One can also notice the existence of torsional frequency, eω , in the lateral frequency spectrum, which clearly demonstrates the coupling mechanism between the lateral and torsional vibration modes. The appearance of sum and difference frequencies ( e nω ω± ) around the torsional excitation frequency is the result of interaction of the torsional excitation and the synchronous frequency and its higher harmonics (2X, 3X, 4X). For the case with cracks’ phase difference of 0°, shown in Fig. 8(a) and 8(b), the two cracks simultaneously open or close during the rotor’s rotation.. In this case the vibration spectrum of the two-crack rotor is similar to the one-crack rotor’s behavior, except the increased amplitude due to higher stiffness reduction.
For the case with phase difference of 90 , shown in Fig. 8(c) and 8(d), whenever one crack is closed, the other one is always half-opened and half-closed. While 2X, 3X and 5X peaks remain about the same, as in Fig. 8(a) and 8(b), the amplitude of 4X peak is dramatically decreased in the frequency spectra, and the vibration amplitude is slightly reduced.
The third case with the phase difference of 180 implies that whenever one crack is fully opened, the other one must be closed. In this case the vibration amplitudes are reduced further than in the previous case. Although the super-harmonic 2X and 4X peaks are similar as in Fig. 8(a) and 8(b), 1X, 3X and 5X peaks are appreciable decreased to their minimum values.
Due to the lateral and torsional coupling mechanism induced by the presence of cracks, the externally applied torsional excitation significantly affects the rotor lateral vibration behavior. This is clearly shown in Figs. 93 (a) and (b), where the vibration response orbits are presented without and with torque, respectively. The Fig. 9(b) shows the orbit that rotates (thin line) in the opposite direction of the rotor’s rotating direction. Simulations of orbits considering frequencies shown in corresponding to this case FFT spectrum (see Fig. 8(b)) have shown presence of frequency components being backward whirl fraction. The vibration in the presence of the applied external torque is not periodic but quasi-periodic, where the ratios of the involved frequencies are not the ratios of integers. 2 Figure 8 is shown in Appendix B. 3 Figure 9 is shown in Appendix B.

7 Copyright © 2005 by ASME
CONCLUSIONS Coupled lateral-torsional vibration finite element analysis of a rotor with two breathing cracks has been conducted for frequency analysis and dynamic response to excitation forces such as mass unbalance, weight, and the external torque. The multi-crack rotors have much more complicated stiffness asymmetry behavior being parametric, time-varying systems with dissimilar inertia moments in two perpendicular directions and at various axial shaft locations. The issue of accurate modeling of the stiffness matrix with the periodic coefficients in the global inertial coordinates system is crucial to account for the proper breathing behavior of multi cracks located at various axial and angular positions. The developed model for the “breathing” cracked element is based on fracture mechanics. The direct stiffnesses, as well as cross coupling stiffnesses are estimated as the crack opens and closes. The stiffness matrix variation due to the crack breathing is determined by the stiffness matrices of cracked shaft with the crack located at five different angular positions. Such an approach simplifies frequency and dynamic response analysis regardless of a number of finite elements and cracks’ location. The axial location of cracks affects the rotor frequencies. Once the two cracks are located close to the middle section of the shaft, the maximum reduction of frequencies occurs. The frequencies also depend on the relative orientation of two cracks and the shaft geometric ratios. The variation of rotor mode frequencies is the most significant for the small shaft geometric ratios. The modes which affected the most are predominantly bending modes. If the two breathing cracks are in phase, i.e., both of them are simultaneously either opened or closed, the vibration behavior pattern is almost the same as for the rotor with one crack, except the change in vibration amplitude. For the case of two out-of-phase cracks, the vibration spectrum presents different signatures, with diminished 1X, 3X and 5X harmonics. Finally, for the cracks’ phase difference of 90°, the peak of super-harmonic frequency 4X is dramatically reduced in the vibration spectrum. It is noteworthy that the 2X peak stays the same all the time. The orbit analysis reveals that there are specific crack signatures due to the vibration mode coupling. When the external torque is applied the mode coupling induced by the crack causes vibration to become quasi-periodic, with the response orbit rotating in the direction opposite to the direction of rotation of the rotor. The presented method is applicable to analyze the dynamic response of rotating shafts with two or more breathing cracks. The uniqueness of the observed crack signatures, captured by the analytical approach, presents potential in early diagnosis of rotor cracks. ACKNOWLEDGMENTS
This research was conducted under grant NAG 3-2573 of the NASA Glenn Research Center. This support is gratefully acknowledged.
REFERENCES [1] Sawicki, J.T., 2002, “Some Advances in Diagnostics of
Rotating Machinery Malfunctions,” Invited Paper, International Symposium on Machine Condition
Monitoring and Diagnosis, Annual Meeting of the Japan Society of Mechanical Engineers, Tokyo.
[2] Tondl, A., 1965, Some Problems of Rotor Dynamics, Chapman & Hall, London.
[3] Wauer, J., 1990, “On the Dynamics of Cracked Rotors: A Literature Survey,” Applied Mechanics Reviews, 43(1), pp. 13-17.
[4] Papadopoulos, P. and Dimarogonas, A.D., 1987, “Coupling of Bending and Torsional Vibration of a Cracked Timoshenko Shaft,” Ingenieur-Archive, 57, pp. 257-266.
[5] Plaut, R.H. and Wauer, J., 1995, “Parametric, External and Combination Resonances in Coupled Flexural and Torsional Oscillations of an Unbalanced Rotating Shaft,” Journal of Sound and Vibration, 183(5), pp. 889-897.
[6] Muszynska, A., Goldman, P., and Bently, D.E., 1992, “Torsional/Lateral Vibration Cross-Coupled Responses Due to Shaft Anisotropy: A New Tool in Shaft Crack Detection,” 5th International Conference on Vibrations in Rotating Machinery, Bath, U.K., Paper C432/090, pp. 257-262.
[7] Bently, D. E., Goldman, P. and Muszynska, A., 1997, ““Snapping” Torsional Response of an Anisotropic Radially Loaded Rotor,” Journal of Engineering for Gas Turbines and Power, 119, pp. 397-403.
[8] Gasch, R., Markert, R., and Pfutzner, H., 1979, “Acceleration of Unbalanced Flexible Rotors through the Critical Speeds,” Journal of Sound and Vibration, 63, pp. 393-409.
[9] Sawicki, J.T., Wu, X., Baaklini, G., and Gyekenyesi, A.L., 2003, “Vibration-Based Crack Diagnosis in Rotating Shafts During Acceleration through Resonance,” Proceedings of SPIE 10th Annual International Symposium on Smart Structures and Materials, San Diego, California.
[10] Sawicki, J.T., Bently, D.E., Wu, X., Baaklini, G., and Friswell, M.I., 2003, “Dynamic Behavior of Cracked Flexible Rotor Subjected to Constant Driving Torque,” Proceedings of the 2nd International Symposium on Stability Control of Rotating Machinery, Gdansk, Poland, pp. 231-241.
[11] Henry, T. A. and Okah-Avae, B. E., 1976, “Vibrations in Cracked Shafts,” Paper C162/76, I.Mech.E. Conference on Vibrations in Rotating Machinery, pp. 15-19.
[12] Mayes, I. W. and Davies, W. G. R., 1976, “The Vibration Behavior of a Rotating Shaft System Containing a Transverse Crack,” Paper C168/76, I.Mech.E. Conference on Vibrations in Rotating Machinery, pp. 53-64.
[13] Gasch, R., 1976, “Dynamic behavior of a simple rotor with a cross-sectional crack,” Paper C178/76, I. Mech. E. Conference on Vibrations in Rotating Machinery, pp.123-128.
[14] Gasch, R. A, 1993, “Survey of the Dynamic Behavior of a Simple Rotating Shaft with a Transverse Crack,” Journal of Sound and Vibration, 160, pp. 313-332.
[15] Mayes, I. W. and Davies, W. G. R., 1984, “Analysis of the Response of a Multi-Rotor-Bearing System Containing a Transverse Crack in a Rotor,” ASME Journal of Vibration, Acoustics, Stress, and Reliability in Design, 106, pp. 139-145.

8 Copyright © 2005 by ASME
[16] Collins, K.R., Plaut, R.H., and Wauer, J., 1991, “Detection of Cracks in Rotating Timoshenko Shafts Using Axial Impulses,” ASME Journal of Vibration and Acoustics, 113, pp. 74-78.
[17] Papadopoulos, C. A., and Dimarogonas, A. D., 1987, “Coupled Longitudinal and Bending Vibrations of a Rotating Shaft with an Open Crack,” Journal of Sound and Vibration, 117, pp. 81–93.
[18] Papadopoulos, C. A., and Dimarogonas, A. D., 1992, “Coupled Vibration of Cracked Shafts,” ASME Journal of Vibration and Acoustics, Vol. 114, pp. 461-467.
[19] Sekhar, A. S., 1999, “Vibration Characteristics of a Cracked Rotor with Two Open Cracks,” Journal of Sound and Vibration, 223(4), pp. 497-512.
[20] Darpe, A. K., Gupta, K. and Chawla, A., 2004, “Coupled Bending, Longitudinal and Torsional Vibrations of a Cracked Rotor,” Journal of Sound and Vibration, 269, pp. 33-60.
[21] Tada, H., Paris, P. C. and Irwin, G. R., 1973, The Stress Analysis of Cracks Handbook, Del Research Corporation, Hellertown, PA.
[22] Dimarogonas, A. D., and Papadopoulos, C. A., 1983, Analytical Methods in Rotor Dynamics, Applied Science Publishers, London.
[23] Papadopoulos, C. A., and Dimarogonas, A. D., 1988, “Stability of Cracked Rotors in the Coupled Vibration Mode,” ASME Journal of Vibration, Acoustics, Stress, and Reliability in Design, 110, pp. 357-359.
APPENDIX A Terms of flexibility matrix
( )21 1
21 1
2 0
1 2 ,ab
c iibbN
I F d dER
β
α α β α βπ
− + −
−
= ∫ ∫
( ) ( )21 1
22 1 22
2 0
1 8 1 , ,ab
c iibbN
I F F d dER
β
α β α β α β α βπ
− + −
−
= −∫ ∫
( )21 1
23 12
2 0
1 8 ,
ab
c iibbN
I F d dER
β
αβ α β α βπ
− + −
−
= ∫ ∫ (A1)
( )21 1
2 24
2 0
1 2 ,ab
c i IIibbN
I F d dER
β
κ α α β α βπ
− + −
−
= ∫ ∫
( ) ( )21 1
2 25 23
2 0
1 32 1 ,ab
c iibbN
I F d dER
β
α β α β α βπ
− + −
−
= −∫ ∫
( ) ( )21 1
26 1 23
2 0
1 32 1 , ,ab
c iibbN
I F F d dER
β
αβ β α β α β α βπ
− + −
−
= −∫ ∫
( )21 1
27 2
2 0
1 4 ,ab
c i IIibbN
I F d dER
β
καβ α β α βπ
− + −
−
= ∫ ∫
( )21 1
2 28 13
2 0
1 32 ,ab
c iibbN
I F d dER
β
αβ α β α βπ
− + −
−
= ∫ ∫
( )21 1
2 29
2 0
1 2 ,ab
c i IIIibbN
I m F d dER
β
κ α α β α βπ
− + −
−
= ∫ ∫
( )21 1
2 210 2
2 0
1 4 1 ,ab
c i IIIibbN
I m F d dER
β
κα β α β α βπ
− + −
−
= −∫ ∫
( )21 1
2 211 3
2 0
1 8 ,ab
c i IIibbN
I F d dER
β
αβ α β α βπ
− + −
−
= ∫ ∫
( ) ( )21 1
2 212 3
2 0
1 8 1 ,ab
c i IIIibbN
I m F d dER
β
α β α β α βπ
− + −
−
= −∫ ∫
where:
( ) ( )31
0.752 2.02 / 0.37 1 sintancosh
Fh
α λα λλ λ
+ + −⎛ ⎞ =⎜ ⎟⎝ ⎠
( )42
0.923 0.199 1 sintancos
Fh
λα λλ λ
+ −⎛ ⎞ =⎜ ⎟⎝ ⎠
( ) ( ) ( )2 31.122 0.561 / 0.085 / 0.18 /1 /II
h h hF
h hα α αα
α
− + +⎛ ⎞ =⎜ ⎟ −⎝ ⎠
( )( )
2 26 1tan , , , 22 7 6IIIF h R
h hνα λ παλ κ β
λ ν+⎛ ⎞ = = = = −⎜ ⎟ +⎝ ⎠
2 2
22
, 2 , 1 1
, 2 1 , 4 1
aa b a a aR R
hhR R
αα β
β παβ β λβ
= = − = = − + −
= = = − =−
2, 0,1,2,...,
2 1i N
hα α
β= =
−, 1m ν= +
and
11 1 12 2 13 3
14 15 3 16 2
, ,
0, ,
c i c i c i
c i c i
lc I c xI c xIAE
c c I c I
= + = =
= = = −
32
21 12 22 4 5
223 6 24 7 25 6
, 3
, , ,
c i c i
c i c i c i
lc c c I x IEI
c x I c I c xI
= = + +
= = =

9 Copyright © 2005 by ASME
2
26 5 31 13 32 23
32
33 9 8 34 10
, , 2
, 3
c i
c i c i c i
lc xI c c c cEI
lc I x I c IEI
= − − = =
= + + =
(A2)
2
35 8 36 6 41
42 24 43 34 44 11 12
, , 02
, ,
c i c i
c i c i
lc xI c xI cEI
lc c c c c I IGJ
= + = − =
= = = + +
45 46 51 15 52 25
53 35 54 55 8
0, 0, ,
, 0, c i
c c c c c clc c c c I
EI
= = = =
= = = +
56 6 61 16 62 26 63 36
64 65 56 66 5
, , ,
0, ,
c i
c i
c I c c c c c clc c c c I
EI
= − = = =
= = = +
APPENDIX B
0 90 180 270 3602 e5
2.1e5
2.2e5
2.3e5
2.4e5
0 90 180 270 360-4e5
-2e5
0
2e5
4e5
0 90 180 270 360-4000
-2000
0
2000
4000
0 90 180 270 360-6e4
-4e4
-2e4
0
2e4
4e4
6e4
k55
k66
k23
k36 k14
k24 k25
k34
0 90 180 270 3609
9.5
10
10.5x 10
8
0 90 180 270 360-1
-0.5
0
0.5
1x 10
6
0 90 180 270 360-500
0
500
1000
1500
0 90 180 270 3602.3
2.35
2.4
2.45
2.5
2.55x 10
6
0 90 180 270 360
-2.5
-2.45
-2.4x 10
6
0 90 180 270 360-5
0
5
10
15x 10
6
0 90 180 270 360
3.5
3.55
3.6
x 107
0 90 180 270 360
0
2
4
6x 10
4
k11
k15
k46
k45
k26
k35
k12
k13
k16
k22
k33 k44
k56
Figure 3. Variation of stiffness coefficients over one revolution of a cracked shaft element (a/D = 0.4, l = 0.14m, D=0.03m).
0 100 200 300 400 5000
0.5
1
1.5
2
2.5
3x 10
-6
Frequency (rad/sec)
Ampl
itude
in z
-dire
ctio
n
ω
2ω
3ω
4ω 5ω
0 100 200 300 400 500
0
0.5
1
1.5
2
2.5
3x 10
-6
Frequency (rad/sec)
Ampl
itude
in z
-dire
ctio
n
ω
2ω
3ω
4ω 5ω ωe
ωe -ω
ωe +ω
ωe -2ω
ωe -3ω
ωe +2ωωe
+3ω
(a). Phase difference 0 ; no torsional excitation. (b). Phase difference 0 ; torsional excitation

10 Copyright © 2005 by ASME
0 100 200 300 400 5000
0.5
1
1.5
2
2.5
3x 10
-6
Frequency (rad/sec)
Ampl
itude
in z
-dire
ctio
n ω
2ω
3ω
4ω
5ω
0 100 200 300 400 500
0
0.5
1
1.5
2
2.5
3x 10
-6
Frequency (rad/sec)
Ampl
itude
in z
-dire
ctio
n ω
2ω
3ω
ωe
ωe -ω
ωe -2ω
ωe -3ω
ωe +ωωe
+2ω
ωe +3ω4ω
5ω
(c). Phase difference 90°; no torsional excitation. (d). Phase difference 90°; torsional excitation.
0 100 200 300 400 5000
0.5
1
1.5
2
2.5
3x 10
-6
Frequency (rad/sec)
Ampl
itude
in z
-dire
ctio
n
ω
2ω
3ω
4ω
5ω
0 100 200 300 400 500
0
0.5
1
1.5
2
2.5
3x 10
-6
Frequency (rad/sec)
Ampl
itude
in z
-dire
ctio
n
ω
2ω
3ω
4ω
5ω
ωe
ωe-ω
ωe-2ω
ωe-3ω
ωe+ω ωe
+2ω
ωe+3ω
(e). Phase difference 180°; no torsional excitation. (f). Phase difference 180°; torsional excitation.
Figure 8. Vibration response FFT of a rotor with two breathing cracks of different phase.
-1 -0.5 0 0.5 1
x 10-5
-7.2
-7
-6.8
-6.6
-6.4
-6.2
-6
-5.8
-5.6
-5.4
-5.2x 10
-5
y
z
-1 -0.5 0 0.5 1
x 10-5
-7.2
-7
-6.8
-6.6
-6.4
-6.2
-6
-5.8
-5.6
-5.4
-5.2x 10
-5
(a) (b)
Figure 9. Vibration response orbits with phase difference 0°: (a) without torsional excitation, (b) with torsional excitation.