Embed Size (px)
Citation preview
16.1.2008 1
Engine Test
RotasPro Noise Analysis
16.1.2008 2
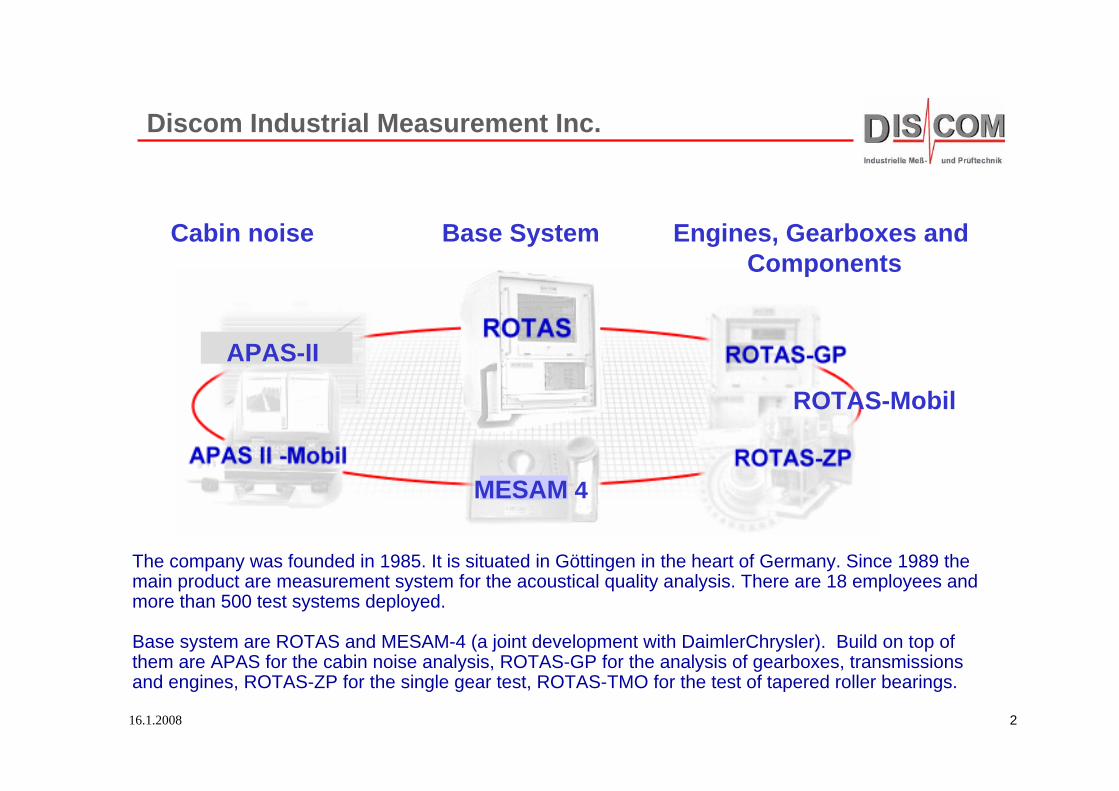
The company was founded in 1985. It is situated in Göttingen in the heart of Germany. Since 1989 the main product are measurement system for the acoustical quality analysis. There are 18 employees and more than 500 test systems deployed.
Base system are ROTAS and MESAM-4 (a joint development with DaimlerChrysler). Build on top of them are APAS for the cabin noise analysis, ROTAS-GP for the analysis of gearboxes, transmissions and engines, ROTAS-ZP for the single gear test, ROTAS-TMO for the test of tapered roller bearings.
MESAM 4
APAS-II
Base System Engines, Gearboxes and Components
Cabin noise
ROTAS-Mobil
Discom Industrial Measurement Inc.
16.1.2008 3
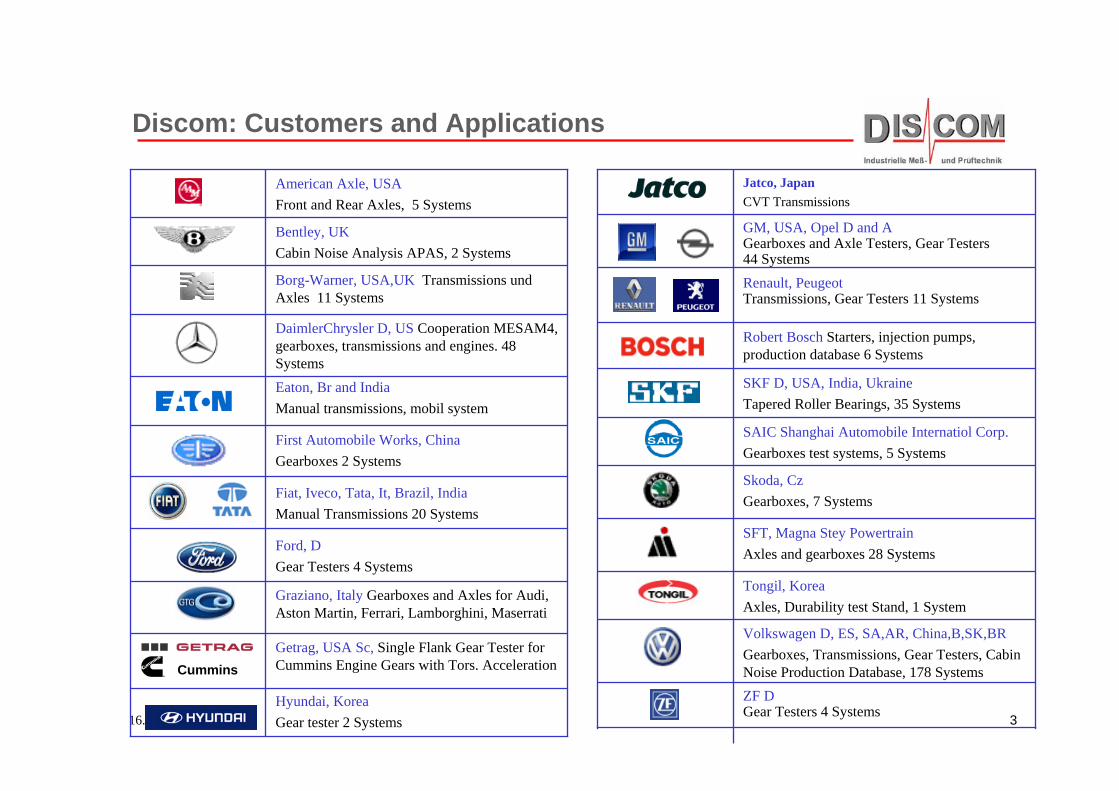
ZF DGear Testers 4 Systems
Volkswagen D, ES, SA,AR, China,B,SK,BRGearboxes, Transmissions, Gear Testers, CabinNoise Production Database, 178 Systems
Tongil, KoreaAxles, Durability test Stand, 1 System
SFT, Magna Stey PowertrainAxles and gearboxes 28 Systems
Skoda, CzGearboxes, 7 Systems
SAIC Shanghai Automobile Internatiol Corp.Gearboxes test systems, 5 Systems
SKF D, USA, India, UkraineTapered Roller Bearings, 35 Systems
Robert Bosch Starters, injection pumps, production database 6 Systems
Renault, PeugeotTransmissions, Gear Testers 11 Systems
GM, USA, Opel D and AGearboxes and Axle Testers, Gear Testers 44 Systems
Jatco, JapanCVT Transmissions
Discom: Customers and Applications
Fiat, Iveco, Tata, It, Brazil, IndiaManual Transmissions 20 Systems
Getrag, USA Sc, Single Flank Gear Tester forCummins Engine Gears with Tors. Acceleration
Graziano, Italy Gearboxes and Axles for Audi, Aston Martin, Ferrari, Lamborghini, Maserrati
Eaton, Br and IndiaManual transmissions, mobil system
Ford, DGear Testers 4 Systems
First Automobile Works, ChinaGearboxes 2 Systems
DaimlerChrysler D, US Cooperation MESAM4, gearboxes, transmissions and engines. 48 Systems
Borg-Warner, USA,UK Transmissions und Axles 11 Systems
Bentley, UKCabin Noise Analysis APAS, 2 Systems
American Axle, USAFront and Rear Axles, 5 Systems
Hyundai, KoreaGear tester 2 Systems
Cummins
16.1.2008 4
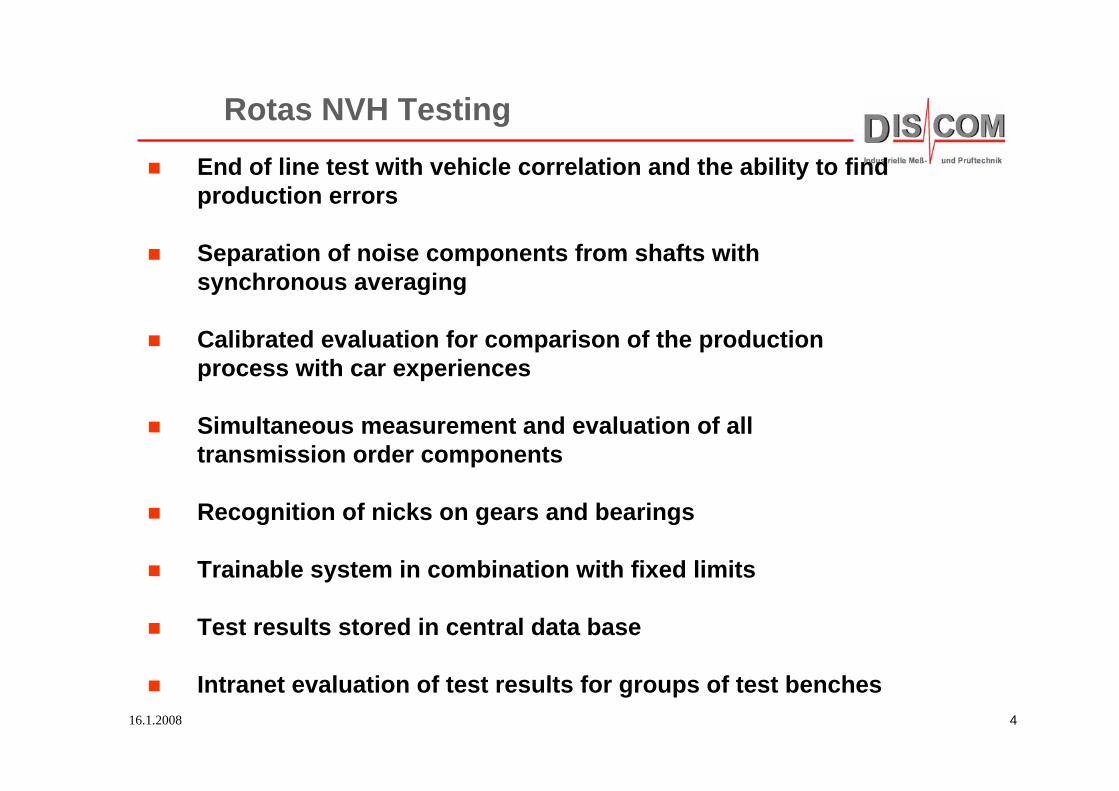
Rotas NVH TestingEnd of line test with vehicle correlation and the ability to find production errors
Separation of noise components from shafts with synchronous averaging
Calibrated evaluation for comparison of the production process with car experiences
Simultaneous measurement and evaluation of all transmission order components
Recognition of nicks on gears and bearings
Trainable system in combination with fixed limits
Test results stored in central data base
Intranet evaluation of test results for groups of test benches
16.1.2008 5
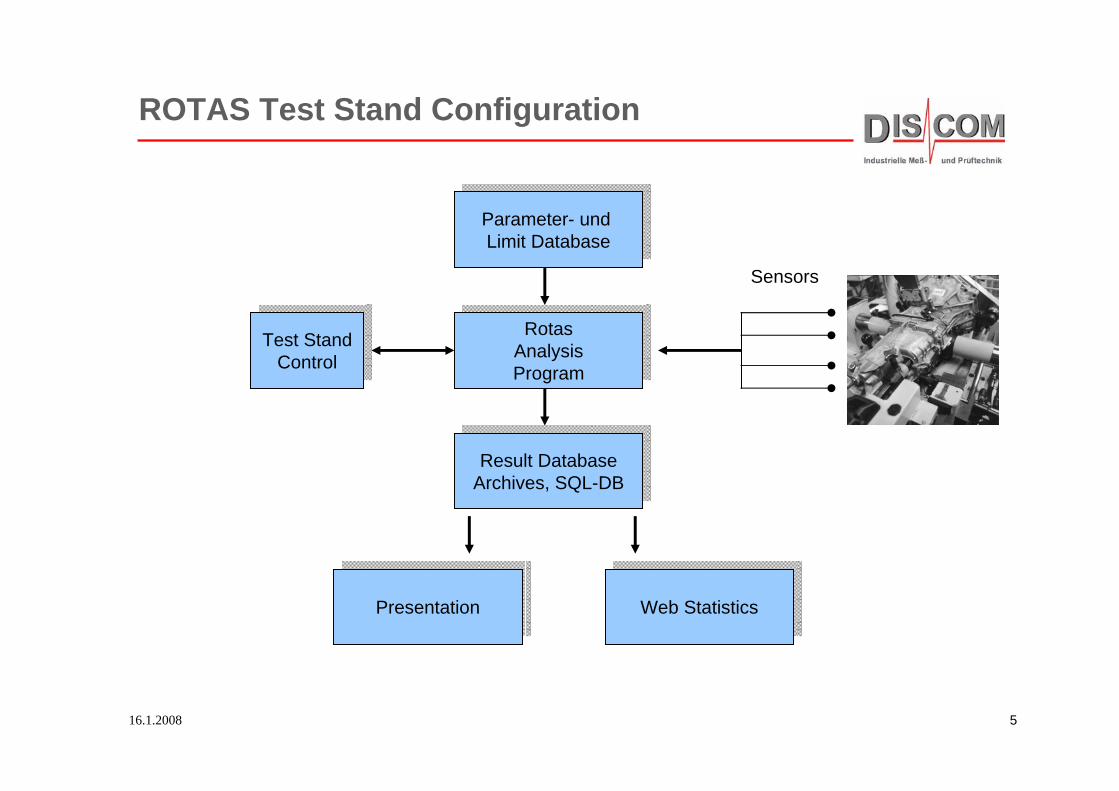
Parameter- und Limit Database
Parameter- und Limit Database
RotasAnalysisProgram
RotasAnalysisProgram
Result DatabaseArchives, SQL-DBResult Database
Archives, SQL-DB
Web StatisticsWeb StatisticsPresentationPresentation
Test StandControl
Test StandControl
Sensors
ROTAS Test Stand Configuration
16.1.2008 6
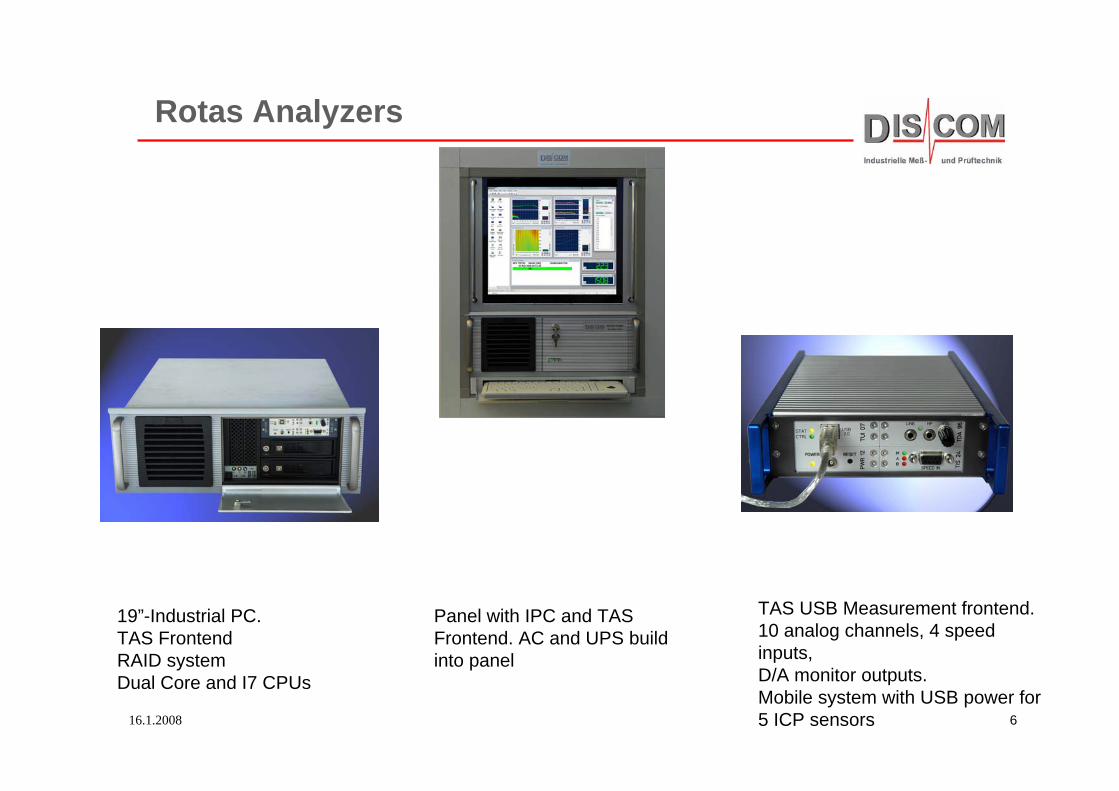
Rotas Analyzers
19”-Industrial PC.TAS FrontendRAID systemDual Core and I7 CPUs
Panel with IPC and TASFrontend. AC and UPS buildinto panel
TAS USB Measurement frontend.10 analog channels, 4 speedinputs, D/A monitor outputs.Mobile system with USB power for5 ICP sensors

16.1.2008 7
BKS03 Accelerometer
1.0 2.0 3.0 4.0 5.0 6.0 7.0 8.0 9.0 k Hz
-20.0
-15.0
-10.0
-5.0
0.0
dBg
TrnsFnc
The BKS03 has a linear frequency range of up to 10 kHz and can be used to pick up the NVH signal also from unfinished surfaces
16.1.2008 8
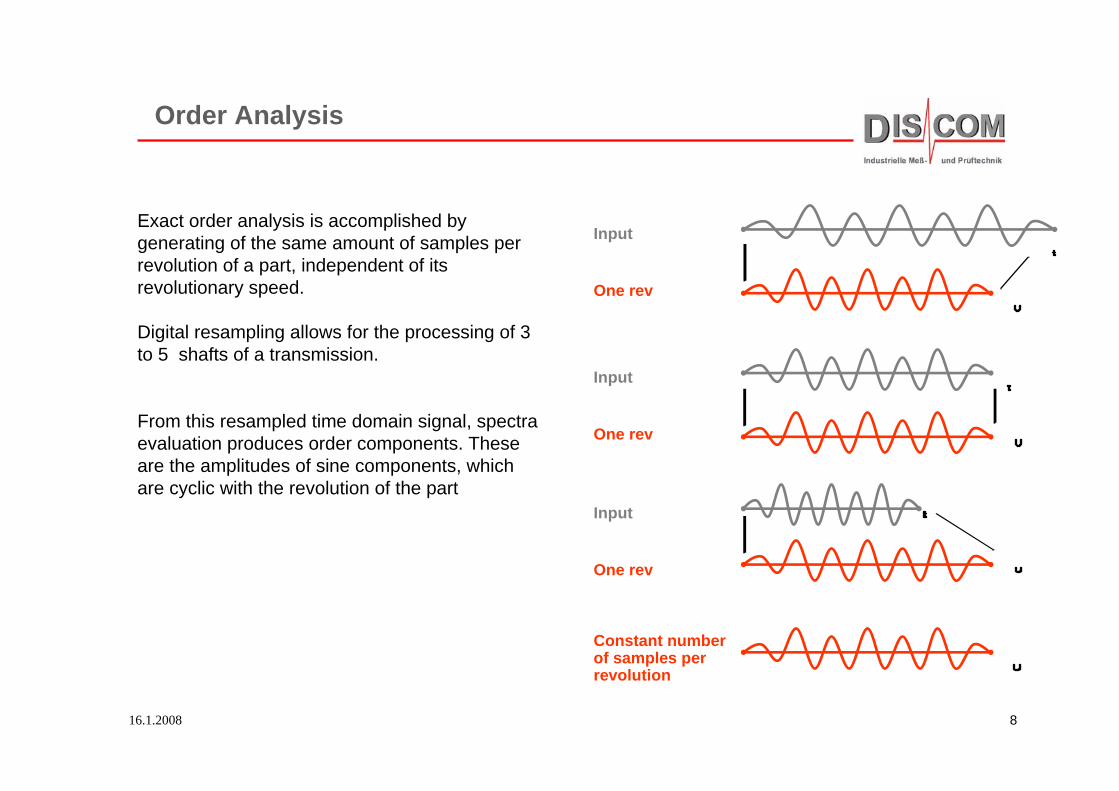
Input
One rev
Exact order analysis is accomplished by generating of the same amount of samples per revolution of a part, independent of its revolutionary speed.
Digital resampling allows for the processing of 3 to 5 shafts of a transmission.
From this resampled time domain signal, spectra evaluation produces order components. These are the amplitudes of sine components, which are cyclic with the revolution of the part
Order Analysis
Input
One rev
Input
One rev
Constant numberof samples perrevolution
16.1.2008 9
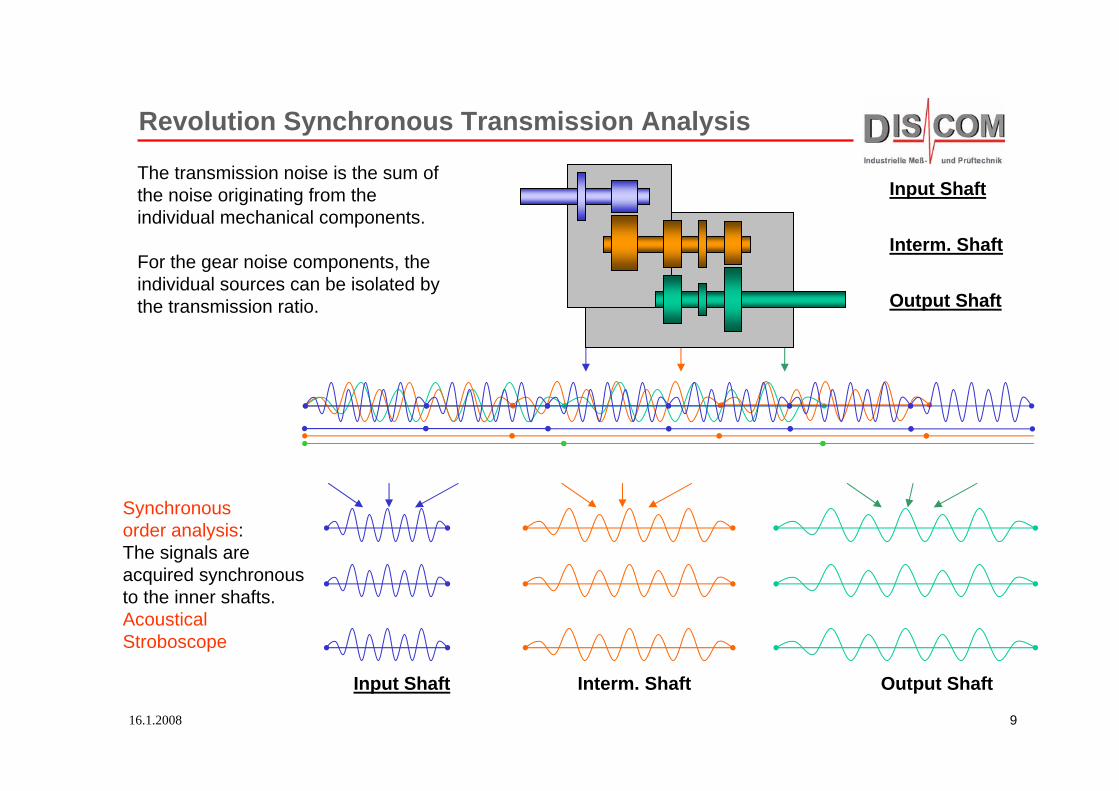
Revolution Synchronous Transmission Analysis
Input Shaft Interm. Shaft Output Shaft
The transmission noise is the sum of the noise originating from the individual mechanical components.
For the gear noise components, the individual sources can be isolated by the transmission ratio.
Synchronousorder analysis:The signals are acquired synchronousto the inner shafts.AcousticalStroboscope
Input Shaft
Interm. Shaft
Output Shaft
16.1.2008 10
Signal
Background
Average:Signal enhanced
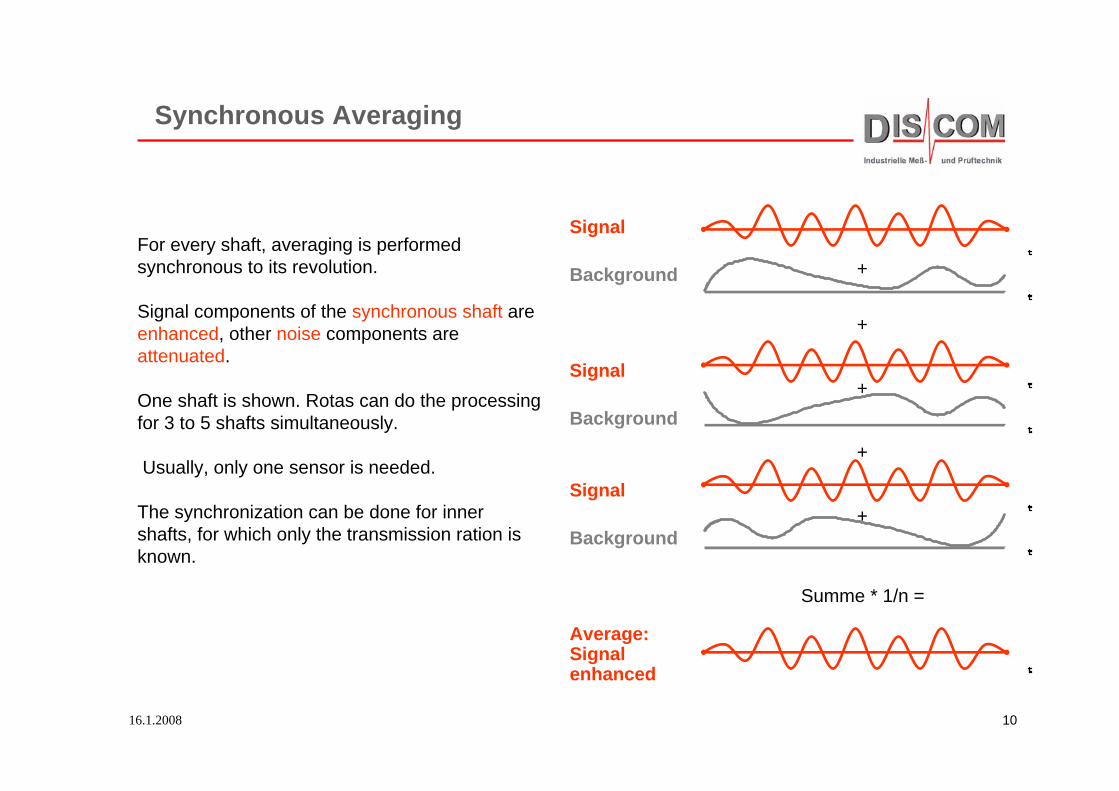
For every shaft, averaging is performed synchronous to its revolution.
Signal components of the synchronous shaft are enhanced, other noise components are attenuated.
One shaft is shown. Rotas can do the processing for 3 to 5 shafts simultaneously.
Usually, only one sensor is needed.
The synchronization can be done for inner shafts, for which only the transmission ration is known.
Synchronous Averaging
Signal
Background
Signal
Background
+
+
+
+
+
Summe * 1/n =
16.1.2008 11
Synchronous Averaging
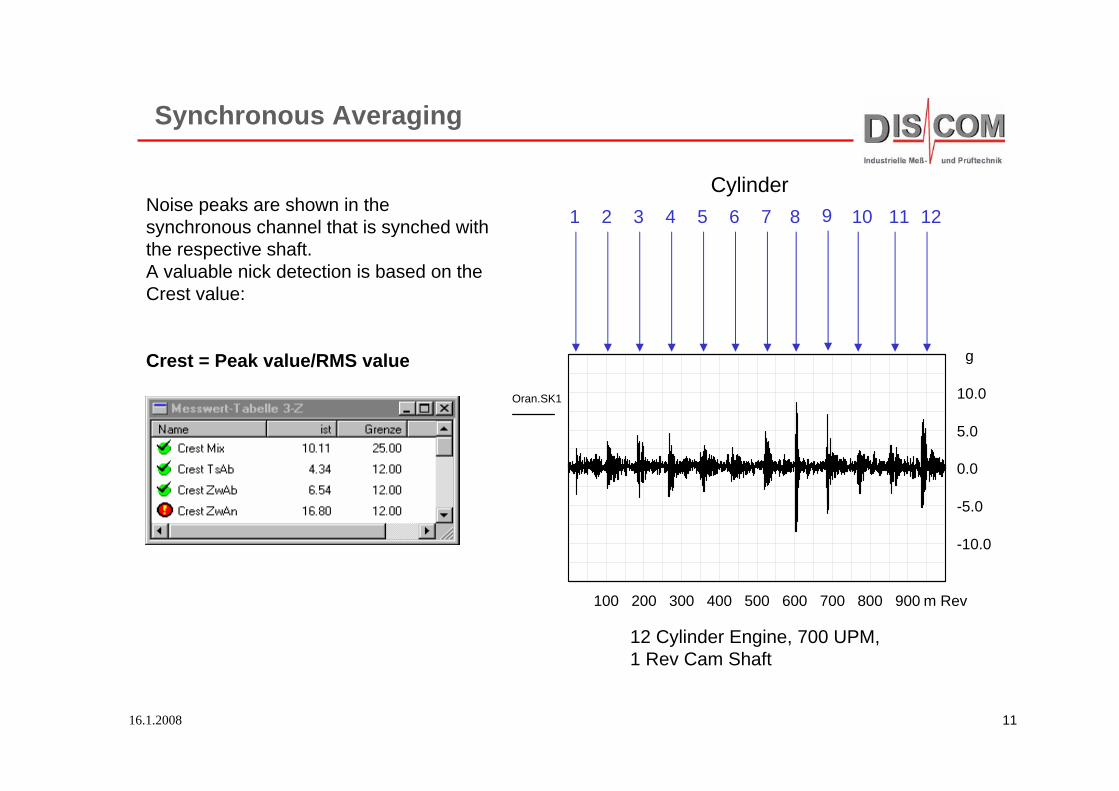
Noise peaks are shown in the synchronous channel that is synched with the respective shaft.A valuable nick detection is based on the Crest value:
Crest = Peak value/RMS value
100 200 300 400 500 600 700 800 900 m Rev
-10.0
-5.0
0.0
5.0
10.0
g
Oran.SK1
1 2 3 4 5 6 7 8 9 10 11 12
12 Cylinder Engine, 700 UPM, 1 Rev Cam Shaft
Cylinder

16.1.2008 12
Evaluation of Order Spectra
10 20 30 40 50 60 70 80 90 Ord
45
60
75
90
105
dBgVGW
VGW-lim
The order spectra of the synchronous channelsand of the mix channel are compared with a
limit curve. Every order of the limit curvehas an underlying error code. This error codeis generated from transmission ratios in a semiautomatic fashion. If the limit curveis exceeded, the error code gives rise to anerror message in plain text.
The limit curves consist of portions, whichare generated by a learning process and ofportions which are set to fixed values.
The learn rnode is used for those spectralportions, where there are results from driving experiments available yet. Generally thisholds true for tooth spacing problems,ghost orders and bearing noise (in themix channel).Fixed limits are adopted from driving experiments,usually for the gear mesh and for the side bands.

16.1.2008 13
10 20 30 40 50 60 70 80 90 Ord
20
40
60
80
100
dBg
MaxBnd
MinBnd
StdDev
AW-avg
SK1-lim
Spectral Limits
Limit curve from Average + Offset + n times standard deviation. Overridden by minimum and maximum polygons and by the fixed hats.
Hats for gear mesh orders and their side bands
16.1.2008 14
Learning
For all measurements, the following statisticalproperties are computed:
Average (AV) undStandard deviation (STD)
From these numbers, a limit L is generatedaccording to
L = AV + Offset + n* STD.
The offset and the multiplier of the standard deviation is selectable. For spectral measures,an offset of 5 dB and a std-factor of 3 is normally used. Maximum and minimum values set upper and lower bounds for the limit L.
A new learn consist of a base learn (usually 5 units), where all units are accepted that are below maximum polygons and below hats.
The base learn is followed by an additional learning (usually 100 units). Here every unit is evaluated against the already established limitcurves. Only error free units will be added to the learning sample.
Another available choice consists of a indefinite learn process with a selectable time constant.
During the whole learning process, the fixed limits apply. This assures, that all known data (like limits from car experiments) will be used as a guidance during the process.
What is learned Learning methods

16.1.2008 15
Order spectrograms
Order spectrograms are recorded for the engine vibration signal.
From these order tracks for arbitrary orders and order spectra for arbitrary speeds can be generated:
1) Ordnungs-Spektrogramm 4. Gang Zug
Order track for the 65. order
2) Order spectrum at 2241 RPM
16.1.2008 16
Order Tracking
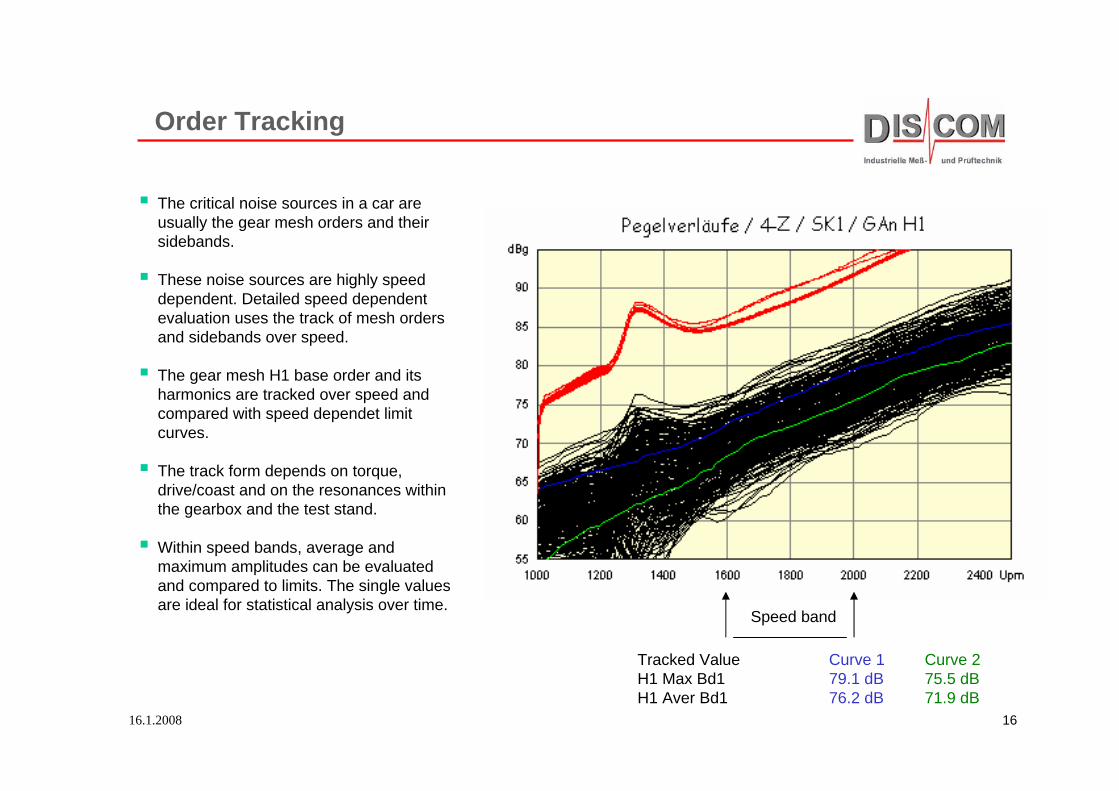
The critical noise sources in a car are usually the gear mesh orders and their sidebands.
These noise sources are highly speed dependent. Detailed speed dependent evaluation uses the track of mesh orders and sidebands over speed.
The gear mesh H1 base order and its harmonics are tracked over speed and compared with speed dependet limit curves.
The track form depends on torque, drive/coast and on the resonances within the gearbox and the test stand.
Within speed bands, average and maximum amplitudes can be evaluated and compared to limits. The single values are ideal for statistical analysis over time.
Speed band
Tracked Value Curve 1 Curve 2H1 Max Bd1 79.1 dB 75.5 dBH1 Aver Bd1 76.2 dB 71.9 dB
16.1.2008 17
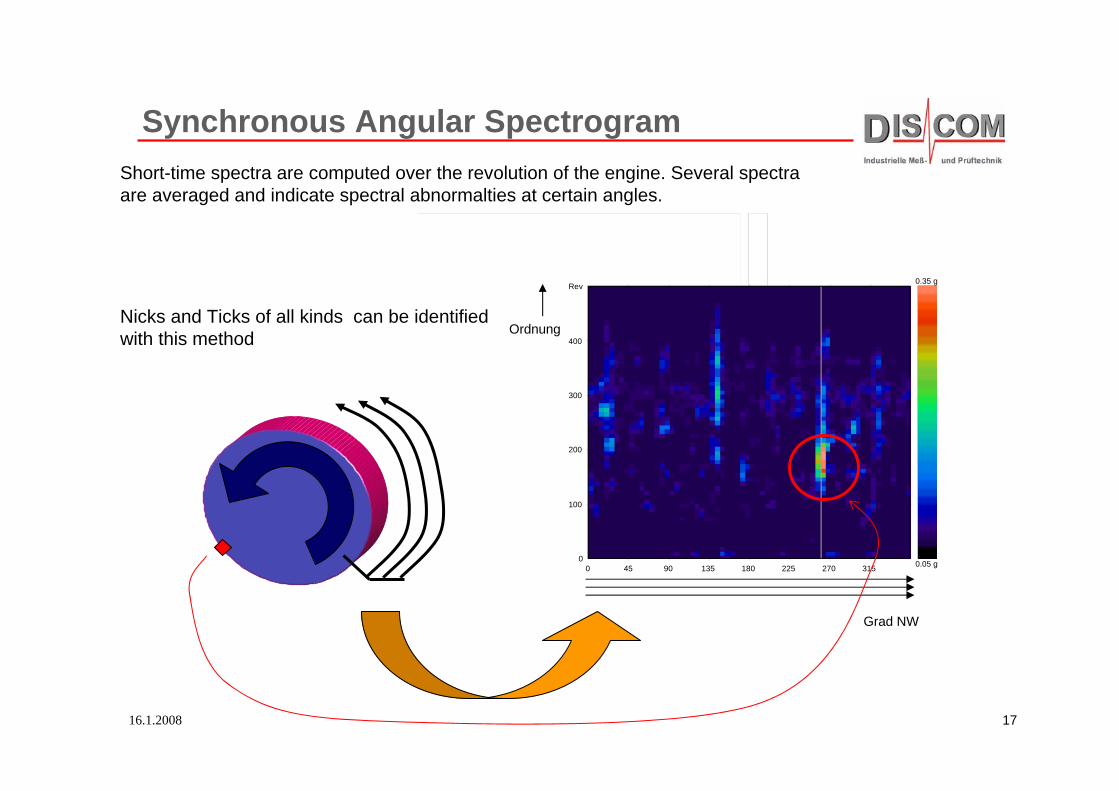
Synchronous Angular Spectrogram
0.05 g
0.35 g
0 45 90 135 180 225 270 3150
100
200
300
400
Rev
Short-time spectra are computed over the revolution of the engine. Several spectraare averaged and indicate spectral abnormalties at certain angles.
Nicks and Ticks of all kinds can be identifiedwith this method
Grad NW
Ordnung

16.1.2008 18
Hydraulic Valve Defect
und PrüftechnikIndustrielle Meß-
Spektrogramme 19.03.07 14:20-
Fahrstufe: High
0.05 g
0.45 g
0 45 90 13 5 18 0 22 5 27 0 31 50
100
200
300
400
Rev
gPrüfling1F (106.9 ) -
Körperschall rechts hinten
0.0 5 g
0.4 5 g
0 45 90 135 180 225 270 3150
100
200
300
400
Rev
gPrüfling2F (258.8 ) (168.8, 488): 0.00295711
Körperschall links vorne
0 2 4 6 8 10 12 14 16 Hz0.40.60.81.01.21.41.61.82.02.2g
Modulationsspektrum
A defective hydraulic valve is shown in the angular spectrum for twodifferent positions of accelerometers on the cylinder head
Modulation Spectrum
Rev Synchronous Spectrogram
Camshaft Degrees -> Camshaft Degrees ->
Ord
ers
->
Ord
ers
->
Rev Synchronous Spectrogram
Orders ->
Accel back right Accel front left
16.1.2008 19
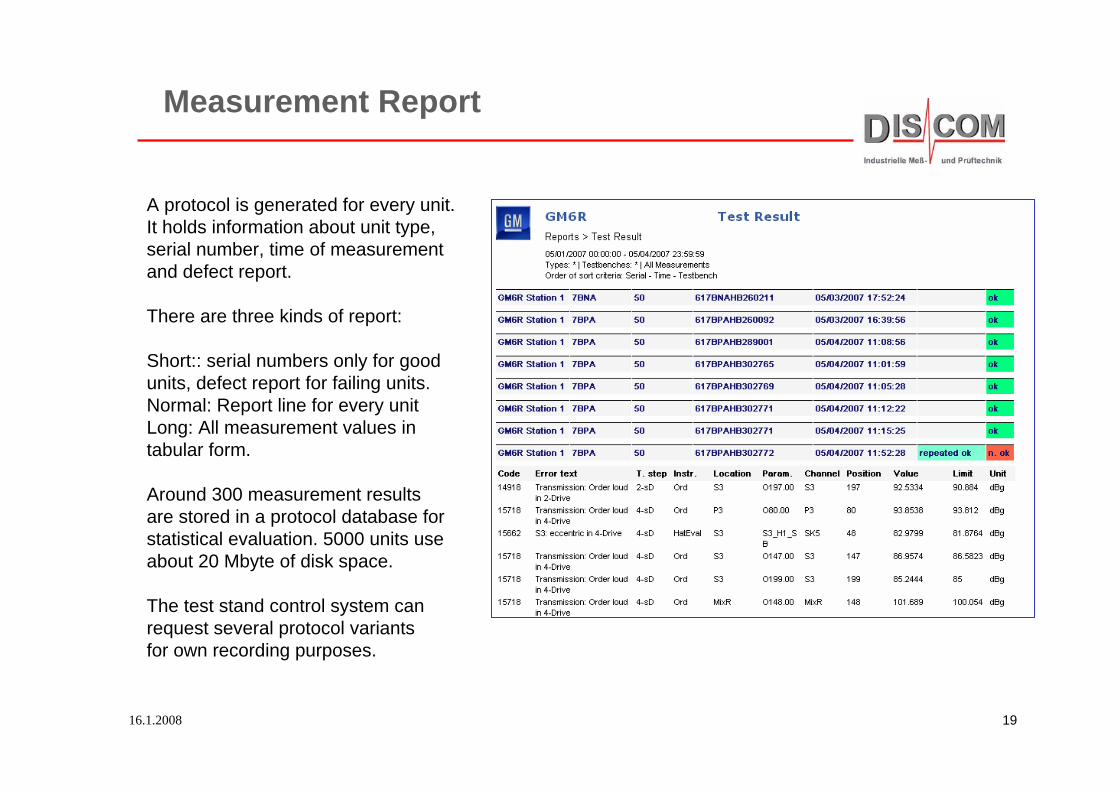
Measurement Report
A protocol is generated for every unit. It holds information about unit type,serial number, time of measurementand defect report.
There are three kinds of report:
Short:: serial numbers only for goodunits, defect report for failing units.Normal: Report line for every unitLong: All measurement values in tabular form.
Around 300 measurement resultsare stored in a protocol database forstatistical evaluation. 5000 units useabout 20 Mbyte of disk space.
The test stand control system can request several protocol variantsfor own recording purposes.
16.1.2008 20
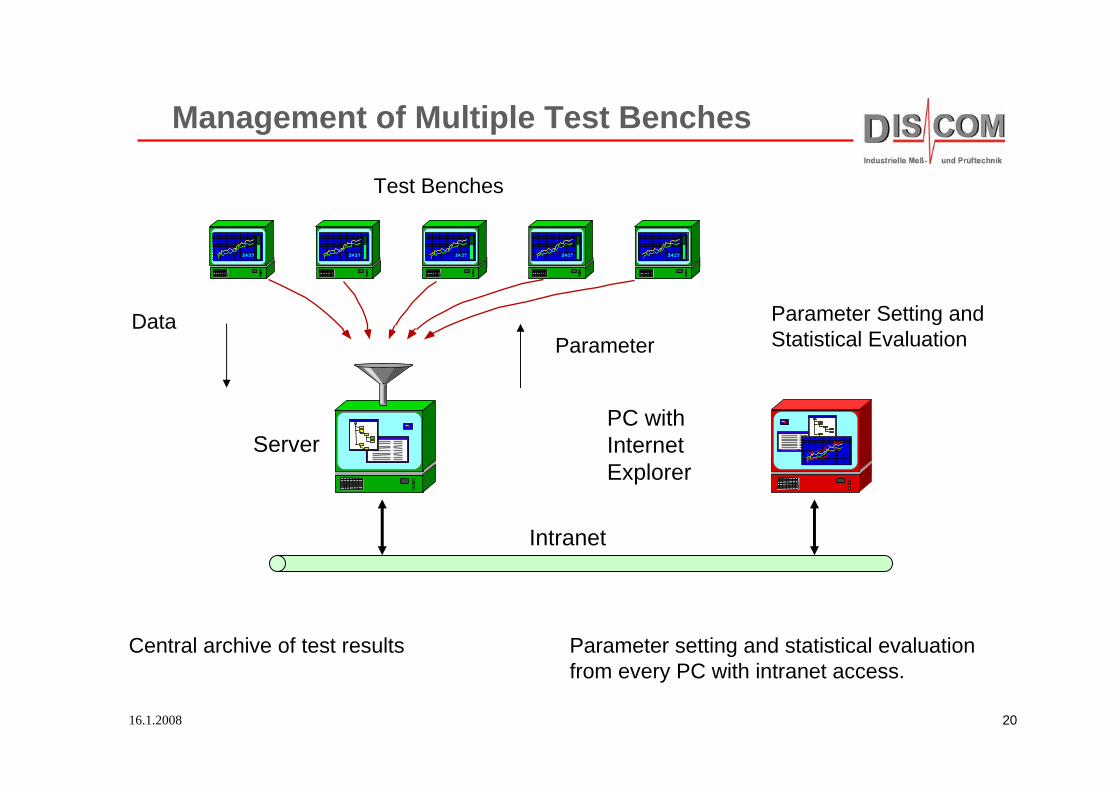
Management of Multiple Test Benches
Server
Parameter Setting and Statistical Evaluation
Test Benches
Intranet
DataParameter
PC withInternet Explorer
Central archive of test results Parameter setting and statistical evaluation from every PC with intranet access.

16.1.2008 21
RotasAnalyzerRotas
Analyzer
MeasurementDatabase
MeasurementDatabase
MeasurementArchives
MeasurementArchives
RotasPresentation
RotasPresentation
Intranet StatisticsIntranet Statistics
Rotas Data Flow
Server or Test Stand
Test Stand
Work Group PC
Work Group PC has presentation software installedCan use Intranet statistcis via Internet Explorer
16.1.2008 22
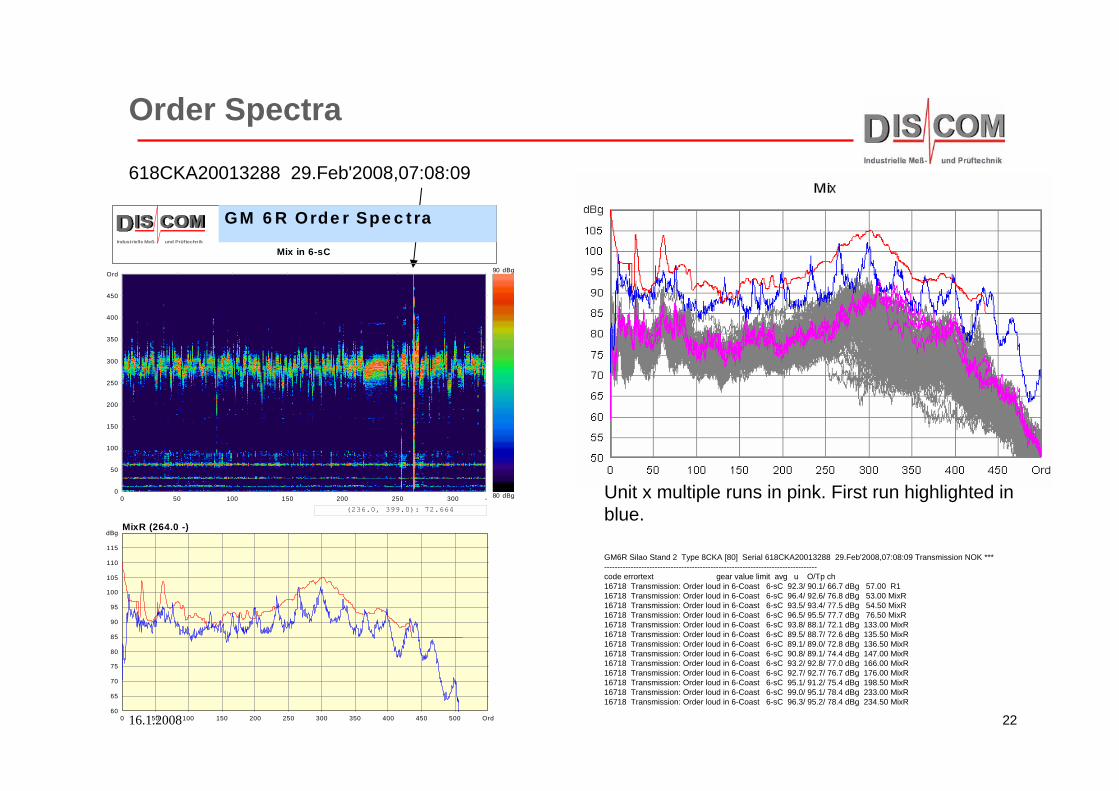
GM6R Silao Stand 2 Type 8CKA [80] Serial 618CKA20013288 29.Feb'2008,07:08:09 Transmission NOK ***--------------------------------------------------------------------------------code errortext gear value limit avg u O/Tp ch16718 Transmission: Order loud in 6-Coast 6-sC 92.3/ 90.1/ 66.7 dBg 57.00 R116718 Transmission: Order loud in 6-Coast 6-sC 96.4/ 92.6/ 76.8 dBg 53.00 MixR16718 Transmission: Order loud in 6-Coast 6-sC 93.5/ 93.4/ 77.5 dBg 54.50 MixR16718 Transmission: Order loud in 6-Coast 6-sC 96.5/ 95.5/ 77.7 dBg 76.50 MixR16718 Transmission: Order loud in 6-Coast 6-sC 93.8/ 88.1/ 72.1 dBg 133.00 MixR16718 Transmission: Order loud in 6-Coast 6-sC 89.5/ 88.7/ 72.6 dBg 135.50 MixR16718 Transmission: Order loud in 6-Coast 6-sC 89.1/ 89.0/ 72.8 dBg 136.50 MixR16718 Transmission: Order loud in 6-Coast 6-sC 90.8/ 89.1/ 74.4 dBg 147.00 MixR16718 Transmission: Order loud in 6-Coast 6-sC 93.2/ 92.8/ 77.0 dBg 166.00 MixR16718 Transmission: Order loud in 6-Coast 6-sC 92.7/ 92.7/ 76.7 dBg 176.00 MixR16718 Transmission: Order loud in 6-Coast 6-sC 95.1/ 91.2/ 75.4 dBg 198.50 MixR16718 Transmission: Order loud in 6-Coast 6-sC 99.0/ 95.1/ 78.4 dBg 233.00 MixR16718 Transmission: Order loud in 6-Coast 6-sC 96.3/ 95.2/ 78.4 dBg 234.50 MixR
Order Spectra
618CKA20013288 29.Feb'2008,07:08:09
und PrüftechnikIndustrielle Meß-
GM 6R Order Spectra
Mix in 6-sC
80 dBg
90 dBg
(236.0, 399.0): 72.6640 50 100 150 200 250 300 -
0
50
100
150
200
250
300
350
400
450
Ord
0 50 100 150 200 250 300 350 400 450 500 Ord60
65
70
75
80
85
90
95
100
105
110
115
dBgMixR (264.0 -)
Unit x multiple runs in pink. First run highlighted in blue.
16.1.2008 23
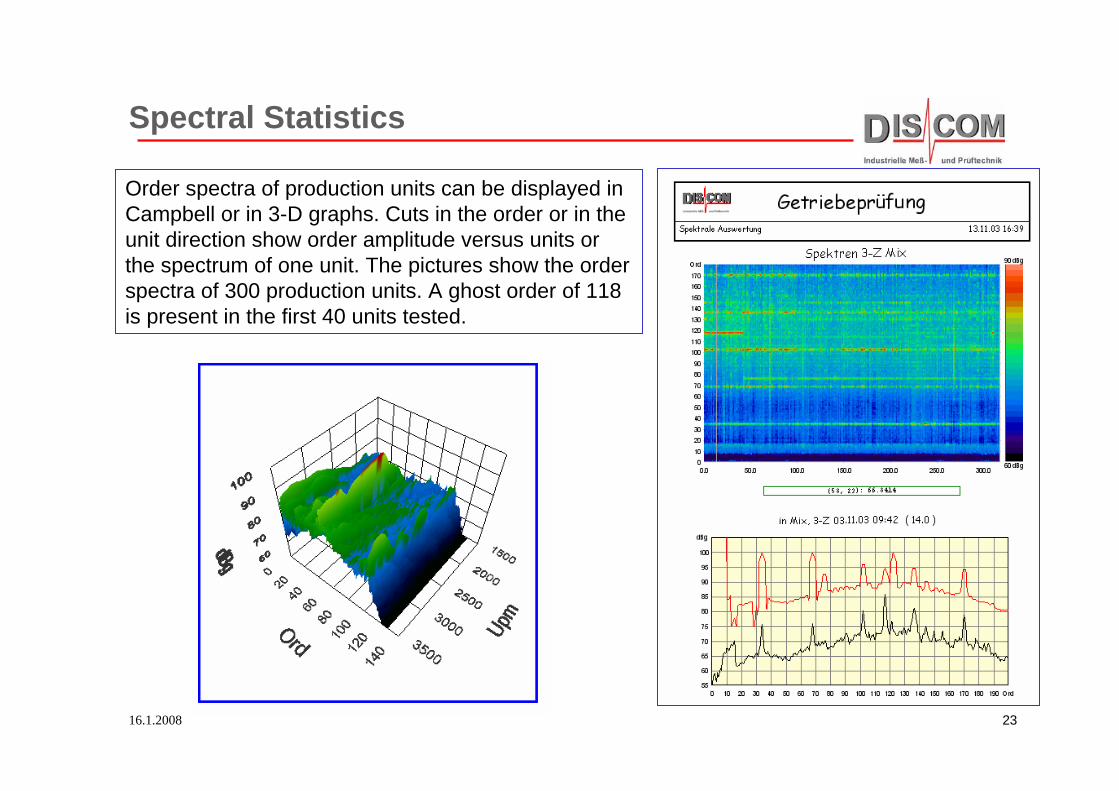
Order spectra of production units can be displayed in Campbell or in 3-D graphs. Cuts in the order or in the unit direction show order amplitude versus units or the spectrum of one unit. The pictures show the order spectra of 300 production units. A ghost order of 118 is present in the first 40 units tested.
Spectral Statistics

16.1.2008 24
Order Tracks
During the ramps, spectralcomponents are evaluated overthe speed.
Usually, the main gear meshorders and their harmonics aretracked.
In addition, energy in order bandsmay be tracked as well.
Track limits (shown in red) can beself learned or set manually.
16.1.2008 25
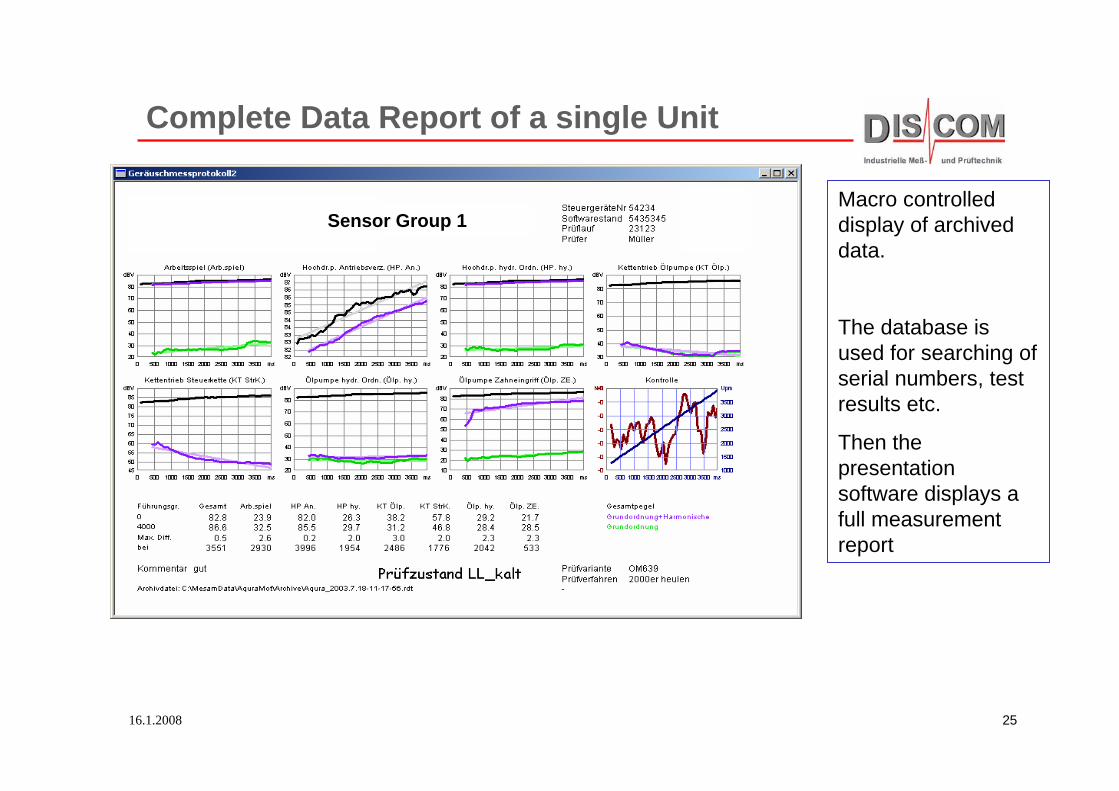
Complete Data Report of a single Unit
Macro controlleddisplay of archiveddata.
The database isused for searching of serial numbers, test results etc.
Then thepresentationsoftware displays a full measurementreport
Sensor Group 1
16.1.2008 26
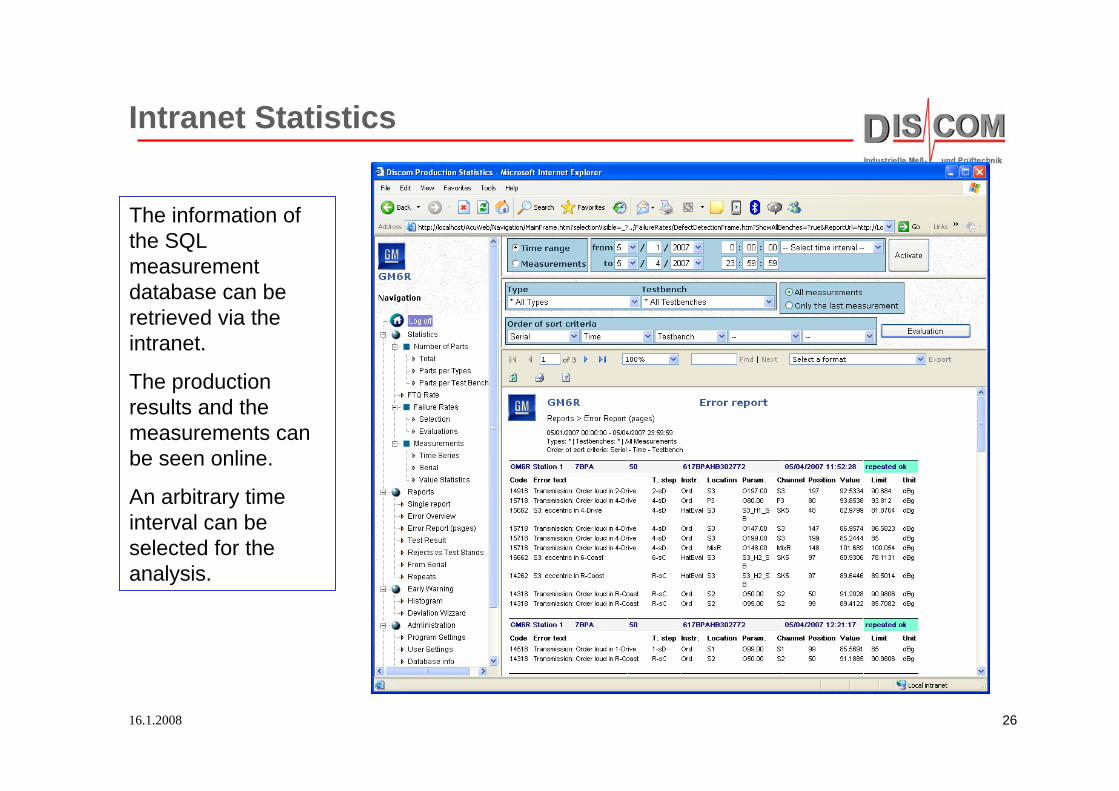
Intranet Statistics
The information of the SQL measurement database can be retrieved via the intranet.
The production results and the measurements can be seen online.
An arbitrary time interval can be selected for the analysis.

16.1.2008 27
Statistical Evaulation for Types and Benches
Test results The evaluation can be done over gearbox types or over test benches.
Any time interval can be specified.
16.1.2008 28
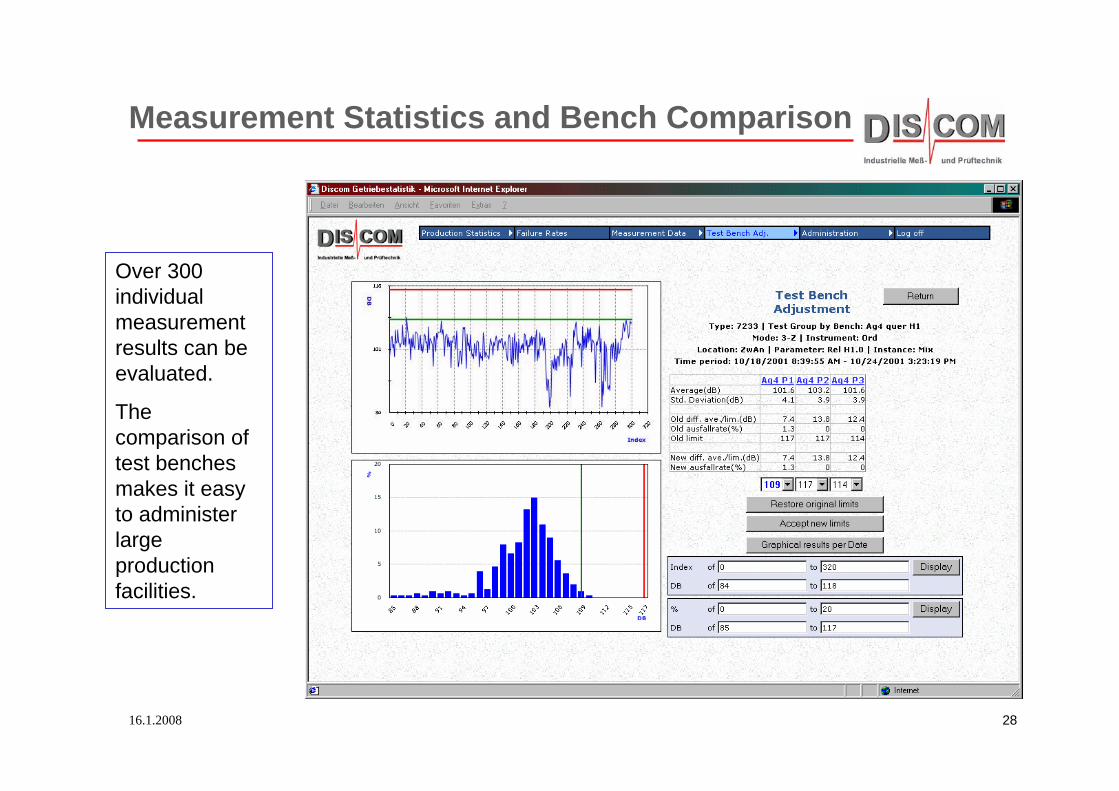
Measurement Statistics and Bench Comparison
Over 300 individual measurement results can be evaluated.
The comparison of test benches makes it easy to administer large production facilities.
16.1.2008 29
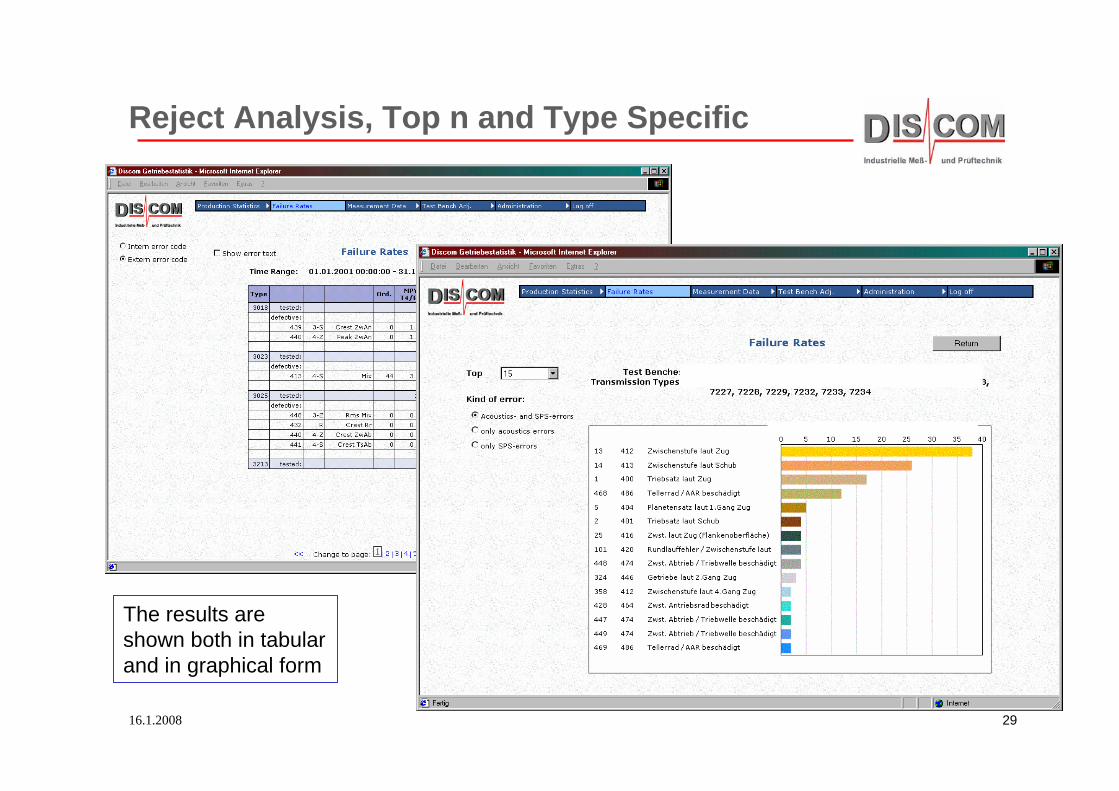
Reject Analysis, Top n and Type Specific
The results are shown both in tabular and in graphical form