Embed Size (px)
Citation preview

Rosneft Oil CompanyIFRS Results
Q2 2015
1 September 2015

Important Notice
Information herein has been prepared by the Company. The presented conclusions are based on the general informationcollected as of the date hereof and can be amended without any additional notice. The Company relies on the informationobtained from the sources which it deems credible; however, it does not guarantee its accuracy or completeness.g y p
These materials contain statements about future events and explanations representing a forecast of such events. Anyassertion in these materials that is not a statement of historical fact is a forward-looking statement that involves known andunknown risks, uncertainties and other factors, which may cause our actual results, performance or achievements to bematerially different from any future results performance or achievements expressed or implied by such forward-lookingmaterially different from any future results, performance or achievements expressed or implied by such forward lookingstatements. We assume no obligations to update the forward-looking statements contained herein to reflect actual results,changes in assumptions or changes in factors affecting such statements.
This presentation does not constitute an offer to sell, or any solicitation of any offer to subscribe for or purchase anyiti It i d t d th t thi i thi t / t ti id d f t t it tsecurities. It is understood that nothing in this report / presentation provides grounds for any contract or commitment
whatsoever. The information herein should not for any purpose be deemed complete, accurate or impartial. The informationherein in subject to verification, final formatting and modification. The contents hereof has not been verified by theCompany. Accordingly, we did not and do not give on behalf of the Company, its shareholders, directors, officers oremployees or any other person, any representations or warranties, either explicitly expressed or implied, as to the accuracy,completeness or objectivity of information or opinions contained in it. None of the directors of the Company, itsshareholders, officers or employees or any other persons accepts any liability for any loss of any kind that may arise fromany use of this presentation or its contents or otherwise arising in connection therewith.
2

Overview of Key Developments
Macroeconomic environment1
Indicator 2Q 15 1Q 15 % 1H 15 1H 14 %
Urals, $/bbl 61.8 52.8 17.0% 57.3 107.1 (46.5)%
Urals, th. RUB/bbl 3.25 3.28 (1.0)% 3.29 3.75 (12.2)%
Naphtha, th. RUB/t 26.71 27.21 (1.8)% 26.96 31.64 (14.8)%
Gasoil 0.1%, th. RUB/t 29.99 32.30 (7.2)% 31.14 31.82 (2.1)%
Fuel oil 3.5%, th. RUB/t 15.88 15.75 0.8% 15.81 19.36 (18.3)%
Average exchange rate, RUB/$ 52.65 62.19 (15.3)% 57.40 34.98 64.1%
Highlights
Inflation over period, % 1.1% 7.4% - 8.5% 4.8% -
g g
Approval of annual dividends for 2014 at RUB 8.21 per share (paid in July 2015)
Drilling works completion with Statoil at Pr1 formation of the Severo-Komsomolskoye field
Signing an agreement with PKN Orlen to increase crude oil monthly supplies by 120 kt
20% stake disposal in Taas-Yuryakh Neftegazodobycha
3Source: Thomson ReutersNote: (1) Average MED and NWE, Naphtha FOB MED, Gasoil 0.1% FOB ARA, Fuel oil 3.5% FOB NWE
Signing the term sheet with ВР for reorganization of ROG JV, acquiring 16.67% stake in Schwedt Refinery from Total

Key Performance Indicators
Indicator 2Q 15 1Q 15 % 1H 15 1H 14 %
Hydrocarbon production kboepd 5,149 5,200 (1.0)% 5,175 5,075 2.0%
Crude oil and NGL productionkbpd 4,126 4,131 (0.1)% 4,129 4,176 (1.1)%
Gas production, bcm 15.29 15.80 (3.2)% 31.09 26.72 16.4%
Oil Refining, mmt 23.75 24.34 (2.4)% 48.09 48.49 (0.8)%
Retail of oil products (domestic market),mmt
2.7 2.5 8.0% 5.2 5.3 (1.9)%
4

Key Financial Results
Indicator 2Q 15 1Q 15 % 1H 15 1H 14 %
Revenues,RUB bln 1,312 1,288 1.9% 2,600 2,810 (7.5)%
EBITDA,RUB bln 311 265 17.4% 576 593 (2.9)%RUB bln
Adjusted EBITDA1, RUB bln 326 286 14.0% 612 593 3.2%
Adjusted net profit2,RUB bln 134 56 >100% 190 212 (10.4)%
Operating cash flow3, RUB bln 351 258 36.0% 609 470 29.6%RUB bln
Capex,RUB bln 141 128 10.2% 269 237 13.5%
Free cash flow3,RUB bln 210 130 61.5% 340 233 45.9%
Net debt,RUB bln 2,215 2,529 (12.4)% 2,215 1,525 45.2%
5
RUB bln , , ( ) , ,
Note: (1) Adjusted for the difference in the exchange rates applicable at recognition of the revenue from long-term oil supply contracts in 2Q and 1Q 2015 in the amount of RUB 15 bln and RUB 21 bln accordingly; (2) excluding profit from share in YuGP disposal in the amount of RUB 45 bln (nett) in 1Q 2014; (3) adjusted for trading securities transactions, and for recognition of prepayments for long-term crude supply contracts in the amount of RUB 21 bln in 1Q and 2Q 2015, and for prepayments in the amount of RUB 431 bln in 1H 2014.
Operating Results

Drilling
SamaraNG: optimization of the development drilling program improved flow rates from new wells to 67 5
Key achievements in 1H 2015Development drillingth. m
program improved flow rates from new wells to 67.5 t/d in 1H 2015. Launching 41 new wells ensured cumulative production of 186 kt, or up 70% vs. 1H14
YuganskNG: the share of horizontal wells with multi-stage fracturing increased to 12% from 9% in 1H 2014
+32%
2,301 3,039
1H 2014 1H 201 201
stage fracturing increased to 12% from 9% in 1H 2014
Optimization of well construction technological programs – horizontal wells drilling rate increased by 8% y/y
S kh li 1 tti ld d i t t l ll1H 2014 1H 2015 2015 Sakhalin-1: setting a new world record in total well length drilled at the Chaivo field – 13,500 m
Plans for 2015New wells completion
Development drilling increase (at least +30% y/y)
YuganskNG: further increase in the number of horizontal wells with multi-stage fracturing( 10th ll)
Directional wells Horizontal wells
units
+15%(on average, every 10th well)
SamaraNG: growing production from new wells (at least +25% y/y)
Severo-Komsomolskoye Field: preparing for well
700 806
7
y p p gtests, determining further prospects and ways to develop Pr1 formation 1H 2014 1H 2015 2015

Production
kboepd+2%
(45)(30) (21) (10) (10) 10 (12) 39
19 13
147
5,0755,175
Greenfields:+71 kb d +1 4%
Brownfields:118 kb d 2 3%
1H 2014 Yugansk Orenburg Samotlor VaryeganNG Purneftegaz Samara Other RN-Shelf(N th Ch i )
Uvat VChNG Gas production 1H 2015
+71 kbpd; +1.4% -118 kbpd; -2.3%
Greenfields production growth on development drilling program ramp-up and successful use of workovers
Drilling and workovers programs with consistent investment efficiency, executed at YuganskNG, Samotlor and PurNGreduce brownfields natural decline rate
N th Ch 1 l t f d il d d i M ( l ti l i S t b 2014)
(Nothern Chaivo)
Northern Chayvo: 1 mln t of crude oil produced in May (cumulatively since September 2014)
Uvat: a new record in commercial onshore drilling rate in Russia: 7.5 days for 1,000 m (down 10% to min 2014); the Protozanovskoye field was launched (production peak at c.1 mmt)
VChNG: As a result of infrastructure optimization, the oil treatment capacity increased by 25% to more than 8 mmtpap p y y p
Gas production: Production growth on launching new production capacity and gas transportation facilities at PurNG and at Vankor; launching gas production at Khadyryakhinsky license area of Sibneftegaz in 2H14, and further improvement in APG utilization (mostly at Vankor)
8

Progress in Key Projects Development
Severo-Komsomolskoye FieldLabaganskoye Field
Development drilling started in 2Q15. The first well wascommissioned in July 2015
The field is characterized by complex geologicalstructure with the oil rim of high-viscosity oil andcommissioned in July 2015
The 1st start-up complex at Labaganskoye field in NAOis to be launched by the end of 2015
Production is expected to reach ~1 mmtoe in 2016
structure with the oil rim of high-viscosity oil andpresence of extensive gas cap
On 23 May, 2013 Rosneft and Statoil signed anagreement on cooperation
In 2015 the companies drilled two horizontal Production is expected to reach 1 mmtoe in 2016
As of 31.12.2014, 3P reserves of the field wereestimated at 161.9 mmboe (PRMS)
Since July 2015 7 wells launched with initial flow rates
In 2015 the companies drilled two horizontalproduction wells
For the first time in Russia the well was completedusing the "open-hole – gravel packs" scheme at the1 000 m-long horizontal section Since July, 2015 7 wells launched with initial flow rates
at 64-203 tpd1,000 m long horizontal section
As of 31.12.2014, 3P reserves of this field wereestimated at 888.9 mmboe (PRMS)
9

Partnership with BP in Taas-Yuryakh
Asset description
The key field is Srednebotuobinskoye
Start of commercial production – Oct 2013; current production rate ~20 kbpd;production plateau – 100 kbpd
A 169 km long pipeline has been constructed to connect the field to ESPO
The gas monetization is expected following the Power of Siberia pipeline commissioning
MET holidays are in place till 2021
Reserves as of 31.12.2014Deal advantages for shareholders
TYuNGD ESPO pipeline commissioning station
Balance of Company cash flow: RUB 8 bln advanceOil + Condensate, mmt Gas, bcm
2P 3P 2P 3P
Balance of Company cash flow: RUB 8 bln advance payment is received
The 2nd stage of field development is been accelerated with the partner’s financing and technological support
137.6 241.6 68.3 79.2 The cost of arrangement exceeds the historical asset acquisition cost of $717 mln for the 20% share
Confirmation of Russian oil & gas sector attractiveness, i t i i th f t Sib i b
10
maintaining the pace of eastern Siberia resource base development and increasing access to APR markets

Gas Business: organic growth and efficient monetization
Gas production organic growth by 16% in 1H15 y/y (incl.
Key achievements over 6M 2015 Gas productionbcm
31 1natural gas - by 10.4%, APG - by 22.6%)
Improvement in APG utilization up to 87% in 1H15 (up10% y/y, mostly due to higher gas supplies from Vankorfield to Gazprom grid)
26.731.1
+16%
p g )
Average sales price in Russia rose by 4% y/y in 1H15, asa result of supplies1 start under the new contracts
In June 2015 the Russian Federal Tariff Service made a6M 20156M 2014decision to increase wholesale prices on gas by 7.5%
from July 1, and independent producers’ tariffs for gastransportation by trunk pipelines by 2% on averageacross Russia Gas sales in Russia
6M 20156M 2014OtherYuganskneftegaz
Purneftegaz VankorneftSamotlorneftegaz Sibneftegaz
In 1H15 Rosneft secured two thirds of gas exchangetrading volume: contracts were concluded for supply ofmore than 1 bcm of gas 75.5
89.16M 20146M 2015
+18%
25.4 28.8
3.09
2.98
+13% +4%
11
Sales volume, bcm Revenue, RUB bln
Average sales price,th. RUB/kcm
Note: (1) Supplies starts from 01.01.2015

Refining
Refining throughput and light product yield in Russia Key achievements in 2Q15
Full transition to production of Premium-95 gasoline Euro 5 at Angarsk PCC and diesel Euro 5 at Syzran
100%40.0 Oil refining in Russia, mmtE 4/5 li h % Euro-5 at Angarsk PCC and diesel Euro-5 at Syzran
refinery
The output of Euro-4/5 motor fuels grew by 56% y/y
Light crude oil supplies start to Syzran Refinery with 68%
72% 55%
80%
95% 95%
48%65%
73% 74%60%
80%
25.0
30.0
35.0Euro 4/5 gasoline share,%Euro 4/5 diesel share,%
g pp y ythe positive effect on refining margin exceeding RUB 200 mln over 2 months
Supplies of own TAME octane boosters (Sanors)
L hi il d ti it t T
21.620.6
21.7
22.821.7
20.5
52%48% 48%
20%
40%
10.0
15.0
20.0
Progress in refineries upgrade program Plans for 2015
Launching vacuum gasoil production unit at Tuapse Refinery
0%0.0
5.0
1Q 14 2Q 14 3Q 14 4Q 14 1Q 15 2Q 15
Progress in refineries upgrade program Plans for 2015
Full transition to production of Euro-5 motor fuels at all refineries
Launch of MTBE production unit and replacement of 55%
57%
Kuybyshev Refinery
Tuapse Refinery
au c o p oduc o u a d ep ace e oisomerization catalyst at Angarsk PCC
Scheduled turnarounds in Sep-Oct at Achinsk, Saratov and Syzran refineries
45%
46%
47%
49%
N k b h R fi
Syzran Refinery
Angarsk PCC
Komsomolsk Refinery
1232%
45%
45%
Ryazan Refinery
Achinsk Refinery
Novokuybyshev Refinery

Crude and Product Sales
Netbacks of main oil monetization channels Oil monetization structure (2Q 2015)
95%80
Переработка нефти на НПЗ Внутренний рынок
Экспорт Коэффициент использования мощностей НПЗ
Oil refining at refineries
Export
Domestic market
Capacity utilization rate
42%78
87%89%
88% 88%85% 87%
75%
80%
85%
90%
95%
30
80
30
80
$/t 55%
3%
365 3
367
258
227 27
7349
366
322
216
226
27934
7
358
310
199 220 27
7
60%
65%
70%
75%
80
30
80
Share of high-margin channels
50%
55%
20
30
1 кв. 2014 г. 2 кв. 2014 г. 3 кв. 2014 г. 4 кв. 2014 г. 1 кв. 2015 г. 2 кв. 2015 г. 1Q 2014 2Q 2014 3Q 2014 4Q 2014 1Q 2015 2Q 2015
44% 50%+$44.7 mln
Increase in oil and product sales by 1.1% q/q in 2Q15
Increase in refining margin on domestic market premium recovery
Effect from high-margin channels share increase
Premium supplies to the Eastern export routes increased by 20% y/y in 2Q15
Further increase in the long-term contract volumes and expansion of oil product supply geography: Ch Chi ( 2 4 ) T fi (di l f l f
2Q 2014 2Q 2015
High-margin channels13
ChemChina (up to 2.4 mmt), Trafigura (diesel fuel from Mozyr Refinery), expansion of jet fuel and lubes sales geography
Note: (1) High-margin channels: De-Kastri, Kozmino, China, CPC and some supplies to Europe
1

Financial Results
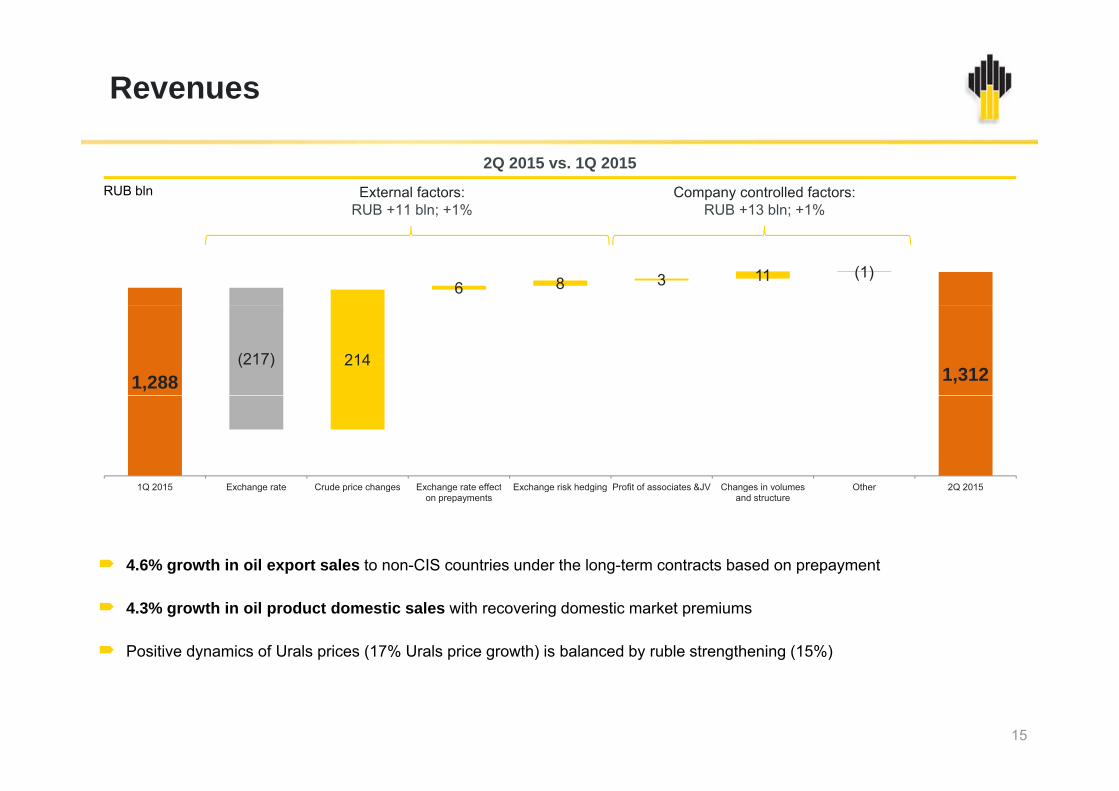
Revenues
2Q 2015 vs. 1Q 2015 RUB bln Company controlled factors:
RUB +13 bln; +1% External factors:
RUB +11 bln; +1%
6 8 3 11 (1)
;;
1,288 1,312(217) 214
1Q 2015 Exchange rate Crude price changes Exchange rate effect Exchange risk hedging Profit of associates &JV Changes in volumes Other 2Q 20151Q 2015 Exchange rate Crude price changes Exchange rate effecton prepayments
Exchange risk hedging Profit of associates &JV Changes in volumes and structure
Other 2Q 2015
4.6% growth in oil export sales to non-CIS countries under the long-term contracts based on prepayment
4.3% growth in oil product domestic sales with recovering domestic market premiums
Positive dynamics of Urals prices (17% Urals price growth) is balanced by ruble strengthening (15%)
15

Net Crude Oil Export Revenue
Export duty
th. RUB/t
13.65 13.3913.77
14.848.06 6.87
Export dutyYugansk-Primorsk tariffMETNet export revenue1
6 08 6 14 6.87 7.071.61 1.61
1.611.61
1.70 1.70
69%
5.95 6.41 5.26 3.586.91 7.07
6.08 6.145.84
5.27
6
3.58
1Q 2014 2Q 2014 3Q 2014 4Q 2014 1Q 2015 2Q 2015
The share of fiscal payments and natural monopolies tariffs in oil price amounted to 69% in 2Q15
Net export revenue increased by 2.3% in ruble terms q/q
In 1H15 net export revenue increased by 13.2% vs. 1H14 and by 31.9% vs. 2014 level
16Note: (1) Calculation based on average Urals prices (FOB Primorsk), converted into rubles on a day-to-day basis

Operational Costs Dynamics
60%180Costs
60%180 CostsRUB/boe
Refining costs in Russia dynamicsLifting costs dynamicsRUB/bbl
116110
132 121134
14 9% 18 6% 15 5%
40%120
Costs% vs. pr. year
144 150162 157 158
19.8%
40%120
% vs. pr. year
11014.9%6.8% 3.9%
18.6% 15.5%
0%
20%
602.9% 6.0% 8.7% 9.7%
0%
20%
60
-20%02Q 14 3Q 14 4Q 14 1Q 15 2Q 15
-20%02Q 14 3Q 14 4Q 14 1Q 15 2Q 15
Transportation costs dynamics Annual inflation rates
326368
329 40%
60%420Costs% vs. pr. year
RUB/bbl
16.5%15 1%301 295
326 329
12.3%7.7%
14.8%20.3%
9.3%20%
140
280
7.7% 8.0%
11.4%
15.1%
-20%
0%
02Q 14 3Q 14 4Q 14 1Q 15 2Q 15 172Q 14 3Q 14 4Q 14 1Q 15 2Q 15

EBITDA and Net Profit
External factors:RUB +47 bln; +18%
Company controlled factors:RUB -1 bln; -0.3%
EBITDA in 2Q 2015 vs. 1Q 2015 EBITDA growth by 17%
in 2Q15 vs. 1Q15 RUB bln
(82)
64
8 3 4 (3) (5) Positive effect of the time lag in export duties
Gro ing profitabilit of domestic265
311(82) 57
1Q 2015 E h t C d i D t l E h i k P fit f Ch f G l i l Oth 2Q 2015
Growing profitability of domestic market
Increasing premium export oil supplies
1Q 2015 Exchange rate Crude price change
Duty lag Exchange risk hedging
Profit of associates
&JV
Change of volumes and
structure
Geologicalexploration
Other 2Q 2015
Net profit in 2Q 2015 vs. 1Q 2015 RUB bln
supp es
More than twofold net profit growth in 2Q 2015 vs. 1Q 2015
(2)62
19 (6)(22)
Decreased financial expenses due to lower debt servicing costs and partial termination of transactions with financial derivativesin 1Q 2015
56
13446
(2)(19)
in 1Q 2015
18
1Q 2015 EBITDA change Changes in DDA
Changes in profit tax
Financial expences (net)
Other income Other expences Impact of FX differences
2Q 2015
Note: (1) Losses on foreign exchange differences within P&L amounted to RUB 5 bln in 2Q 2015 as compared with the profit of RUB 17 bln in 1Q 2015
1

Capex
5,600800RUB bln kboepd
Capex and production
23.04.2015 The Board of Directors of the Company approved a revised 2015-2016 business plan
2 800
4,200
400
600
approved a revised 2015 2016 business plan developed in the conservative environment and ensuring delivery of the strategic objectives of the Company at a balanced financial structure with the existing restrictions on access to external financing
533560
1,400
2,800
200
400
2015 Investment Program targets: Sustain the level of hydrocarbons production not
below the level of 2014
269
002013 2014 1H 15 2015POther Downstream Upstream HC production
Upstream CAPEX in 1H15: benchmarking
Ensure sufficient free cash flow and maximum retention of EBITDA
Focus on most efficient projects
2015 capex growth projections are driven by the development drilling increase in order to sustain brownfields production on improved availability of drilling service; by accelerated infrastructure and greenfields development
$/boe
20 2
9.5
9.2
4.2
greenfields development
Retaining the leading position in capex efficiency in 2015: at c. $5/boe
27.0
24.9
23.4
20.2
1940.1
29.3
27.9
Note: (1) Rosneft, Petrobras, Statoil, Gazprom neft data is for 1H 2015; Lukoil data is for 1Q 2015; other companies data is for 2014

Free Cash Flow
596Y
Free Cash Flow
Free Cash Flow increase by 46% y/y to RUB 340 blnin 1H15
RUB bln
Year
6M
in 1H15
Despite worsening global market conditions, Rosneft keeps generating free cash flow at $7/boe level demonstrating the best performance among public oil and gas companies
340
204
68
233 and gas companies
Rosneft retains its leading position in terms of FCF generation in Russian oil and gas sector
2013 2014 2015
FCF 1H 2015: benchmarking (majors)
$/boe
FCF: benchmarking (Russian VIOC)
RUB bln
4
7
$/boe RUB bln x2
703
-2
1
3
135253
369
Russian VIOC Rosneft Russian VIOC Rosneft-12
-7
203Q 2013 - 2Q 2014 (LTM) 3Q 2014 - 2Q 2015 (LTM)

Sources and Uses of Cash
1H 2015 2Q 2015 RUB bln RUB bln
69Proceeds from asset sale
269Operational cash flow
39
67
569
31
Cash available for debt management
Interest39569
1423
187
331Purchase of subsidiaries, acquisition of interest in associates and other fin assets
263
138
14 associates and other fin.assets
Capex and licenses
Sources UsesSources Uses
21

Financial Stability
Debt and net debt dynamics$ bln(1) For 6M 2015 - consolidated debt load was reduced by
10 2% or by $6 2 bln1 to $54 3 bln1 (RUB 3 013 bln)
50
60
70
10.2%, or by $6.2 bln to $54.3 bln (RUB 3,013 bln)
For 6M 2015 net debt decreased by $3.9 bln1 YTD to$39.9 bln1 (RUB 2,215 bln)
Free cash and short tem financial assets amounted to20.4 20.6
16.712 750
60
70
Net debt Cash, cash equivalents and ST fin.assests
54.3 Total Debt
20
30
40
50
60.5 56.0
Free cash and short tem financial assets amounted toc.$14.4 bln1 (RUB 798 bln) as of June 30, 2015
Repayments of financial liabilities were at $5.9 bln3 (RUB 309 bln) in 2Q 2015 , including early repayment of the
12.7 14.4
20
30
40
50
65.7 65.6 60.5 56.0 54.3
0
10
2Q 2014 3Q 2014 4Q 2014 1Q 2015 2Q 2015
Repayment schedule(2)
) g y p yloans in the amount of c. $0.6 bln4 (RUB 30 bln), including interests
45.3 45.0 43.8 43.3 39.90
10
$ bln(1)
10.915.1
11.15.7
18.1
3-4Q. 2015 2016 2017 2018 2019-2029
22Note: (1) Based on the US dollar exchange rate established by the Central Bank of the Russian Federation as of the end of relevant reporting period, (2) With due account for the future interest to be accrued on currency exchange rates and interest rates as of 30.06.2015, (3) Based on the average US dollar exchange rate in 2Q 2015, (4) Based on the US dollar exchange rates established by the Central Bank of the Russian Federation as of the repayment dates

Appendix

EBITDA and Net Profit
External factors:RUB -38 bln.; -6%
Company controlled factors:RUB +21 bln; +3%
RUB bln
EBITDA 1H 2015 vs. 1H 2014
373 (301)
1 (37) 9 (25) (58)
RUB 38 bln.; 6% RUB 21 bln; 3%
593 576
( ) 9 (25) (58) (21) 3 39
1H 2014 Change in Oil price change Export Tax maneuvre Excise and other tax Change in trasport Exchange risk Change in OPEX and Profit of associates Volume and structure 1H 20151H 2014 Change inexchange rate
Oil price change Exportduty lag
Tax maneuvre Excise and other tax rate change
Change in trasport tariffs
Exchange risk hedging
Change in OPEX and other
Profit of associates &JV
Volume and structure changes
1H 2015
RUB bln
Net profit 1H 2015 vs. 1H 2014
3 (17)(30)
(75)67
15
RUB bln
257 260190
(25) (5)67
Net income attributablet R ft
Non-controlling i t t
Net income in 1H 2014
Change inEBITDA
Change in DDA Finacial expences( t)
Other income1 Other expences Impact of exchange t diff
Change in profit tax Net income attributablet R ftto Rosneft
shareholdersin 1H 2014
interests 1H 2014 EBITDA (net) rate differences to Rosneft shareholdersin 1H 2015
24Note: (1) Other income includes proceeds from share in Yugragaspererabotka sale in 1Q 2014 in the amount of RUB 56 bln, and revenue from litigation debt relief in 1H 2015totaling RUB 37 bln

Changes in Expenses in 1H 15 vs. 1H 14
4 4 5 6
Lifting costs
RUB bln Lifting costs growth due to increased workovers, natural watercut growth at brownfields, and power
117137
4tariff increase
From April 1, 2015, wages of subsidiaries employees were increased by 7.5%
2 2 1
6M 2014 Larger number of wellworks
Power supply andwatercut growth
Sakhalin-1,new projects and infrastr.of brownfields
Production growth, payroll
and other factors
6M 2015
Refining costs in Russia
RUB bln
Refining costs growth due to increased costs of additives used for motor fuels productionof Euro-4 and Euro-5
G th i T ft d t t ti b t k
31 36
2 2 Growth in Transneft crude transportation by trunk pipelines tariffs by 6.5%, by 7.5% for ESPO deliveries from January 1, 2015
Growth in Transneft product transportation tariffs by6M 2014 Increase in additives
costsEmployment growth andand property insurance
Other 6M 2015
Transportation costsRUB bln
Growth in Transneft product transportation tariffs by 10% from February 1, 2015
10% indexation of tariffs, charges and payments for cargo transportation and infrastructure utilization while h dli t t ti b R i il
235274
2514
RUB bln handling transportation by Russian railways
6M 2014 Transneft and Russian Railwaytariffs change
Volume and routes 6M 2015
25
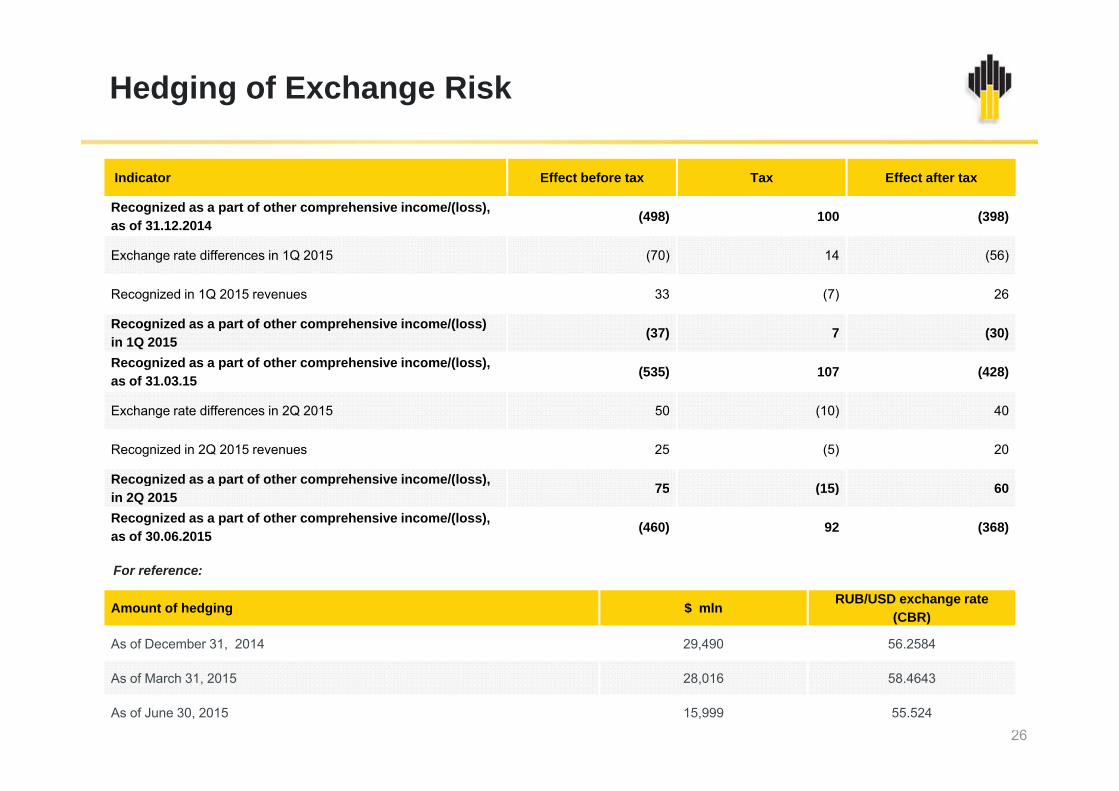
Hedging of Exchange Risk
Indicator Effect before tax Tax Effect after tax
Recognized as a part of other comprehensive income/(loss), (498) 100 (398)as of 31.12.2014 (498) 100 (398)
Exchange rate differences in 1Q 2015 (70) 14 (56)
Recognized in 1Q 2015 revenues 33 (7) 26
Recognized as a part of other comprehensive income/(loss)in 1Q 2015 (37) 7 (30)
Recognized as a part of other comprehensive income/(loss), as of 31.03.15 (535) 107 (428)
Exchange rate differences in 2Q 2015 50 (10) 40
Recognized in 2Q 2015 revenues 25 (5) 20
Recognized as a part of other comprehensive income/(loss), 75 (15) 60g p p ( ),in 2Q 2015 75 (15) 60
Recognized as a part of other comprehensive income/(loss), as of 30.06.2015 (460) 92 (368)
For reference:
Amount of hedging $ mln RUB/USD exchange rate(CBR)
As of December 31, 2014 29,490 56.2584
26
As of March 31, 2015 28,016 58.4643
As of June 30, 2015 15,999 55.524

Time Lag for Export Duty
RUB bln
(11) 3 (35) (129) (43) 23
300 301 311 317 308 288289 304276 265
311276
188
265
1Q 14 2Q 14 3Q 14 4Q 14 1Q 15 2Q 15
27
1Q 14 2Q 14 3Q 14 4Q 14 1Q 15 2Q 15
Normalized EBITDA Actual EBITDA
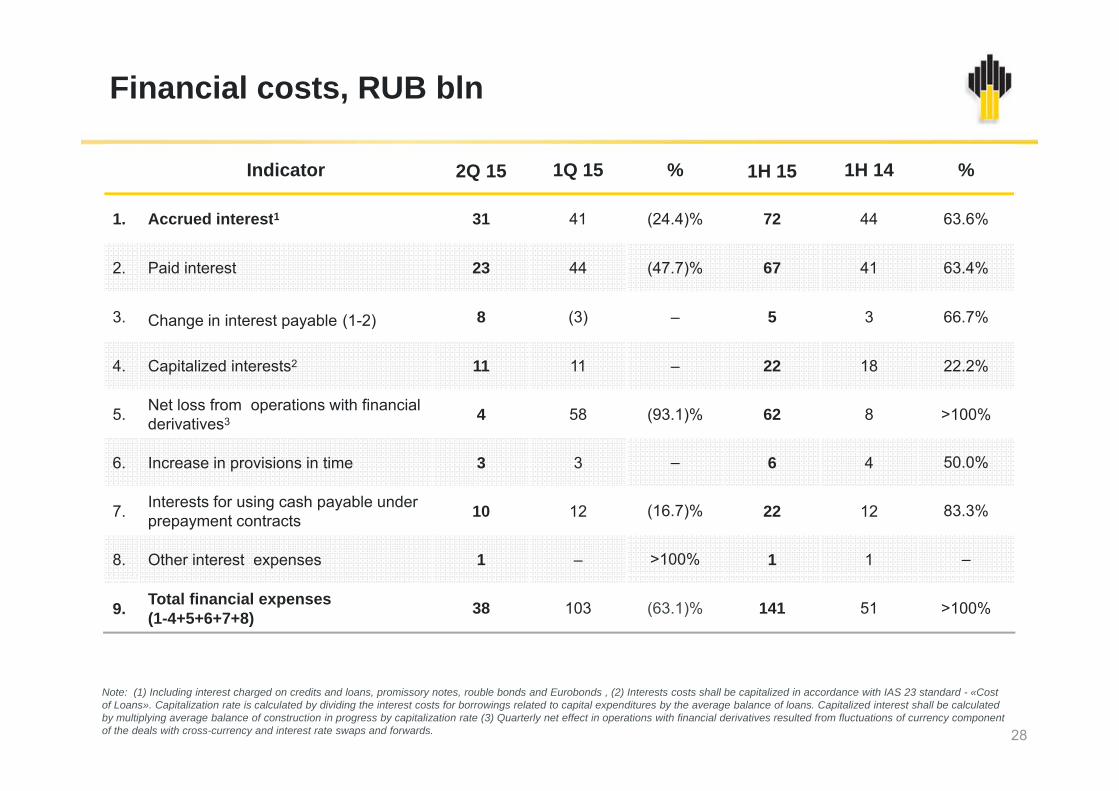
Financial costs, RUB bln
Indicator 2Q 15 1Q 15 % 1H 15 1H 14 %
1 Accrued interest1 31 41 (24 4)% 72 44 63 6%1. Accrued interest1 31 41 (24.4)% 72 44 63.6%
2. Paid interest 23 44 (47.7)% 67 41 63.4%
3. Change in interest payable (1-2) 8 (3) – 5 3 66.7%
4. Capitalized interests2 11 11 – 22 18 22.2%
5. Net loss from operations with financialderivatives3 4 58 (93.1)% 62 8 >100%
6. Increase in provisions in time 3 3 – 6 4 50.0%
7. Interests for using cash payable underprepayment contracts 10 12 (16.7)% 22 12 83.3%
8. Other interest expenses 1 – >100% 1 1 –
9. Total financial expenses (1-4+5+6+7+8) 38 103 (63.1)% 141 51 >100%
28
Note: (1) Including interest charged on credits and loans, promissory notes, rouble bonds and Eurobonds , (2) Interests costs shall be capitalized in accordance with IAS 23 standard - «Cost of Loans». Capitalization rate is calculated by dividing the interest costs for borrowings related to capital expenditures by the average balance of loans. Capitalized interest shall be calculated by multiplying average balance of construction in progress by capitalization rate (3) Quarterly net effect in operations with financial derivatives resulted from fluctuations of currency component of the deals with cross-currency and interest rate swaps and forwards.

EBITDA and Net Income Sensitivity
Urals price change Exchange rate changeRUB bln RUB blnRUB bln RUB bln
-11 $/bbl +11 $/bbl -9 RUB/$ +9 RUB/$
EBITDAEBITDA
(70) 70
Net Income
(40) 40
Net Income
(56) 56(32) 32
Average Urals price in 2Q 2015 was $61.8 /bbl. If the average price went down to $50/bbl over the same period, EBITDA would decline by RUB 40 bln due to change in price and also by RUB 43 bln due to lagging export taxationEBITDA would decline by RUB 40 bln due to change in price and also by RUB 43 bln due to lagging export taxation
Average RUB/$ rate was at 52.65 in 2Q 2015.If average RUB/$ depreciated by 9 over the said period, EBITDA wouldincrease by RUB 70 bln
29

Questions and Answers