Embed Size (px)
Citation preview
ROMGAZQ Q1 2019 Financial and Operational Results
May 2019
2
Disclaimer
Romgaz Group (Romgaz or Romgaz Group or The Company) consists of SNGN Romgaz SA as parent company, Filiala de Înmagazinare Gaze
Naturale Depogaz Ploieşti SRL (subsidiary owned 100% by Romgaz SA) and the associates SC Depomureş SA (40% owned by Romgaz SA)
and SC Agri LNG Project Company SRL (25% owned by Romgaz SA).
This document was prepared by SNGN Romgaz SA for the presentation of the Q1 2019 Results (Q1 stands for the 1st Quarter).
This document is for your information only and all statements contained herein are related to intentions, assumptions and forecasts made by SNGN
Romgaz S.A. or by its management. None of the information included herein shall be assumed as an invitation, an offer, a recommendation or an opinion
expressed by SNGN Romgaz S.A. to subscribe, purchase or sell any securities. Also, this document and all information included herein shall not form the
basis of any contract, investment decision or commitment whatsoever. This document and all information included herein shall not be treated as a
consultancy or advice whatsoever.
This presentation is not an offer for sale of securities in the United States or any other jurisdiction. The Company’s shares have not been and will not be
registered under the U.S. Securities Act of 1933 (the “Securities Act”) or with any securities regulatory authority of any state or other jurisdiction of the
United States.
To the extent available, the industry, market and competitive position data contained in this presentation has come from official or third party sources.
While the Company believes that each of these publications, studies and surveys has been prepared by a reputable source, the Company has not
independently verified the data contained therein. Accordingly, undue reliance should not be placed on any of the industry, market or competitive position
data contained in this presentation.
This presentation may include certain forward-looking statements, beliefs or opinions. No representation is made that any of these statements, beliefs or
opinions will be achieved. There are a number of risks, uncertainties and factors that could cause actual results and developments to differ materially
from those expressed or implied by these statements, beliefs or opinions. Past performance of the Company cannot be relied on as a guide to future
performance.
This document does not purport to contain all information that may be necessary in respect of the Company or its securities and each person receiving
this document should make an independent assessment.
Neither SNGN Romgaz S.A. nor its directors, management, employees and their consultancies can be held responsible for any losses or damages
howsoever arising, directly or indirectly, from any use of this document or its contents.
All figures included in this presentation are rounded (“round to nearest” method).
3
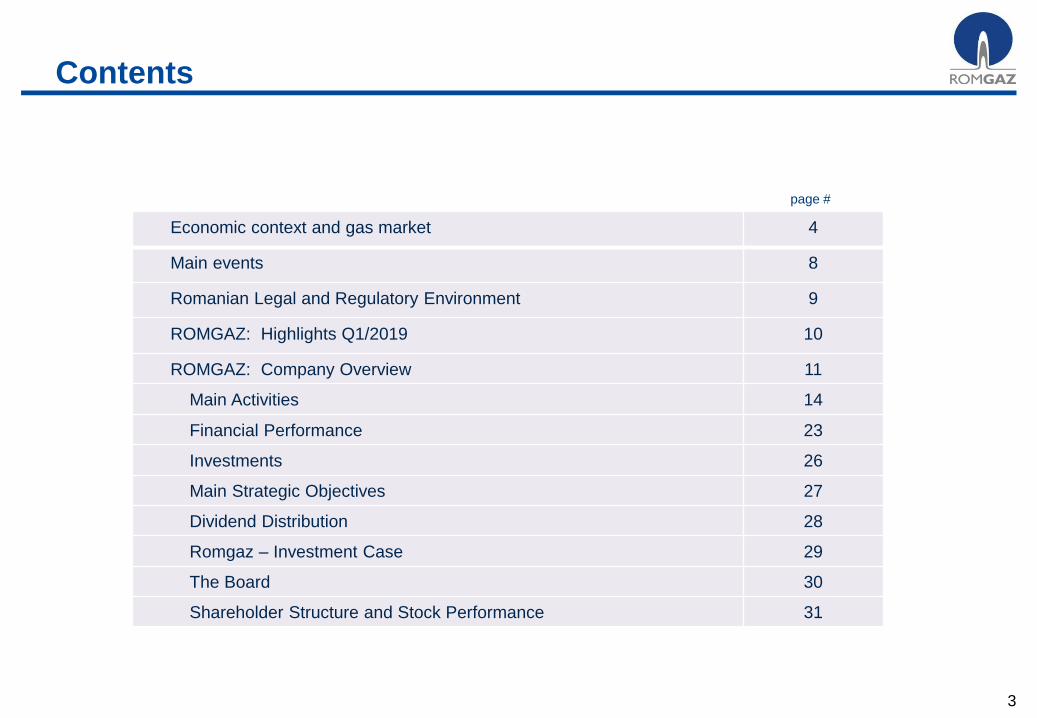
Contents
Economic context and gas market 4
Main events 8
Romanian Legal and Regulatory Environment 9
ROMGAZ: Highlights Q1/2019 10
ROMGAZ: Company Overview 11
Main Activities 14
Financial Performance 23
Investments 26
Main Strategic Objectives 27
Dividend Distribution 28
Romgaz – Investment Case 29
The Board 30
Shareholder Structure and Stock Performance 31
page #
4
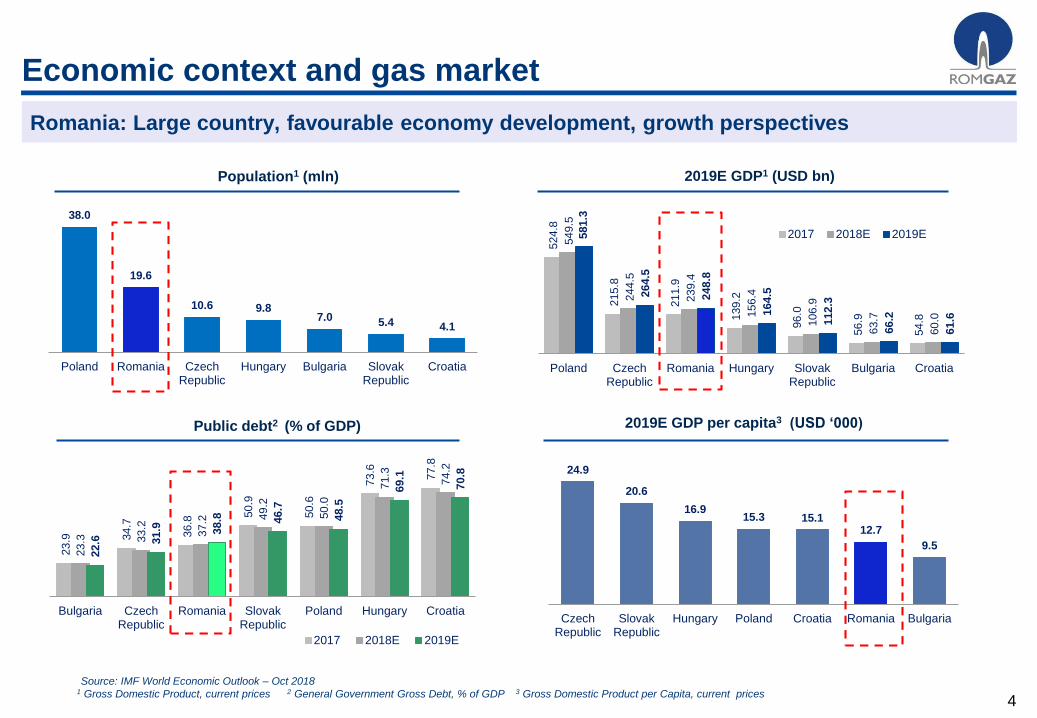
Economic context and gas market
Romania: Large country, favourable economy development, growth perspectives
2019E GDP per capita3 (USD ‘000)
24.9
20.6
16.915.3 15.1
12.7
9.5
CzechRepublic
SlovakRepublic
Hungary Poland Croatia Romania Bulgaria
Source: IMF World Economic Outlook – Oct 20181 Gross Domestic Product, current prices 2 General Government Gross Debt, % of GDP 3 Gross Domestic Product per Capita, current prices
524.8
215.8
211.9
139.2
96.0
56.9
54.8
549.5
244.5
239.4
156.4
106.9
63.7
60.0
581.3
264.5
248.8
164.5
112.3
66.2
61.6
Poland CzechRepublic
Romania Hungary SlovakRepublic
Bulgaria Croatia
2017 2018E 2019E
2019E GDP1 (USD bn)
23.9 3
4.7
36.8
50.9
50.6
73.6
77.8
23.3 3
3.2
37.2 4
9.2
50.0
71.3
74.2
22.6 3
1.9 38.8 46.7
48.5
69.1
70.8
Bulgaria CzechRepublic
Romania SlovakRepublic
Poland Hungary Croatia
2017 2018E 2019E
Public debt2 (% of GDP)
38.0
19.6
10.6 9.87.0 5.4 4.1
Poland Romania CzechRepublic
Hungary Bulgaria SlovakRepublic
Croatia
Population1 (mln)
5
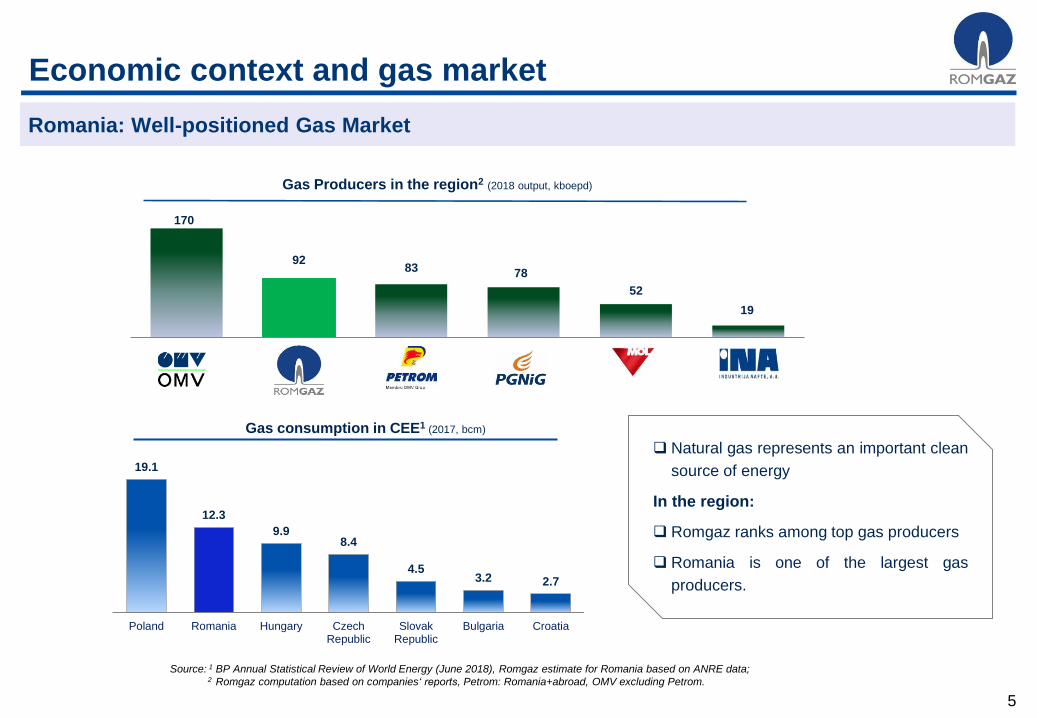
Economic context and gas market
Romania: Well-positioned Gas Market
Source: 1 BP Annual Statistical Review of World Energy (June 2018), Romgaz estimate for Romania based on ANRE data;2 Romgaz computation based on companies‘ reports, Petrom: Romania+abroad, OMV excluding Petrom.
19.1
12.3
9.98.4
4.53.2 2.7
Poland Romania Hungary CzechRepublic
SlovakRepublic
Bulgaria Croatia
Gas consumption in CEE1 (2017, bcm)
Natural gas represents an important clean
source of energy
In the region:
Romgaz ranks among top gas producers
Romania is one of the largest gas
producers.
Gas Producers in the region2 (2018 output, kboepd)
170
9283 78
52
19
6
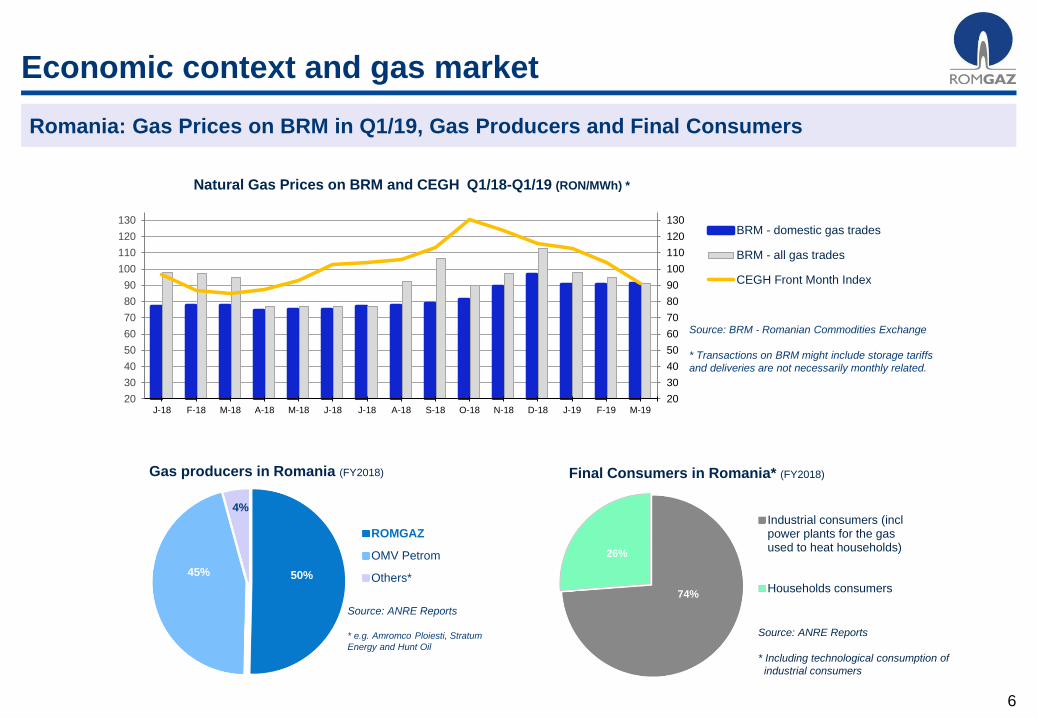
Economic context and gas market
Romania: Gas Prices on BRM in Q1/19, Gas Producers and Final Consumers
Source: ANRE Reports
* Including technological consumption of
industrial consumers
50%45%
4%
Gas producers in Romania (FY2018)
ROMGAZ
OMV Petrom
Others*
Source: ANRE Reports
* e.g. Amromco Ploiesti, Stratum
Energy and Hunt Oil
74%
26%
Final Consumers in Romania* (FY2018)
Industrial consumers (inclpower plants for the gasused to heat households)
Households consumers
20
30
40
50
60
70
80
90
100
110
120
130
20
30
40
50
60
70
80
90
100
110
120
130
J-18 F-18 M-18 A-18 M-18 J-18 J-18 A-18 S-18 O-18 N-18 D-18 J-19 F-19 M-19
Natural Gas Prices on BRM and CEGH Q1/18-Q1/19 (RON/MWh) *
BRM - domestic gas trades
BRM - all gas trades
CEGH Front Month Index
Source: BRM - Romanian Commodities Exchange
* Transactions on BRM might include storage tariffs
and deliveries are not necessarily monthly related.
7
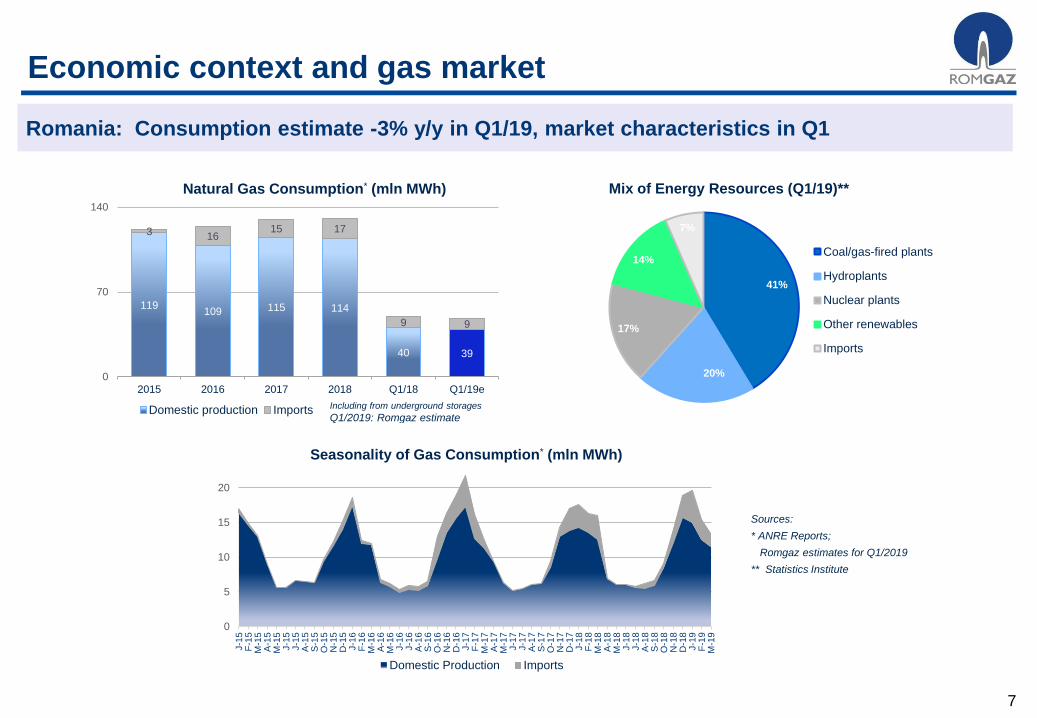
Economic context and gas market
Romania: Consumption estimate -3% y/y in Q1/19, market characteristics in Q1
Sources:
* ANRE Reports;
Romgaz estimates for Q1/2019
** Statistics Institute
0
5
10
15
20
J-1
5F
-15
M-1
5A
-15
M-1
5J-1
5J-1
5A
-15
S-1
5O
-15
N-1
5D
-15
J-1
6F
-16
M-1
6A
-16
M-1
6J-1
6J-1
6A
-16
S-1
6O
-16
N-1
6D
-16
J-1
7F
-17
M-1
7A
-17
M-1
7J-1
7J-1
7A
-17
S-1
7O
-17
N-1
7D
-17
J-1
8F
-18
M-1
8A
-18
M-1
8J-1
8J-1
8A
-18
S-1
8O
-18
N-1
8D
-18
J-1
9F
-19
M-1
9
Seasonality of Gas Consumption* (mln MWh)
Domestic Production Imports
119109 115 114
40 39
3 1615 17
9 9
0
70
140
2015 2016 2017 2018 Q1/18 Q1/19e
Natural Gas Consumption* (mln MWh)
Domestic production Imports Including from underground storages
Q1/2019: Romgaz estimate
41%
20%
17%
14%
7%
Mix of Energy Resources (Q1/19)**
Coal/gas-fired plants
Hydroplants
Nuclear plants
Other renewables
Imports
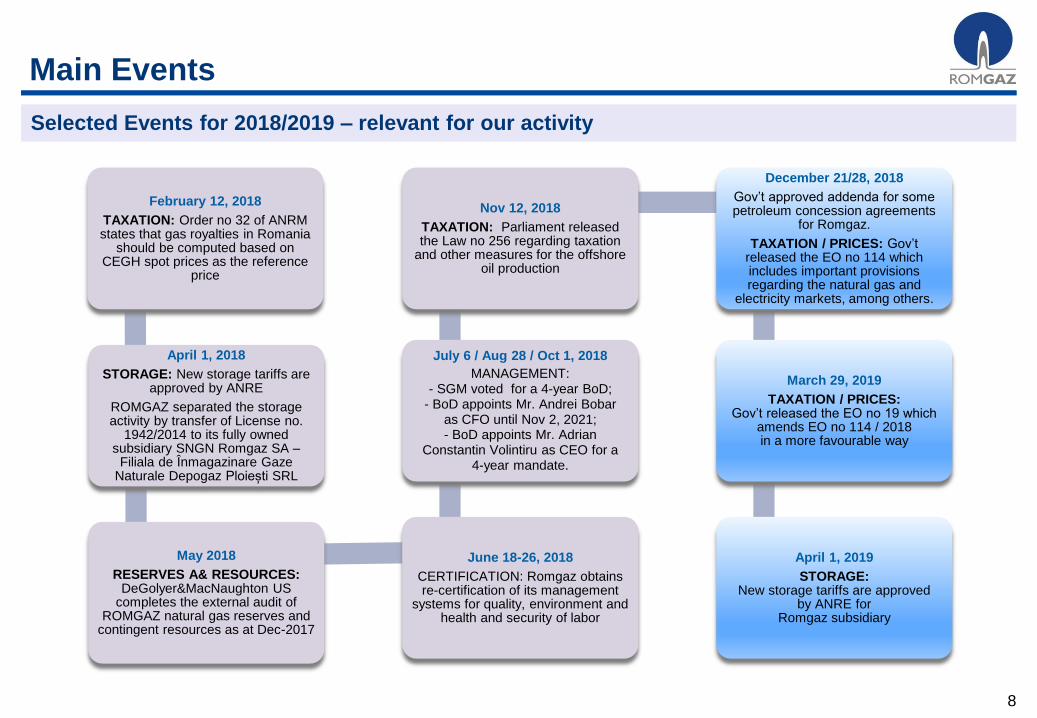
8
Selected Events for 2018/2019 – relevant for our activity
February 12, 2018
TAXATION: Order no 32 of ANRM states that gas royalties in Romania
should be computed based on CEGH spot prices as the reference
price
April 1, 2018
STORAGE: New storage tariffs are approved by ANRE
ROMGAZ separated the storage activity by transfer of License no.
1942/2014 to its fully ownedsubsidiary SNGN Romgaz SA –
Filiala de Înmagazinare Gaze Naturale Depogaz Ploiești SRL
May 2018
RESERVES A& RESOURCES: DeGolyer&MacNaughton US
completes the external audit of ROMGAZ natural gas reserves and
contingent resources as at Dec-2017
June 18-26, 2018
CERTIFICATION: Romgaz obtains re-certification of its management
systems for quality, environment and health and security of labor
July 6 / Aug 28 / Oct 1, 2018
MANAGEMENT: - SGM voted for a 4-year BoD;
- BoD appoints Mr. Andrei Bobaras CFO until Nov 2, 2021;- BoD appoints Mr. Adrian
Constantin Volintiru as CEO for a 4-year mandate.
Nov 12, 2018
TAXATION: Parliament released the Law no 256 regarding taxation
and other measures for the offshore oil production
December 21/28, 2018
Gov’t approved addenda for some petroleum concession agreements
for Romgaz.
TAXATION / PRICES: Gov’t released the EO no 114 which includes important provisions regarding the natural gas and
electricity markets, among others.
March 29, 2019
TAXATION / PRICES: Gov’t released the EO no 19 which
amends EO no 114 / 2018 in a more favourable way
April 1, 2019
STORAGE:New storage tariffs are approved
by ANRE for Romgaz subsidiary
Main Events
9
GEO no. 19 / March 2019 amended GEO no. 114 / Dec 2018 – overall, main provisions for the gas & electricity market include:
– Gas selling price capped for producers, for the gas sold to households and district
heating plants for households: RON 68/MWh;
– Regulated power prices for households;
– 2% fee on gas and power revenues or on profit from resales, with deductions;
Distribution of 35% of the equity reserves at end-2018, if distribution does not impact
capex plan and is available as cash
Gas royalties computation changed (2018)
Offshore Law promulgated (2018)
Romanian Legal and Regulatory Environment
Fiscal framework – main changes in Q1/19 and 2018

10
Gas production +4.8% y/y and +1.4% q/q due to the ongoing production enhancement
programme
Revenues +16% y/y, based on good performance of the gas segment
Market share of 36% in total domestic gas consumption (and 43% considering only
domestically-produced gas)
As expected, gas & UGS royalties +20% y/y and windfall profit tax +56% y/y
Net Profit of RON 542 million, +16% y/y
Profitability remains strong - EBITDA rate of 52.2%, NP rate of 31.6%
Development strategy approved by the Board - important investments are being
contemplated in order to improve the gas value chain and diversify the portfolio of investments
Recall the outcomes of the external audit of our gas reserves and resources (resources +55%,
avg RRR of 78% as of end-Dec 2017)
* Consolidated figures, Q1/18 restated
ROMGAZ Group: Highlights for Q1/2019*
Major developments in Q1
11
ROMGAZ: Company Overview
Major Producer and Supplier of Natural Gas in Romania
Gas Exploration, Production & Supply
• Around 155 commercial gas fields - significant onshore and
offshore exploration potential, important discoveries and
enhancements made lately
• Among top gas producers in Romania (output of 5.33 bcm
in 2018)
• Significant market share in the total gas supply in Romania.
Underground Gas Storage
• Working capacity: 2.82 bcm at end of March 2019, after
halting production in Cetatea de Balta UGS in Jan 2019
• Important investments to secure the gas supply
• Market share of 91% in Romania
• Regulated activity (revenue-cap methodology, RR on RAB).
Electricity Production
• New power plant in construction (430 MW)
• 400 MW old capacity still operational at end-Jan/2019
• Market share of 1.8%* in terms of production in full year 2018.
* ROMGAZ estimate based on data provided by CNTEE Transelectrica SA
Other activities
• Include wells workover and recompletions and special well
operations, and also - technological transport and
maintenance
• Support operations at Group level and third-party clients.
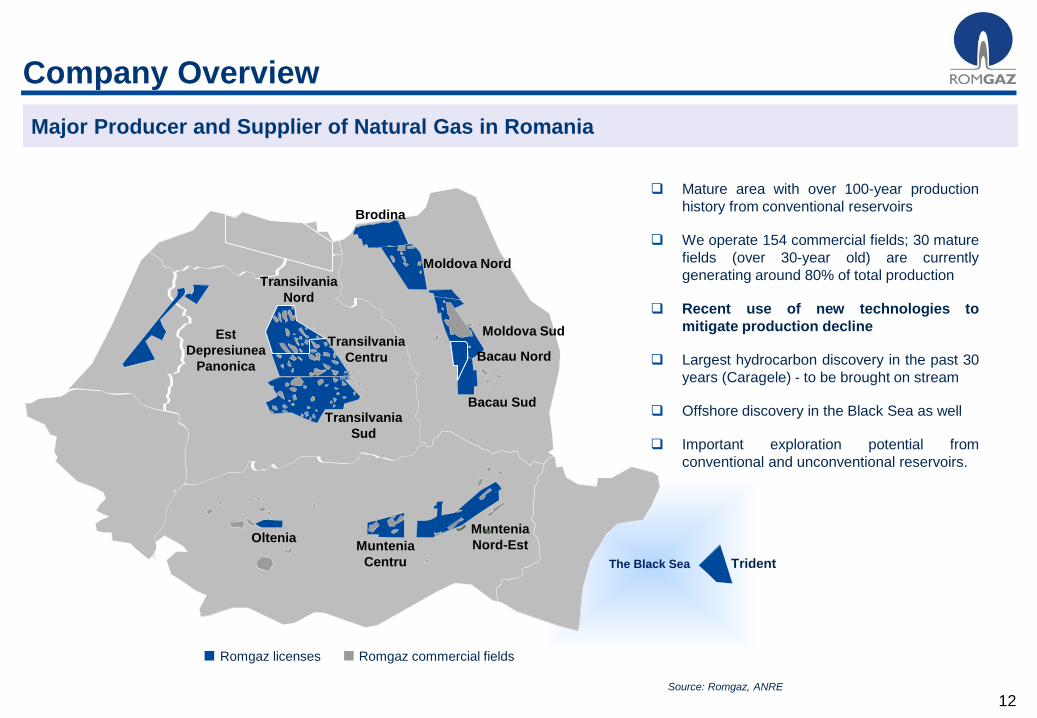
12
The Black Sea
Company Overview
Major Producer and Supplier of Natural Gas in Romania
Mature area with over 100-year production
history from conventional reservoirs
We operate 154 commercial fields; 30 mature
fields (over 30-year old) are currently
generating around 80% of total production
Recent use of new technologies to
mitigate production decline
Largest hydrocarbon discovery in the past 30
years (Caragele) - to be brought on stream
Offshore discovery in the Black Sea as well
Important exploration potential from
conventional and unconventional reservoirs.
Source: Romgaz, ANRE
Brodina
Moldova Nord
Moldova Sud
Bacau Nord
Bacau Sud
Transilvania
Nord
Transilvania
Centru
Transilvania
Sud
Est
Depresiunea
Panonica
Trident
Romgaz licenses
Muntenia
Nord-Est
Romgaz commercial fields
OlteniaMuntenia
Centru
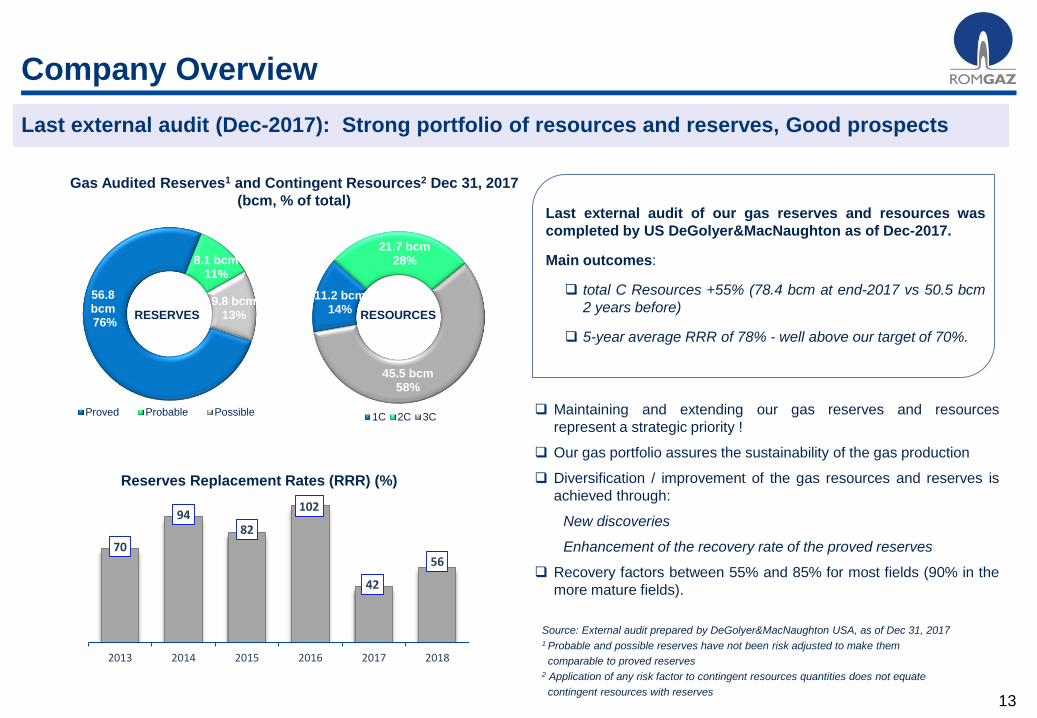
13
11.2 bcm14%
21.7 bcm28%
45.5 bcm58%
1C 2C 3C
RESOURCES
56.8 bcm76%
8.1 bcm11%
9.8 bcm13%
Proved Probable Possible
RESERVES
Company Overview
Last external audit (Dec-2017): Strong portfolio of resources and reserves, Good prospects
Source: External audit prepared by DeGolyer&MacNaughton USA, as of Dec 31, 20171 Probable and possible reserves have not been risk adjusted to make them
comparable to proved reserves2 Application of any risk factor to contingent resources quantities does not equate
contingent resources with reserves
Gas Audited Reserves1 and Contingent Resources2 Dec 31, 2017
(bcm, % of total)
Maintaining and extending our gas reserves and resources
represent a strategic priority !
Our gas portfolio assures the sustainability of the gas production
Diversification / improvement of the gas resources and reserves is
achieved through:
New discoveries
Enhancement of the recovery rate of the proved reserves
Recovery factors between 55% and 85% for most fields (90% in the
more mature fields).
Reserves Replacement Rates (RRR) (%)
70
9482
102
42
56
2013 2014 2015 2016 2017 2018
Last external audit of our gas reserves and resources was
completed by US DeGolyer&MacNaughton as of Dec-2017.
Main outcomes:
total C Resources +55% (78.4 bcm at end-2017 vs 50.5 bcm
2 years before)
5-year average RRR of 78% - well above our target of 70%.
14
Exploration Activities
First exploration programme agreed with the National Agency for Mineral
Resources: 1997-2002
Further extensions by 2/5 years afterwards
Our Exploration Programme in the 8 blocks was extended by
additional 5 years:
Investment period: Oct 2016 – Oct 2021
Total exploration area 16,296 km²
Total value of over USD 289 mln (c. RON 1,100 mln).
Efforts undertaken to unlock the resource potential and secure production
Romgaz: Oct/2016 – Oct/2021 Exploration Program
Seismic activities2D studies (km) 200
3D studies (km2) 1,000
Drilling
No. of wells 43
Drilling (meters) 113,000
Total investment value agreed (USD mln) 289
We have petroleum agreements for 9 onshore exploration
blocks (about 17,650 km² across the Transylvania,
Moldova, Oltenia and Muntenia basins), with 100%
working interests
Plus 1 petroleum agreement for offshore E&P in the Black
Sea (with Lukoil).
15
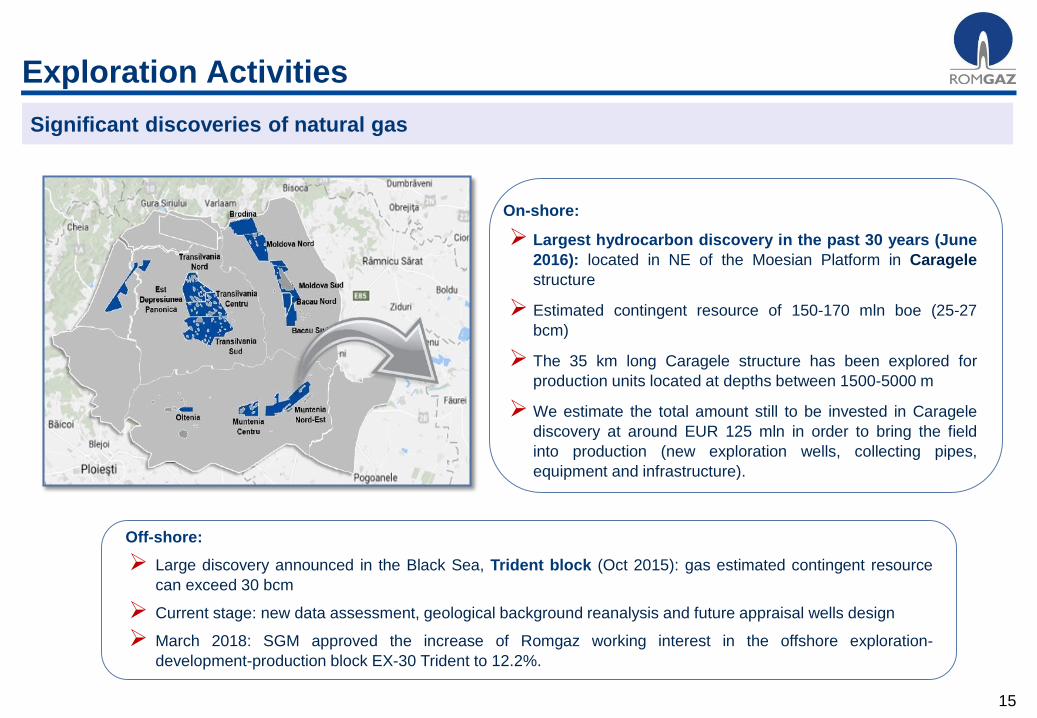
Exploration Activities
Significant discoveries of natural gas
Off-shore:
Large discovery announced in the Black Sea, Trident block (Oct 2015): gas estimated contingent resource
can exceed 30 bcm
Current stage: new data assessment, geological background reanalysis and future appraisal wells design
March 2018: SGM approved the increase of Romgaz working interest in the offshore exploration-
development-production block EX-30 Trident to 12.2%.
On-shore:
Largest hydrocarbon discovery in the past 30 years (June
2016): located in NE of the Moesian Platform in Caragele
structure
Estimated contingent resource of 150-170 mln boe (25-27
bcm)
The 35 km long Caragele structure has been explored for
production units located at depths between 1500-5000 m
We estimate the total amount still to be invested in Caragele
discovery at around EUR 125 mln in order to bring the field
into production (new exploration wells, collecting pipes,
equipment and infrastructure).
16
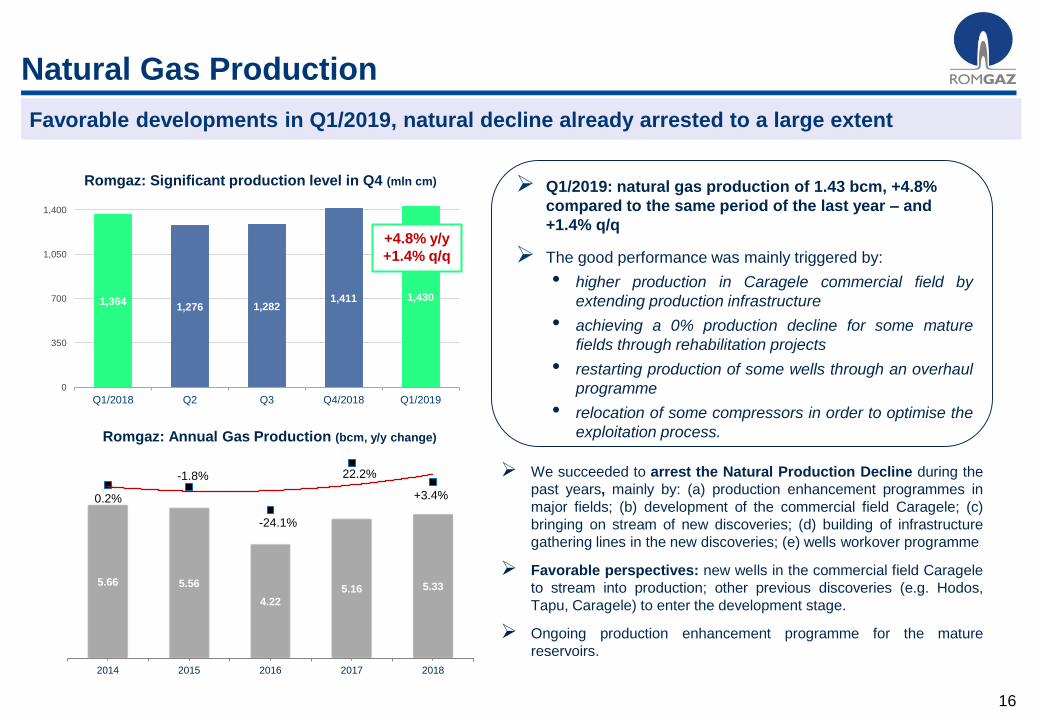
Natural Gas Production
Favorable developments in Q1/2019, natural decline already arrested to a large extent
Q1/2019: natural gas production of 1.43 bcm, +4.8%
compared to the same period of the last year – and
+1.4% q/q
The good performance was mainly triggered by:
• higher production in Caragele commercial field by
extending production infrastructure
• achieving a 0% production decline for some mature
fields through rehabilitation projects
• restarting production of some wells through an overhaul
programme
• relocation of some compressors in order to optimise the
exploitation process.
5.66 5.56
4.22
5.16 5.33
0.2%
-1.8%
-24.1%
22.2%
+3.4%
-170.0%
-150.0%
-130.0%
-110.0%
-90.0%
-70.0%
-50.0%
-30.0%
-10.0%
10.0%
30.0%
02014 2015 2016 2017 2018
Romgaz: Annual Gas Production (bcm, y/y change)
We succeeded to arrest the Natural Production Decline during the
past years, mainly by: (a) production enhancement programmes in
major fields; (b) development of the commercial field Caragele; (c)
bringing on stream of new discoveries; (d) building of infrastructure
gathering lines in the new discoveries; (e) wells workover programme
Favorable perspectives: new wells in the commercial field Caragele
to stream into production; other previous discoveries (e.g. Hodos,
Tapu, Caragele) to enter the development stage.
Ongoing production enhancement programme for the mature
reservoirs.
1,3641,276 1,282
1,411 1,430
0
350
700
1,050
1,400
Q1/2018 Q2 Q3 Q4/2018 Q1/2019
Romgaz: Significant production level in Q4 (mln cm)
+4.8% y/y
+1.4% q/q
17
Gas Supply & Sales
Q1/2019: Important market share in Romania’s consumption, strong client portfolio as well
Romgaz: Market share in domestic consumption (%, mln cm)
Romgaz: Portfolio of Clients (quantities of gas sold, FY2018)
58%
28%
14%
Romania's top gassuppliers
Producers of thermal /electrical energy
Other clients
Portfolio breakdown reflects specific quarterly characteristics of gas demand
4,467
5,6925,509
1,634 1,594
7
33 181
83 53
0%
20%
40%
60%
80%
2016 2017 2018 Q1/18 Q1/19
Imports
Production delivered (incl 100% Schlumberger, deliveries toIernut/Cojocna), technological consumption, resold gas
Market share in Romania’s gas supplies
Sources: Romgaz, ANRE
In Q1/2019, we achieved a market share of 36% of
total gas deliveries in Romania, and continue
efforts to enhance the sale strategy
Considering only domestically-produced gas, we
estimate a 43% market share in the domestic gas
consumption !
We enjoy a strong portfolio of clients
Our gas trading strategy aims to:
- secure a balanced client portfolio
- ensure price flexibility by trading on free markets
- fulfill the domestic market demand.
18
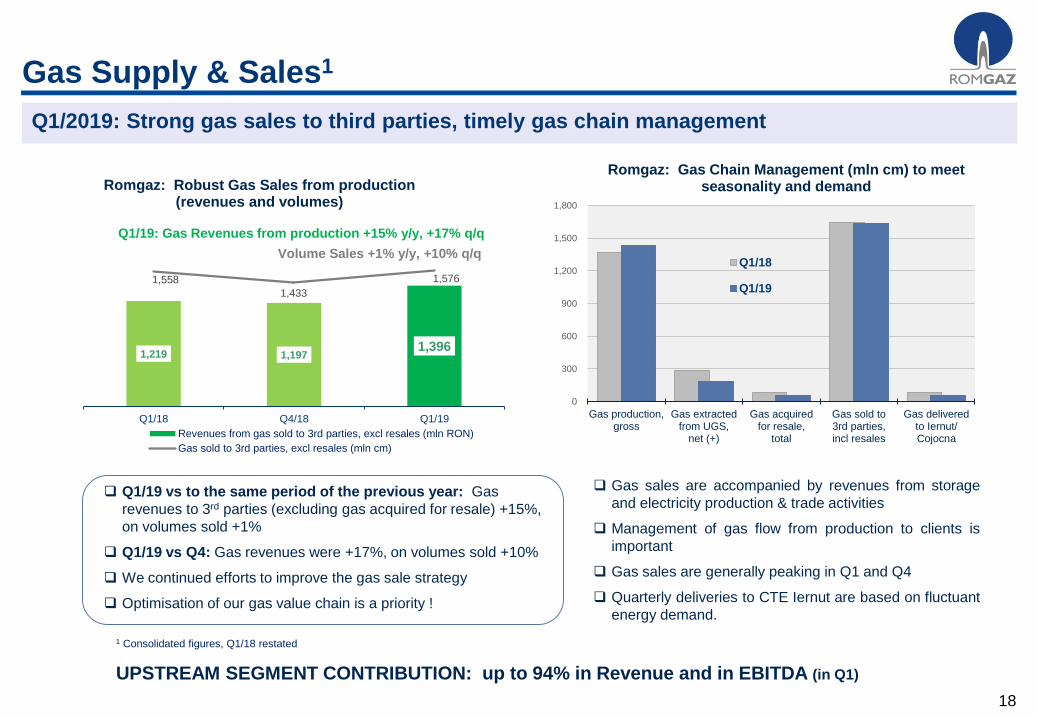
Gas Supply & Sales1
Q1/2019: Strong gas sales to third parties, timely gas chain management
Q1/19 vs to the same period of the previous year: Gas
revenues to 3rd parties (excluding gas acquired for resale) +15%,
on volumes sold +1%
Q1/19 vs Q4: Gas revenues were +17%, on volumes sold +10%
We continued efforts to improve the gas sale strategy
Optimisation of our gas value chain is a priority !
Gas sales are accompanied by revenues from storage
and electricity production & trade activities
Management of gas flow from production to clients is
important
Gas sales are generally peaking in Q1 and Q4
Quarterly deliveries to CTE Iernut are based on fluctuant
energy demand.
1,219 1,1971,396
1,558
1,433
1,576
Q1/18 Q4/18 Q1/19
Romgaz: Robust Gas Sales from production (revenues and volumes)
Revenues from gas sold to 3rd parties, excl resales (mln RON)
Gas sold to 3rd parties, excl resales (mln cm)
Q1/19: Gas Revenues from production +15% y/y, +17% q/q
Volume Sales +1% y/y, +10% q/q
0
300
600
900
1,200
1,500
1,800
Gas production,gross
Gas extractedfrom UGS,
net (+)
Gas acquiredfor resale,
total
Gas sold to3rd parties,incl resales
Gas deliveredto Iernut/Cojocna
Romgaz: Gas Chain Management (mln cm) to meet seasonality and demand
Q1/18
Q1/19
UPSTREAM SEGMENT CONTRIBUTION: up to 94% in Revenue and in EBITDA (in Q1)
1 Consolidated figures, Q1/18 restated
19
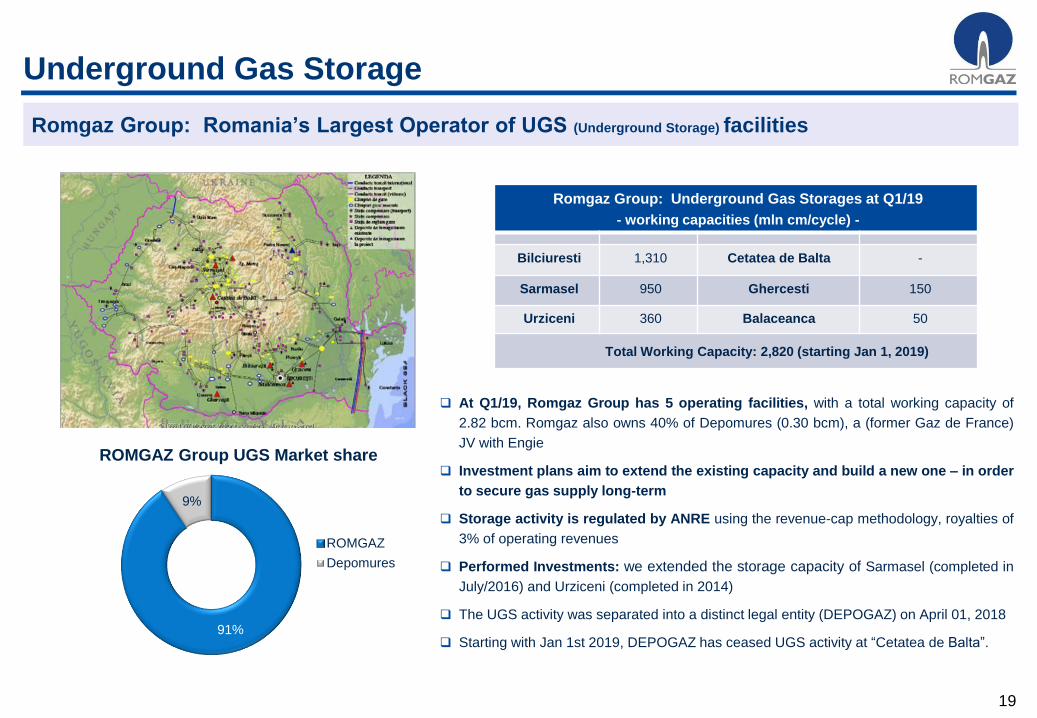
Underground Gas Storage
Romgaz Group: Romania’s Largest Operator of UGS (Underground Storage) facilities
At Q1/19, Romgaz Group has 5 operating facilities, with a total working capacity of
2.82 bcm. Romgaz also owns 40% of Depomures (0.30 bcm), a (former Gaz de France)
JV with Engie
Investment plans aim to extend the existing capacity and build a new one – in order
to secure gas supply long-term
Storage activity is regulated by ANRE using the revenue-cap methodology, royalties of
3% of operating revenues
Performed Investments: we extended the storage capacity of Sarmasel (completed in
July/2016) and Urziceni (completed in 2014)
The UGS activity was separated into a distinct legal entity (DEPOGAZ) on April 01, 2018
Starting with Jan 1st 2019, DEPOGAZ has ceased UGS activity at “Cetatea de Balta”.
Romgaz Group: Underground Gas Storages at Q1/19
- working capacities (mln cm/cycle) -
Bilciuresti 1,310 Cetatea de Balta -
Sarmasel 950 Ghercesti 150
Urziceni 360 Balaceanca 50
Total Working Capacity: 2,820 (starting Jan 1, 2019)
91%
9%
ROMGAZ Group UGS Market share
ROMGAZ
Depomures
20
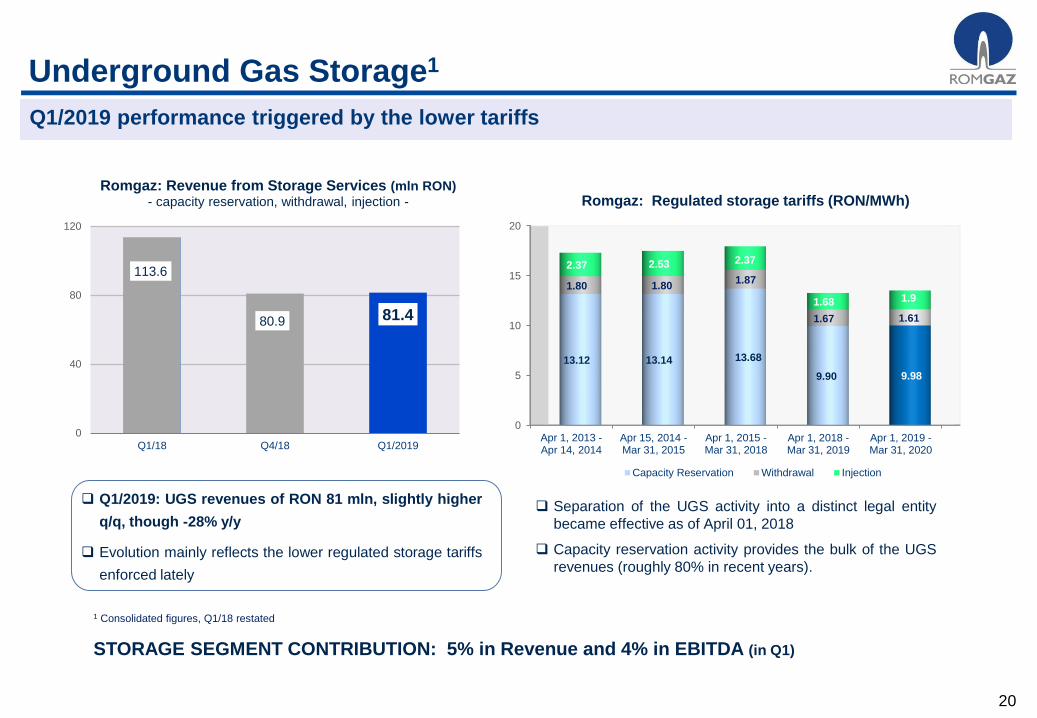
Underground Gas Storage1
Q1/2019 performance triggered by the lower tariffs
0
5
10
15
20
Apr 1, 2013 -Apr 14, 2014
Apr 15, 2014 -Mar 31, 2015
Apr 1, 2015 -Mar 31, 2018
Apr 1, 2018 -Mar 31, 2019
Apr 1, 2019 -Mar 31, 2020
13.12 13.14 13.68
9.90 9.98
1.80 1.801.87
1.67 1.61
2.37 2.53 2.37
1.68 1.9
Romgaz: Regulated storage tariffs (RON/MWh)
Capacity Reservation Withdrawal Injection
Q1/2019: UGS revenues of RON 81 mln, slightly higher
q/q, though -28% y/y
Evolution mainly reflects the lower regulated storage tariffs
enforced lately
113.6
80.9 81.4
0
40
80
120
Q1/18 Q4/18 Q1/2019
Romgaz: Revenue from Storage Services (mln RON)
- capacity reservation, withdrawal, injection -
1 Consolidated figures, Q1/18 restated
STORAGE SEGMENT CONTRIBUTION: 5% in Revenue and 4% in EBITDA (in Q1)
Separation of the UGS activity into a distinct legal entity
became effective as of April 01, 2018
Capacity reservation activity provides the bulk of the UGS
revenues (roughly 80% in recent years).
21
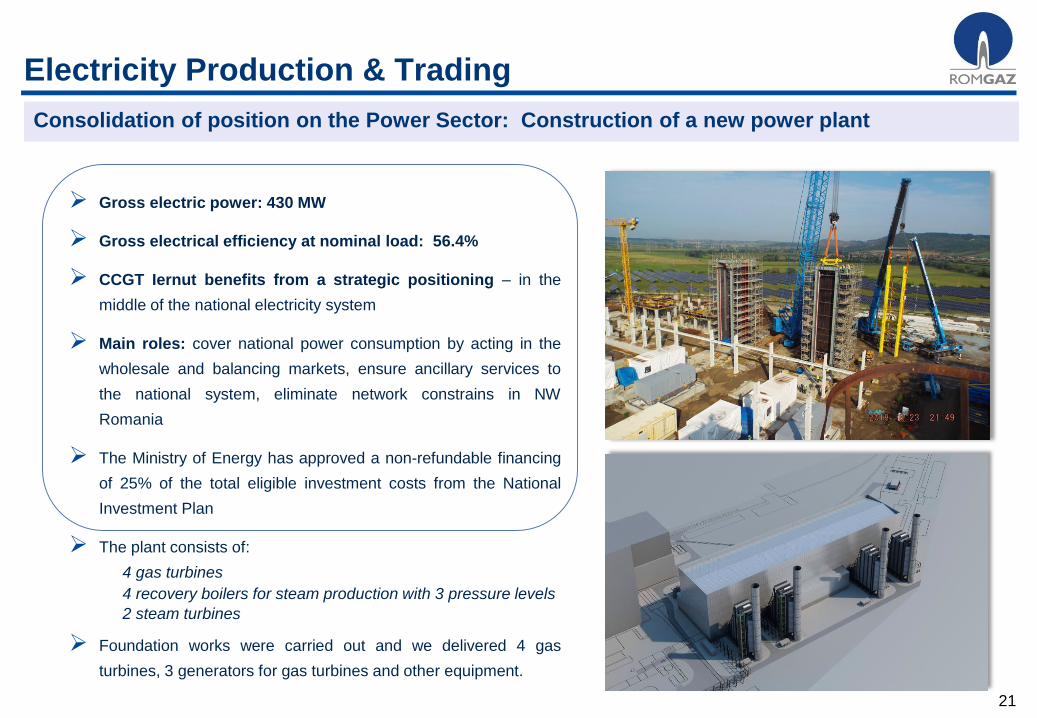
Electricity Production & Trading
Consolidation of position on the Power Sector: Construction of a new power plant
Gross electric power: 430 MW
Gross electrical efficiency at nominal load: 56.4%
CCGT Iernut benefits from a strategic positioning – in the
middle of the national electricity system
Main roles: cover national power consumption by acting in the
wholesale and balancing markets, ensure ancillary services to
the national system, eliminate network constrains in NW
Romania
The Ministry of Energy has approved a non-refundable financing
of 25% of the total eligible investment costs from the National
Investment Plan
The plant consists of:
4 gas turbines
4 recovery boilers for steam production with 3 pressure levels
2 steam turbines
Foundation works were carried out and we delivered 4 gas
turbines, 3 generators for gas turbines and other equipment.
22
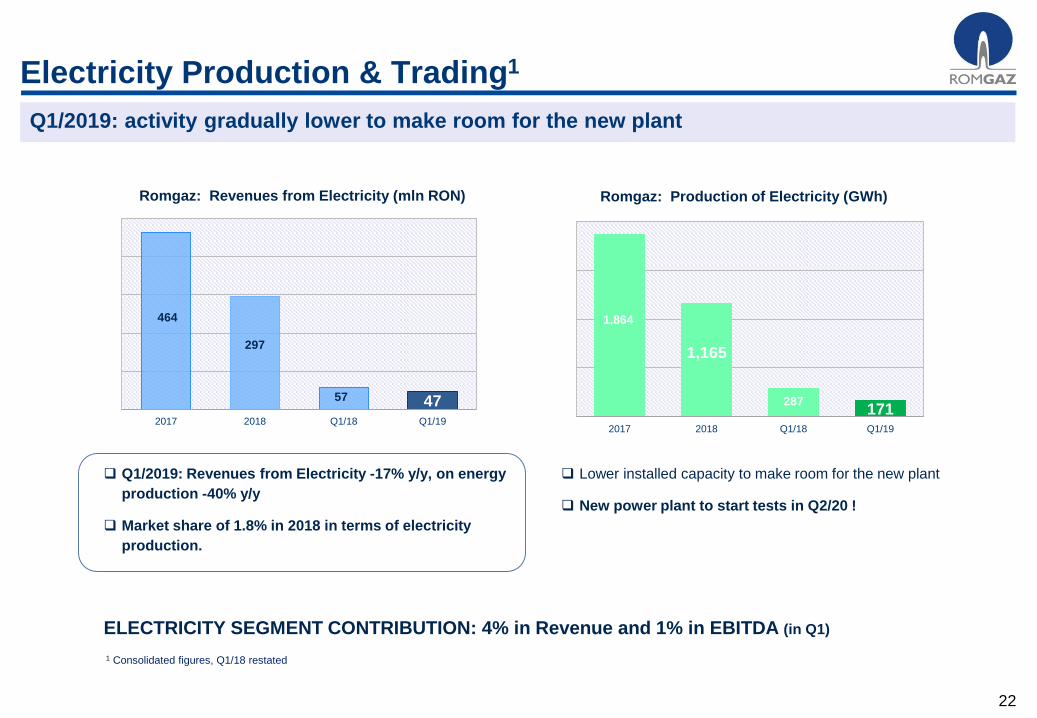
Electricity Production & Trading1
Q1/2019: activity gradually lower to make room for the new plant
464
297
57 472017 2018 Q1/18 Q1/19
Romgaz: Revenues from Electricity (mln RON)
Q1/2019: Revenues from Electricity -17% y/y, on energy
production -40% y/y
Market share of 1.8% in 2018 in terms of electricity
production.
ELECTRICITY SEGMENT CONTRIBUTION: 4% in Revenue and 1% in EBITDA (in Q1)
1,864
1,165
287171
2017 2018 Q1/18 Q1/19
Romgaz: Production of Electricity (GWh)
Lower installed capacity to make room for the new plant
New power plant to start tests in Q2/20 !
1 Consolidated figures, Q1/18 restated
23
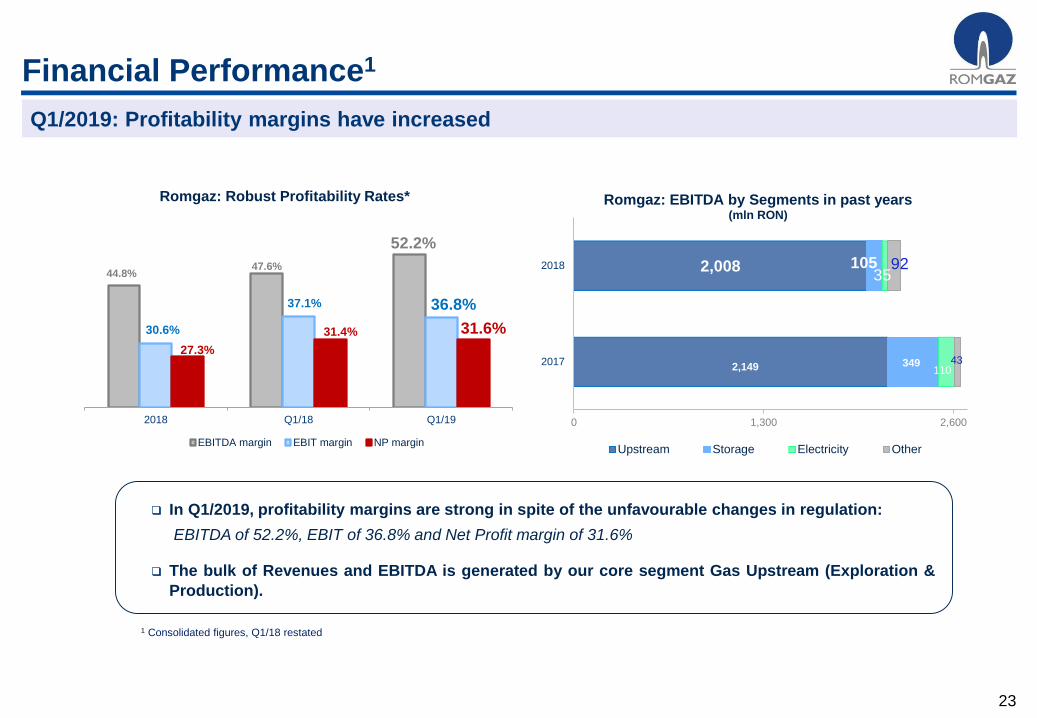
Financial Performance1
Q1/2019: Profitability margins have increased
2,149
2,008
349
105
110
35
43
92
0 1,300 2,600
2017
2018
Romgaz: EBITDA by Segments in past years (mln RON)
Upstream Storage Electricity Other
In Q1/2019, profitability margins are strong in spite of the unfavourable changes in regulation:
EBITDA of 52.2%, EBIT of 36.8% and Net Profit margin of 31.6%
The bulk of Revenues and EBITDA is generated by our core segment Gas Upstream (Exploration &
Production).
44.8%47.6%
52.2%
30.6%
37.1% 36.8%
27.3%
31.4% 31.6%
2018 Q1/18 Q1/19
Romgaz: Robust Profitability Rates*
EBITDA margin EBIT margin NP margin
1 Consolidated figures, Q1/18 restated
24
Financial Performance1
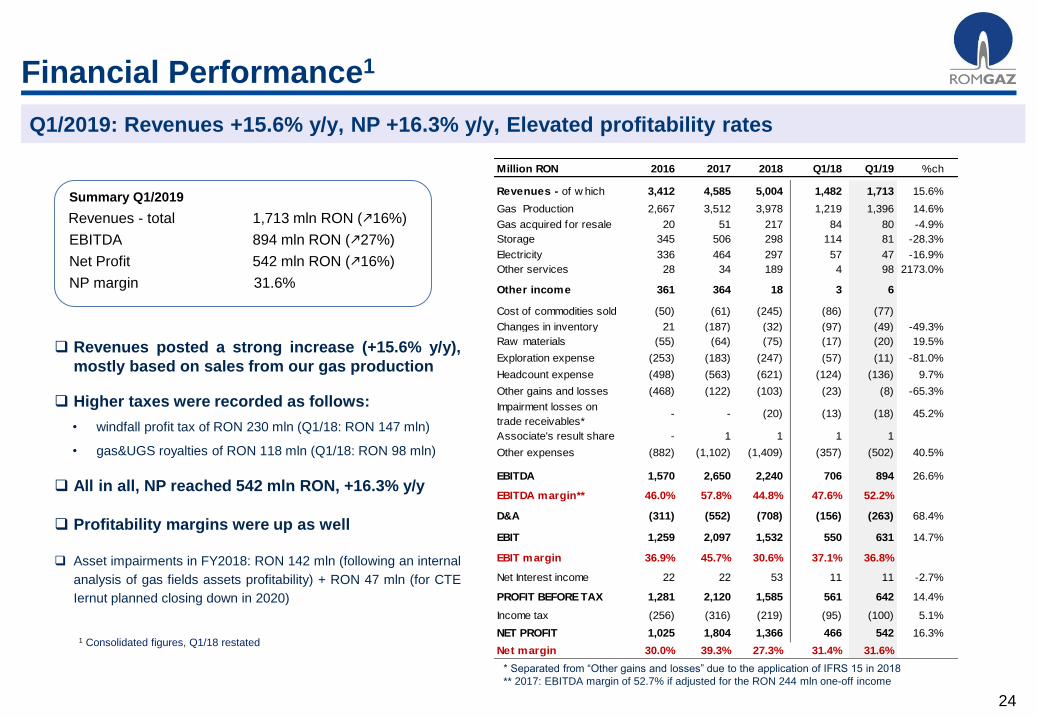
Q1/2019: Revenues +15.6% y/y, NP +16.3% y/y, Elevated profitability rates
Million RON 2016 2017 2018 Q1/18 Q1/19 %ch
Revenues - of w hich 3,412 4,585 5,004 1,482 1,713 15.6%
Gas Production 2,667 3,512 3,978 1,219 1,396 14.6%
Gas acquired for resale 20 51 217 84 80 -4.9%
Storage 345 506 298 114 81 -28.3%
Electricity 336 464 297 57 47 -16.9%
Other services 28 34 189 4 98 2173.0%
Other income 361 364 18 3 6
Cost of commodities sold (50) (61) (245) (86) (77)
Changes in inventory 21 (187) (32) (97) (49) -49.3%
Raw materials (55) (64) (75) (17) (20) 19.5%
Exploration expense (253) (183) (247) (57) (11) -81.0%
Headcount expense (498) (563) (621) (124) (136) 9.7%
Other gains and losses (468) (122) (103) (23) (8) -65.3%
Impairment losses on
trade receivables* - - (20) (13) (18) 45.2%
Associate's result share - 1 1 1 1
Other expenses (882) (1,102) (1,409) (357) (502) 40.5%
EBITDA 1,570 2,650 2,240 706 894 26.6%
EBITDA margin** 46.0% 57.8% 44.8% 47.6% 52.2%
D&A (311) (552) (708) (156) (263) 68.4%
EBIT 1,259 2,097 1,532 550 631 14.7%
EBIT margin 36.9% 45.7% 30.6% 37.1% 36.8%
Net Interest income 22 22 53 11 11 -2.7%
PROFIT BEFORE TAX 1,281 2,120 1,585 561 642 14.4%
Income tax (256) (316) (219) (95) (100) 5.1%
NET PROFIT 1,025 1,804 1,366 466 542 16.3%
Net margin 30.0% 39.3% 27.3% 31.4% 31.6%
Revenues posted a strong increase (+15.6% y/y),
mostly based on sales from our gas production
Higher taxes were recorded as follows:
• windfall profit tax of RON 230 mln (Q1/18: RON 147 mln)
• gas&UGS royalties of RON 118 mln (Q1/18: RON 98 mln)
All in all, NP reached 542 mln RON, +16.3% y/y
Profitability margins were up as well
Asset impairments in FY2018: RON 142 mln (following an internal
analysis of gas fields assets profitability) + RON 47 mln (for CTE
Iernut planned closing down in 2020)
* Separated from “Other gains and losses” due to the application of IFRS 15 in 2018
** 2017: EBITDA margin of 52.7% if adjusted for the RON 244 mln one-off income
1 Consolidated figures, Q1/18 restated
Summary Q1/2019
Revenues - total 1,713 mln RON (16%)
EBITDA 894 mln RON (27%)
Net Profit 542 mln RON (16%)
NP margin 31.6%
25
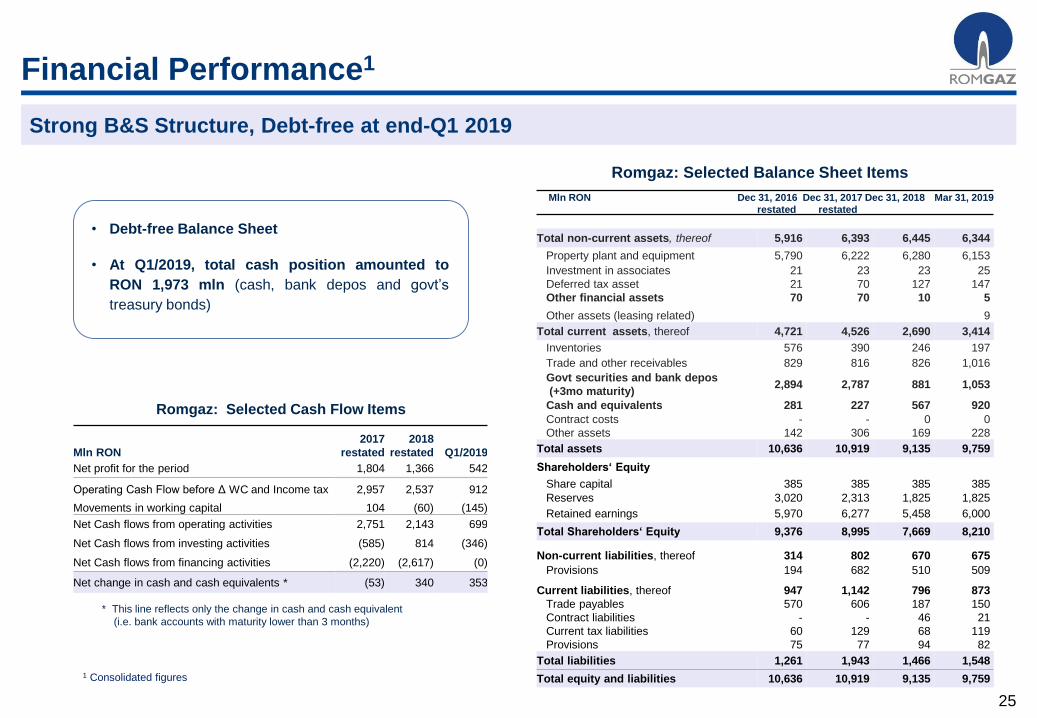
Financial Performance1
Strong B&S Structure, Debt-free at end-Q1 2019
Romgaz: Selected Balance Sheet Items
Mln RON Dec 31, 2016 Dec 31, 2017 Dec 31, 2018
restated restated
Mar 31, 2019
Total non-current assets, thereof 5,916 6,393 6,445 6,344
Property plant and equipment 5,790 6,222 6,280 6,153
Investment in associates 21 23 23 25
Deferred tax asset 21 70 127 147
Other financial assets 70 70 10 5
Other assets (leasing related) 9
Total current assets, thereof 4,721 4,526 2,690 3,414
Inventories 576 390 246 197
Trade and other receivables 829 816 826 1,016
Govt securities and bank depos
(+3mo maturity)2,894 2,787 881 1,053
Cash and equivalents 281 227 567 920
Contract costs - - 0 0
Other assets 142 306 169 228
Total assets 10,636 10,919 9,135 9,759
Shareholders‘ Equity
Share capital 385 385 385 385
Reserves 3,020 2,313 1,825 1,825
Retained earnings 5,970 6,277 5,458 6,000
Total Shareholders‘ Equity 9,376 8,995 7,669 8,210
Non-current liabilities, thereof 314 802 670 675
Provisions 194 682 510 509
Current liabilities, thereof 947 1,142 796 873
Trade payables 570 606 187 150
Contract liabilities - - 46 21
Current tax liabilities 60 129 68 119
Provisions 75 77 94 82
Total liabilities 1,261 1,943 1,466 1,548
Total equity and liabilities 10,636 10,919 9,135 9,759
Romgaz: Selected Cash Flow Items
Mln RON
2017
restated
2018
restated Q1/2019
Net profit for the period 1,804 1,366 542
Operating Cash Flow before Δ WC and Income tax 2,957 2,537 912
Movements in working capital 104 (60) (145)
Net Cash flows from operating activities 2,751 2,143 699
Net Cash flows from investing activities (585) 814 (346)
Net Cash flows from financing activities (2,220) (2,617) (0)
Net change in cash and cash equivalents * (53) 340 353
* This line reflects only the change in cash and cash equivalent
(i.e. bank accounts with maturity lower than 3 months)
• Debt-free Balance Sheet
• At Q1/2019, total cash position amounted to
RON 1,973 mln (cash, bank depos and govt’s
treasury bonds)
1 Consolidated figures
26
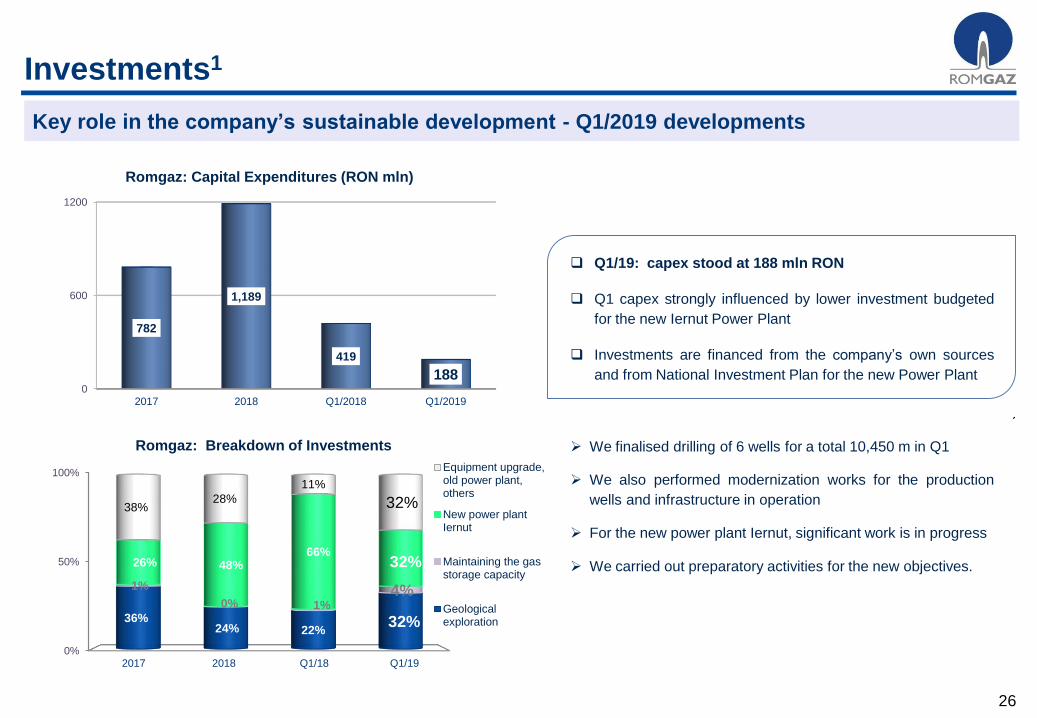
Investments1
Key role in the company’s sustainable development - Q1/2019 developments
0
600
1200
2017 2018 Q1/2018 Q1/2019
782
1,189
419
188
Romgaz: Capital Expenditures (RON mln)
2010
0%
50%
100%
2017 2018 Q1/18 Q1/19
36%24% 22%
32%
1%
0% 1%4%
26% 48%66%
32%
38%28%
11%
32%
Romgaz: Breakdown of Investments
Equipment upgrade,old power plant,others
New power plantIernut
Maintaining the gasstorage capacity
Geologicalexploration
Q1/19: capex stood at 188 mln RON
Q1 capex strongly influenced by lower investment budgeted
for the new Iernut Power Plant
Investments are financed from the company’s own sources
and from National Investment Plan for the new Power Plant
We finalised drilling of 6 wells for a total 10,450 m in Q1
We also performed modernization works for the production
wells and infrastructure in operation
For the new power plant Iernut, significant work is in progress
We carried out preparatory activities for the new objectives.
27
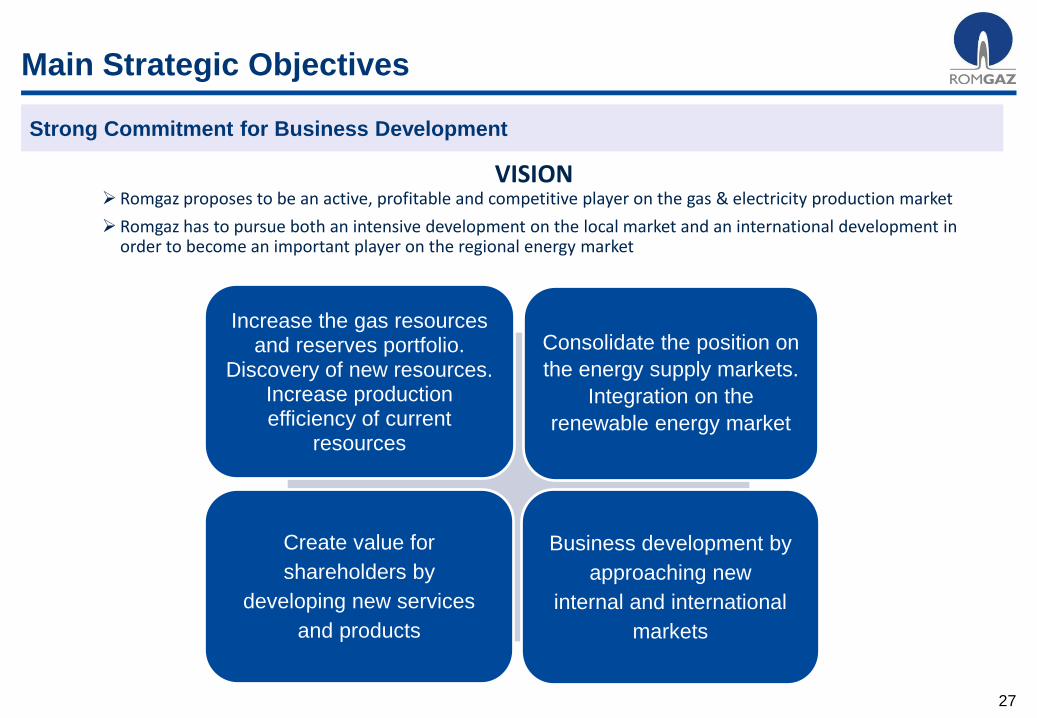
Main Strategic Objectives
Increase the gas resourcesand reserves portfolio.
Discovery of new resources. Increase production efficiency of current
resources
Consolidate the position on
the energy supply markets.
Integration on the
renewable energy market
Create value for
shareholders by
developing new services
and products
Business development by
approaching new
internal and international
markets
Strong Commitment for Business Development
VISION Romgaz proposes to be an active, profitable and competitive player on the gas & electricity production market
Romgaz has to pursue both an intensive development on the local market and an international development in order to become an important player on the regional energy market
28
Dividend distribution
Significant Dividends cashed-out to please investors
925
1,6731,214
547
251
31
748
717
362
-
700
1,400
2,100
2,800
2016 2017 2018
Additional dividends
Dividends from Retained Earnings
Dividends from Net Profit
Romgaz: History of Gross Dividend Distribution1 (RON mln)
Gross Dividends decided by the SGM on April 25, 2019: 4.18 RON / share in total (including the amount
decided according to GEO no 114/2018)
Ordinance no 114/2018 requires majority-state owned companies to distribute min 35% of some equity reserves
Majority state-owned companies are required to distribute at least 50% of the annual NP in the form of dividends
to shareholders
217%
146%
118%
2016
2017
2018
Romgaz: Gross Dividend Payout ratios*
* Payout ratios computed as:
Total Gross Divids (incl Additional Divids) / annual Net Profit of the Group
1 For the fiscal years 2016, 2017, 2018:
Dividends (including the Additional
Dividends) were paid in 2017, 2018 and
2019 respectively
29
Romgaz – Investment Case
Why to invest in Romgaz shares
Operational excellence / robust marginsEBITDA margin of 52.2% in Q1/2019
EBIT margin of 36.8%, Net Profit margin of 31.6% as well
High dividend payout ratios to please investors Gross Dividend payout ratio of 118% for 2018 (computed as Total Gross Dividends
per 2018 Net Profit of the group)
Strong cash reserves
Debt free B&S
We are able to finance by ourselves the investment program
Cash1 / Mktcap =12% (share price at June10, 2019)
Among top gas producers in Romania and one
of the largest in the region as well
Favorable market share in terms of gas production in Romania
Main operator of the Underground Gas Storages in Romania
Holder of large gas reserves among European countries
Strong base of gas reserves in RomaniaBased on our investment policy, we intend to maintain the reserves level
and the high RRR (avg of 78% during 2013-2017)
Expected opening of the export gas markets Export markets will enlarge our client portfolio, with positive outcome on
revenues
Important investment plans in Romania
Capex are generally focused on exploration - now we focus on building a
new power plant to strengthen position on the electricity market; also we
plan to diversify our investment portfolio in order to increase profitability
Prudent investment policy for projects abroad Minority participations aimed to minimize the operational risk and to avoid
the waste of our cash reserves
Strong management team, skilled workforce Management team has significant expertise in the sector, headcount is
strongly committed
1 considering all cash equivalents at March 31, 2019, consolidated figure

30
The Board: Balanced Team of Professionals
Adrian Constantin VolintiruCEO
Ramona UngurIndependent
Chairperson
Aristotel Marius
Jude
Remus
Grigorescu
Independent
Romeo Cristian
CiobanuIndependent
Petrus Antonius
Maria Jansen
Independent
Adrian Volintiru was appointed member of ROMGAZ
BoD for a 4-year mandate in July 2018. He previously
was interim board member of Romgaz BoD since 2017
and also board member of Romgaz in 2013.
Key positions include Secretary of State within the Ministry
of Economy (2013-2014) and top management positions in
companies like Vulcan, Marexin, Upetrom and Rompetrol.
Adrian Volintiru holds an MBA at Harvard BS.
Aristotel Jude was appointed member of
ROMGAZ BoD for a 4-year mandate in July
2018. His experience includes the positions of
Secretary of State for the Ministry of Energy
(2015-2017),Board member of Depomures SA
(during 2010-2014) and of Amgaz SA
(2009-2015). He had various management
positions in SNGN Romgaz SA.
He holds an MBA in Company Development.
Ramona Ungur was elected chairperson of
ROMGAZ BoD on May 14. She was previously
appointed member for a 4-year mandate in July 2018.
She is Board Member of Oil Terminal SA since 2017.
Her experience also includes top positions in Banca
Comerciala Romana (2010-2018) and Eximbank
Romania (2008-2009).
Remus Grigorescu was appointed
member of ROMGAZ BoD for a 4-
year mandate in July 2018 - from
previously interim member of
Romgaz BoD since 2017.
He is Associate Professor,
holding also other positions with
“Constantin Brâncoveanu”
University of Pitesti (since 2000).
He holds a PhD in Economy.
Romeo Ciobanu was appointed member of
ROMGAZ BoD for a 4-year mandate in
July 2018 – and was interim member
of Romgaz BoD since 2017. Romeo
Ciobanu is Director of Politech (since 2016)
and Professor at Technical University of Iasi
(since 2000). He holds a PhD in Electronic
Technology and Reliability, a PhD in
Chemistry and Chemical Technology, and an
MBA at Technical University of Iasi.
Petrus Jansen was appointed member of
ROMGAZ BoD for a 4-year mandate
in July 2018. He held this position
previously between 2015-2017.
Petrus Jansen holds an MBA at NIMBAS,
Utrecht, University of Bradford UK.
Liviu Nistoran was Chairman of ROMGAZ
BoD during July 2018 - May 2019, and was previously
interim Chairman of Romgaz BoD since 2017.
He is General Manager of Televoice Grup SRL (since 2009),
was member of the Supervisory Board of Hidroelectrica SA
(2017-2019) and also Deputy of the Parliament
of Romania (2004-2008).
Dorin Liviu NistoranIndependent
31
Shareholding structure: the Romanian State (Ministry of Energy) majority shareholder –
70%, Free Float - 30% (shares traded on the BVB and GDRs traded on the LSE)
Romgaz ranks the 2nd largest domestic stock traded on the BVB – mktcap of EUR 2.7 bn *)
The 3rd most traded stock on the BVB *)
Included in BVB’s main indices (weighing 29% în energy and utilities BET-NG index, and
between 10%-12% in BET, BET-XT, BET-TR, ROTX)
Included in main global indices with allocation on Romania (such as FTSE, MSCI, S&P,
STOXX, Russell Frontier).
Total no of shares: 385.42m
0.0
30.0
N-1
3D
-13
F-1
4M
-14
M-1
4J-1
4A
-14
S-1
4N
-14
D-1
4F
-15
M-1
5M
-15
J-1
5A
-15
S-1
5N
-15
D-1
5J-1
6M
-16
A-1
6J-1
6J-1
6S
-16
O-1
6D
-16
J-1
7M
-17
A-1
7J-1
7J-1
7S
-17
O-1
7D
-17
J-1
8M
-18
A-1
8J-1
8J-1
8S
-18
O-1
8D
-18
J-1
9M
-19
A-1
9
SNG: Share price on the BVB since listing (RON)
BET NG rebased
RON
*) Based on the trading price on May 13, 2019, and on BVB’s past 6m/12m trading statistics
0
10
20
N/1
3D
/13
F/1
4M
/14
M/1
4J/1
4A
/14
S/1
4N
/14
D/1
4F
/15
M/1
5M
/15
J/1
5A
/15
S/1
5N
/15
D/1
5J/1
6M
/16
A/1
6J/1
6J/1
6S
/16
O/1
6D
/16
J/1
7M
/17
A/1
7J/1
7J/1
7S
/17
O/1
7D
/17
J/1
8M
/18
A/1
8J/1
8J/1
8S
/18
O/1
8D
/18
J/1
9M
/19
A/1
9
SNGR: GDR price on the LSE since listing (USD)
Gas spot price on CEGH (EUR/MWh) rebased
USD
Other shareholders
30%
Romanian State70%
12M - Share Price Performance on the BVB
Period Min (RON) Max (RON)
Q2/18 34.35 38.00
Q3/18 30.20 36.85
Q4/18 27.80 36.30
Q1/19 27.35 32.70
12M Total Traded Value (Q1/18 – Q1/19):
900 million RON or 0.7 million EUR/day
Shareholding Structure and Stock Performance
Among blue-chips on the domestic capital market Romgaz
32
ROMGAZ
Investor Relations
E-mail: [email protected]
IR: Manuela Ogrinja, CFA
Alexandra Posea
Mihnea Dinescu
Capital Market: Adina Stefanescu
Cristina Hulpus
Călin-Dumitru Banea
Anca Deac
Homepage: www.romgaz.ro
Financial Calendar 2019
May 15: Release of the Q1 2019 Financial Results
Confcall with financial analysts & investors
Aug 14: Release of the H1/Q2 2019 Financial Results
Confcall with financial analysts & investors
Press Conference
Nov 14: Release of the 9M/Q3 2019 Financial Results
Confcall with financial analysts & investors