Embed Size (px)
Citation preview

ROMANIAN RESIDENTIALMARKET REPORT
Spring - 2017

CONTENTS
5
6
7
9
11
21
22
23
25
28
29
30
31
Foreword
Market overview
Residential price index to date
Price trends across main cities
Price trends across neighborhoods
Cluj-Napoca | Bucharest | Timisoara
Number of listings - for sale
Number of listings - for rent
Construction of new dwellings
New residential projects
Demand for residential properties for sale
Time on market in Bucharest
Negotiation margin
About us

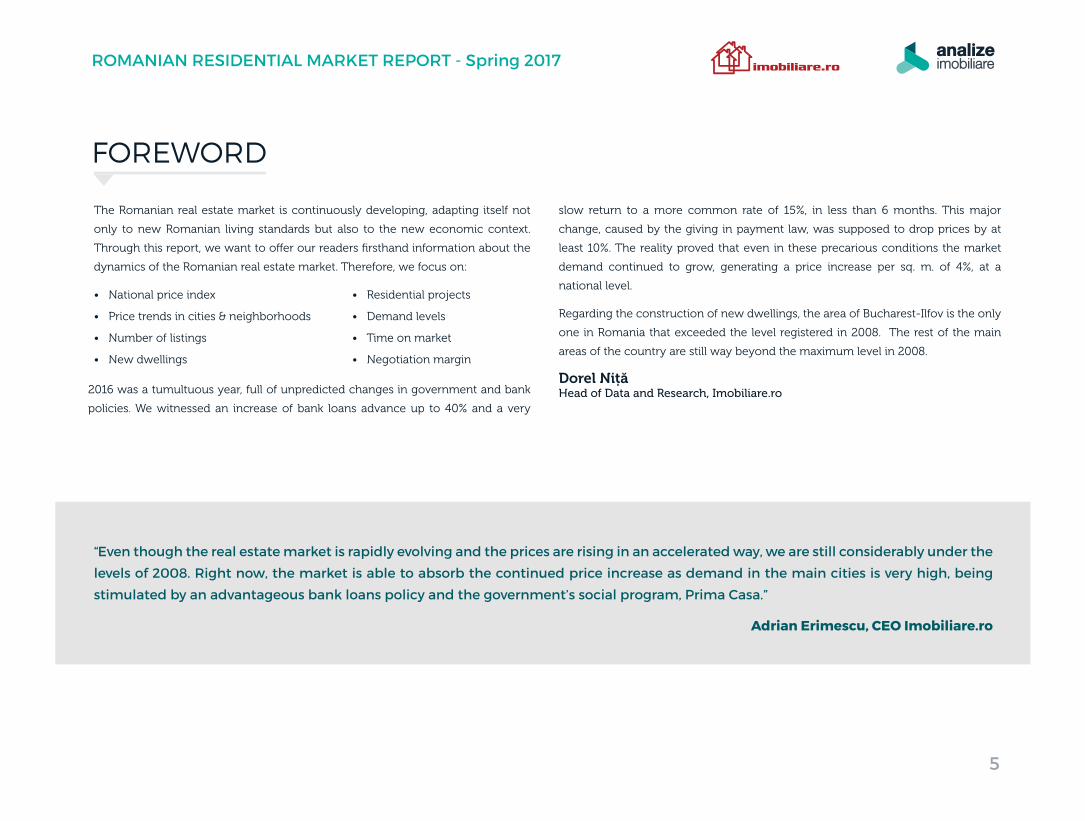
The Romanian real estate market is continuously developing, adapting itself not
only to new Romanian living standards but also to the new economic context.
Through this report, we want to o�er our readers firsthand information about the
dynamics of the Romanian real estate market. Therefore, we focus on:
“Even though the real estate market is rapidly evolving and the prices are rising in an accelerated way, we are still considerably under the
levels of 2008. Right now, the market is able to absorb the continued price increase as demand in the main cities is very high, being
stimulated by an advantageous bank loans policy and the government’s social program, Prima Casa.”
Adrian Erimescu, CEO Imobiliare.ro
2016 was a tumultuous year, full of unpredicted changes in government and bank
policies. We witnessed an increase of bank loans advance up to 40% and a very
slow return to a more common rate of 15%, in less than 6 months. This major
change, caused by the giving in payment law, was supposed to drop prices by at
least 10%. The reality proved that even in these precarious conditions the market
demand continued to grow, generating a price increase per sq. m. of 4%, at a
national level.
Regarding the construction of new dwellings, the area of Bucharest-Ilfov is the only
one in Romania that exceeded the level registered in 2008. The rest of the main
areas of the country are still way beyond the maximum level in 2008.
Dorel NițăHead of Data and Research, Imobiliare.ro
FOREWORD
• National price index
• Price trends in cities & neighborhoods
• Number of listings
• New dwellings
• Residential projects
• Demand levels
• Time on market
• Negotiation margin
5
ROMANIAN RESIDENTIAL MARKET REPORT - Spring 2017
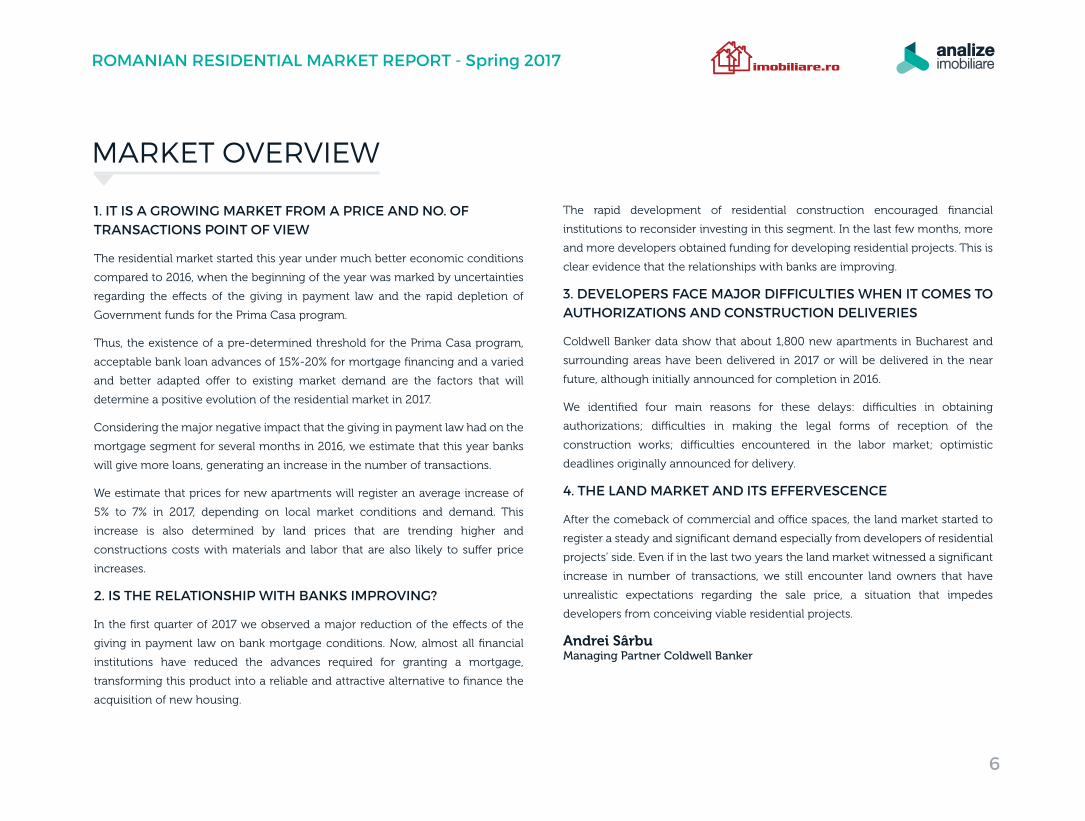
1. IT IS A GROWING MARKET FROM A PRICE AND NO. OF TRANSACTIONS POINT OF VIEW
The residential market started this year under much better economic conditions
compared to 2016, when the beginning of the year was marked by uncertainties
regarding the e�ects of the giving in payment law and the rapid depletion of
Government funds for the Prima Casa program.
Thus, the existence of a pre-determined threshold for the Prima Casa program,
acceptable bank loan advances of 15%-20% for mortgage financing and a varied
and better adapted o�er to existing market demand are the factors that will
determine a positive evolution of the residential market in 2017.
Considering the major negative impact that the giving in payment law had on the
mortgage segment for several months in 2016, we estimate that this year banks
will give more loans, generating an increase in the number of transactions.
We estimate that prices for new apartments will register an average increase of
5% to 7% in 2017, depending on local market conditions and demand. This
increase is also determined by land prices that are trending higher and
constructions costs with materials and labor that are also likely to su�er price
increases.
2. IS THE RELATIONSHIP WITH BANKS IMPROVING?
In the first quarter of 2017 we observed a major reduction of the e�ects of the
giving in payment law on bank mortgage conditions. Now, almost all financial
institutions have reduced the advances required for granting a mortgage,
transforming this product into a reliable and attractive alternative to finance the
acquisition of new housing.
The rapid development of residential construction encouraged financial
institutions to reconsider investing in this segment. In the last few months, more
and more developers obtained funding for developing residential projects. This is
clear evidence that the relationships with banks are improving.
3. DEVELOPERS FACE MAJOR DIFFICULTIES WHEN IT COMES TO AUTHORIZATIONS AND CONSTRUCTION DELIVERIES
Coldwell Banker data show that about 1,800 new apartments in Bucharest and
surrounding areas have been delivered in 2017 or will be delivered in the near
future, although initially announced for completion in 2016.
We identified four main reasons for these delays: di�culties in obtaining
authorizations; di�culties in making the legal forms of reception of the
construction works; di�culties encountered in the labor market; optimistic
deadlines originally announced for delivery.
4. THE LAND MARKET AND ITS EFFERVESCENCE
After the comeback of commercial and o�ce spaces, the land market started to
register a steady and significant demand especially from developers of residential
projects’ side. Even if in the last two years the land market witnessed a significant
increase in number of transactions, we still encounter land owners that have
unrealistic expectations regarding the sale price, a situation that impedes
developers from conceiving viable residential projects.
Andrei Sârbu Managing Partner Coldwell Banker
MARKET OVERVIEW
6
ROMANIAN RESIDENTIAL MARKET REPORT - Spring 2017
RESIDENTIAL PRICE INDEX TO DATE
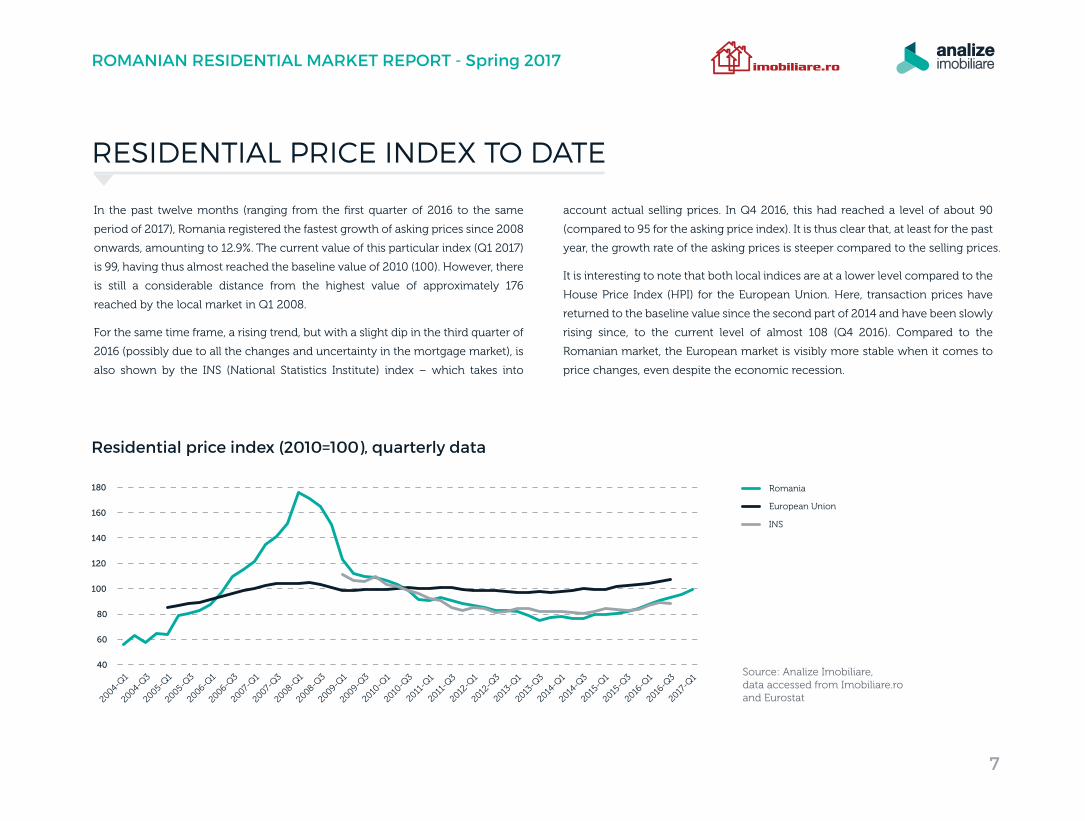
In the past twelve months (ranging from the first quarter of 2016 to the same
period of 2017), Romania registered the fastest growth of asking prices since 2008
onwards, amounting to 12.9%. The current value of this particular index (Q1 2017)
is 99, having thus almost reached the baseline value of 2010 (100). However, there
is still a considerable distance from the highest value of approximately 176
reached by the local market in Q1 2008.
For the same time frame, a rising trend, but with a slight dip in the third quarter of
2016 (possibly due to all the changes and uncertainty in the mortgage market), is
also shown by the INS (National Statistics Institute) index – which takes into
account actual selling prices. In Q4 2016, this had reached a level of about 90
(compared to 95 for the asking price index). It is thus clear that, at least for the past
year, the growth rate of the asking prices is steeper compared to the selling prices.
It is interesting to note that both local indices are at a lower level compared to the
House Price Index (HPI) for the European Union. Here, transaction prices have
returned to the baseline value since the second part of 2014 and have been slowly
rising since, to the current level of almost 108 (Q4 2016). Compared to the
Romanian market, the European market is visibly more stable when it comes to
price changes, even despite the economic recession.
Residential price index (2010=100), quarterly data
Source: Analize Imobiliare, data accessed from Imobiliare.roand Eurostat
40
60
80
100
120
140
160
180 Romania
European Union
INS
2004-
Q1
2004-
Q3
2005-
Q1
2005-
Q3
2006-
Q1
2006-
Q3
2007-
Q1
2007-
Q3
2008-
Q1
2008-
Q3
2009-
Q1
2009-
Q3
2010
-Q1
2010
-Q3
2011
-Q1
2011
-Q3
2012
-Q1
2012
-Q3
2013
-Q1
2013
-Q3
2014
-Q1
2014
-Q3
2015
-Q1
2015
-Q3
2016
-Q1
2017
-Q1
2016
-Q3
7
ROMANIAN RESIDENTIAL MARKET REPORT - Spring 2017
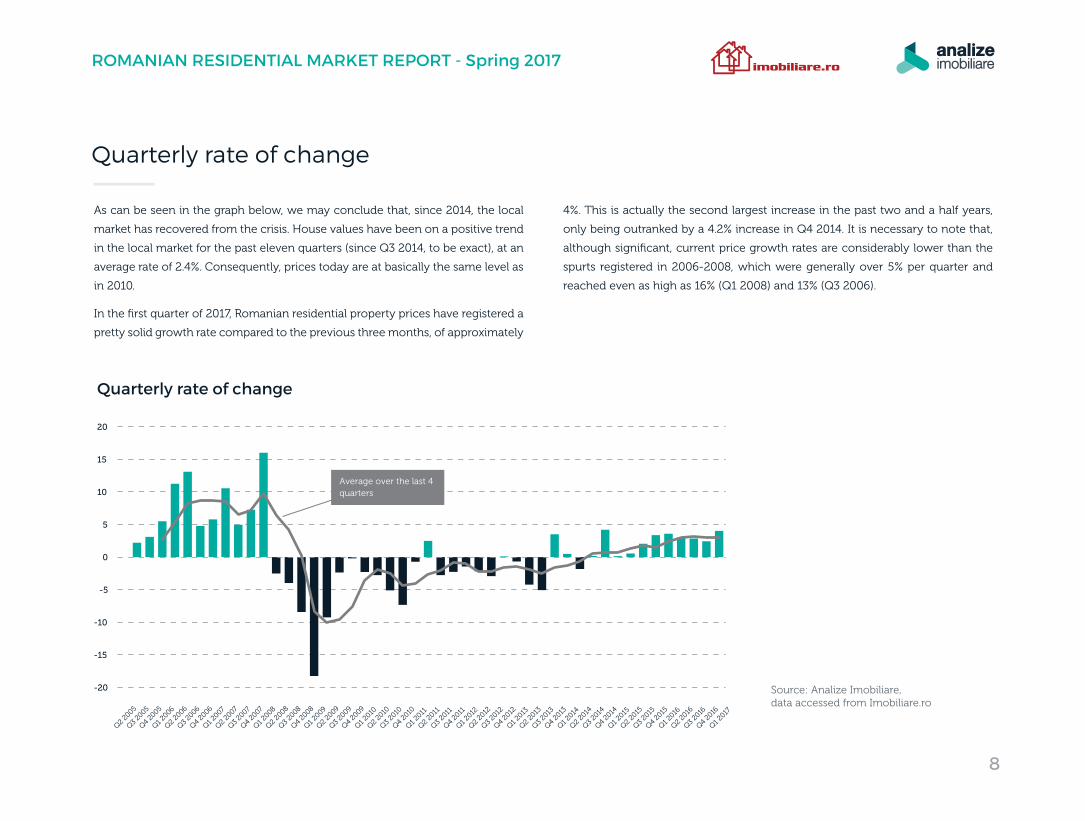
As can be seen in the graph below, we may conclude that, since 2014, the local
market has recovered from the crisis. House values have been on a positive trend
in the local market for the past eleven quarters (since Q3 2014, to be exact), at an
average rate of 2.4%. Consequently, prices today are at basically the same level as
in 2010.
In the first quarter of 2017, Romanian residential property prices have registered a
pretty solid growth rate compared to the previous three months, of approximately
4%. This is actually the second largest increase in the past two and a half years,
only being outranked by a 4.2% increase in Q4 2014. It is necessary to note that,
although significant, current price growth rates are considerably lower than the
spurts registered in 2006-2008, which were generally over 5% per quarter and
reached even as high as 16% (Q1 2008) and 13% (Q3 2006).
Quarterly rate of change
Quarterly rate of change
Source: Analize Imobiliare, data accessed from Imobiliare.ro
-20
-15
-10
-5
0
5
10
15
20
Q2 20
05
Q3 20
05
Q4 20
05
Q1 2006
Q2 20
06
Q3 20
06
Q4 20
06
Q1 2007
Q2 20
07
Q3 20
07
Q4 20
07
Q1 2008
Q2 20
08
Q3 20
08
Q4 20
08
Q1 2009
Q2 20
09
Q3 20
09
Q4 20
09
Q1 2010
Q2 20
10
Q3 20
10
Q4 20
10
Q1 2011
Q2 20
11
Q3 20
11
Q4 20
11
Q1 2012
Q2 20
12
Q3 20
12
Q4 20
12
Q1 2013
Q2 20
13
Q3 20
13
Q4 20
13
Q1 2014
Q2 20
14
Q3 20
14
Q4 20
14
Q1 2015
Q2 20
15
Q3 20
15
Q4 20
15
Q1 2016
Q2 20
16
Q3 20
16
Q4 20
16
Q1 2017
Average over the last 4 quarters
8
ROMANIAN RESIDENTIAL MARKET REPORT - Spring 2017
1,260
Cluj-Napoca
1,200
Bucharest
1,040
Timisoara
980
Constanta
930
Brasov
900
Iasi
+2.9% +3.4% +2% +2.7% +1.8% +2.6%
+9.9% +13% +6.1% +6.7% +4.9% +5%
Median price per sq.m. (€)
% price change over last 3 months
% price change over last 12 months
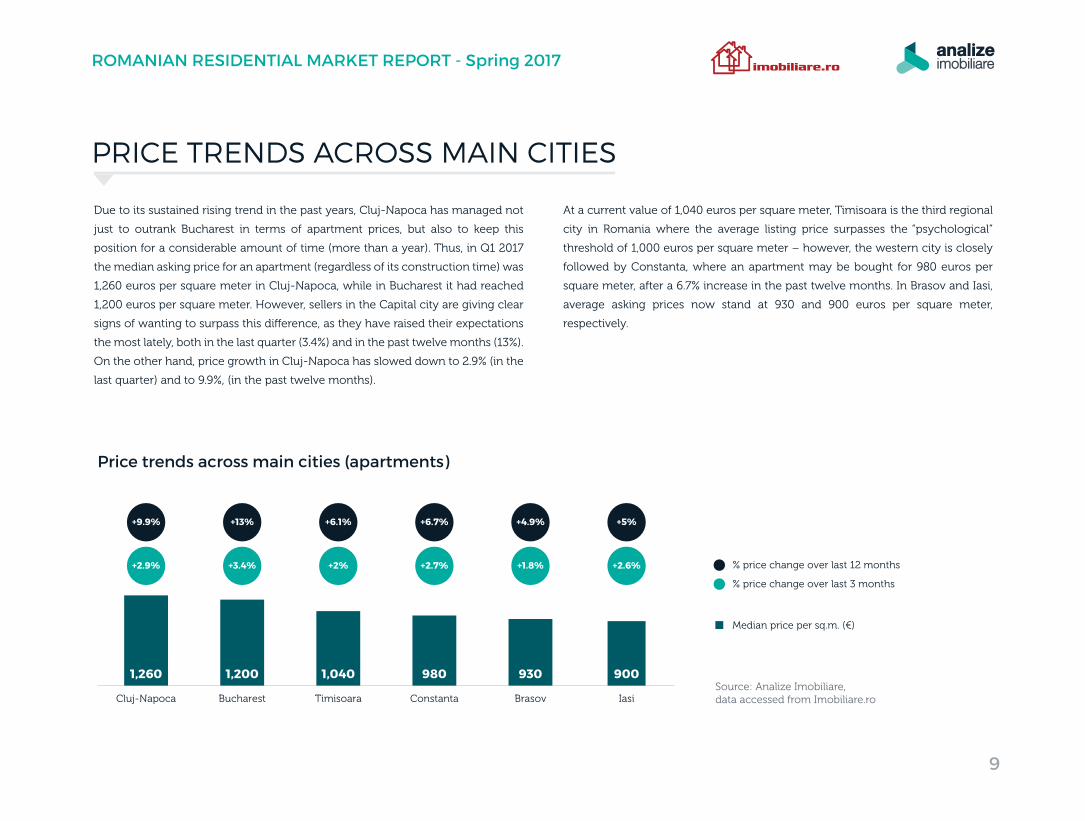
Price trends across main cities (apartments)
Source: Analize Imobiliare, data accessed from Imobiliare.ro
Due to its sustained rising trend in the past years, Cluj-Napoca has managed not
just to outrank Bucharest in terms of apartment prices, but also to keep this
position for a considerable amount of time (more than a year). Thus, in Q1 2017
the median asking price for an apartment (regardless of its construction time) was
1,260 euros per square meter in Cluj-Napoca, while in Bucharest it had reached
1,200 euros per square meter. However, sellers in the Capital city are giving clear
signs of wanting to surpass this di�erence, as they have raised their expectations
the most lately, both in the last quarter (3.4%) and in the past twelve months (13%).
On the other hand, price growth in Cluj-Napoca has slowed down to 2.9% (in the
last quarter) and to 9.9%, (in the past twelve months).
At a current value of 1,040 euros per square meter, Timisoara is the third regional
city in Romania where the average listing price surpasses the “psychological”
threshold of 1,000 euros per square meter – however, the western city is closely
followed by Constanta, where an apartment may be bought for 980 euros per
square meter, after a 6.7% increase in the past twelve months. In Brasov and Iasi,
average asking prices now stand at 930 and 900 euros per square meter,
respectively.
PRICE TRENDS ACROSS MAIN CITIES
9
ROMANIAN RESIDENTIAL MARKET REPORT - Spring 2017
Largest price per sq. m.Median price & % price change over last 3 months
Source: Analize Imobiliare, data accessed from Imobiliare.ro
1,260 €
Cluj-Napoca
+2.9%
Bucharest
1,200 €
+3.4%
Timisoara
1,040 €
+2%
Constanta
980 €
+2.7%
Brasov
930 €
+1.8%
Largest price increase per sq. m.Median price & % price change over last 3 months
Source: Analize Imobiliare, data accessed from Imobiliare.ro
730 €
Baia Mare
+11.4%
Oradea
780 €
+10%
Zalau
550 €
+10%
Braila
660 €
+9.3%
Miercurea-Ciuc
600 €
+8%
Smallest price increase per sq. m.Median price & % price change over last 3 months
Source: Analize Imobiliare, data accessed from Imobiliare.ro
680 €
Ramnicu Valcea
-2.7%
Alexandria
520 €
-1.2%
Vaslui
620 €
-0.8%
Piatra-Neamt
640 €
-0.7%
Galati
700 €
-0.5%
Smallest price per sq. m.Median price & % price change over last 3 months
Source: Analize Imobiliare, data accessed from Imobiliare.ro
430 €
Resita
+1.6%
Giurgiu
440 €
+3.7%
DrobetaTurnu-Severin
500 €
+6%
Sfantu Gheorghe
510 €
+5.3%
Alexandria
520 €
-1.2%
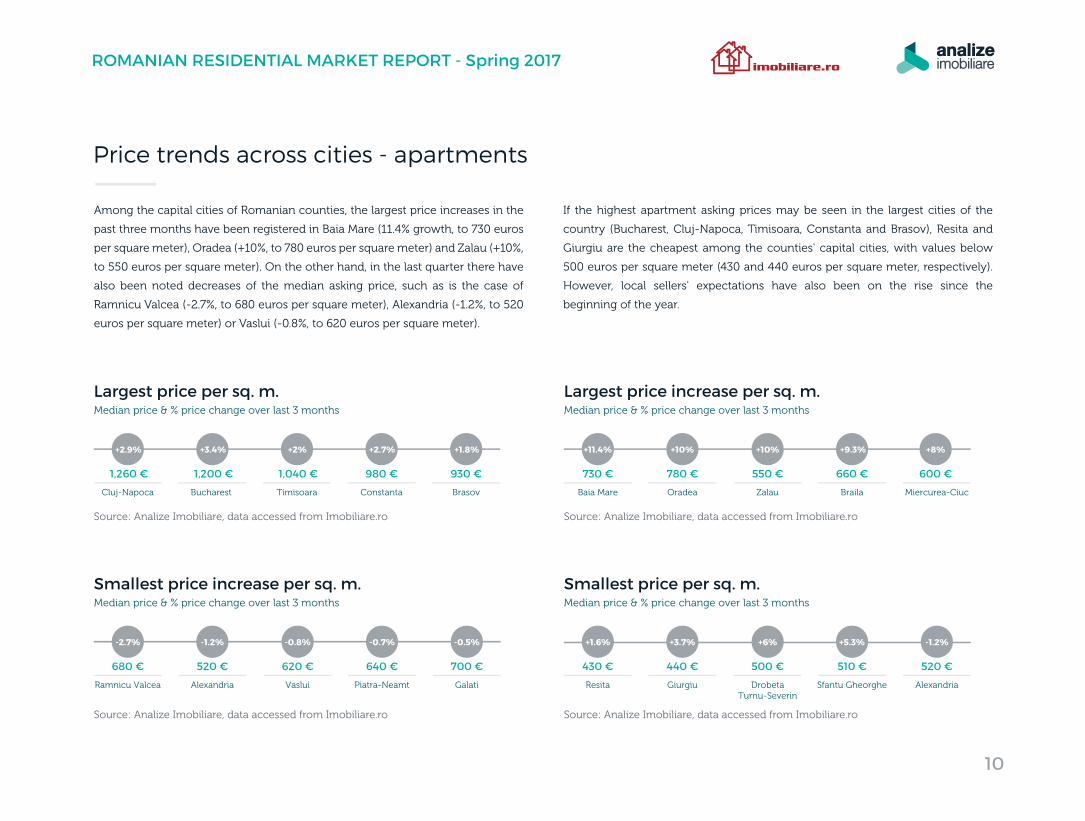
Price trends across cities - apartments
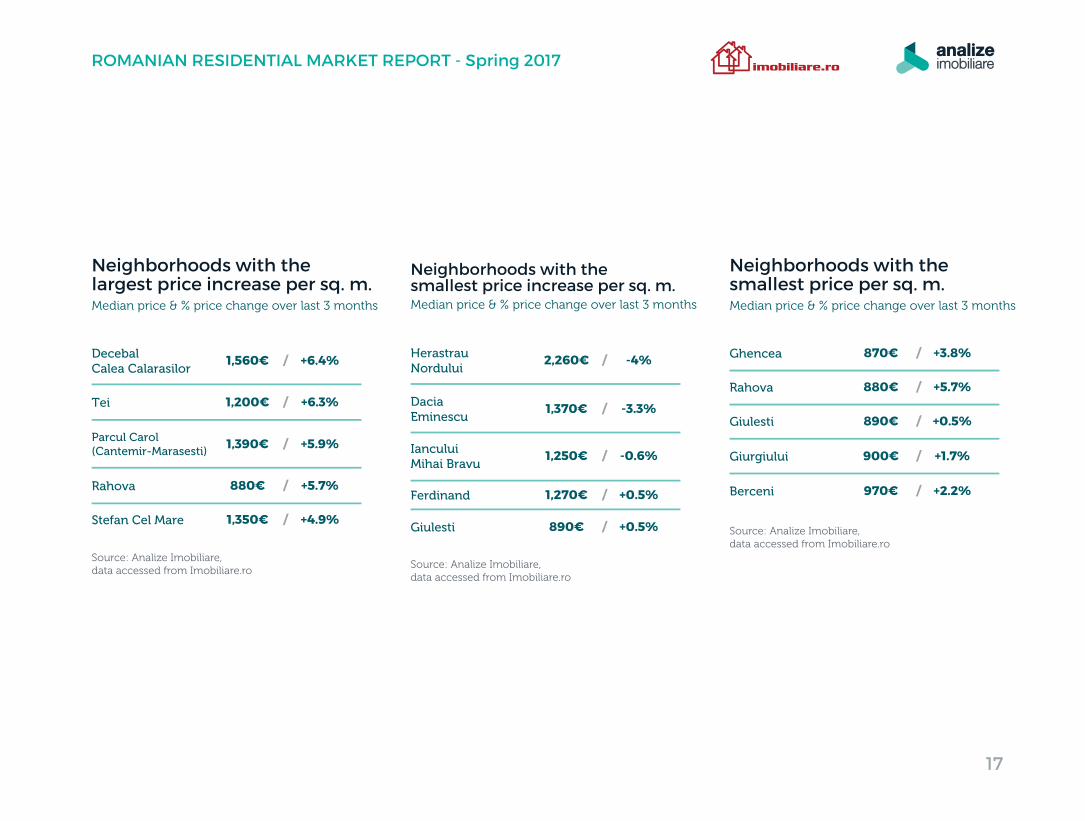
Among the capital cities of Romanian counties, the largest price increases in the
past three months have been registered in Baia Mare (11.4% growth, to 730 euros
per square meter), Oradea (+10%, to 780 euros per square meter) and Zalau (+10%,
to 550 euros per square meter). On the other hand, in the last quarter there have
also been noted decreases of the median asking price, such as is the case of
Ramnicu Valcea (-2.7%, to 680 euros per square meter), Alexandria (-1.2%, to 520
euros per square meter) or Vaslui (-0.8%, to 620 euros per square meter).
If the highest apartment asking prices may be seen in the largest cities of the
country (Bucharest, Cluj-Napoca, Timisoara, Constanta and Brasov), Resita and
Giurgiu are the cheapest among the counties' capital cities, with values below
500 euros per square meter (430 and 440 euros per square meter, respectively).
However, local sellers' expectations have also been on the rise since the
beginning of the year.
10
ROMANIAN RESIDENTIAL MARKET REPORT - Spring 2017
PRICE TRENDS ACROSS NEIGHBORHOODS
Cluj-Napoca Bucharest Timisoara
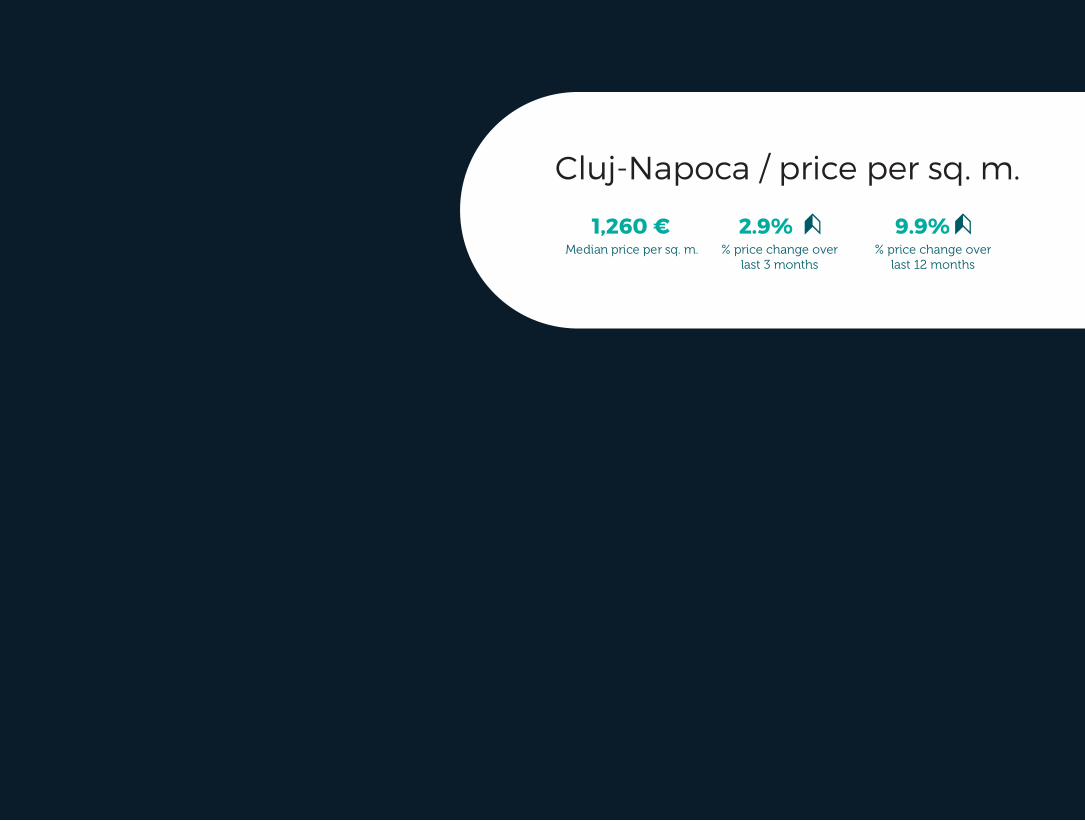
1,260 €Median price per sq. m. % price change over
last 12 months% price change over
last 3 months
9.9%2.9%
Cluj-Napoca / price per sq. m.
CentralUltracentral
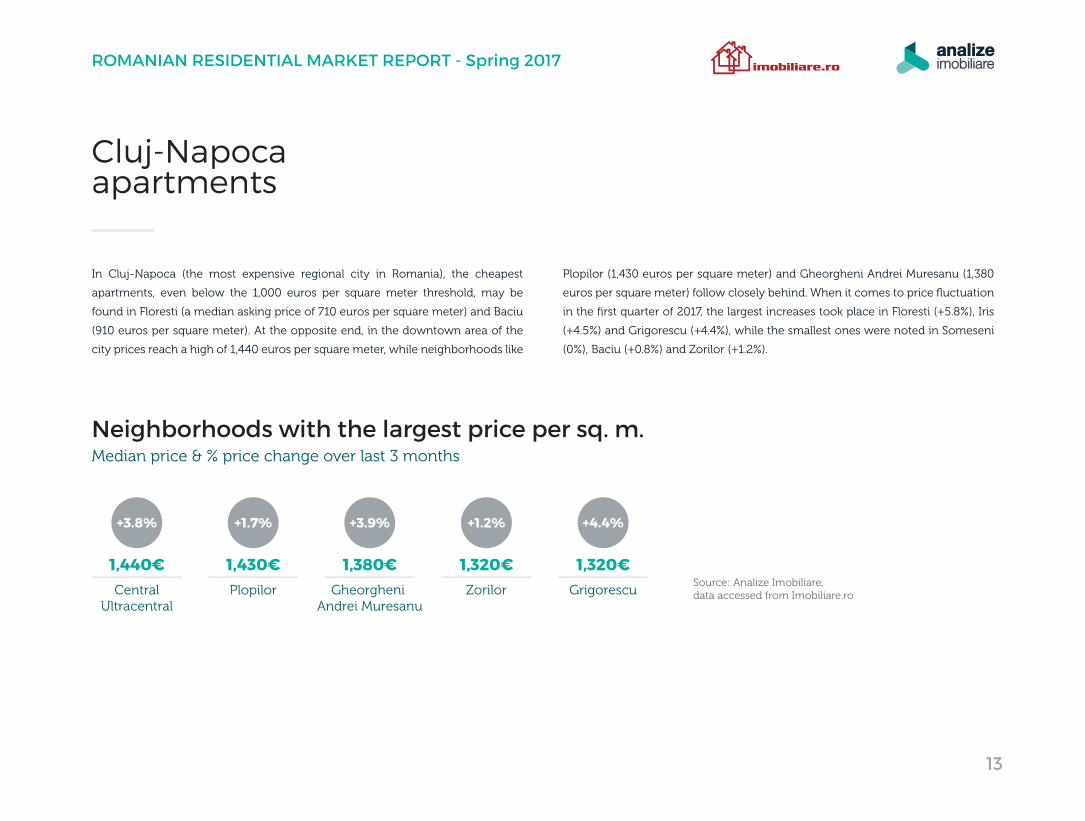
Neighborhoods with the largest price per sq. m.Median price & % price change over last 3 months
1,440€Plopilor
1,430€Gheorgheni
Andrei Muresanu
1,380€Zorilor
1,320€Grigorescu
1,320€
+3.8% +1.7% +3.9% +1.2% +4.4%
Cluj-Napoca apartments
In Cluj-Napoca (the most expensive regional city in Romania), the cheapest
apartments, even below the 1,000 euros per square meter threshold, may be
found in Floresti (a median asking price of 710 euros per square meter) and Baciu
(910 euros per square meter). At the opposite end, in the downtown area of the
city prices reach a high of 1,440 euros per square meter, while neighborhoods like
Plopilor (1,430 euros per square meter) and Gheorgheni Andrei Muresanu (1,380
euros per square meter) follow closely behind. When it comes to price fluctuation
in the first quarter of 2017, the largest increases took place in Floresti (+5.8%), Iris
(+4.5%) and Grigorescu (+4.4%), while the smallest ones were noted in Someseni
(0%), Baciu (+0.8%) and Zorilor (+1.2%).
Source: Analize Imobiliare, data accessed from Imobiliare.ro
13
ROMANIAN RESIDENTIAL MARKET REPORT - Spring 2017
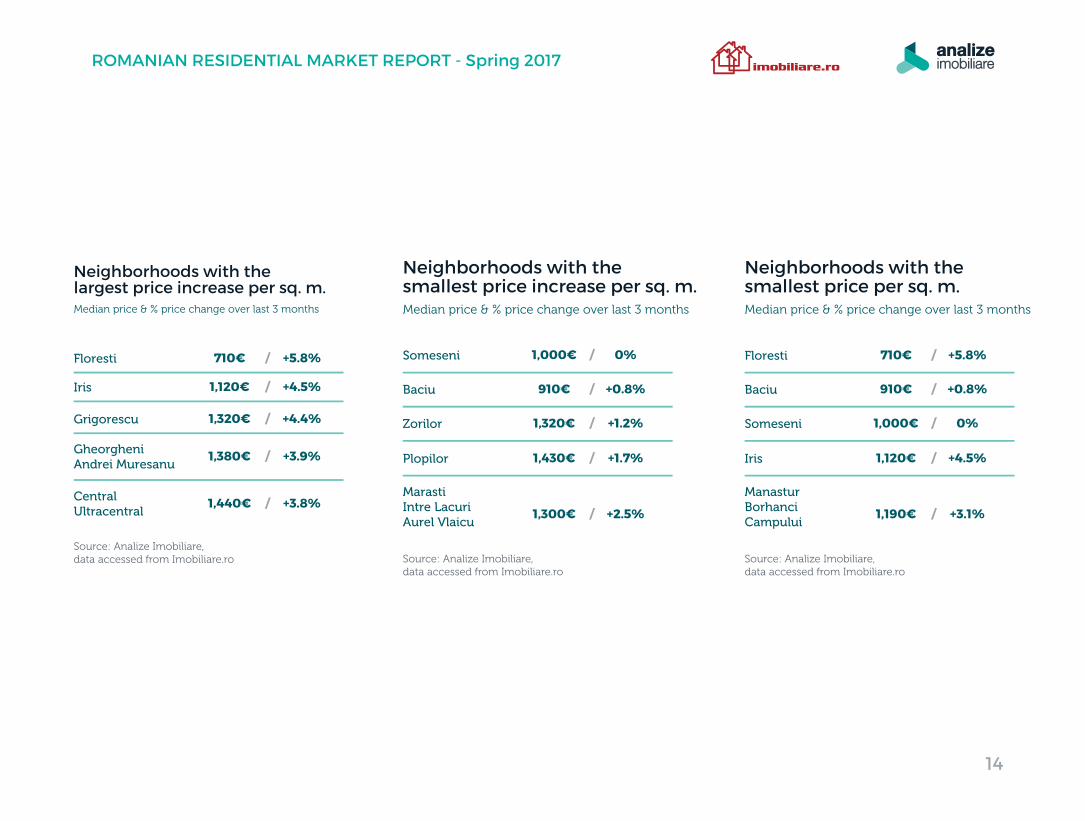
Floresti 710€ / +5.8%
Baciu 910€ / +0.8%
Someseni 1,000€ / 0%
Iris 1,120€ / +4.5%
ManasturBorhanciCampului
1,190€ / +3.1%
Neighborhoods with the smallest price per sq. m.Median price & % price change over last 3 months
Source: Analize Imobiliare, data accessed from Imobiliare.ro
Baciu 910€ / +0.8%
Zorilor 1,320€ / +1.2%
Someseni 1,000€ / 0%
Plopilor 1,430€ / +1.7%
MarastiIntre LacuriAurel Vlaicu
1,300€ / +2.5%
Neighborhoods with the smallest price increase per sq. m.Median price & % price change over last 3 months
Source: Analize Imobiliare, data accessed from Imobiliare.ro
Source: Analize Imobiliare, data accessed from Imobiliare.ro
Neighborhoods with thelargest price increase per sq. m.Median price & % price change over last 3 months
GheorgheniAndrei Muresanu
/ +3.9%1,380€
Floresti / +5.8%710€
Iris / +4.5%1,120€
Grigorescu / +4.4%1,320€
CentralUltracentral
/ +3.8%1,440€
14
ROMANIAN RESIDENTIAL MARKET REPORT - Spring 2017
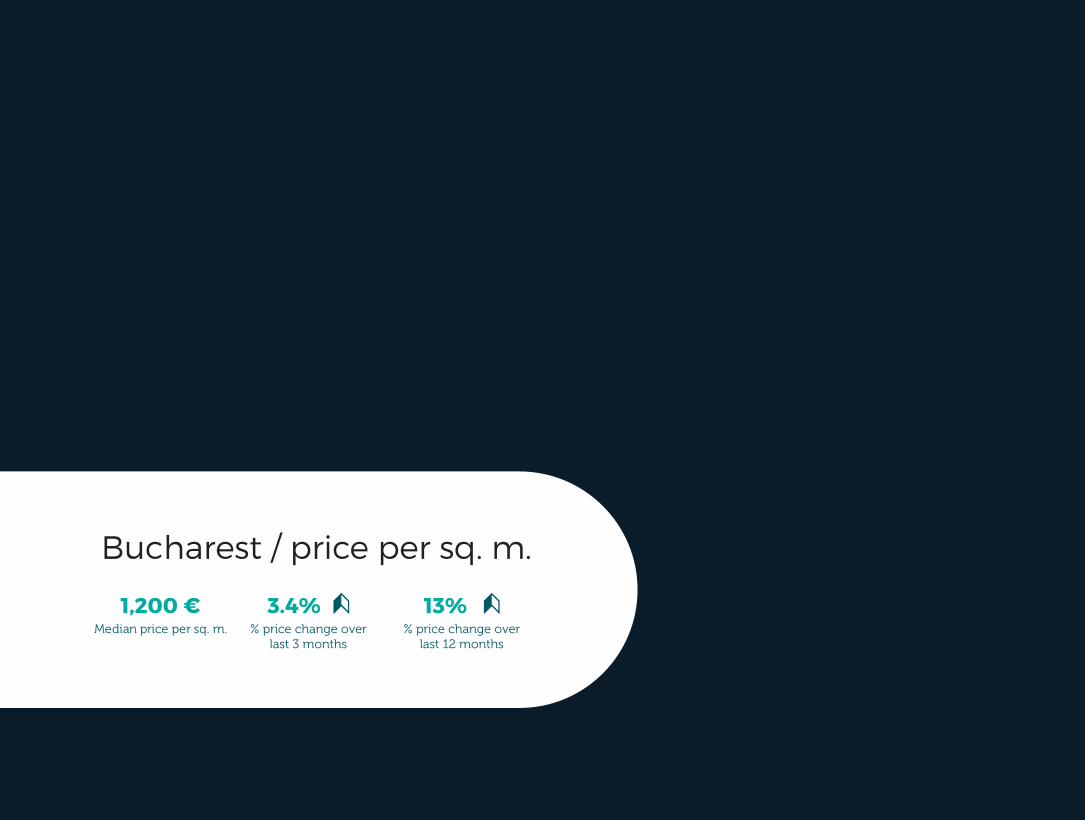
1,200 €Median price per sq. m. % price change over
last 12 months% price change over
last 3 months
13%3.4%
Bucharest / price per sq. m.
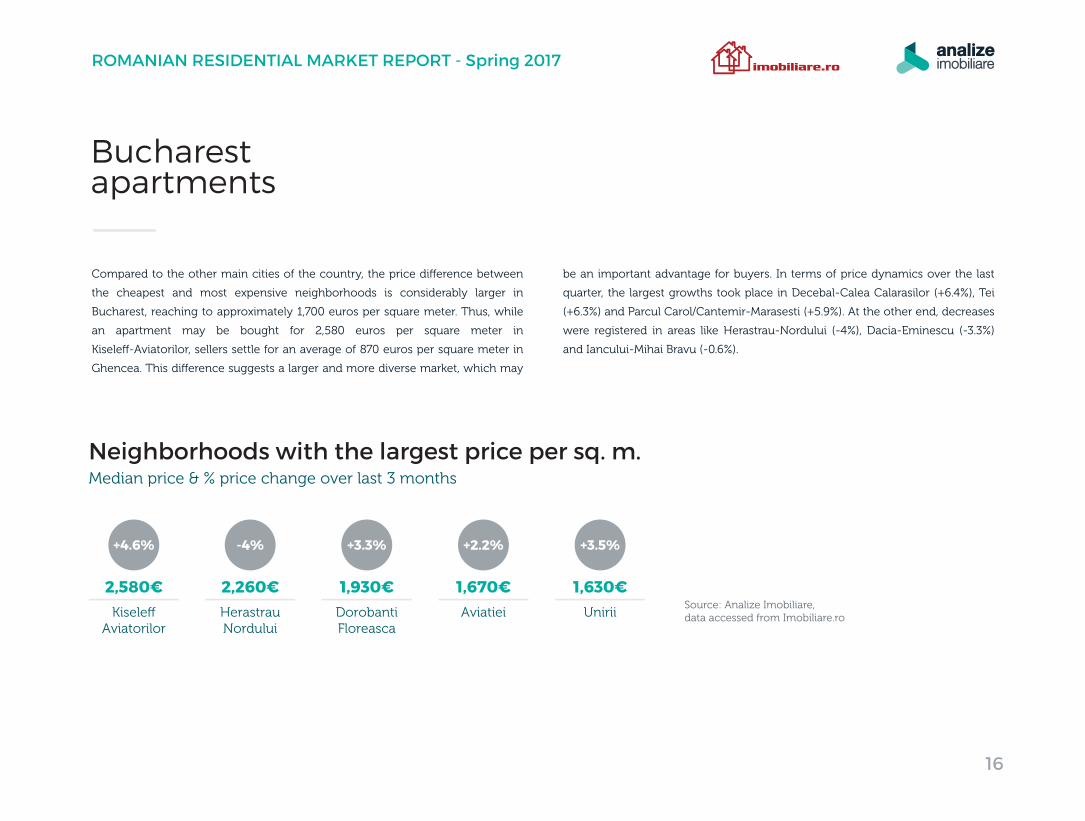
Kisele�Aviatorilor
Neighborhoods with the largest price per sq. m.Median price & % price change over last 3 months
2,580€HerastrauNordului
2,260€DorobantiFloreasca
1,930€Aviatiei
1,670€Unirii
1,630€
+4.6% -4% +3.3% +2.2% +3.5%
Bucharestapartments
Compared to the other main cities of the country, the price di�erence between
the cheapest and most expensive neighborhoods is considerably larger in
Bucharest, reaching to approximately 1,700 euros per square meter. Thus, while
an apartment may be bought for 2,580 euros per square meter in
Kisele�-Aviatorilor, sellers settle for an average of 870 euros per square meter in
Ghencea. This di�erence suggests a larger and more diverse market, which may
be an important advantage for buyers. In terms of price dynamics over the last
quarter, the largest growths took place in Decebal-Calea Calarasilor (+6.4%), Tei
(+6.3%) and Parcul Carol/Cantemir-Marasesti (+5.9%). At the other end, decreases
were registered in areas like Herastrau-Nordului (-4%), Dacia-Eminescu (-3.3%)
and Iancului-Mihai Bravu (-0.6%).
Source: Analize Imobiliare, data accessed from Imobiliare.ro
16
ROMANIAN RESIDENTIAL MARKET REPORT - Spring 2017
Ghencea 870€ / +3.8%
Rahova 880€ / +5.7%
Giulesti 890€ / +0.5%
Giurgiului 900€ / +1.7%
Berceni 970€ / +2.2%
Neighborhoods with the smallest price per sq. m.Median price & % price change over last 3 months
Source: Analize Imobiliare, data accessed from Imobiliare.ro
Stefan Cel Mare 1,350€ / +4.9%
Tei 1,200€ / +6.3%
Rahova 880€ / +5.7%
Neighborhoods with the largest price increase per sq. m.Median price & % price change over last 3 months
Source: Analize Imobiliare, data accessed from Imobiliare.ro
DecebalCalea Calarasilor
/ +6.4%1,560€
Parcul Carol (Cantemir-Marasesti)
/ +5.9%1,390€
Source: Analize Imobiliare, data accessed from Imobiliare.ro
Neighborhoods with the smallest price increase per sq. m.Median price & % price change over last 3 months
DaciaEminescu
/ -3.3%1,370€
HerastrauNordului
/ -4%2,260€
Ferdinand / +0.5%1,270€
Giulesti / +0.5%890€
IanculuiMihai Bravu
/ -0.6%1,250€
17
ROMANIAN RESIDENTIAL MARKET REPORT - Spring 2017
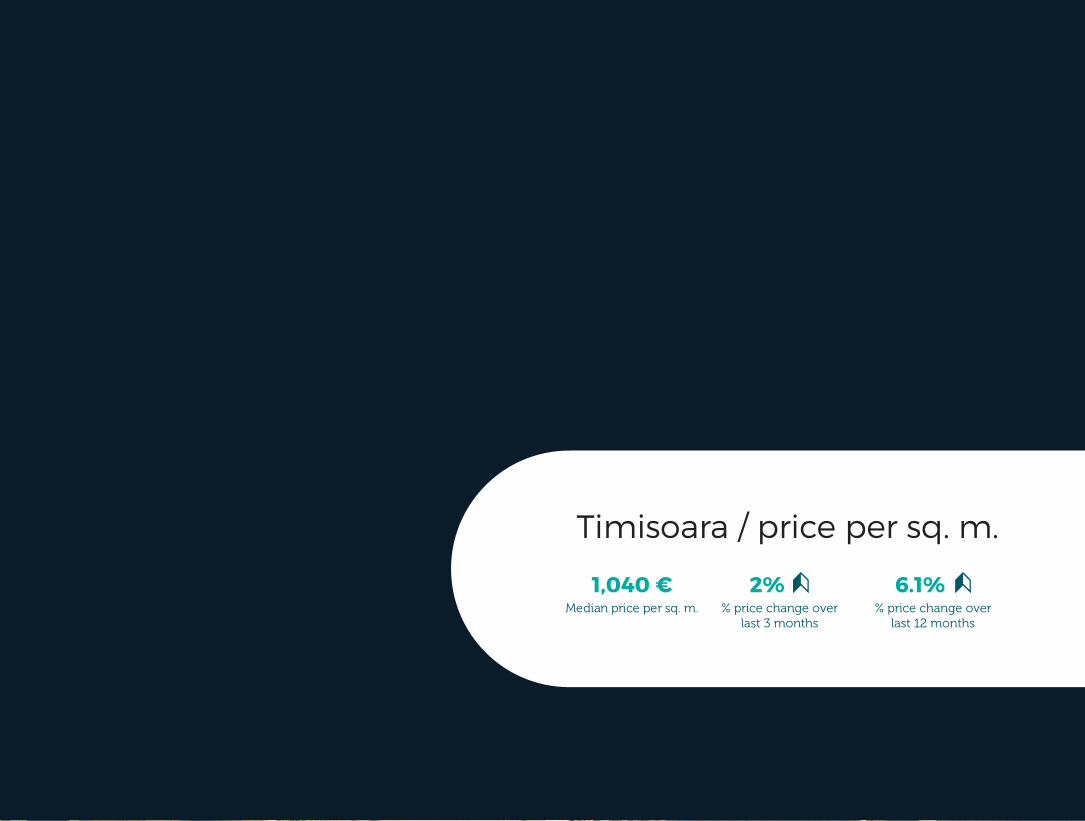
1,040 €Median price per sq. m. % price change over
last 12 months% price change over
last 3 months
6.1%2%
Timisoara / price per sq. m.
UltracentralMedicina P-ta Unirii
Neighborhoods with the largest price per sq. m.Median price & % price change over last 3 months
1,350€Torontalului
1,100€Circumvalatiunii
1,090€Central
Balcescu Take Ionescu
P-ta Maria
1,070€Complex
StudentescDacia
ElisabetinOlimpia-Stadion
1,070€Braytim
1,060€
+3.8% +3.6% +3% +3.4% +1.6% +1.5%
Timisoara apartments
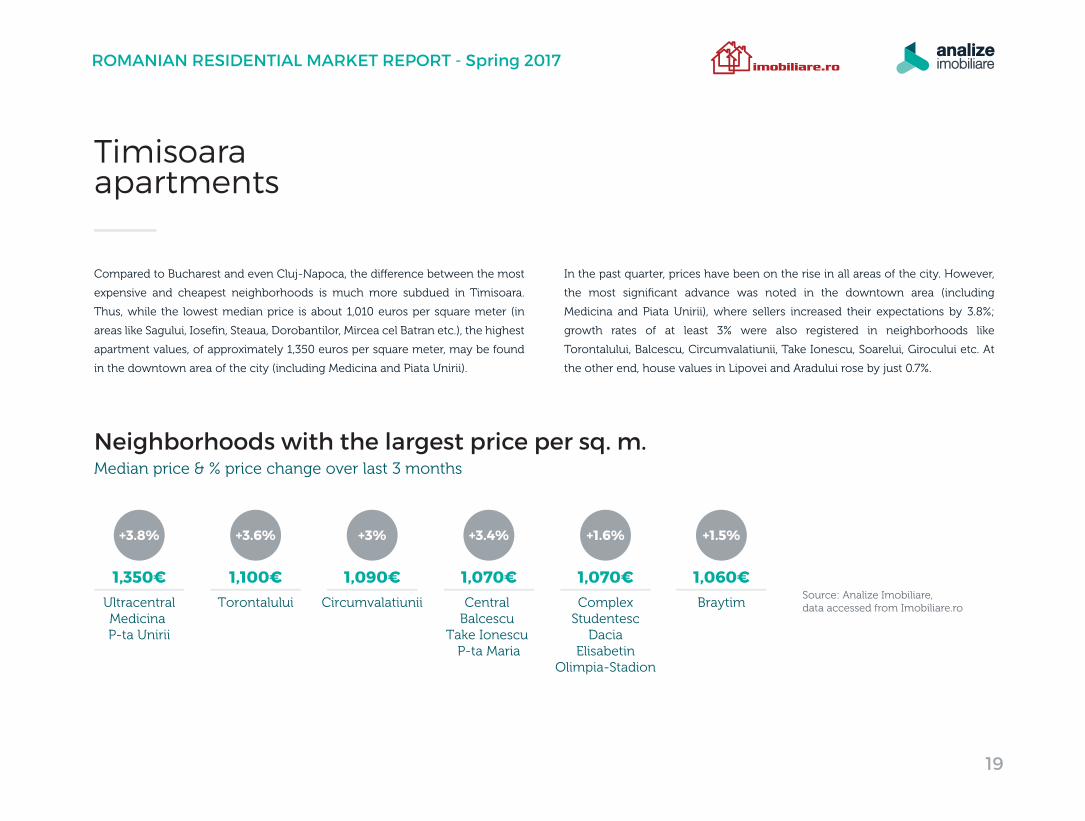
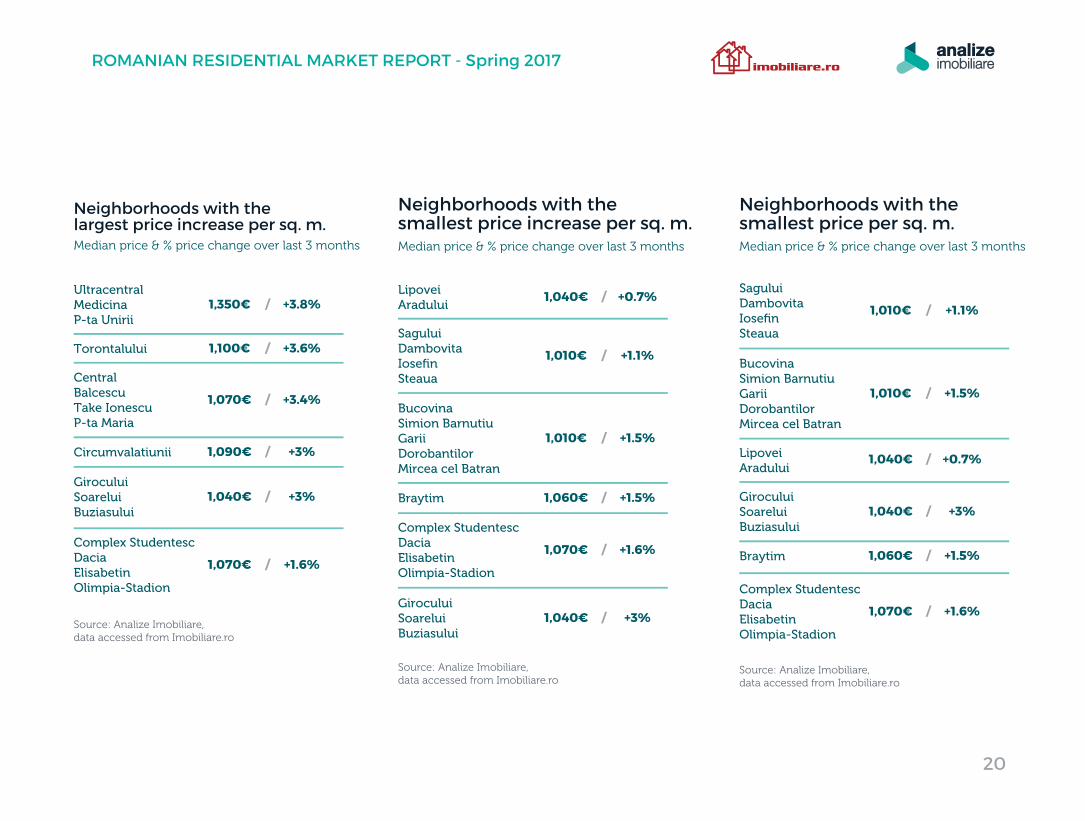
Compared to Bucharest and even Cluj-Napoca, the di�erence between the most
expensive and cheapest neighborhoods is much more subdued in Timisoara.
Thus, while the lowest median price is about 1,010 euros per square meter (in
areas like Sagului, Iosefin, Steaua, Dorobantilor, Mircea cel Batran etc.), the highest
apartment values, of approximately 1,350 euros per square meter, may be found
in the downtown area of the city (including Medicina and Piata Unirii).
In the past quarter, prices have been on the rise in all areas of the city. However,
the most significant advance was noted in the downtown area (including
Medicina and Piata Unirii), where sellers increased their expectations by 3.8%;
growth rates of at least 3% were also registered in neighborhoods like
Torontalului, Balcescu, Circumvalatiunii, Take Ionescu, Soarelui, Girocului etc. At
the other end, house values in Lipovei and Aradului rose by just 0.7%.
Source: Analize Imobiliare, data accessed from Imobiliare.ro
19
ROMANIAN RESIDENTIAL MARKET REPORT - Spring 2017
LipoveiAradului
Braytim Braytim
1,040€ / +0.7%
Girocului SoareluiBuziasului
1,040€ / +3%
1,060€ / +1.5%
Neighborhoods with the smallest price increase per sq. m.Median price & % price change over last 3 months
Sagului DambovitaIosefin Steaua
1,010€ / +1.1%
Complex StudentescDaciaElisabetinOlimpia-Stadion
1,070€ / +1.6%
BucovinaSimion Barnutiu GariiDorobantilorMircea cel Batran
1,010€ / +1.5%
Source: Analize Imobiliare, data accessed from Imobiliare.ro
LipoveiAradului
1,040€ / +0.7%
Girocului SoareluiBuziasului
1,040€ / +3%
Braytim 1,060€ / +1.5%
Sagului DambovitaIosefinSteaua
1,010€ / +1.1%
Complex StudentescDaciaElisabetinOlimpia-Stadion
1,070€ / +1.6%
BucovinaSimion Barnutiu GariiDorobantilorMircea cel Batran
1,010€ / +1.5%
Neighborhoods with the smallest price per sq. m.Median price & % price change over last 3 months
Source: Analize Imobiliare, data accessed from Imobiliare.ro
Source: Analize Imobiliare, data accessed from Imobiliare.ro
Neighborhoods with thelargest price increase per sq. m.Median price & % price change over last 3 months
UltracentralMedicinaP-ta Unirii
/ +3.8%1,350€
GiroculuiSoareluiBuziasului
/ +3%1,040€
CentralBalcescuTake IonescuP-ta Maria
/ +3.4%1,070€
Complex StudentescDaciaElisabetin Olimpia-Stadion
/ +1.6%1,070€
Torontalului / +3.6%1,100€
Circumvalatiunii / +3%1,090€
20
ROMANIAN RESIDENTIAL MARKET REPORT - Spring 2017
-22%
-35%
-13%
-29%
-20%
-32%
-8%
-25%
-27%
-37%
-20%
-31%
Number of listings for sale across main cities (existing dwellings)
4,020
1,220 920 630 560 580
1,910
8,000
2,350
1,260 1,180 1,140
Bucharest
% change overlast 12 months
Cluj-Napoca Timisoara Iasi Constanta Brasov
New listings
All listings
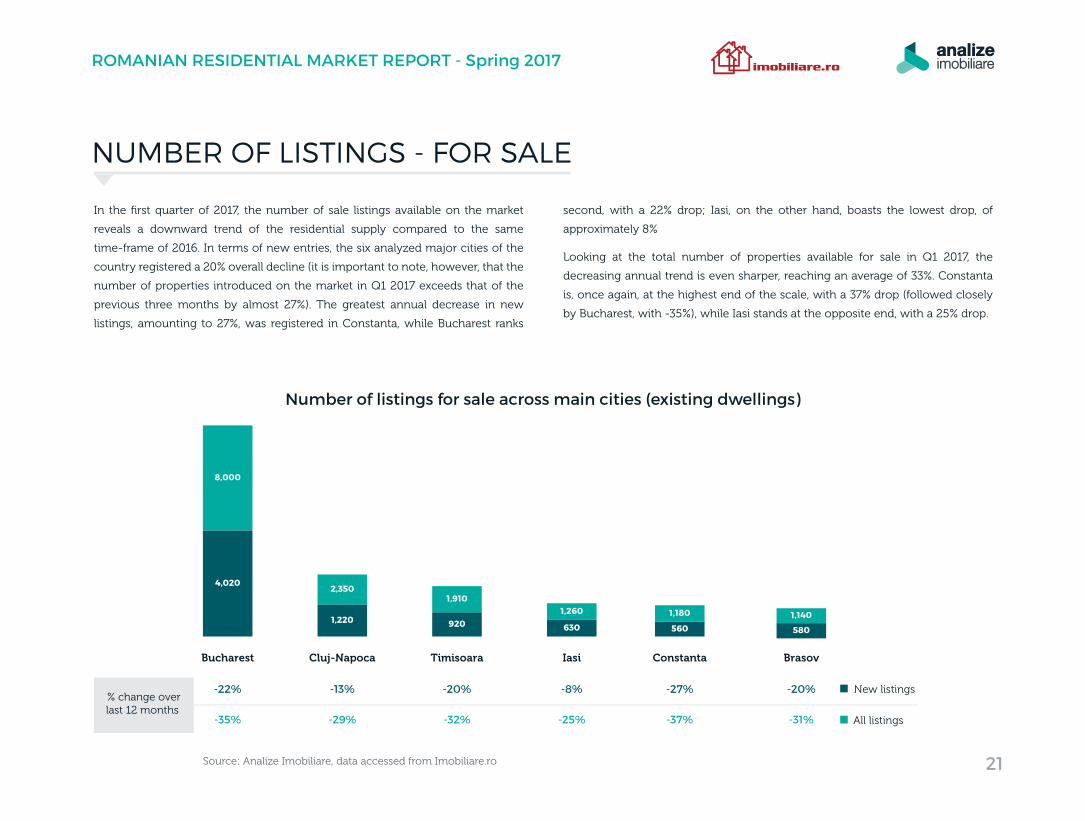
In the first quarter of 2017, the number of sale listings available on the market
reveals a downward trend of the residential supply compared to the same
time-frame of 2016. In terms of new entries, the six analyzed major cities of the
country registered a 20% overall decline (it is important to note, however, that the
number of properties introduced on the market in Q1 2017 exceeds that of the
previous three months by almost 27%). The greatest annual decrease in new
listings, amounting to 27%, was registered in Constanta, while Bucharest ranks
second, with a 22% drop; Iasi, on the other hand, boasts the lowest drop, of
approximately 8%
Looking at the total number of properties available for sale in Q1 2017, the
decreasing annual trend is even sharper, reaching an average of 33%. Constanta
is, once again, at the highest end of the scale, with a 37% drop (followed closely
by Bucharest, with -35%), while Iasi stands at the opposite end, with a 25% drop.
NUMBER OF LISTINGS - FOR SALE
Source: Analize Imobiliare, data accessed from Imobiliare.ro 21
ROMANIAN RESIDENTIAL MARKET REPORT - Spring 2017
+6.4%+
-3.5%
+10.2%
-0.3%
+13%
-5.1%
+22.9%
+2%
+18.8%
+12.5%
+25.3%
+12.7%
% change overlast 12 months
New listings
All listings
Bucharest Cluj-Napoca Timisoara Constanta Iasi Brasov
6,920
1,680 1,210 1,010730 750
9,330
2,0901,570
1,060 1,340950
Number of listings for rent across main cities (existing dwellings)
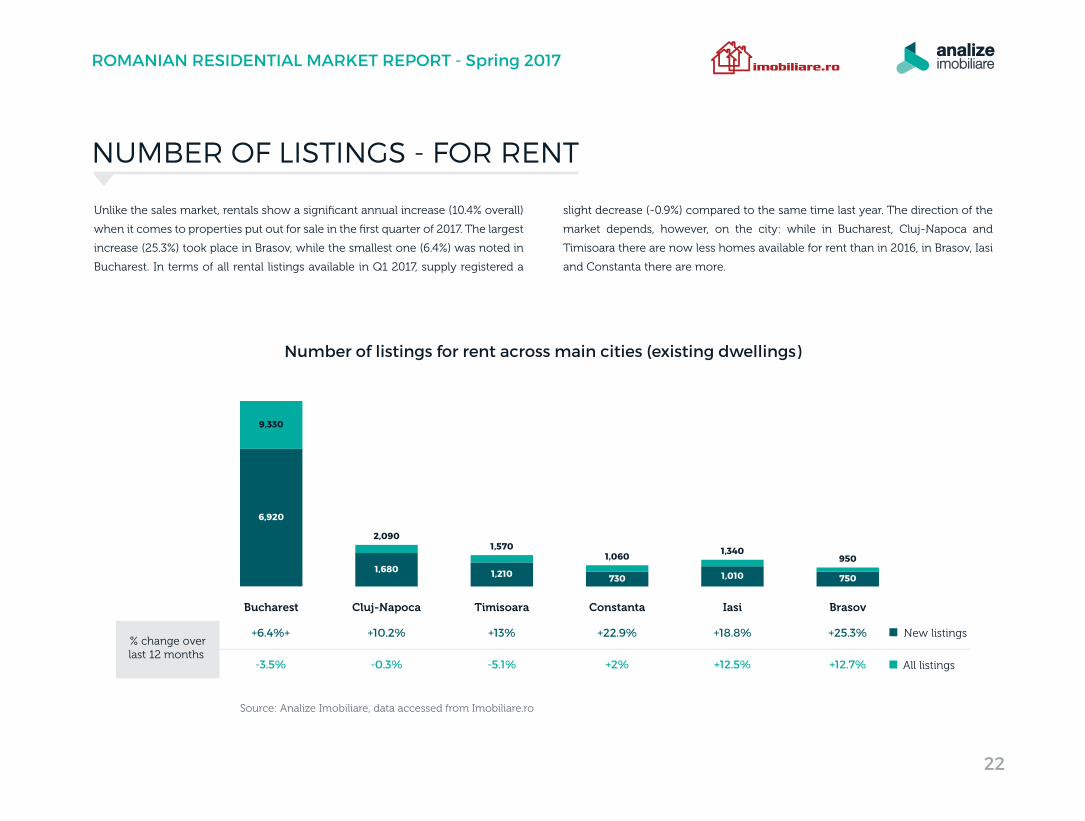
Unlike the sales market, rentals show a significant annual increase (10.4% overall)
when it comes to properties put out for sale in the first quarter of 2017. The largest
increase (25.3%) took place in Brasov, while the smallest one (6.4%) was noted in
Bucharest. In terms of all rental listings available in Q1 2017, supply registered a
slight decrease (-0.9%) compared to the same time last year. The direction of the
market depends, however, on the city: while in Bucharest, Cluj-Napoca and
Timisoara there are now less homes available for rent than in 2016, in Brasov, Iasi
and Constanta there are more.
NUMBER OF LISTINGS - FOR RENT
Source: Analize Imobiliare, data accessed from Imobiliare.ro
22
ROMANIAN RESIDENTIAL MARKET REPORT - Spring 2017
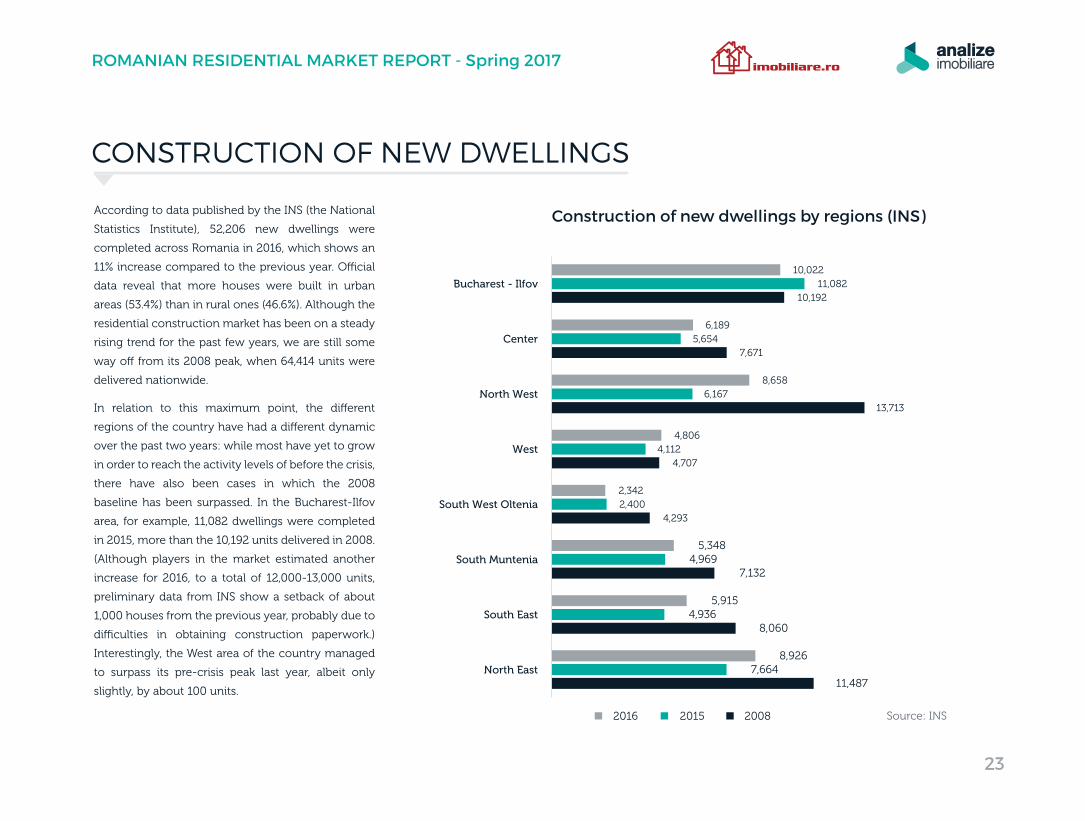
Source: INS
According to data published by the INS (the National
Statistics Institute), 52,206 new dwellings were
completed across Romania in 2016, which shows an
11% increase compared to the previous year. O�cial
data reveal that more houses were built in urban
areas (53.4%) than in rural ones (46.6%). Although the
residential construction market has been on a steady
rising trend for the past few years, we are still some
way o� from its 2008 peak, when 64,414 units were
delivered nationwide.
In relation to this maximum point, the di�erent
regions of the country have had a di�erent dynamic
over the past two years: while most have yet to grow
in order to reach the activity levels of before the crisis,
there have also been cases in which the 2008
baseline has been surpassed. In the Bucharest-Ilfov
area, for example, 11,082 dwellings were completed
in 2015, more than the 10,192 units delivered in 2008.
(Although players in the market estimated another
increase for 2016, to a total of 12,000-13,000 units,
preliminary data from INS show a setback of about
1,000 houses from the previous year, probably due to
di�culties in obtaining construction paperwork.)
Interestingly, the West area of the country managed
to surpass its pre-crisis peak last year, albeit only
slightly, by about 100 units.
CONSTRUCTION OF NEW DWELLINGS
Construction of new dwellings by regions (INS)
11,487
8,060
7,132
4,293
4,707
13,713
7,671
10,192
7,664
4,936
4,969
2,400
4,112
6,167
5,654
11,082
8,926
5,915
5,348
2,342
4,806
8,658
6,189
10,022
North East
South East
South Muntenia
South West Oltenia
West
North West
Center
Bucharest - Ilfov
2016 2015 2008
23
ROMANIAN RESIDENTIAL MARKET REPORT - Spring 2017
North-East
South-East
South: Muntenia
South-West: Oltenia
West
North-West
Center
Bucharest-Ilfov
Total
2,740
1,927
1,654
739
1,365
2,520
1,792
2,512
15,249
-16%
-3%
+8%
+11%
+21%
+20%
+12%
-29%
-4%
Regions2016 Q4
(no. of units)% evolution from
previous year
18.0%
12.6%
10.8%
4.8%9.0%
16.5%
11.8%
16.5%
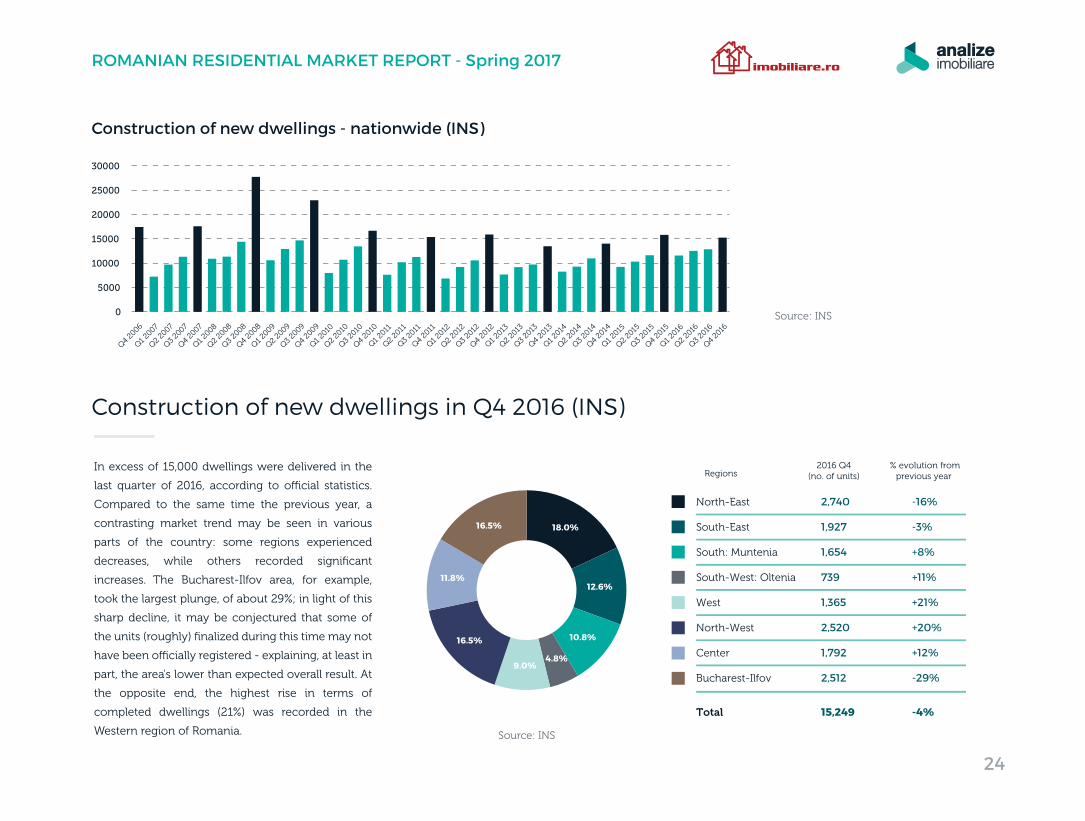
Construction of new dwellings in Q4 2016 (INS)
Source: INS
Source: INS
In excess of 15,000 dwellings were delivered in the
last quarter of 2016, according to o�cial statistics.
Compared to the same time the previous year, a
contrasting market trend may be seen in various
parts of the country: some regions experienced
decreases, while others recorded significant
increases. The Bucharest-Ilfov area, for example,
took the largest plunge, of about 29%; in light of this
sharp decline, it may be conjectured that some of
the units (roughly) finalized during this time may not
have been o�cially registered - explaining, at least in
part, the area's lower than expected overall result. At
the opposite end, the highest rise in terms of
completed dwellings (21%) was recorded in the
Western region of Romania.
0
5000
10000
15000
20000
25000
30000
Q4 20
06
Q1 2007
Q2 20
07
Q3 20
07
Q4 20
07
Q1 2008
Q2 20
08
Q3 20
08
Q4 20
08
Q1 2009
Q2 20
09
Q3 20
09
Q4 20
09
Q1 2010
Q2 20
10
Q3 20
10
Q4 20
10
Q1 2011
Q2 20
11
Q3 20
11
Q4 20
11
Q1 2012
Q2 20
12
Q3 20
12
Q4 20
12
Q1 2013
Q2 20
13
Q3 20
13
Q4 20
13
Q1 2014
Q2 20
14
Q3 20
14
Q4 20
14
Q1 2015
Q2 20
15
Q3 20
15
Q4 20
15
Q1 2016
Q2 20
16
Q3 20
16
Q4 20
16
Construction of new dwellings - nationwide (INS)
24
ROMANIAN RESIDENTIAL MARKET REPORT - Spring 2017
NEW RESIDENTIAL PROJECTS
Source: Analize Imobiliare,data accessed from Imobiliare.ro
ApartmentsApartments & HousesHousesResidential projects
5421975
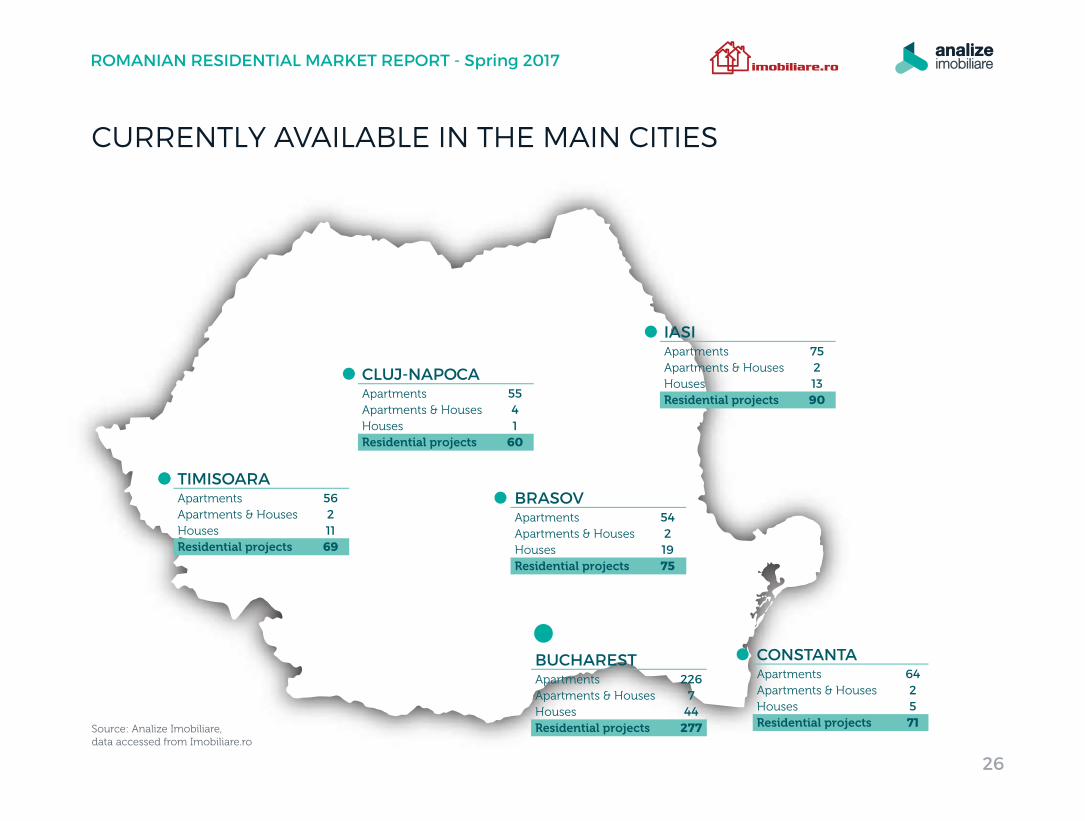
CURRENTLY AVAILABLE IN THE MAIN CITIES
26
ROMANIAN RESIDENTIAL MARKET REPORT - Spring 2017
BRASOVApartmentsApartments & HousesHousesResidential projects
56211
69
TIMISOARA
ApartmentsApartments & HousesHousesResidential projects
5541
60
CLUJ-NAPOCAApartmentsApartments & HousesHousesResidential projects
7521390
IASI
ApartmentsApartments & HousesHousesResidential projects
642571
CONSTANTAApartmentsApartments & HousesHousesResidential projects
2267
44277
BUCHAREST
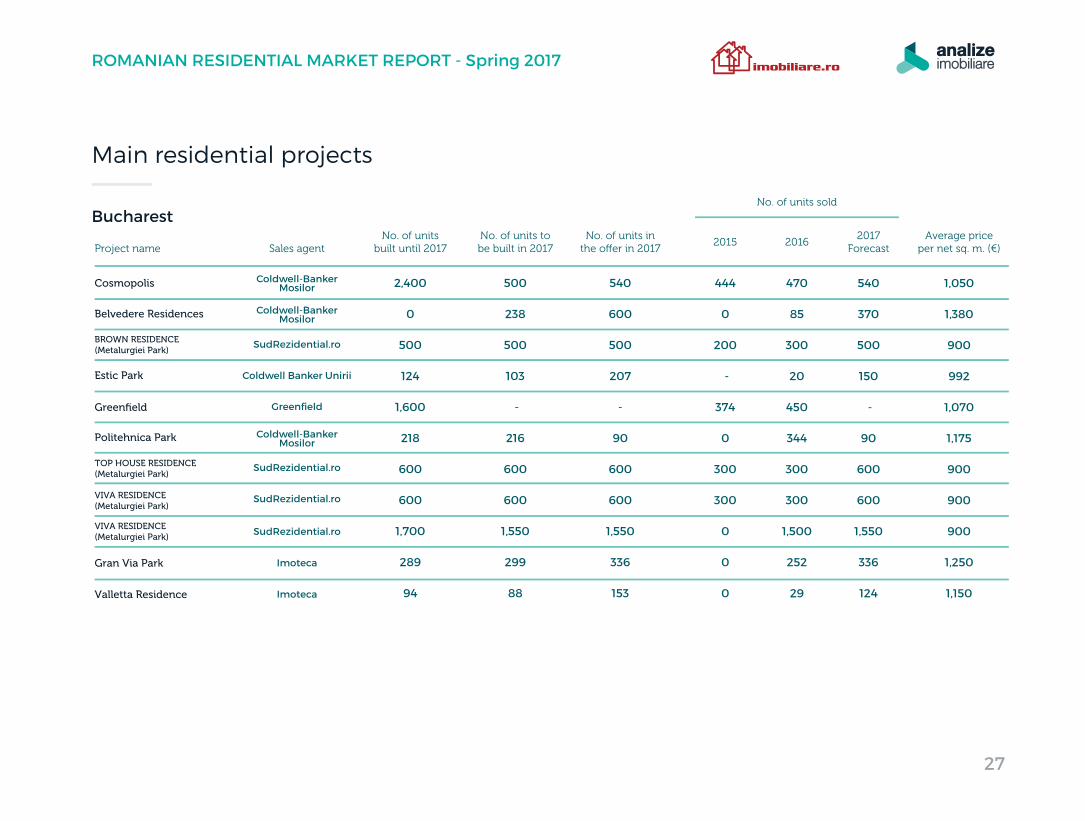
Main residential projects
Project name
Cosmopolis
Belvedere Residences
Estic Park
Greenfield
Politehnica Park
BROWN RESIDENCE (Metalurgiei Park)
TOP HOUSE RESIDENCE(Metalurgiei Park)
VIVA RESIDENCE(Metalurgiei Park)
VIVA RESIDENCE(Metalurgiei Park)
2,400
0
500
124
1,600
218
600
600
1,700
289
94
500
238
500
103
-
216
600
600
1,550
299
88
540
600
500
207
-
90
600
600
1,550
336
153
444
0
200
-
374
0
300
300
0
0
0
470
85
300
20
450
344
300
300
1,500
252
29
540
370
500
150
-
90
600
600
1,550
336
124
1,050
1,380
900
992
1,070
1,175
900
900
900
1,250
1,150
Sales agent
Coldwell-BankerMosilor
Coldwell-BankerMosilor
Coldwell-BankerMosilor
SudRezidential.ro
SudRezidential.ro
SudRezidential.ro
SudRezidential.ro
Coldwell Banker Unirii
No. of unitsbuilt until 2017
No. of units tobe built in 2017
No. of units inthe o�er in 2017
Average priceper net sq. m. (€)
2015 20162017
Forecast
No. of units sold
Greenfield
Gran Via Park Imoteca
Valletta Residence Imoteca
Bucharest
27
ROMANIAN RESIDENTIAL MARKET REPORT - Spring 2017
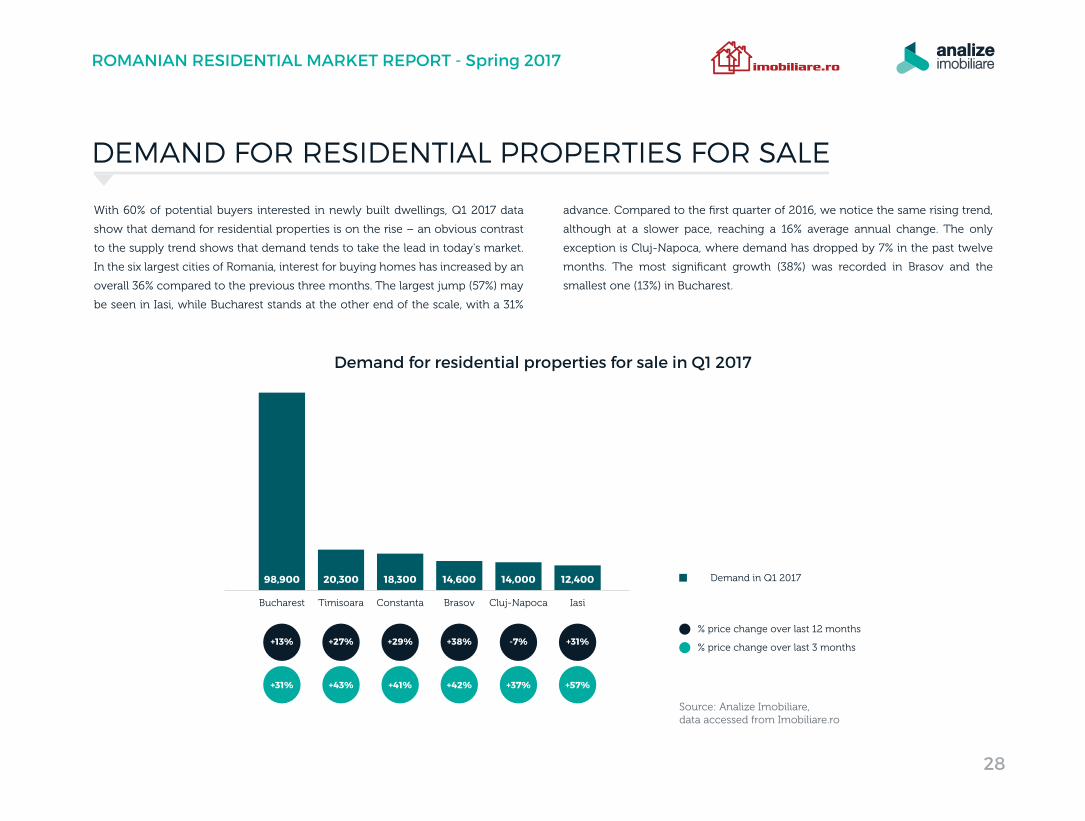
Demand for residential properties for sale in Q1 2017
With 60% of potential buyers interested in newly built dwellings, Q1 2017 data
show that demand for residential properties is on the rise – an obvious contrast
to the supply trend shows that demand tends to take the lead in today's market.
In the six largest cities of Romania, interest for buying homes has increased by an
overall 36% compared to the previous three months. The largest jump (57%) may
be seen in Iasi, while Bucharest stands at the other end of the scale, with a 31%
advance. Compared to the first quarter of 2016, we notice the same rising trend,
although at a slower pace, reaching a 16% average annual change. The only
exception is Cluj-Napoca, where demand has dropped by 7% in the past twelve
months. The most significant growth (38%) was recorded in Brasov and the
smallest one (13%) in Bucharest.
DEMAND FOR RESIDENTIAL PROPERTIES FOR SALE
28
ROMANIAN RESIDENTIAL MARKET REPORT - Spring 2017
98,900 20,300 18,300 14,600 14,000 12,400
Bucharest Timisoara Constanta Brasov Cluj-Napoca Iasi
% price change over last 3 months
% price change over last 12 months
Demand in Q1 2017
Source: Analize Imobiliare, data accessed from Imobiliare.ro
+13% +27% +29% +38% -7% +31%
+31% +43% +41% +42% +37% +57%
0
50
100
150
200
250
Q12014
Q22014
Q32014
Q42014
Q12015
Q22015
Q32015
Q42015
Q12016
Q22016
Q32016
Q42016
Q12017
Apartments Houses
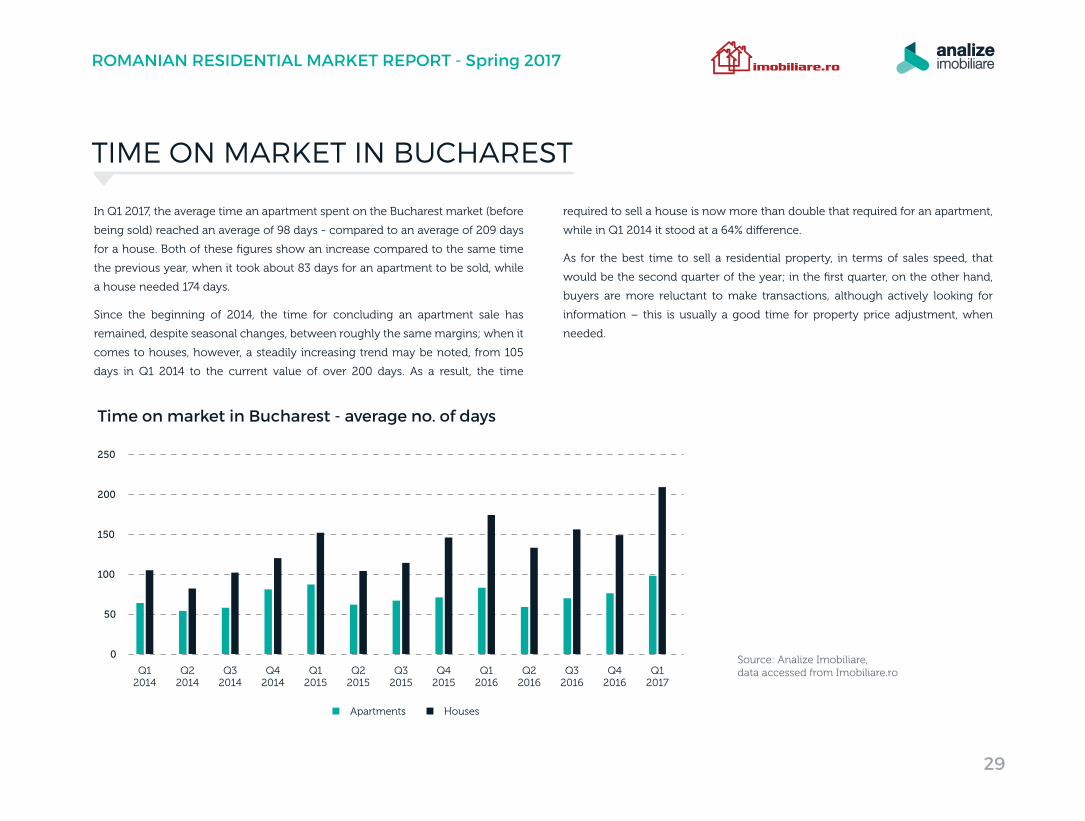
In Q1 2017, the average time an apartment spent on the Bucharest market (before
being sold) reached an average of 98 days - compared to an average of 209 days
for a house. Both of these figures show an increase compared to the same time
the previous year, when it took about 83 days for an apartment to be sold, while
a house needed 174 days.
Since the beginning of 2014, the time for concluding an apartment sale has
remained, despite seasonal changes, between roughly the same margins; when it
comes to houses, however, a steadily increasing trend may be noted, from 105
days in Q1 2014 to the current value of over 200 days. As a result, the time
required to sell a house is now more than double that required for an apartment,
while in Q1 2014 it stood at a 64% di�erence.
As for the best time to sell a residential property, in terms of sales speed, that
would be the second quarter of the year; in the first quarter, on the other hand,
buyers are more reluctant to make transactions, although actively looking for
information – this is usually a good time for property price adjustment, when
needed.
Time on market in Bucharest - average no. of days
TIME ON MARKET IN BUCHAREST
Source: Analize Imobiliare, data accessed from Imobiliare.ro
29
ROMANIAN RESIDENTIAL MARKET REPORT - Spring 2017
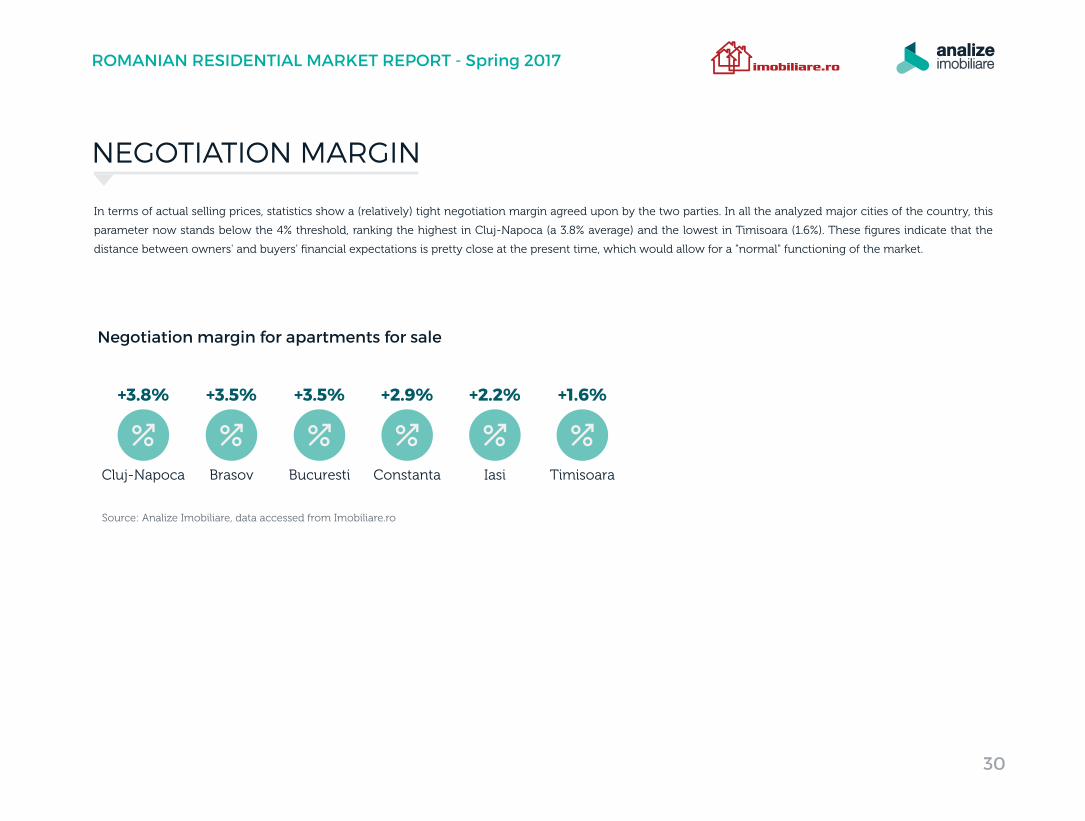
Cluj-Napoca
+3.8%
Brasov
+3.5%
Bucuresti
+3.5%
Constanta
+2.9%
Iasi
+2.2%
Timisoara
+1.6%
In terms of actual selling prices, statistics show a (relatively) tight negotiation margin agreed upon by the two parties. In all the analyzed major cities of the country, this
parameter now stands below the 4% threshold, ranking the highest in Cluj-Napoca (a 3.8% average) and the lowest in Timisoara (1.6%). These figures indicate that the
distance between owners' and buyers' financial expectations is pretty close at the present time, which would allow for a "normal" functioning of the market.
Negotiation margin for apartments for sale
NEGOTIATION MARGIN
Source: Analize Imobiliare, data accessed from Imobiliare.ro
30
ROMANIAN RESIDENTIAL MARKET REPORT - Spring 2017
AnalizeImobiliare.ro Imobiliare.roAnalizeImobiliare.ro is the first real estate intelligence platform in Romania, developed by Imobiliare.ro in collaboration with top statisticians and property valuers in Romania.
Monitoring real estate listings in all major cities and 7,000 towns all over
Romania
Monitoring transactions in more than 20 cities
Daily updates with properties for rent/sale nationwide
ABOUT US
Database
Property Informations & Analytics
Real Estate Benchmarking
Appraised Values Validation
Portfolio Valuation
Collateral Risk (PreScoring, Over.Under-Valuation)
Solutions
#1 property website in Romania
17 years of experience
Nationwide reach: +1.4M unique visitors/month
+1,200 corporate customers (real estea agencies, developers, banks)
Main real estate data supplier for quality & business media in Romania
The largest online real estate specialized team: more than 70 employess
O�ces in Timisoara and Bucharest
31
ROMANIAN RESIDENTIAL MARKET REPORT - Spring 2017

CONTACT OUR TEAM OF EXPERTS
Iride Business Park, Dimitrie Pompeiu 9-9A,
Building B2B, District 2, Bucharest
www.analizeimobiliare.ro
REPORT AUTHORS:
Dorel Niţă - Head of Data & Research, Imobiliare.roAlin Bănuţi - Senior SQL Developer, Imobiliare.ro Adriana Lefter - Editor, Imobiliare.roLucian Husac - Graphic Designer, Imobiliare.roAnca Gorgan - Marketing Consultant, Imobiliare.roDaniel Crainic - Head of Marketing & Communications, Imobiliare.ro
DOREL NIŢĂHEAD OF DATA & RESEARCH
ANDREEA POPASALES MANAGER