Embed Size (px)
Citation preview

Report to
ACCC
Roma-Brisbane Pipeline Throughput and Capacity Requirement Forecasts
7 February 2006
M M A
McLennan Magasanik Associates Pty Ltd 242 Ferrars Street South Melbourne Vic 3205 Tel: (03) 9699 3977 Fax: (03) 9690 9881 Email: [email protected] Website: www.mmassociates.com.au
Ref: J1316

REPORT TO ACCC
Ref: J1316, 7 February 2006 i McLennan Magasanik Associates
TABLE OF CONTENTS
EXECUTIVE SUMMARY ________________________________________________________ V
1 INTRODUCTION_________________________________________________________ 1
1.1 Conventions _________________________________________________________ 2
1.2 Abbreviations and glossary of terms ____________________________________ 2
2 BACKGROUND __________________________________________________________ 4
2.1 The Roma-Brisbane Pipeline ___________________________________________ 4
2.2 Application of the Code to the RBP _____________________________________ 6
2.3 RBP reference tariffs __________________________________________________ 6
3 METHODOLOGY_________________________________________________________ 8
3.1 Code requirements ___________________________________________________ 8
3.2 Overall approach_____________________________________________________ 8
4 ACTUAL USAGE _________________________________________________________ 9
4.1 RBP Users___________________________________________________________ 9
4.2 Gas – fired generation _______________________________________________ 10
4.3 Distribution load ____________________________________________________ 11
4.4 Large Users ________________________________________________________ 12
4.5 Total throughput____________________________________________________ 12
4.6 Peak usage and contracted capacity____________________________________ 13
4.7 Haulage Distance ___________________________________________________ 14
5 KEY DRIVERS AND ASSUMPTIONS _____________________________________ 16
5.1 Introduction ________________________________________________________ 16
5.2 Economic outlook ___________________________________________________ 16
5.3 Eastern states gas demand-supply and price outlook _____________________ 19
5.4 RBP issues _________________________________________________________ 25
5.5 Gas full retail competition ____________________________________________ 26
6 GAS SUPPLY AND TRANSPORTATION AGREEMENTS ___________________ 27
6.1 Introduction ________________________________________________________ 27
6.2 Gas supply agreements ______________________________________________ 27
6.3 Transportation agreements ___________________________________________ 28
7 END-USER DISCUSSIONS _______________________________________________ 30

REPORT TO ACCC
Ref: J1316, 7 February 2006 McLennan Magasanik Associates ii
8 BASE CASE THROUGHPUT AND CAPACITY REQUIREMENT FORECASTS _ 31
8.1 Introduction ________________________________________________________ 31
8.2 Gas fired generation _________________________________________________ 31
8.3 Distribution loads ___________________________________________________ 37
8.4 Large Users ________________________________________________________ 42
8.5 Total RBP throughput _______________________________________________ 45
8.6 Total peak usage and contracted capacity_______________________________ 46
8.7 Haulage distance____________________________________________________ 48
8.8 Impact of potential RBP capacity constraints ____________________________ 48
8.9 Peat lateral _________________________________________________________ 49
9 HIGH AND LOW CASE THROUGHPUT AND CAPACITY REQUIREMENT FORECASTS ____________________________________________________________ 51
9.1 Case specification ___________________________________________________ 51
9.2 Gas fired generation _________________________________________________ 51
9.3 Distribution loads ___________________________________________________ 51
9.4 Large Users ________________________________________________________ 52
9.5 Total RBP throughput and peak usage _________________________________ 52
APPENDIX A MMA-GAS OVERVIEW _________________________________________ 54
APPENDIX B MMA NEM MODELLING OVERVIEW ___________________________ 55 LIST OF TABLES
Table 2-1 RBP Reference Tariffs 1 July 2002______________________________________ 7
Table 4-1 Estimated actual gas usage by South East Queensland Generators ________ 10
Table 4-2 Estimated actual distribution loads ___________________________________ 12
Table 4-3 RBP actual annual throughput (PJ) ___________________________________ 12
Table 4-4 Estimated actual non-coincident peak loads (TJ/day) ___________________ 13
Table 4-5 Contracted RBP capacity (TJ/day) ____________________________________ 13
Table 4-6 Estimated RBP capacity contracts (TJ/day) ____________________________ 14
Table 4-7 RBP load factor (%)_________________________________________________ 14
Table 4-8 Estimated RBP haulage distance (km) _________________________________ 15
Table 5-1 Queensland Economic Outlook (% Growth) ___________________________ 17

REPORT TO ACCC
Ref: J1316, 7 February 2006 McLennan Magasanik Associates iii
Table 5-2 Gas demand scenarios, Eastern Australia ______________________________ 21
Table 5-3 Gas reserves and potential discoveries to 2025 (PJ)______________________ 22
Table 6-1 Contracted gas available to major buyers, RBP only (PJ) _________________ 28
Table 6-2 RBP transportation agreements ______________________________________ 28
Table 8-1 Gas-fired generator costs ____________________________________________ 32
Table 8-2 Cumulative new gas-fired generating capacity to 2020 (MW)_____________ 34
Table 8-3 Generation gas load, RBP Corridor (PJ) _______________________________ 35
Table 8-4 Generation gas load using the RBP (PJ)________________________________ 36
Table 8-5 Non-coincident generation peak loads on RBP (TJ/day) _________________ 37
Table 8-6: MMA forecasts for Energex network flow through the RBP (PJ) __________ 39
Table 8-7: MMA forecasts for Envestra Brisbane network flow through the RBP (PJ)__ 41
Table 8-8 Large user annual usage forecast (PJ) _________________________________ 44
Table 8-9 Non-coincident large user peak load forecast (TJ/day) __________________ 45
Table 9-1 Base Case growth rates _____________________________________________ 51
LIST OF FIGURES
Figure 2-1 Roma Brisbane Pipeline schematic_____________________________________ 4
Figure 5-1 Gas resources and infrastructure, Eastern Australia _____________________ 20
Figure 5-2 Eastern Australian aggregate gas demand scenarios (PJ)_________________ 21
Figure 5-3 Average delivered gas prices ($2005) _________________________________ 24
Figure 5-4 New GSA delivered prices ($2005)____________________________________ 24
Figure 8-1 Energex actual and forecasts and MMA forecasts (PJ) ___________________ 38
Figure 8-2 Envestra actual and trend forecasts and MMA forecasts for Brisbane (PJ) __ 40
Figure 8-3 Actual and forecast annual RBP throughput (PJ)________________________ 46
Figure 8-4 Actual and forecast total non-coincident RBP peak usage (TJ/day)________ 46
Figure 8-5 Actual and forecast RBP contracted capacity (TJ/day)___________________ 47
Figure 8-6 Actual and forecast RBP haulage distances (km)________________________ 48
Figure 8-7 RBP Capacity requirements and hypothetical profile ____________________ 49

REPORT TO ACCC
Ref: J1316, 7 February 2006 McLennan Magasanik Associates iv
Figure 8-8 Estimated actual and forecast Peat lateral throughput (PJ) _______________ 50
Figure 9-1 High and Low Case annual RBP throughput (PJ) _______________________ 53
Figure 9-2 High and Low Case non-coincident RBP peak usage (TJ/day) ____________ 53

REPORT TO ACCC
Ref: J1316, 7 February 2006 McLennan Magasanik Associates v
EXECUTIVE SUMMARY
The Australian Competition and Consumer Commission (ACCC) has engaged McLennan Magasanik Associates (MMA) to provide advice in relation to volume forecasts for the Roma Brisbane Pipeline (RBP). MMA’s forecast has been prepared independently of any forecast prepared by or for the RBP, including forecasts submitted to the ACCC in conjunction with the revised RBP Access Arrangement on 31January 2006.
Annual throughput
Base case actual and forecast total annual RBP throughputs are illustrated in Figure E-1. Total throughput is projected to grow from 48 PJ in 2005 to 73 PJ in 2011, at the expected end of the new access arrangement period. Further modest growth is projected to 2016, after which the anticipated growth of generation at Swanbank stimulates a rapid rise to over 100 PJ p.a. from 2018. Growth of generation usage is concentrated in this period because earlier gas-fired generators in the RBP corridor are expected to obtain supply directly from coal seam gas producers, by-passing the pipeline.
It is noted that the forecasts are based upon the assumption that RBP capacity will be expanded to meet demand. If timely expansion does not take place some load growth will be lost, principally in the generation sector.
Figure E-1 Actual and forecast annual RBP throughput (PJ)
0
20
40
60
80
100
120
2001
2003
2005
2007
2009
2011
2013
2015
2017
2019
2021
2023
2025
PJ
Generation
Large Users
Distribution

REPORT TO ACCC
Ref: J1316, 7 February 2006 McLennan Magasanik Associates vi
Non-coincident peak usage
Actual and forecast total non-coincident RBP peak usage are illustrated in Figure E-2. The growth pattern is very similar to that for total throughput. Non-coincident peak usage is projected to grow from 216 TJ/day in 2005 to 275 TJ/day in 2011, at the expected end of the new access arrangement period. Between 2016 and 2018 peak usage is expected to grow to over 400 TJ/day due to the anticipated growth of generation at Swanbank.
Figure E-2 Actual and forecast total non-coincident RBP peak usage (TJ/day)
0
50
100
150
200
250
300
350
400
450
2001
2003
2005
2007
2009
2011
2013
2015
2017
2019
2021
2023
2025
TJ/day
Generation
Large Users
Distribution
Contracted capacity
Contracted capacity forecasts have been estimated as follows:
• Using known transportation contracts for large users and the Braemar Power Station
• By assuming that capacity contracted for distribution loads will equal their peak requirements
• By assuming that Oakey will not contract any capacity and that, as it moves to baseload generation, Swanbank will want to fully contract its peak requirement

REPORT TO ACCC
Ref: J1316, 7 February 2006 McLennan Magasanik Associates vii
Actual and forecast contracted capacities are illustrated in Figure E-3. The forecast exceeds current capacity of 178 TJ/day, even if the Braemar contract for 16 TJ/day is excluded because it uses only a very short section of the pipeline. The consequences of capacity not being expanded to meet requirements are discussed below.
Figure E-3 Actual and forecast RBP contracted capacity (TJ/day)
0
50
100
150
200
250
300
350
400
450
2001
2003
2005
2007
2009
2011
2013
2015
2017
2019
2021
2023
2025
TJ/day
Forecast
Forecast ExclBraemar
Current RBPCapacity
Actual
Haulage distance
Actual and forecast RBP haulage distances are pictured in Figure E-4. The average distance hauled is projected to continue to decline owing to increasing receipts from CSG gas fields east of Wallumbilla and due to deliveries to the Braemar Power Station. The impact of removing Braemar from the calculation is also illustrated. The decline indicates a need for less full-distance incremental capacity than the contracted capacity shown in Figure E-3 would suggest and hence a lower cost of capacity.

REPORT TO ACCC
Ref: J1316, 7 February 2006 McLennan Magasanik Associates viii
Figure E-4 Actual and forecast RBP haulage distances (km)
250
300
350
400
450
2001
2003
2005
2007
2009
2011
2013
2015
2017
2019
2021
2023
2025
Km
Actual
Forecast ExclBraemar
Forecast
Impact of RBP capacity constraints
If the RBP capacity is not expanded to meet forecast requirements then the forecast volumes of gas will not flow. This may significantly impact the first two years of the forecasts, since there do not appear to be any immediate plans for expansion, unless the pipeline has the ability to carry more than its nominal capacity of 178 TJ/day.
The loads that will be most impacted will be the Oakey Power Station, which is assumed to have no contracted capacity, and possibly Swanbank E Power Station, for which the currently contracted capacity is not known precisely.
High and Low Cases
High and Low Case forecasts have been constructed to illustrate alternative potential outcomes. High and Low Case throughput and peak usage are compared with Base Case values in Figure E-5 and Figure E-6. At the expected end of the next access period in 2011 the High Case throughput is 9% higher than the Base Case and the Low Case is 9% lower than the Base Case. By 2025 the High Case throughput is 39% higher than the Base Case and the Low Case is 34% lower than the Base Case. Variations in non-coincident peak load are similar.

REPORT TO ACCC
Ref: J1316, 7 February 2006 McLennan Magasanik Associates ix
Figure E-5 High and Low Case annual RBP throughput (PJ)
0
20
40
60
80
100
120
140
160
180
2001
2003
2005
2007
2009
2011
2013
2015
2017
2019
2021
2023
2025
PJ
High
Base
Low
Actual
Figure E-6 High and Low Case non-coincident RBP peak usage (TJ/day)
0
100
200
300
400
500
600
2001
2003
2005
2007
2009
2011
2013
2015
2017
2019
2021
2023
2025
TJ/day
High
Base
Low
Actual

REPORT TO ACCC
Ref: J1316, 7 February 2006 1 McLennan Magasanik Associates
1 INTRODUCTION
The Roma to Brisbane Pipeline (RBP, also known as the Wallumbilla to Brisbane Pipeline), is owned by APT Petroleum Pipelines Limited (APTPPL), a subsidiary of the Australian Pipeline Trust. The RBP is a covered pipeline under the National Third Party Access Code for Natural Gas Pipeline Systems (the Code), under which covered pipelines are required to submit Access Arrangements (AAs), specifying the commercial terms under which third parties can use the pipeline, for regulatory approval. AAs have a fixed term, typically five years, after which a revised AA is submitted for approval. In the case of the RBP the revisions submission date is 31 January 2006 and the revisions commencement date is the later of 29 July 2006 and the date on which the approved revisions take effect under the Code.
Demand1 forecasts have played a significant role in determining the reference tariffs applicable to many covered pipelines:
• Demand is a significant determinant of future capital and operating costs used to estimate the regulated revenue
• Demand acts as a divisor of regulated revenue in setting the tariffs
The Australian Competition and Consumer Commission (ACCC), which is the relevant regulator for the RBP, in recognition of the importance of demand forecasts, has engaged McLennan Magasanik Associates (MMA) to provide advice in relation to volume forecasts for the RBP. The ACCC requires the advice to:
• Cover both throughput and capacity requirements
• Cover both the anticipated period applicable to the revised RBP access arrangement to be submitted to ACCC in January 2006 (five years from 1/7/06 to 30/6/11) and a longer term (twenty year) period.
This report documents MMA’s analysis of available information regarding historical and future usage of the RBP and MMA’s forecast methodology, assumptions and results. The forecast has been prepared independently of any forecast prepared by or for the RBP and, unlike the majority of demand forecast reports prepared for energy regulators, does not contain a critique of any forecast prepared by or for the RBP. It is understood that the ACCC will require a separate review of APTPPL’s forecasts submitted with its Access Arrangement revisions. At the time of completing this report MMA has not sighted the Access Arrangement revisions.
1 Demand has two components, throughput and capacity requirement. The term throughput is generally used to mean
(annual) quantities carried (in PJ). The daily capacity requirement is the sum of capacity reservations by customers (MDQ, measured in TJ/day).

REPORT TO ACCC
Ref: J1316, 7 February 2006 McLennan Magasanik Associates 2
1.1 Conventions In this report:
1. All years are financial years unless otherwise stated. In tables financial years are denoted 2005/06 etc or referred to as the financial year ending on June 30. In figures 2006 refers to the financial year ending on June 30 2006.
2. Historical prices are in dollars of the relevant year.
3. Projected prices are in July 2005 dollars.
1.2 Abbreviations and glossary of terms
AA Access Arrangement - document governing terms of third party access to pipelines
APTPPL APT Petroleum Pipelines Limited, owner of the RBP
Backward haul Transportation service in the direction opposite to the physical flow on the pipeline
Coincident peak load Maximum simultaneous daily demand by users
Conventional gas Natural gas produced from hydrocarbon reservoirs in sandstone formations
CSG Coal seam gas – natural gas adsorbed in coal seams and released by drilling
Dry gas Natural gas with liquid components removed
End user Consumer of gas
Firm capacity Pipeline capacity reserved by and paid for a user
Forward haul Transportation service in the direction of physical flow on the pipeline
FRC Full retail competition
Gas Natural gas, a mixture predominantly of methane, also containing other hydrocarbons and inert gases
GJ Gigajoule (joule x 109)
GECS Queensland Gas Electricity Certificate Scheme
GSA Gas supply agreement

REPORT TO ACCC
Ref: J1316, 7 February 2006 McLennan Magasanik Associates 3
Interruptible capacity Pipeline capacity used and paid for when it is available
LF Load factor – average daily load / peak daily load
MDQ Maximum daily quantity – the pipeline capacity reserved by a user
Non-coincident peak load
The sum of individual user peak daily demands
Park and loan service Pipeline service in which a user stores gas in the pipeline for a period before withdrawal (parking) or withdraws and then replaces (loan)
Pipeline gas Dry gas of pipeline or merchantable quality
PJ Petajoule ((joule x 1015)
RBP Roma-Brisbane Pipeline
TJ Terajoule ((joule x 1012)
UAFG Unaccounted for gas – the difference between gas receipts and deliveries
User Party that contracts to use the RBP
Wet gas Gas still containing liquids

REPORT TO ACCC
Ref: J1316, 7 February 2006 McLennan Magasanik Associates 4
2 BACKGROUND
2.1 The Roma-Brisbane Pipeline The RBP system comprises a 438 km pipeline from Wallumbilla, 40 km south of Roma in south-central Queensland, to Gibson Island, east of Brisbane and a 126km lateral pipeline (the Peat lateral) connecting coal seam gas receipt points to the pipeline near Condamine, 100km west of Wallumbilla (Figure 2-1). The Peat lateral was not initially a covered pipeline but following consultation with the ACCC APTPPL elected to treat it as part of the covered pipeline (the RBP) from 1 January 20062. The revised access arrangement will therefore apply to the whole RBP system. The focus of this report is nevertheless the 438km “mainline”, which delivers gas to users.
Figure 2-1 Roma Brisbane Pipeline schematic
(Public version – confidential text deleted)
Source: APTPPL
The RBP transports gas produced in the Bowen, Cooper and Surat Basins to gas markets in regional areas along its corridor, such as at Dalby, and in the Brisbane area. The RBP is the sole pipeline providing this service but some bypass pipelines are planned (please refer to bullets below). The broader gas demand-supply context in Eastern Australia is described in section 5.3.
2 The Peat lateral is now listed as regulated by the ACCC on the Code Registrar website, www.coderegistrar.sa.gov.au

REPORT TO ACCC
Ref: J1316, 7 February 2006 McLennan Magasanik Associates 5
The RBP has multiple receipt points, including:
• Wallumbilla, where gas is transferred from the pipeline from Ballera to Wallumbilla (the South West Queensland Pipeline) and from the pipeline from Gladstone to Wallumbilla (the Alinta Pipeline) and where gas is injected from local Surat Basin gasfields
• Scotia and Woodroyd on the lateral pipeline, where gas is received from the Scotia and Peat coal seam gasfields
• New receipt points in the Kogan area, 160 km west of Wallumbilla, for gas from the Argyle, Berwyndale South and Kogan North coal seam gasfields. It is understood that the gas producers will construct and own laterals connecting these fields to the RBP. The producers also plan to connect their fields directly to customers in the Kogan/Dalby region, by-passing the RBP.
The RBP also has multiple delivery points, including:
• Seven offtakes into Energex distribution networks serving both small and large users
• Five offtakes into Envestra distribution networks serving both small and large users
• An offtake into the Dalby distribution network
• Offtakes for the power stations at Oakey, Swanbank and Braemar (under construction)
• Offtakes for large users Incitec and BP
The pipeline comprises two parallel pipes:
1. A 404 km DN 400 pipe (400 mm diameter) with a maximum operating pressure of 9,500 kPa ending at the Swanbank offtake
2. A 438 km DN 250 pipe with a maximum operating pressure of 7,136 kPa ending at the Gibson Island offtake. The last 40 km of this pipe are DN 300.
The two lines are interconnected at three points and both lines have three compressors. In this configuration the pipeline is stated to have a nominal capacity of 178 TJ/day though the conditions applicable to this figure are not described in available APTPPL documentation, for example:
• The gas receipt and delivery configurations
• The initial linepack and hourly receipt and delivery profiles
• Whether this is an absolute maximum corresponding to all compressors being fully operational or a fully risked value allowing for some compressor outages.
Capacity can be increased by further compression or duplication.

REPORT TO ACCC
Ref: J1316, 7 February 2006 McLennan Magasanik Associates 6
2.2 Application of the Code to the RBP Although the RBP is a covered pipeline, its current AA was not subject to the full process of approval by the ACCC. The Queensland gas access regime, established under the Gas Pipelines Access (Queensland) Act 1998 (QGPAA), established derogations affecting major transmission pipelines in Queensland, relating to the setting of reference tariffs. The reference tariffs for the RBP and other Queensland pipelines were taken from the then existing access principles and were not subject to public or ACCC scrutiny but the non-tariff matters were considered by the ACCC under the normal process. It is noted that the National Competition Council has recommended that the Queensland Regime is not an effective access regime according to the relevant principles set out in clauses 6(2) to 6(4)(p) of the Competition Principles Agreement3.
From a tariff-setting perspective, the revised RBP AA is therefore effectively an initial AA. In 1999/2000 the ACCC reported to the National Competition Council on the tariff outcomes for the Queensland pipelines but this analysis was based on limited information as the pipeline owners were not obliged to provide the information required under the Code, including:
• The initial capital base
• Forecast capital and non-capital investment
• Depreciation schedules
• The appropriate rate of return
• System capacity and volume (throughput) assumptions
The Access Arrangement Information (AAI) accompanying the revised AA will reveal this information for the first time.
2.3 RBP reference tariffs The RBP reference tariffs apply to services provided from the first 101 TJ/day of reserved capacity. Negotiated tariffs are applicable to services provided from capacity between 101 TJ/day and 178 TJ/day.
The RBP reference tariffs applicable to a service vary according to the capacity being reserved for that service. As at 1 July 2002 services provided from the first 78.9 TJ/day of pipeline capacity were charged at the reservation and throughput rates shown in Table 2-1. Services provided from capacity between 78.9 TJ/day and 101 TJ/day were charged an additional surcharge which varies with load factor (LF). The capacity levels of 78.9 TJ/day and 101 TJ/day relate to the pipeline capacity as it was in 1995 and 1997
3 Queensland Access Regime for Gas Pipeline Services. Final Recommendation. November 2002. National Competition Council

REPORT TO ACCC
Ref: J1316, 7 February 2006 McLennan Magasanik Associates 7
respectively, when the price structures were established. Tariff charges escalate quarterly at 75% of CPI and other charges such as overrun and imbalance charges also apply.
Table 2-1 RBP Reference Tariffs 1 July 2002
$/GJ
Capacity reservation rate $0.2582
Throughput rate $0.1482
Surcharge: LF < 1.6 $0.3984
Surcharge: 1.6 <=LF <= 2.0 $0.4647
Surcharge: LF > 2.0 $0.5087
This tariff structure results in a considerable variance in charges between users of different capacity, from a low of approximately $0.43/GJ in 2005 terms for a 100% LF user, to $0.86/GJ with the surcharge for an equivalent user. It is understood that negotiated tariffs for firm service have been similar to the surcharge level. The structure may be varied in the revised AA, for example a single reference tariff comprised of capacity reservation and throughput rates may be applied to all capacity, including capacity expansions.
The impact of reference tariffs on demand in the short to medium term may be limited however as most of the relevant capacity is subject to long-term contracts. In addition, RBP tariffs comprise a relatively small component of the delivered cost of gas. For large users purchasing CSG at $2.50-$3.00/GJ the RBP tariff represents 22% to 26% of delivered costs and for small users, for which gas supply, distribution and retail costs are up to $20/GJ, the RBP tariff represents only 6% of delivered costs. The low cost of CSG compared to Cooper Basin gas (over $3.50/GJ at Roma) is currently reducing large users costs more significantly than any change in RBP tariffs is likely to (MMA projections of wholesale gas prices are discussed in more detail in section 5.3).
For forecasting purposes it has been assumed that RBP tariffs for existing capacity continue to escalate at 75% of CPI and that charges for new capacity are approximately $0.90/GJ for high load factor users.
Potential tariff changes that impact on the requirements of RBP gas forecasts include:
• There is currently a single tariff that does not vary with receipt/delivery point. Introduction of multiple tariffs or distance based tariffs requires information on the average haulage distance.
• Similarly there is only a forward-haul tariff. Backward-haul from the receipt point for Scotia-Peat gas or from other CSG fields receipt points to Roma may become a significant service requirement.
Actual and forecast haulage distances are discussed in sections 4.7 and 8.7 respectively.

REPORT TO ACCC
Ref: J1316, 7 February 2006 McLennan Magasanik Associates 8
3 METHODOLOGY
3.1 Code requirements The Gas Access Code requires forecasts submitted by service providers as part of an Access Arrangement to be “…best estimates arrived at on a reasonable basis” (Code section 8.2). MMA interprets this to have two components:
• That the approach and methodology adopted are reasonable.
• That any assumptions used should be the best available.
In preparing forecasts of RBP throughput and capacity requirements we have endeavoured to meet these requirements. Appropriate methodologies have been identified for three distinct end-user categories, generation, distribution load and large users, and assumptions have been based on careful interpretation of historical data and forward contract information.
3.2 Overall approach The approach to preparing this forecast reflects the fact that from a reference tariff perspective the revised AA is essentially a first AA and there has been no historical information in the public arena. The key steps in our approach have been to:
1. Request historical throughput and peak day usage information from APTPPL
2. Collect and review other information
3. Determine and project the key drivers, including economic forecasts and wholesale gas prices
4. Interview pipeline users
5. Project generation use of gas using MMA models of the NEM
6. Project non-generation use using historical information and econometric models
7. Construct High and Low Case forecasts for each user category

REPORT TO ACCC
Ref: J1316, 7 February 2006 McLennan Magasanik Associates 9
4 ACTUAL USAGE
4.1 RBP Users The RBP has limited number of current and scheduled users who contract directly for RBP capacity:
• The South West Queensland Joint Venture producers, who supply gas on a delivered basis to Dalby Council, Energex Retail, Origin Energy and Incitec-Pivot. Energex and Origin are also users in their own rights.
• Energex Retail, which supplies the majority of gas users on the Energex (Allgas) network and competes for sales to contestable customers (currently those using over 1 TJ pa)
• Origin Energy, which supplies the majority of gas users on the Envestra network, supplies BP Bulwer Island Refinery and competes for sales to contestable customers
• Swanbank E power station, a 385MW combined cycle gas fired generator currently operating in an intermediate generation role. It is understood that the Oakey power station, a 320 MW open cycle peaking plant, obtains supply and RBP capacity via Energex and Origin rather than contracting directly.
• BP Bulwer Island Refinery, which has an additional supply agreement scheduled to start on 1 January 2006, for which it is understood to have contracted RBP capacity directly
• Incitec-Pivot, which has replacement supply agreements scheduled to start on 1 July 2007, for which it is understood to be contracting RBP capacity directly
• Braemar power station (also known as Wambo PS), a 450 MW open cycle generator under construction at Braemar approximately 160 km east of Wallumbilla. Braemar PS has recently entered contracts for gas supply and transmission capacity that are scheduled to start in the June quarter of 2006.
In view of the uncertainty as to which RBP users will supply which end-users in future, analysis of historical demand and forecast preparation are more readily undertaken on an end-use basis rather than on the basis of the parties that contract RBP capacity. The most suitable end-user disaggregation, based on data availability and commonality of gas usage drivers, is:
• Gas-fired generators: Swanbank E, Oakey and Braemar
• Distribution load: Energex and Envestra

REPORT TO ACCC
Ref: J1316, 7 February 2006 McLennan Magasanik Associates 10
• Large users: Incitec-Pivot and BP
4.2 Gas – fired generation Actual annual and peak day gas usage by the two existing generators, Oakey and Swanbank E, has been estimated using their generation data published by NEMMCO and MMA estimates of their average heat rates in GJ/MWh (Table 4-1). It is noted that peak day usage is the actual peak usage, which for generators may not be a good indication of capacity contracted on the RBP. The cost of firm capacity to a peaking generator such as Oakey, which has a gas load factor less than 15%, would be over $5/GJ, making it more economic to rely upon interruptible capacity and/or spot sales – it is understood that no firm transportation contracts are held by or for Oakey. For an intermediate generator such as Swanbank E, with a gas load factor of approximately 50%, firm capacity would be more economic at $2/GJ but it is nevertheless likely that they would only contract part of their requirement and would rely in part on interruptible capacity.
Table 4-1 Estimated actual gas usage by South East Queensland Generators
2000/01 2001/02 2002/03 2003/04 2004/05
Annual (PJ)
Swanbank E N/a 0.13 4.99 4.98 9.81
Oakey 0.11 0.06 0.05 0.47 1.13
Peak Day (TJ)
Swanbank E N/a 24.7 40.9 32.2 53.1
Oakey 5.9 3.8 7.6 12.9 24.5
Load factor (%)
Swanbank E N/a 1% 33% 42% 51%
Oakey 5% 4% 2% 10% 13%
Gas use by Swanbank E increased markedly in 2004/05, largely due to the commencement of the Queensland Gas Electricity Certificate scheme (GECS) on 1 January 2005. GECS requires electricity retailers in Queensland to source 13% of their supply from gas-fired generation – this obligation is fulfilled by retailers by surrendering certificates purchased from generators. The current (17 January 2006) value of GECS is $15.71/MWh, which reduces the net marginal cost of Swanbank E’s generation to a level comparable with older coal fired plant.
The value of GECS enabled Swanbank E to extend its generation in 2005. In calendar 2004 it had a typical pattern of generating 12 hours a day for 5 days a week, i.e. weekdays only,

REPORT TO ACCC
Ref: J1316, 7 February 2006 McLennan Magasanik Associates 11
mostly between 8am and 8pm, averaging 63 hours per week. In 2005 this changed to generating for up to 24 hours a day for 5 days (weekdays, with lower generation levels overnight) and 12 hours for 1 day (Saturday), averaging 124 hours per week. Calendar year consumption rose from 7.0 PJ in 2004 to 12.1 PJ in 2005. The average output when generating was approximately 270 MW in 2004 and 240 MW in 2005, considerably below the plant’s maximum output of 385 MW, which suggests that further increases in gas usage are possible if generation at higher levels overnight and at the weekend are economic.
The pattern of gas usage by Oakey reflects both the availability of gas/transmission capacity and variations in peak electricity prices. The low usage figures in the first two years are believed to reflect RBP capacity constraints whereas the third year figure was due to low electricity prices. Higher usage in the final two years is due to the availability of additional RBP capacity and higher electricity prices. In the immediate future, with the RBP again nearing full capacity utilisation, Oakey’s usage would be expected to decline until a further capacity expansion was undertaken and this is reflected in its calendar 2005 usage which was at 2002/03 levels. It is also noted that as a less efficient open cycle plant with higher marginal costs, the sale of GECs does not reduce Oakey’s marginal costs to levels comparable with coal plant.
4.3 Distribution load Estimated actual annual and peak day distribution loads have been derived from annual load data provided by the distribution businesses in their Access Arrangement Information (AAI) documents submitted to the Queensland Competition Authority4. The Energex AAI document provides only historical growth rates rather than actual usage, hence the Energex estimates represent smoothed trends. Estimates for Dalby, where the network is not covered by the Code and there is no recent public information, are based on submissions to the NCC regarding coverage revocation.
Estimates of unaccounted for gas (UAG, gas losses and measurement errors) on the networks have been added to load delivered by the networks to determine loads delivered by the RBP. UAG estimates are based on data for 2004/05 provided by the distribution businesses5. In the case of the Envestra network, load and UAG associated with the Northern network in the Gladstone area has been excluded.
Peak day loads have been derived from annual loads using load factors derived from AAI data. In the case of distribution loads, peak day usage gives a good indication of the likely capacity contracted on the RBP.
4 Access Arrngement Information for the Queensland Network. Allgas Energy Pty Ltd, 1 October 2005. Forecasts of Demand for the Queensland Regulated Natural Gas Distribution Network (AAI attachment 6). Envestra, September 2005 5 Gas Distribution Service Quality Annual Report July 2004 to June 2005. Allgas Energy, September 2005.
Envestra Service Quality Report 2004/2005. Envestra, 2005.

REPORT TO ACCC
Ref: J1316, 7 February 2006 McLennan Magasanik Associates 12
Table 4-2 Estimated actual distribution loads
2000/01 2001/02 2002/03 2003/04 2004/05
Annual (PJ)
Energex 9.94 10.06 10.18 10.31 10.44
Envestra 4.35 4.35 4.67 4.90 5.22
Dalby 0.15 0.15 0.15 0.15 0.15
Peak Day (TJ)
Energex 43.2 43.8 44.4 45.1 45.8
Envestra 19.1 19.1 20.5 21.6 22.9
Dalby 0.8 0.8 0.8 0.8 0.8
Load growth over the period 2000/01 to 2004/05 on the Energex network has been relatively modest at 1.2%, but Envestra’s load growth has been stronger, at 4.7%, largely due to growth in large customer load.
4.4 Large Users Details regarding Incitec-Pivot’s and BP’s annual and peak loads over the period 2000/01 to 2004/05 are not available. Based on an Incitec Pivot publication6 it is understood that its current figures are 13-14 PJ annually and approximately 38 TJ/day peak.
MMA estimates of BP’s consumption are presented in the following section.
4.5 Total throughput APTPPL has provided total annual throughput for the period 2000/01 to 2004/05, from which combined large user consumption has been estimated by subtracting generator and distribution loads (Table 4-3).
Table 4-3 RBP actual annual throughput (PJ) 2000/01 2001/02 2002/03 2003/04 2004/05
Total RBP 30.02 34.16 40.00 42.14 48.07
Generators 0.11 0.18 5.03 5.45 10.94
Distribution 14.44 14.56 15.00 15.38 15.81
6 Queensland Gas Market and Assessments . A Customer’s Perspective. Arthur Pitts, Gas Purchasing Manager, Incitec-Pivot
Ltd. EUAA Queensland Energy Seminar 30 October 2003

REPORT TO ACCC
Ref: J1316, 7 February 2006 McLennan Magasanik Associates 13
Large Users 15.47 19.42 19.97 21.31 21.32
Total RBP throughput has grown by 12.5% p.a. over the period and large user consumption has grown by 7.5% p.a. The latter growth has been largely at BP, which only connected to gas in 1999/00 – if it is assumed that Incitec-pivot’s load was constant at 13 PJ through the period, then BP’s load must have grown from 2.5 PJ to 8.3 PJ.
4.6 Peak usage and contracted capacity The sum of estimated non-coincident peak loads is presented in Table 4-4. The peak loads of Incitec-Pivot and BP are based on the application of simple load factors to the loads hypothesized above.
The simple sum of peak requirements is considerably higher than the sum of contracted capacity (Table 4-5, data provided by APTPPL). This is due to the non-coincidence of peak loads, particularly generator and large user peaks.
Table 4-4 Estimated actual non-coincident peak loads (TJ/day)
2000/01 2001/02 2002/03 2003/04 2004/05
Swanbank E 0.0 24.7 40.9 32.2 53.1
Oakey 5.9 3.8 7.6 12.9 24.5
Energex DB 43.2 43.8 44.4 45.1 45.8
Envestra DB 19.1 19.1 20.5 21.6 22.9
Dalby 0.8 0.8 0.8 0.8 0.8
Incitec-Pivot 38.7 38.7 38.7 38.7 38.7
BP 9.0 23.5 25.5 30.4 30.4
Total 116.8 154.4 178.3 181.7 216.3
Table 4-5 Contracted RBP capacity (TJ/day)
2000/01 2001/02 2002/03 2003/04 2004/05
Total 100.5 109.6 158.7 160.5 175.1
Estimates of RBP capacity contracted for each load in 2004/05 have been derived by assuming that: DB and large user requirements are contracted; that because it is a peaking plant with very low load factor, no capacity is contracted for Oakey; and that the

REPORT TO ACCC
Ref: J1316, 7 February 2006 McLennan Magasanik Associates 14
remaining capacity is contracted for Swanbank E. (Note: no assumptions are made regarding which shippers are parties to the relevant contracts.)
Table 4-6 Estimated RBP capacity contracts (TJ/day)
On behalf of 2004/05
Swanbank E 34
Oakey 0
Energex DB 46
Envestra DB 23
Dalby 1
Incitec-Pivot 39
BP 32
Total 175
It is also noted that the RBP load factor (defined as average daily load/contracted capacity) declined significantly in 2002/03 and then partly rebounded, suggesting that the large capacity additions and contracts in 2002/03 were not initially fully utilised (Table 4-7).
Table 4-7 RBP load factor (%)
2000/01 2001/02 2002/03 2003/04 2004/05
Total 82% 85% 69% 72% 75%
4.7 Haulage Distance The average distance that gas is hauled along a pipeline provides further insights into its capacity utilisation, since gas travelling a shorter distance is using less capacity than gas travelling a longer distance. Average distance estimates are also necessary to estimate distance based tariffs if these are introduced.
Haulage distance has been estimated taking into consideration both the different receipt points at Wallumbilla and the Scotia/Woodroyd lateral some 101 km west of Wallumbilla and the different delivery points (Table 4-8). The average haulage distance has been declining due to the growth of receipts from the Scotia/Woodroyd lateral. Estimates of Peat lateral actual and forecast receipts are provided in section 8.9.

REPORT TO ACCC
Ref: J1316, 7 February 2006 McLennan Magasanik Associates 15
Table 4-8 Estimated RBP haulage distance (km)
2000/01 2001/02 2002/03 2003/04 2004/05
Total 418 406 393 389 379

REPORT TO ACCC
Ref: J1316, 7 February 2006 McLennan Magasanik Associates 16
5 KEY DRIVERS AND ASSUMPTIONS
5.1 Introduction The key drivers of each major RBP load are different:
• Power generation load depends upon the competitive positions of gas-fired generation in the NEM, including gas price effects
• Distribution load is driven by economic growth factors such as state product and housing growth
• Large user load is driven by user specific factors
The followings sections document the key non-user specific factors that drive load growth. User specific issues are covered in section 8.
5.2 Economic outlook In assessing the general economic outlook over the next five or six years MMA has utilised recent forecasts prepared for the Queensland gas distribution business Access Arrangement reviews7, which is in part based upon forecasts by Econtech and the National Institute of Economic and Industry Research (NIEIR). MMA has also utilised various economic and demographic indicators from the Australian Bureau of Statistics (ABS) and the Queensland Department of Local Government and Planning including Gross State Product (GSP) and historical population and housing statistics.
Over the past few years growth in Queensland has been strong. Between 1998 and 2005 the Queensland economy grew by about 5% pa, significantly higher than the Australian economic growth rate of 3.5%.
Econtech has forecast domestic demand in Australia to weaken in 2005/06 due to slower growth in private consumption and a further weakening of the housing market. However, the external sector is expected to rebound. High commodity prices and a downward correction in the Australian dollar should stimulate an improved contribution of net exports to growth in the years ahead. Queensland, as a state with significant exposure to mining, agriculture and tourism, is expected to benefit from the improvement in the external sector.
After a low estimated growth rate in 2004/05 of 2.5%, Econtech has forecast Queensland GSP to grow by 4.1% per annum to 2011 compared to the Australian GDP average growth of 3.3% pa over the same period. Over the same period NIEIR has forecast that the Queensland GSP would grow by 3.8% pa, a little slower than the Econtech forecast. While
7 Final Report to Queensland Competition Authority – Demand Forecasts for Envestra. MMA, 22 November 2005, and
references therein.

REPORT TO ACCC
Ref: J1316, 7 February 2006 McLennan Magasanik Associates 17
the Queensland economy is fairly broadly based, a number of sectors are particularly important. These include the tourism, agriculture, mining and metals sectors. The state’s manufacturing sector relies more heavily on commodity type exports than the rest of Australia. The Queensland economy is thus relatively exposed to changes in the global economic environment.
Table 5-1 provides a summary of the Queensland economic growth outlook to 2011.
Table 5-1 Queensland Economic Outlook (% Growth)
Actual Est Forecast
Fin Year ending June 2004 2005 2006 2007 2008 2009 2010 2011
Private consumption 8.5 5.5 4.6 4 3.3 2.5 2.6 3.2
Private Investment
- In dwellings 12.2 5.1 3.5 5.7 -0.8 -1 3.1 -0.5
- In other building & structures -0.3 15.4 8.9 5.2 5 3.3 2.8 2.4
- In machinery & equipment 12.8 14.1 3.8 5.2 5.5 3 2.3 2.2
GSP 5.8 2.5 4.9 5.8 4.7 3.2 3.3 3.0
Employment 3.1 4.9 2.4 2.8 2.5 1.4 1.1 1.1
Population 2.2 1.8 1.9 2.1 2.2 1.9 2.0 Source: Final Report to Queensland Competition Authority – Demand Forecasts for Envestra. MMA, 22 November 2005
5.2.1 Population and housing growth
Population in Queensland has consistently grown faster than in the rest of Australia over the last few decades. Although the growth rate slowed in the mid 1990s it accelerated again in the early 2000s, with growth of about 2.2% to 2.5% pa over the past few years. The return to strong population growth has been due to strong net population inflows from both overseas and interstate.
According to NIEIR8, Queensland population growth over the next few years and to 2011 is expected to be around 2.1% pa. While this growth rate is expected to be faster than the Australian average growth rate of about 1% over the same period, it is below the level experienced in the early 1990s when growth of around 2.5% pa was realised. It can be expected that the South East Queensland (SEQ) region will enjoy higher population growth rates than Queensland as a whole given that this region is continuing to experience a higher share of interstate and international migration than other parts of the state. This
8 Economic Outlook for NEM States to 2014/15. NIEIR, May 2005.

REPORT TO ACCC
Ref: J1316, 7 February 2006 McLennan Magasanik Associates 18
is expected to result in a population growth in SEQ some 0.1% to 0.2% pa greater than in Queensland as a whole9.
Dwelling growth in the south east Queensland and Brisbane regions is forecast to grow by about 0.2% to 0.3% pa more than the change in population. This is because of a continuing trend towards smaller household sizes. A dwelling growth rate of about 2.4% to 2.5%% pa is forecast for the Brisbane region.
5.2.2 Private consumption expenditure
Private consumption expenditure in Queensland rose by a strong 8.5% in 2003/4. The strong rise in expenditure was supported by the strong growth in housing construction (12.1%), low nominal interest rates and stronger employment, income and population growth. These factors more than offset the negative impact of the drought.
The strong growth in private consumption expenditure is forecast to slow over the coming period to 2011. Higher nominal interest rates and declines in the household goods sector are expected to constrain Queensland’s private consumption expenditure growth to around 3.4% pa.
5.2.3 Dwellings investment
Private dwelling investment in Queensland rose by 12.2% in 2003/04. The boom in housing construction in Queensland was initially driven by the First Home Owner’s Grant and low nominal interest rates. The resumption of much stronger population growth in Queensland over recent years and stronger levels of investor activity has supported growth over the recent past.
While Queensland has avoided the large slowdown in residential investment affecting Victoria and NSW in 2004/05, private new dwelling investment in Queensland is nevertheless forecast to also slow to around 2.1% over the coming period.
5.2.4 Private business investment
Queensland private business investment in machinery and equipment rose by 12.8% in 2003/4 while investment in building and structures were relatively stable. Business investment in Queensland is expected to be supported by ongoing investment activity in the mining and manufacturing sectors.
Expenditure on machinery and equipment will be supported by the high Australian dollar and falling prices of information technology products and sustained high commodity prices. Any fall in commodity prices and further appreciations in the Australian dollar, however, could choke off growth in investment in Queensland over the medium term.
9 Final Report to Queensland Competition Authority – Demand Forecasts for Envestra. MMA, 22 November 2005.

REPORT TO ACCC
Ref: J1316, 7 February 2006 McLennan Magasanik Associates 19
Business investment in machinery and equipment is expected to grow by 4.0% pa and business investment in buildings and structures by 5.0% pa between 2006 and 2010.
5.2.5 Employment
Queensland’s employment growth has been very rapid over the last few years. Employment growth was 3.1% in 2003/04. Queensland’s industry employment has risen significantly in the construction and tertiary sectors. The key growth sectors within the tertiary sector are retail trade, property and business services, government administration and defence, health and community services and cultural and recreational services.
Queensland’s employment growth is forecast to slow to around 2.0% over the next period as construction employment falls and GSP growth slows somewhat.
5.2.6 Summary
Overall, the Queensland economy is expected to continue to outperform the Australian economy over the next regulatory period, but to slow somewhat from growth seen over the past few years. The Queensland Gross State Product is forecast to grow by 4.2% pa over the period to 2011 compared to a growth rate of about 5% pa between 1998 and 2005. Population growth is expected to slow a little to 2.1% pa, approximately in line with that experienced over the last decade.10 Dwelling investment is also forecast to fall from the high rates of growth recently although this is likely to be tempered in the Brisbane region with the area experiencing a larger share of interstate and international migration.
5.3 Eastern states gas demand-supply and price outlook
5.3.1 Gas resources and infrastructure
The gas resources and delivery infrastructure in Eastern Australia are illustrated in Figure 5-1. The SEA Gas pipeline from Port Campbell to Adelaide completed the integration of the South Eastern Australian gas transmission network in January 2004. Queensland is also indirectly linked to the South East through the Ballera-Moomba wet gas pipeline. The anticipated construction of a parallel dry gas line will consolidate this linkage.
10 ‘Housing Update, No 18’, Planning Information and Forecasting Unit, Qld Government, October 2005

REPORT TO ACCC
Ref: J1316, 7 February 2006 McLennan Magasanik Associates 20
Figure 5-1 Gas resources and infrastructure, Eastern Australia
In view of the interconnectedness of the Eastern states gas transmission network, it is essential to consider the demand-supply balance at this level rather than on a state-by state basis. MMA models the demand-supply balance across the Eastern States network using MMAGas, a Nash-Cournot game theory model of the Australian wholesale gas market that captures the essence of the long-term contract price formation process. An outline of MMAGas’ structure is provided in APPENDIX A . The following sections outline the key inputs to the demand-supply modelling process.
Northern Territory
Q ueensland
New South W alesSouth Australia
B ass S trait
W agg aW agga
A delaide
W hyalla
Alic e S prings
D arwin
B alleraB risbane
G lads tone
R ockham pton
M t Is a
M oom ba
M elbourne
Am adeus Basin
Otw ayBas in
B assB asin
G ipp slan dB asin
T owns ville
Victoria
Longford
R om a
Bow en/Surat Basin
CSM
B ell B ay
Cooper Basin
Tasm aniaH obart
Canberra
Papua New G uinea
N ewc as tle
W ollongong
CSM SydneyBasin
CSM GunnedahBasin
Sydney
M oranbah
M cLennan Magasanik Associates
Legend: C onvention al G asC oal S eam M ethan e
— E xist ing P ipelines- - - - Propos ed P ipelines
SW Q P
W G P
M SP
EGP
MA
P
SE AG AS
T G P
LT D
AlburyPt C am pbellSW P
NQG P
G ove
T imor Sea
R B P

REPORT TO ACCC
Ref: J1316, 7 February 2006 McLennan Magasanik Associates 21
5.3.2 Gas demand
Aggregate Eastern States gas demand projection scenarios, based on ABARE projections of “utility” load sectors (residential, industrial and commercial) and MMA projections of generation load derived from comprehensive modeling of the National Electricity Market, are illustrated in Figure 5-2 and Table 5-2.
Figure 5-2 Eastern Australian aggregate gas demand scenarios (PJ)
0
200
400
600
800
1000
1200
1400
1991
1993
1995
1997
1999
2001
2003
2005
2007
2009
2011
2013
2015
2017
2019
2021
2023
2025
PJ
High
Medium
Low
Historical
Table 5-2 Gas demand scenarios, Eastern Australia
Scenario Growth Rate 05-25
Total 2025 (PJ) Cum Total (PJ)
High 4.1% 1,278 20,003
Medium 3.3% 1,091 17,241
Low 2.1% 848 15,042

REPORT TO ACCC
Ref: J1316, 7 February 2006 McLennan Magasanik Associates 22
5.3.3 Gas reserves
Conventional gas reserve estimates, presented in Table 5-3, are based on Geoscience Australia11 figures updated for recent discoveries or revisions. Coal seam gas reserve estimates are based on producer estimates.
Future gas discoveries are by nature very difficult to estimate and highly speculative. Gas reserves are clearly ultimately finite but we believe that it will be many years before a reliable estimate of this ultimate level can be determined. A number of facts support this view:
• Continued growth in reserves and steady reserve/production levels
• Growing exploration expenditure
• Significant recent discoveries in the Otway basin - Thylacine/Geographe (800PJ) and Casino (300PJ) – in response to the newly available commercial opportunities
• Industry confidence that the CSG resource is becoming understood.
We have derived estimates of future discoveries at three levels: low, medium and high. Where published figures are available eg Geoscience Australia for the Gippsland Basin, these correspond to: 80% confidence that actual discoveries will exceed this level; 50% confidence; and 20% confidence. These figures represent discoveries over the next twenty years, assuming exploration expenditure is maintained at current levels. No estimates have been made for Papua New Guinea (PNG) as the current PNG reserves are unlikely to be depleted in the study time-frame. Potential discoveries in unexplored basins such as the Officer and Murray Basins are not considered.
Table 5-3 Gas reserves and potential discoveries to 2025 (PJ)
Reserves Potential discoveries
2P 20% Probability
50% Probability
80% Probability
Gippsland 7,829 6,133 3,850 1,742
Otway/Bass 2,535 2,666 1,617 743
Cooper 2,612 1,225 753 348
NSW CSG 500 434 253 144
Qld CSG 5,594 3,140 1,900 1,036
PNG 8,000
Total 27,070 13,598 8,374 4,013
11 Petrie E and others, Geoscience Australia (2005), Oil and Gas Resources of Australia 2003

REPORT TO ACCC
Ref: J1316, 7 February 2006 McLennan Magasanik Associates 23
Clearly, even in the absence of PNG gas, there are sufficient reserves and potential discoveries to meet all projected demand scenarios until 2025.
5.3.4 Gas price projections
Price projections for two demand-supply scenarios have been prepared for the purpose of projecting RBP throughput:
• PNG scenario – high demand, PNG gas supplied from 2010, P50 discoveries
• No PNG scenario - medium demand, no PNG development, P50 discoveries
Given the current status12 of the PNG project, it is not possible to state with confidence which of these scenarios is more likely, and both reflect plausible outcomes.
In calculating gas prices it is important to distinguish two price concepts:
• Average prices – the delivered (city gate) price averaged across all GSAs current at the time
• New GSA prices – the delivered price for new GSAs commencing supply at that time, excluding those which had already been concluded as at 1 January 2006. In MMAGas all new GSAs are assumed to have ten year term. Negotiation of new GSAs is assumed to take place one to four years prior to commencement of supply.
Figure 5-3 and Figure 5-4 illustrate MMAGas projections of average and new GSA prices respectively, in each of the two scenarios, for the Eastern states as a whole and specifically for the Brisbane market. All prices are for high load factor users.
Our projections show that average prices will initially decline, particularly in Brisbane where expensive legacy GSAs, entered during the mid-1990s when the Cooper Basin joint venture producers held an effective monopoly on supply to south east Queensland, are being progressively replaced by cheaper coal seam gas GSAs entered in a more competitive market. New GSA prices are expected to be relatively flat in real terms almost until 2020, after which they are expected to rise in both scenarios, in response to declining non-PNG reserves, which leads to declining producer competition. Average prices also rise after 2020.
In the Brisbane market the price difference between scenarios is limited and the average price rise by 2025 is just 25c/GJ, to $3.75/GJ, still below the 2006 average price. In terms of the demand impact, the lower prices available to the market would be expected to contribute to additional growth up to 2010, with limited effects thereafter until 2020, after which the price effect would be negative.
12 The project is currently seeking a threshold level of foundation customers, while detailed engineering design work is
undertaken. It is anticipated that a go/no go decision will be made during 2006.

REPORT TO ACCC
Ref: J1316, 7 February 2006 McLennan Magasanik Associates 24
Figure 5-3 Average delivered gas prices ($2005)
$3.00
$3.50
$4.00
$4.50
2006
2008
2010
2012
2014
2016
2018
2020
2022
2024
$/GJ
No PNG E States Ave
No PNG BNE Ave
PNG BNE Ave
PNG E States Ave
Figure 5-4 New GSA delivered prices ($2005)
$3.00
$3.50
$4.00
$4.50
2006
2008
2010
2012
2014
2016
2018
2020
2022
2024
$/GJ
No PNG E States New
No PNG BNE New
PNG BNE New
PNG E States New

REPORT TO ACCC
Ref: J1316, 7 February 2006 McLennan Magasanik Associates 25
5.4 RBP issues
5.4.1 Competition
RBP capacity is understood to be fully contracted at present and further market growth will require incremental capacity, which could be provided by expansion of the RBP or by new, competing pipelines along the same route or alternative routes, such as from Gladstone. Economics would appear to favour expansion of the RBP, since:
• RBP has relatively low cost expansion options through additional compression
• Competing pipelines would lack economies of scale, especially if market growth is slow
The possibility of a pipeline from Gladstone has been raised in conjunction with the PNG project. However PNG gas is likely to be most competitive with existing supplies in Townsville, Mt Isa, Gladstone and Ballera, and less competitive with CSG in Brisbane. Consequently the PNG east coast transmission pipeline is expected to end at Gladstone and if PNG gas is supplied to Brisbane, it will be transported to Wallumbilla via Gladstone and the Alinta Pipeline or via a new pipeline to Ballera and the SWQ Pipeline.
These considerations suggest that the RBP will retain its monopoly status over the forecast period, and this has been assumed in preparing the forecasts.
5.4.2 Capacity expansion
In line with the above, it is assumed that the RBP capacity is expanded to meet new loads in a timely manner if required. The impact of potential capacity constraints is discussed in section 8.8.
The tariffs applicable to capacity expansions are currently negotiable i.e. capacity expansion is not part of the reference service. Regardless of the future status of capacity expansions, it is assumed that the relevant tariff is similar to the current surcharge level of approximately $0.86/GJ for high load factor users.
5.4.3 Pipeline extension
It is understood that APTPPL has no plans to extend or connect the RBP to any new geographical markets. New pipelines have been proposed to link regions served by the RBP to New South Wales but are at a very early stage of planning and their impact on future RBP throughput has not been taken into consideration.

REPORT TO ACCC
Ref: J1316, 7 February 2006 McLennan Magasanik Associates 26
5.5 Gas full retail competition The majority of gas consumed in Queensland is used by large industrial users and generators which take supply directly from transmission pipelines. Such users have always had a choice of gas supplier as they have not been covered by distribution/retail franchises. The introduction of competion/supplier choice for gas users taking supply from distribution networks commenced on 1 July 2001 for users consuming over 100 TJ per year. Competition was extended to users consuming between 1 TJ and 100 TJ per year on 1 July 2005 and on 19 October 2005 the Queensland Government announced that contestability would be extended to all gas customers on 1 July 200713.
Full retail competition (FRC) holds the prospect of reducing prices for all users, and leading to increased usage, but for the 135,000 small Queensland customers a reduction may not become a reality. Gas retail prices to small users in Queensland have been below cost for some years and may still be below cost even though they were raised by 10% in both March and September 2005. After absorbing the not inconsiderable costs of implementing FRC, retail prices may at best remain static, with litle room for passing on the benefits of lower wholesale gas prices. For these reasons it is considered that FRC will have little impact on gas demand in Queensland.
13 www.energy.qld.gov.au/gas_markets.cfm

REPORT TO ACCC
Ref: J1316, 7 February 2006 McLennan Magasanik Associates 27
6 GAS SUPPLY AND TRANSPORTATION AGREEMENTS
6.1 Introduction The majority of gas is sold under long-term gas supply agreements (GSAs) between producers and buyers, including retailers, generators and large users. Particularly in Queensland, many GSAs involve the development of new gas resources and the GSAs are therefore entered several years before first supply, to enable the resources to be developed. In the short to medium term GSAs therefore provide useful indicators of both the supply outlook and the demand outlook, since buyers typically face a financial penalty if their demand falls below GSA take-or-pay levels.
Offsetting the value of this information is the fact that all GSAs are commercial-in-confidence legal documents, limited details of which are made public. The large majority are nevertheless reported, as they are material transactions which listed companies are obliged to notify to the market, through press releases issued by the gas producers. MMA maintains a comprehensive data base of GSAs covering the Eastern States of Australia and has developed considerable expertise in estimating the missing information.
Transmission capacity is also generally contracted under long term arrangements between the service provider (the pipeline owner) and gas shippers, which can be the producer or buyer. Reporting of transmission agreements is not as comprehensive as reporting of GSAs however.
6.2 Gas supply agreements The estimated aggregated quantities of gas available to current and known future users of the RBP under GSAs are summarised in Table 6-1. It includes only gas that will not by-pass the RBP and therefore excludes gas available to a number of proposed small open cycle gas-fired power stations (Chinchilla, proposed by Queensland Gas Company, Dalby, proposed by Ergon, and Daandine, proposed by Arrow), where it is anticipated that the gas will be transported directly to the power station, bypassing the RBP. The Braemar PS holds a further 10 PJ of GSAs which are also expected to bypass the RBP. There appear to be no GSAs between gas producers and the Oakey PS, which must therefore purchase gas from aggregators such as Energex and Origin.
The gas volumes listed in Table 6-1 are maximum quantities i.e. total usage under each contract would be expected to be slightly lower, the actual level depending on the take-or-pay volume. It is expected that most GSAs would have take-or-pay set at 80% to 90% of the maximum. Some GSAs do however provide for quantity renominations in the future.
The volumes contracted indicate potentially significant planned increases in gas use by Swanbank E power station (from 10 PJ in 2004/05 to 23 PJ in 2006/07) and BP (up from 9 PJ 2004/05 to 10.5 PJ in 2006/07). Incitec Pivot has a further 2PJ option available.

REPORT TO ACCC
Ref: J1316, 7 February 2006 McLennan Magasanik Associates 28
Table 6-1 Contracted gas available to major buyers, RBP only (PJ)
2005/06 2006/07 2007/08 2008/09 2009/10 2010/11
Swanbank E 17.4 23.0 23.0 23.0 22.3 20.0
Braemar PS 1.1 4.5 4.5 4.5 4.5 4.5
Energex Retail 15.6 15.3 12.5 12.6 12.7 13.0
Origin Energy* 6.5 6.7 6.9 7.0 7.2 7.6
Dalby 0.2 0.2 0.2 0.2 0.2 0.2
Incitec-Pivot 13.0 13.0 14.4 14.4 14.4 14.4
BP 9.0 10.5 10.5 10.5 10.5 9.0
Total 62.7 73.1 71.9 72.1 71.7 68.6
* Excluding gas on-sold to BP and Incitec Pivot
6.3 Transportation agreements Less information is published about transportation agreements than about GSAs. The information in Table 6-2 has been collated from APT annual reports and AGL annual reports prior to 2000, when AGL was the majority owner of the RBP. The transportation volumes are quoted in annual terms which are understood to reflect the maximum volumes that could be transported, i.e. at a 100% load factor, and the capacity figures are calculated using this assumption.
Table 6-2 RBP transportation agreements
Shipper Start End Capacity (TJ/day)
Maximum Annual (PJ)
Origin Energy (for BP)14 2000/01 2019/20 16 6
Energex (for generators)15 2003/04 Unknown Spot sales N/a
CS Energy (Swanbank E)16
2005/06 2016/17 Over 41 Over 15
Wambo (Braemar PS)16 2006/07 2015/16 16 6
Incitec Pivot16 2007/08 2016/17 44 16
14 AGL Annual Report 1999 p 14 15 APT Annual Report 2004 p 22 16 APT Annual Report 2005 p 23

REPORT TO ACCC
Ref: J1316, 7 February 2006 McLennan Magasanik Associates 29
The transportation agreements are broadly consistent with the GSA information:
• The Origin contract is only part of BP’s supply portfolio
• The Energex spot sales agreement may have covered Oakey and part of Swanbank E requirements
• The CS Energy agreement is an increase over the estimated 2004/05 capacity, consistent with the increase in usage suggested by CSE’s new GSAs
• The Wambo agreement is consistent with usage of up to 5 PJ p.a.
• The Incitec Pivot agreement represents a 6 TJ/day increase over the estimated 2004/05 capacity, consistent with a 2 PJ p.a. increase in usage

REPORT TO ACCC
Ref: J1316, 7 February 2006 McLennan Magasanik Associates 30
7 END-USER DISCUSSIONS
MMA initiated discussions with all current and potential future users of the RBP regarding their expectations of future throughput and peak usage on their own behalf and on behalf of their customers. The aggregate view of users is broadly supportive of the growth trends in the forecasts presented in this report. The user discussions were also extremely useful in assisting MMA to locate a number of public sources of information in relation to potential loads and other matters.
To protect confidentiality, all user information discussed in this report is derived from public sources and where aggregate information in tables could be used to derive confidential information it has been replaced by the words “incl in total”.

REPORT TO ACCC
Ref: J1316, 7 February 2006 McLennan Magasanik Associates 31
8 BASE CASE THROUGHPUT AND CAPACITY REQUIREMENT FORECASTS
8.1 Introduction Base Case throughput and capacity requirement forecasts for the three major gas user categories, generation, distribution load and large users, are presented in the following sections. The load characteristics of each sector, and consequently the most appropriate forecast methodologies, are quite distinct.
Total throughput and capacity requirement forecasts are presented in sections 8.5 and 8.6 while sections 8.7 through 8.9 cover the projected haulage distance, the impact of potential capacity constraints and throughput on the Peat lateral.
8.2 Gas fired generation
8.2.1 Approach
RBP gas loads for power generation have been developed using a two stage process:
1. Gas use for generation in the RBP corridor has been estimated using MMA’s National Electricity Market (NEM) model
2. For generators which have the option to bypass the RBP, gas supply considerations have been used to estimate the split between direct supply from local CSG fields and supply that utilises the RBP
MMA’s NEM model calculates the wholesale electricity market price and the levels of generation and fuel consumption for every generator in the NEM. The model is based on the Strategist probabilistic market modelling software, licensed from New Energy Associates. Strategist represents the major thermal, hydro and pumped storage resources as well as the interconnections between the NEM regions. In addition, MMA partitions Queensland into four zones to more accurately model the impact of transmission constraints and marginal losses.
Generator bids into the NEM are related to their generating costs – cost assumptions for the Braemar, Oakey and Swanbank E plants are presented in Table 8-1. Further details about the model structure are provided in APPENDIX B . It is noted that the model currently covers the period to 2020 and that forecasts for the subsequent five year period prepared for this report are based on simple projections.

REPORT TO ACCC
Ref: J1316, 7 February 2006 McLennan Magasanik Associates 32
Table 8-1 Gas-fired generator costs
Power station Capacity (MW)
Heat Rate at full capacity
(GJ/MWh)
Variable O&M costs
($/MWh)
Braemar 3 x 145.5 11.0 $4.00
Oakey 2 x 138 11.5 $4.00
Swanbank E 383 8.1 $4.00
The pool model is structured to produce hourly price forecasts for twelve typical weeks representing the months of each year. There are a large number of uncertainties that make projections of future pool prices imprecise. The simplifications in bidding structures and the way Strategist represents inter-regional trading result in slight under-estimation of the expected prices because:
• All the dynamics of bid gaming over the possible range of peak load variation and supply conditions are not fully represented
• Extreme peak demands and the associated gaming opportunities are not fully weighted. These uncertainties are highly skewed and provide the potential for very high prices outcomes with quite low probability under unusual demand and network conditions
• Marginal prices between regions are averaged for the purposes of estimating inter-regional trading, resulting in a tendency to under-estimate the dispatch of some intermediate and base load plants in exporting regions
These factors may be expected to result in slight under estimation of gas usage by peaking and intermediate generators. However the error in modelling is comparable to the uncertainty arising form other variable market factors such as contract position and medium term bidding strategies.
8.2.2 Base Case assumptions
The Base Case scenario reflects the most probable prices given the current state of knowledge of the market. It allows for medium energy growth as well as median peak demands, as provided in NEMMCO’s 2005 Statement of Opportunities, (SOO) which are dependent on weather in the peak seasons.
Key assumptions underlying the Base Case price path include:
• Capacity is installed to meet the target reserve margin for the NEM in each region. Some of this peaking capacity may represent demand side response rather than physical generation assets.

REPORT TO ACCC
Ref: J1316, 7 February 2006 McLennan Magasanik Associates 33
• Electricity demand is as per SOO medium demand growth projections, with annual demand shapes consistent with the relative growth in summer and winter peak demand.
• The Queensland Cleaner Energy Policy and New South Wales Emission Benchmark Schemes continue and the NSW Scheme is assumed to be extended to 2020, (see Section 5).
• PNG/Timor Sea gas supply is delivered to Queensland for new power generation from July 2009, consistent with the PNG gas demand-supply scenario presented in section 5.3.
• Generators behave rationally, with uneconomic capacity withdrawn from the market and bidding strategies limited by the cost of new entry.
• Infrequently used peaking resources are bid near VoLL or removed from the simulation to represent strategic bidding of these resources when demand is moderate or low.
• The generator bidding profiles reflect generator contracting levels and assumed revenue targets, based on MMA’s benchmark study for 2004 calendar year.
• The assessed demand side management (DSM) for emissions abatement or otherwise economic responses throughout the NEM is projected to be about 1,150 MW by 2015 for medium load growth. The DSM volume in 2006 is assumed to be approximately 150 MW, gradually increasing to 1,150 MW by 2015. Much of this DSM is due to the NSW emissions benchmark scheme.
• Basslink commences operation in April/May 2006. Commissioning of Basslink commenced on 1 December 2005.
• The Commonwealth Government’s policy to achieve 2% additional renewable energy by 2010 has been implemented as a 9500 GWh target with a maximum penalty for non-performance of $40/MWh post-tax which corresponds to $57/MWh pre-tax.
• The commissioning of Snowy Hydro’s Laverton North open cycle gas fired power station in March 2006.
• The commissioning of Kogan Creek as a base load generator in Queensland at the beginning of September 2007 (the SOO indicates commissioning in late August).
• The retirement of Swanbank B units in 2011. The retirement date for these units may be brought forward during the modelling if capacity in Queensland is surplus to requirement after the introduction of Kogan Creek.
• The commissioning of 2 Wambo 150 MW gas turbines at Braemar in June 2006, with the third 150 MW unit being available in November 2006 for the 2006/07 summer.

REPORT TO ACCC
Ref: J1316, 7 February 2006 McLennan Magasanik Associates 34
• A 170 MW VIC->SA upgrade on the Heywood interconnector in July 2009 to augment supply to South Australia. The 2005 Annual National Transmission Statement (ANTS) identified this upgrade as being potentially beneficial.
• A series of network augmentations in South Queensland and North New South Wales identified in the ANTS as being potentially beneficial to alleviate congestion in the area. These include:
o An augmentation of the network to collectively increase northward flow on QNI by 700MW and increase the Tarong limit (from Tarong to Queensland South) by 450MW in July 2009 (augmentation reference number 23 in the SOO). The Tarong limit is further augmented by 1000MW in July 2011 and July 2013 as needed.
o Network augmentations in South East Queensland in July 2009 to offset reductions in transfer capability following commencement of Kogan Creek (augmentation reference number 5 in the SOO)
o Works to maintain Directlink’s export capability to Queensland in July 2007 (augmentation reference number 2 and 3 in the SOO)
o 100 MW increase in line rating on QNI in both directions in July 2007 (augmentation reference number 6 in the SOO)
o Relaxation of some constraints affecting southerly flow on QNI in July 2007 (augmentation reference number 4 in the SOO)
8.2.3 Gas load projections
MMA modelling indicates that, in addition to the 385 MW at Swanbank E, 320MW at Oakey and the 450 MW under construction at Braemar, substantial new open cycle and closed cycle gas-fired generating capacity will be constructed along the RBP corridor in the period to 2020 (Table 8-2). For the purposes of the study it is assumed that no further capacity is added in the period 2021 to 2025. It is noted that the modelling assumes incremental unit sizes of 146 MW for open cycle gas turbines (OCGTS) and 385 MW for closed cycle gas turbines (CCGTS).
Table 8-2 Cumulative new gas-fired generating capacity to 2020 (MW)
2007 2008 2009 2010 2011 2012 2013
Open Cycle 0 0 0 0 146 146 291
Closed Cycle 0 0 0 0 0 0 0
2014 2015 2016 2017 2018 2019 2020
Open Cycle 291 291 437 582 728 873 1,019
Closed Cycle 0 385 385 770 1,155 1,155 1,155

REPORT TO ACCC
Ref: J1316, 7 February 2006 McLennan Magasanik Associates 35
Generation gas load projections based on utilisation of existing and new capacity in the RBP corridor are presented in Table 8-3. Substantial increases in gas use are projected for 2007, due to increases at Swanbank E and the completion of the Braemar plant, and from 2013 onwards, due to new plant.
Table 8-3 Generation gas load, RBP Corridor (PJ)
2006 2007 2008 2009 2010 2011 2012 2013 2014 2015
Swanbank E 17.1 22.5 22.6 22.6 22.6 22.4 21.9 22.1 19.3 18.3
Oakey 3.2 1.7 1.1 2.1 2.4 2.4 2.5 2.7 2.1 2.7
Braemar 0.3 8.8 6.3 8.7 10.0 10.0 9.6 10.4 15.5 9.6
New OCGT 0.0 0.0 0.0 0.0 0.0 0.5 1.3 4.4 7.4 6.8
New CCGT 0.0 0.0 0.0 0.0 0.0 0.0 0.0 0.0 0.0 9.4
Total 20.6 33.1 30.1 33.4 35.0 35.4 35.3 39.7 44.3 46.8
2016 2017 2018 2019 2020 2021 2022 2023 2024 2025
Swanbank E 19.4 19.8 18.4 17.8 15.8 17.3 17.0 16.7 17.0 16.9
Oakey 1.6 3.7 3.4 1.3 1.3 2.0 1.5 1.6 1.7 1.6
Braemar 12.3 5.6 5.1 10.9 11.1 9.0 10.3 10.1 9.8 10.1
New OCGT 8.4 10.4 9.4 12.8 10.1 10.7 11.2 10.7 10.9 10.9
New CCGT 14.3 24.0 41.7 48.8 44.3 44.9 46.0 45.1 45.3 45.5
Total 56.0 63.4 77.9 91.6 82.4 84.0 86.0 84.1 84.7 85.0
The higher Swanbank E loads represent a move to baseload generation and are consistent with our knowledge of the plant’s gas supply position up to 2011, when it has an estimated 23 PJ p.a. available, and after 2011 it would be expected to enter additional gas supply agreements (refer to section 6.2). Projected Oakey usage is also higher than its historical usage owing to the assumption that there are no RBP capacity constraints (refer to section 5.4). The potential impact of RBP capacity constraints is discussed in section 8.8.
Projected Braemar gas usage is below its estimated total supply of 14.5 PJ p.a. but significantly above the 4.5 PJ that is to be supplied via the RBP. As the details of Braemar’s GSA structures are not known, it is not possible to estimate whether the RBP gas will be used preferentially to the bypass gas or vice versa. Each GSA’s usage is therefore pro rated to the total and the resulting RBP usage is presented in Table 8-4.
The seven new OCGT units are assumed to be located adjacent to the Surat Basin coal seam gas fields in the Braemar/Dalby/Kogan region and to obtain gas supply directly from the gas fields, bypassing the RBP. This is consistent with supply arrangements for the proposed small OCGTs at Chinchilla, Dalby and Daandine, and with the provisional

REPORT TO ACCC
Ref: J1316, 7 February 2006 McLennan Magasanik Associates 36
supply for the proposed Braemar Phase 2. Consequently it is assumed that none of the new OCGT gas will use the RBP.
With regard to the three new CCGTs, it is assumed that one will be located adjacent to a coal seam gas field and that it will obtain gas supply directly, bypassing the RBP. Origin Energy has already proposed a development of this type at Spring Gully, 80 km north of Wallumbilla, though at up to 1000 MW its capacity is greater than assumed in our modelling. The remaining two new CCGTs are assumed to be constructed at the Swanbank site and to utilise RBP capacity.
Projected generation load using the RBP is presented in Table 8-4.
Table 8-4 Generation gas load using the RBP (PJ)
2006 2007 2008 2009 2010 2011 2012 2013 2014 2015
Swanbank E+* 17.1 22.5 22.6 22.6 22.6 22.4 21.9 22.1 19.3 18.3
Oakey 3.2 1.7 1.1 2.1 2.4 2.4 2.5 2.7 2.1 2.7
Braemar 0.3 3.1 2.0 2.7 3.1 3.1 3.0 3.2 4.5 3.0
Total 20.6 27.3 25.7 27.4 28.0 27.9 27.4 28.1 25.9 24.0
2016 2017 2018 2019 2020 2021 2022 2023 2024 2025
Swanbank E+* 19.4 31.8 46.2 50.4 45.3 47.3 47.7 46.7 47.2 47.2
Oakey 1.6 3.7 3.4 1.3 1.3 2.0 1.5 1.6 1.7 1.6
Braemar 3.8 1.7 1.6 3.4 3.4 2.8 3.2 3.1 3.1 3.1
Total 24.8 37.2 51.1 55.0 50.0 52.1 52.4 51.5 52.0 51.9
* includes new CCGTs located at Swanbank
8.2.4 Generation gas peak load
Non-coincident generation peak loads on the RBP estimated using the NEM model are presented in Table 8-5. It is noted that the Swanbank E and Braemar estimates are consistent with the estimated contracted capacities of over 41 TJ/day and 16 TJ/day respectively.

REPORT TO ACCC
Ref: J1316, 7 February 2006 McLennan Magasanik Associates 37
Table 8-5 Non-coincident generation peak loads on RBP (TJ/day)
2006 2007 2008 2009 2010 2011 2012 2013 2014 2015
Swanbank E+* 58.1 65.5 65.7 65.6 65.6 65.4 64.7 65.0 61.1 59.7
Oakey 35.3 25.7 21.8 28.1 29.8 30.1 30.5 32.1 28.2 32.0
Braemar 10.1 14.0 12.5 13.5 14.1 14.1 13.9 14.2 16.0 13.9
Total 103.5 105.2 100.0 107.1 109.4 109.5 109.0 111.3 105.3 105.5
2016 2017 2018 2019 2020 2021 2022 2023 2024 2025
Swanbank E+* 61.2 111.4 164.5 170.2 163.3 166.0 166.5 165.3 165.9 165.9
Oakey 25.1 38.0 36.1 22.9 22.9 27.3 24.4 24.8 25.5 24.9
Braemar 15.0 12.2 12.0 14.4 14.5 13.6 14.2 14.1 14.0 14.1
Total 101.3 161.6 212.6 207.6 200.7 206.9 205.0 204.2 205.4 204.9
8.3 Distribution loads Gas using the Roma to Brisbane Pipeline (RBP) is distributed to small (or Volume) and larger (or Demand) customers in Brisbane and nearby areas through the Energex (Allgas) and Envestra distribution networks.
The distributors submitted draft revised Access Arrangements (AA) and Access Arrangement Information (AAI), covering the period 1 July 2006 to 30 June 2011, to the regulator, the Queensland Competition Authority (QCA) on 30 September 2005. The draft revised AAI included demand forecasts for the networks.
QCA delivered its draft decisions for each of the distributors in late December 2005 and these are posted on the QCA website. The decision included reference to a review of demand forecasts which was carried out by MMA. The MMA reports to the QCA, dated November 2005, have also been posted on the QCA website17.
The following forecasts are based on the MMA forecasts for the QCA, using material available in these reports and in the public arena.
17 Final Report to Queensland Competition Authority – Demand Forecasts for Envestra. MMA, 22 November 2005 Final
Report to Queensland Competition Authority – Demand Forecasts for Allgas. MMA, 22 November 2005

REPORT TO ACCC
Ref: J1316, 7 February 2006 McLennan Magasanik Associates 38
8.3.1 Energex
The Energex networks supply users in South Brisbane, Toowoomba and the South Coast. The consumption history and Energex forecasts of the Energex network, as provided in their draft Access Arrangement Information (AAI) revisions provided to the Queensland Competition Authority are provided in Figure 8-1 as well as the derived MMA forecasts for the combined Volume and Demand markets.
Figure 8-1 Energex actual and forecasts and MMA forecasts (PJ)
0
2
4
6
8
10
12
2001
2002
2003
2004
2005
2006
2007
2008
2009
2010
2011
PJ
MMA TotalTotalLargeSmall
Over the period 2000 to 2005, consumption for the network as a whole has grown by about 1.7% p.a., however growth has been uneven, being about 4.4% pa for the small or volume customers (residential and small commercial and industrial customers, each with consumption < 10 TJ pa ) and only 0.8% pa for the larger or demand customers.
Growth for the smaller customers has been relatively strong, due in part to network extensions in the south coast. Growth for the demand customers has been significantly slower than forecast, due in part to a downturn in 2002. From this period growth for the demand market has been 1.6% pa.
In its draft revised AAI, Energex has forecast growth of 3.9% pa for the Volume market and 1% pa for the Demand market. The MMA forecasts are for 4.1% growth for the Volume market and 1.7% pa for the Demand market.

REPORT TO ACCC
Ref: J1316, 7 February 2006 McLennan Magasanik Associates 39
8.3.1.1 Unaccounted for gas
Unaccounted for gas (UAFG) is the difference between gas received into the network and gas delivered to customers and is largely comprised of gas losses through leakage and measurement differences. UAFG for the networks is delivered by the Roma to Brisbane Pipeline and must be paid for. The level of UAFG on the Energex network was estimated to be 383 TJ in 2003/04 and 341 TJ in 2004/0518.
Energex has foreshadowed that it expects a significant reduction in UAFG expenditures, reducing from $1.4 M in 2006/07 to $0.6 M in 2010/11 due to its extensive renewals program (see AAI Section 6.5). However, the QCA draft decision does not allow such an extensive program, with a UAFG level consequently somewhat above that forecast by Energex.
MMA has estimated UAFG based on the level of expenditure for UAFG allowed for by the QCA in its draft decision.
8.3.1.2 Forecast for Energex
The MMA forecasts for Energex to 2010/11 are provided in Table 8-6. Projections from 2011/12 to 2024/25 assume that the aggregate 2006-2011 growth rate of 2.3% is maintained.
Table 8-6: MMA forecasts for Energex network flow through the RBP (PJ)
2005 2006 2007 2008 2009 2010 2011
MMA for Energex 10.03 10.24 10.52 10.79 11.04 11.30 11.56
UAFG 0.34 0.34 0.33 0.31 0.31 0.29 0.27
Total 10.36 10.58 10.85 11.10 11.35 11.59 11.83
8.3.2 Envestra
Envestra networks supply gas to users in North Brisbane, Ipswich and nearby areas as well as Northern region users in Gladstone, Rockhampton and Wide Bay. The Northern region is not considered in this analysis as gas for these users is not transported through the RBP. BP, a major user supplied through the Envestra network is considered separately.
The Envestra consumption history (section 4.3) and linear time trends and Envestra forecasts of the Tariff V market for the Brisbane and Northern networks combined are provided in Figure 8-2. Note that Envestra has not provided consumption forecasts for the
18 Gas Distribution Service Quality Annual Report July 2004 to June 2005. Allgas Energy, September 2005.
Envestra Service Quality Report 2004/2005. Envestra, 2005.

REPORT TO ACCC
Ref: J1316, 7 February 2006 McLennan Magasanik Associates 40
Demand (Tariff D) market but has forecast only a small (around 2%) increase of MDQ over the period. The MMA forecast for the Brisbane market is also shown in the Figure.
Figure 8-2 Envestra actual and trend forecasts and MMA forecasts for Brisbane (PJ)
0
2
4
6
8
2001
2002
2003
2004
2005
2006
2007
2008
2009
2010
2011
PJ
Total
Tariff D
Tariff V
Trend Total
Trend D
Trend V
MMA forecasts forEnvestra Brisbane
Over the period 2000 to 2005, consumption for the network as a whole has grown by about 3.9% p.a., however growth has been uneven, being about 2.3% pa for the small or volume customers (residential and small commercial and industrial customers, each with consumption < 10 TJ p.a.) and 5.0% p.a. for the larger or demand customers.
In contrast to the Energex region, growth for the smaller customers in the Envestra networks has been weak while that for the demand customers has been strong.
In its draft revised AAI, Envestra is forecasting growth of 3.4% pa for the Volume market. This is higher than the trend forecast of 2.1% pa. The demand forecasts are currently undergoing review by the QCA.
MMA has based its forecast on the MMA report to the QCA. This results in a forecast growth rate of 2.3% for the Brisbane network as a whole, 1.5% for the Volume market and 2.7% for the Demand market.

REPORT TO ACCC
Ref: J1316, 7 February 2006 McLennan Magasanik Associates 41
8.3.2.1 Unaccounted for gas
The level of UAFG on the Envestra networks has been forecast by Envestra to reduce from 298 TJ in 2005 to 214 TJ in 2010/11.
Envestra has foreshadowed that it expects a significant reduction in UAFG due to an extensive renewals program. However, the QCA draft decision does not allow such an extensive program, with a UAFG level consequently somewhat above that forecast by Envestra.
MMA has estimated UAFG based on the level of expenditure for UAFG allowed for by the QCA in its draft decision. We have assumed that 97% of this UAFG is applicable to the Brisbane network as most of the UAFG is associated with the Tariff V load, of which the Brisbane market makes up some 90% and because the Northern Network is significantly newer than the Brisbane network.
8.3.2.2 Forecast for Envestra Brisbane network
The MMA forecasts for the Envestra Brisbane network are provided in Table 8-7. Projections from 2011/12 to 2024/25 assume that the 2006-2011 growth rate of 2.1% is maintained.
Table 8-7: MMA forecasts for Envestra Brisbane network flow through the RBP (PJ)
2005 2006 2007 2008 2009 2010 2011
Tariff V 1.73 1.73 1.77 1.81 1.83 1.86 1.89
Tariff D 3.08 3.16 3.24 3.33 3.42 3.51 3.61
Total Brisbane 4.81 4.89 5.01 5.14 5.25 5.38 5.50
UAFG 0.29 0.29 0.25 0.25 0.26 0.26 0.25
Total Brisbane + UAFG 5.10 5.18 5.26 5.39 5.51 5.64 5.75
8.3.3 Dalby
In view of the very small distribution load at Dalby and the absence of recent public information on gas usage in Dalby, the Dalby load is assumed to be constant at 0.15 PJ p.a.

REPORT TO ACCC
Ref: J1316, 7 February 2006 McLennan Magasanik Associates 42
8.4 Large Users
8.4.1 Incitec Pivot
Incitec Pivot operates a fertiliser plant at Gibson Island in the Port of Brisbane. Gas is used as a feedstock for the production of ammonia and urea – current usage is in the range 13-14 PJ p.a. (section 4.4). Gas costs represent a high proportion of the variable costs of manufacturing.
There appears little likelihood that Incitec Pivot will significantly increase its Gibson Island capacity in the near term:
• It has previously stated that the ideal location for additional capacity in Australia would be Geelong in Victoria19
• It is involved in a project for a world scale fertiliser plant in Brunei20, though this may be jeopardised by the value of the gas in alternative uses such as LNG.
• The company’s majority owner, Orica, is reviewing its ownership21
Nevertheless, Incitec Pivot has entered new gas contracts from 2007 to 2017 for a total of 14.4 PJ with a 2 PJ expansion option and a transmission contract for 44 TJ/day, equivalent to 14.4 PJ at Incitec Pivot’s 90% load factor. It therefore appears that a small increase in gas usage is possible.
In the short term gas use will be reduced by a plant maintenance shutdown scheduled for 2007 before the change of gas supply in July22. The shutdown will last an estimated four weeks and cost $43m. The shutdown will be repeated five yearly thereafter.
Towards the end of the contract period Incitec Pivot must decide whether to enter new contracts for post-2017 or to cease production using gas and import ammonia instead. MMA gas price projections suggest that the new contract price will remain competitive in 2017 and it is therefore assumed that Incitec Pivot will enter a new contract and continue to use gas.
In view of the above, Incitec Pivot’s underlying gas usage is projected at 13 PJ for 2005/06 and 2006/07 and 14 PJ p.a. thereafter, with reductions of 1 PJ for maintenance every five years. Incitec Pivot’s peak day requirements are calculated from the annual projections assuming a 90% load factor. Annual forecast figures are presented in Table 8-8.
19 Queensland Gas Market and Assessments . A Customer’s Perspective. Arthur Pitts, Gas Purchasing Manager, Incitec-
Pivot Ltd. EUAA Queensland Energy Seminar 30 October 2003 20 Corporatefile Open Briefing Incitec Pivot 17 Nov 2005 21 Australian Financial Review 26 September 2005 22 Corporatefile Open Briefing Incitec Pivot 17 Nov 2005

REPORT TO ACCC
Ref: J1316, 7 February 2006 McLennan Magasanik Associates 43
8.4.2 BP Bulwer Island Refinery
BP Bulwer Island Refinery is the larger of two oil refineries in Brisbane, with a capacity of 88 000 barrels of oil a day. It has undergone several expansions and technology upgrades, most recently as part of the Queensland Clean Fuels Project which led to conversion to natural gas. This enables the facility to produce more environmentally friendly transportation fuels including the manufacture of diesel and petrol at 50 parts per million. The plant includes the Bulwer Island Cogeneration Project, a 33MW cogen/CCGT plant owned by ATCO and Origin Energy that uses up to 2.6 PJ of gas and benefits from the GECs scheme in the same way as gas-fired generators.
Although refining margins are relatively high, this applies worldwide and there seems little possibility of investment in further capacity in Australia, other than possibly for reasons of supply security. Notwithstanding security concerns, Australia’s growing liquid fuel demand is most likely to be met by increasing product imports. Equally there seems little likelihood of Bulwer Island, as one of Australia’s most efficient refineries, closing down over the forecast period.
Under present liquid fuel market conditions where refinery products are highly valued, BP has incentives to maximise product output, for example by minimising use of by-products as fuels by substituting gas as a fuel. This factor may account for the steady growth in BP’s gas usage to over 8 PJ p.a. in 2004/05 and for the increase in supply contracted from 1 January 2006. From 2006/07 it will have an estimated 10.5PJ p.a. contracted. These considerations suggest that BP’s gas usage will grow from 9 PJ in 2005/06 to 10 PJ by 2007/8 and hold at that level thereafter. BP’s peak day requirements are calculated from the annual projections assuming a 75% load factor
Annual forecast figures are presented in Table 8-8.
8.4.3 Swanbank Paper
Swanbank Paper is a proposed coated fine paper mill at the Swanbank Enterprise Park near the Swanbank E power station. Its rationale is to replace up to 350,000 tonnes p.a. of imported paper with paper produced locally from imported pulp. According to the Queensland Co-ordinator General23 the plant will use 1.2 TJ/d of gas, about 0.4 PJ annually. The project is currently seeking regulatory and planning approvals and obtained Major Project Facilitation status from Invest Australia in November 2005. This project is assessed to have a better than 50% probability of proceeding and is therefore included in the Base Case.
23 Coordinator-General’s Report on the Environmental Impact Statement for the proposed Swanbank Paper Plant Project December 2004

REPORT TO ACCC
Ref: J1316, 7 February 2006 McLennan Magasanik Associates 44
8.4.4 Other potential new users
Other potential future loads include:
• Boulder Steel, a tube maker and tube processor, announced in 2004 that it had selected the Swanbank Enterprise Park as the location for a 230,000 tonnes p.a. specialty steel plant, using scrap steel input. The current status of the project and its potential gas usage are not known.
• Capral Aluminium plans to establish Australia's largest aluminium extrusion plant in the Bremer Business Park in Ipswich. As extrusion does not involve significant process heating, its gas requirements are likely to be low.
Our inability to identify specific projects does not mean that large scale developments will not take place in the longer term. In view of the competitive gas prices projected to be available in Brisbane, it is assumed that further new projects with similar gas demand to those developed up to 2008/09 are developed every five years, i.e. commence operating in 2013/14, 2018/19 and 2023/24. This results in modest growth of 2% p.a. after 2011, compared to 4.1% from 2006 to 2011.
8.4.5 Large user forecast summary
The large user forecasts described in the preceding sections are summarised in Table 8-8 and Table 8-9.
Table 8-8 Large user annual usage forecast (PJ)
2006 2007 2008 2009 2010 2011 2012 2013 2014 2015
Incitec Pivot 13.0 12.0 14.0 14.0 14.0 14.0 12.9 14.0 14.0 14.0
BP Refinery 9.0 9.5 10.0 10.0 10.0 10.0 10.0 10.0 10.0 10.0
Other users
Incl. in total
Incl. in total
Incl. in total
Incl. in total
Incl. in total
Incl. in total
Incl. in total
Incl. in total
Incl. in total
Incl. in total
Total Incl. in total
Incl. in total
Incl. in total
Incl. in total
Incl. in total
Incl. in total
Incl. in total
Incl. in total
Incl. in total
Incl. in total
2016 2017 2018 2019 2020 2021 2022 2023 2024 2025
Incitec Pivot 14.0 12.9 14.0 14.0 14.0 14.0 12.9 14.0 14.0 14.0
BP Refinery 10.0 10.0 10.0 10.0 10.0 10.0 10.0 10.0 10.0 10.0
Other users
Incl. in total
Incl. in total
Incl. in total
Incl. in total
Incl. in total
Incl. in total
Incl. in total
Incl. in total
Incl. in total
Incl. in total
Total Incl. in total
Incl. in total
Incl. in total
Incl. in total
Incl. in total
Incl. in total
Incl. in total
Incl. in total
Incl. in total
Incl. in total

REPORT TO ACCC
Ref: J1316, 7 February 2006 McLennan Magasanik Associates 45
Table 8-9 Non-coincident large user peak load forecast (TJ/day)
2006 2007 2008 2009 2010 2011 2012 2013 2014 2015
Incitec Pivot 39.6 39.6 42.6 42.6 42.6 42.6 42.6 42.6 42.6 42.6
BP Refinery 32.9 34.7 36.5 36.5 36.5 36.5 36.5 36.5 36.5 36.5
Other users
Incl. in total
Incl. in total
Incl. in total
Incl. in total
Incl. in total
Incl. in total
Incl. in total
Incl. in total
Incl. in total
Incl. in total
Total Incl. in total
Incl. in total
Incl. in total
Incl. in total
Incl. in total
Incl. in total
Incl. in total
Incl. in total
Incl. in total
Incl. in total
2016 2017 2018 2019 2020 2021 2022 2023 2024 2025
Incitec Pivot 42.6 42.6 42.6 42.6 42.6 42.6 42.6 42.6 42.6 42.6
BP Refinery 36.5 36.5 36.5 36.5 36.5 36.5 36.5 36.5 36.5 36.5
Other users
Incl. in total
Incl. in total
Incl. in total
Incl. in total
Incl. in total
Incl. in total
Incl. in total
Incl. in total
Incl. in total
Incl. in total
Total Incl. in total
Incl. in total
Incl. in total
Incl. in total
Incl. in total
Incl. in total
Incl. in total
Incl. in total
Incl. in total
Incl. in total
8.5 Total RBP throughput Actual and forecast total annual RBP throughputs are illustrated in Figure 8-3. Total throughput is projected to grow from 48 PJ in 2005 to 73 PJ in 2011, at the expected end of the new access arrangement period. Further modest growth is projected to 2016, after which the anticipated growth of generation at Swanbank stimulates a rapid rise to over 100 PJ p.a. from 2018.

REPORT TO ACCC
Ref: J1316, 7 February 2006 McLennan Magasanik Associates 46
Figure 8-3 Actual and forecast annual RBP throughput (PJ)
0
20
40
60
80
100
120
2001
2003
2005
2007
2009
2011
2013
2015
2017
2019
2021
2023
2025
PJ
Generation
Large Users
Distribution
8.6 Total peak usage and contracted capacity Figure 8-4 Actual and forecast total non-coincident RBP peak usage (TJ/day)
0
50
100
150
200
250
300
350
400
450
2001
2003
2005
2007
2009
2011
2013
2015
2017
2019
2021
2023
2025
TJ/day
Generation
Large Users
Distribution

REPORT TO ACCC
Ref: J1316, 7 February 2006 McLennan Magasanik Associates 47
Actual and forecast total non-coincident RBP peak usage are illustrated in Figure 8-4. The growth pattern is very similar to that for total throughput. Non-coincident peak usage is projected to grow from 216 TJ/day in 2005 to 275 TJ/day in 2011, at the expected end of the new access arrangement period. Between 2016 and 2018 peak usage is expected to grow to over 400 TJ/day due to the anticipated growth of generation at Swanbank.
Contracted capacity forecasts have been estimated as follows:
• Using known transportation contracts for large users and the Braemar PS
• By assuming that capacity contracted from distribution load will equal their peak requirement
• By assuming that Oakey will not contract any capacity and that as it moves to baseload generation Swanbank will want to fully contract its peak requirement
Actual and forecast contracted capacities are illustrated in Figure 8-5. The forecast exceeds current capacity of 178 TJ/day, even if the Braemar contract for 16 TJ/day is excluded because it uses only a very short section of the pipeline. The consequences of capacity not being expanded to meet requirements are discussed in section 8.8.
Figure 8-5 Actual and forecast RBP contracted capacity (TJ/day)
0
50
100
150
200
250
300
350
400
450
2001
2003
2005
2007
2009
2011
2013
2015
2017
2019
2021
2023
2025
TJ/day
Forecast
Forecast ExclBraemar
Current RBPCapacity
Actual

REPORT TO ACCC
Ref: J1316, 7 February 2006 McLennan Magasanik Associates 48
8.7 Haulage distance Actual and forecast RBP haulage distances excluding the Peat lateral are pictured in Figure 8-6.
Figure 8-6 Actual and forecast RBP haulage distances (km)
250
300
350
400
450
2001
2003
2005
2007
2009
2011
2013
2015
2017
2019
2021
2023
2025
Km
Actual
Forecast ExclBraemar
Forecast
The average distance hauled is projected to continue to decline owing to increasing receipts from CSG gas fields east of Wallumbilla and due to deliveries to the Braemar PS. The impact of removing Braemar from the calculation is also illustrated. The decline indicates a need for less full-distance incremental capacity than the contracted capacity shown in Figure 8-5 would suggest and hence a lower cost of capacity.
8.8 Impact of potential RBP capacity constraints If the RBP capacity is not expanded to meet forecast requirements then the forecast volumes of gas will not flow. This may significantly impact the first two years of the forecasts, since there do not appear to be any immediate plans for expansion, unless the pipeline has the ability to carry more than 178 TJ/day (refer to section 2.1).
The loads that will be most impacted will be Oakey, which is assumed to have no contracted capacity (the reasons for this are discussed in section 4.2), and possibly Swanbank E, for which the currently contracted capacity is not known precisely (it is known to be over 41 TJ/day). Oakey, moreover, because of its dependence on interruptible capacity, is in fact always to some extent dependent on excess capacity being available, which is in turn dependent on the timing of capacity construction relative to peak requirements.

REPORT TO ACCC
Ref: J1316, 7 February 2006 McLennan Magasanik Associates 49
A hypothetical capacity profile is illustrated in Figure 8-7 (no assumptions have been made as to whether this profile is feasible). In this case there would be a capacity shortfall in 2006 and 2007, very limited spare capacity from 2008 to 2012 and more generous spare capacity after 2012.
Figure 8-7 RBP Capacity requirements and hypothetical profile
0
50
100
150
200
250
300
350
400
450
2005
2007
2009
2011
2013
2015
2017
2019
2021
2023
2025
TJ/dayHypotheticalprofile
Capacityrequirement
8.9 Peat lateral Estimated actual and forecast Peat lateral throughput based on end user and GSA data and the future price competitiveness of gas supplied via the lateral in RBP markets are shown in Figure 8-8.

REPORT TO ACCC
Ref: J1316, 7 February 2006 McLennan Magasanik Associates 50
Figure 8-8 Estimated actual and forecast Peat lateral throughput (PJ)
0
20
40
60
80
100
120
2001
2003
2005
2007
2009
2011
2013
2015
2017
2019
2021
2023
2025
PJOther receipts
Peat lateral

REPORT TO ACCC
Ref: J1316, 7 February 2006 McLennan Magasanik Associates 51
9 HIGH AND LOW CASE THROUGHPUT AND CAPACITY REQUIREMENT FORECASTS
9.1 Case specification High and Low Case forecasts have been constructed to illustrate alternative potential outcomes. The diversity of drivers of load growth across the major end use categories precludes a simple specification of High and Low Case forecasts in terms of economic growth, gas prices or other inputs. High and Low Case forecasts have therefore been derived independently in each category. In view of this derivation it is not possible to estimate a probability of the High and Low Case outcomes.
9.2 Gas fired generation High and Low Cases for generation are based on:
• High – high electricity demand, policy orientation towards gas
• Low - low electricity demand, policy orientation away from gas
Over the period to 2011 the High and Low Cases are very similar to the Base Case because the use of gas for generation is largely determined by GECS requirements. After 2011 the cases diverge strongly - in the High Case five CCGTs that use the RBP are constructed, compared to two in the Base Case, and in the Low Case only one is constructed.
9.3 Distribution loads Annual growth rates in the Base Case distribution load forecasts are summarised in Table 9-1.
Table 9-1 Base Case growth rates
User category Energex Envestra
Volume (Small) 4.1% 1.5%
Demand (Large) 1.7% 2.7%
Total 2.3% 2.1%
The differences in growth rates between the two networks in each user category provide an indication of the differences in outcomes that may be possible. For example, if the Energex Volume growth rate fell to 1.5%, its aggregate growth would fall by 0.7% and if Envestra Volume growth rate grew to 4.1%, its aggregate growth would grow by 1.1%. Taking these possibilities into account, the High and Low Case forecasts are based on growth rates 1% above and below the Base Case growth rates for each distribution region.

REPORT TO ACCC
Ref: J1316, 7 February 2006 McLennan Magasanik Associates 52
9.4 Large Users
9.4.1 Incitec
In the High Case it is assumed that Incitec uses an additional 1 PJ in 2009 and 2 PJ p.a. from 2010, as suggested by its gas contract option. In the Low Case it is assumed Incitec ceases to take gas after 2017, when its current contracts expire. Up to 2017 its gas usage is as in the Base Case.
9.4.2 BP
For BP the High and Low cases are:
• High Case – the 0.5 PJ p.a. growth from 2006 to 2008 in the Base case continues to 2012, after which usage is constant at 12 PJ compared to 10 PJ in the Base Case
• Low Case – usage is 8.5 PJ in 2006 and 8 PJ p.a. thereafter, compared to 10 PJ in the Base Case
9.4.3 Other large users
High and Low Case assumptions for new users are:
• High Case – 25% higher gas use than in the Base Case
• Low Case – 25% lower gas use than in the Base Case
9.5 Total RBP throughput and peak usage High and Low Case throughput and peak usage are compared with Base Case values in Figure 9-1 and Figure 9-2. At the expected end of the next access period in 2011 the High Case throughput is 9% higher than the Base Case and the Low Case is 9% lower than the Base Case. By 2025 the High Case throughput is 39% higher than the Base Case and the Low Case is 34% lower than the Base Case. Variations in non-coincident peak load are similar.

REPORT TO ACCC
Ref: J1316, 7 February 2006 McLennan Magasanik Associates 53
Figure 9-1 High and Low Case annual RBP throughput (PJ)
0
20
40
60
80
100
120
140
160
180
2001
2003
2005
2007
2009
2011
2013
2015
2017
2019
2021
2023
2025
PJ
High
Base
Low
Actual
Figure 9-2 High and Low Case non-coincident RBP peak usage (TJ/day)
0
100
200
300
400
500
600
2001
2003
2005
2007
2009
2011
2013
2015
2017
2019
2021
2023
2025
TJ/day
High
Base
Low
Actual
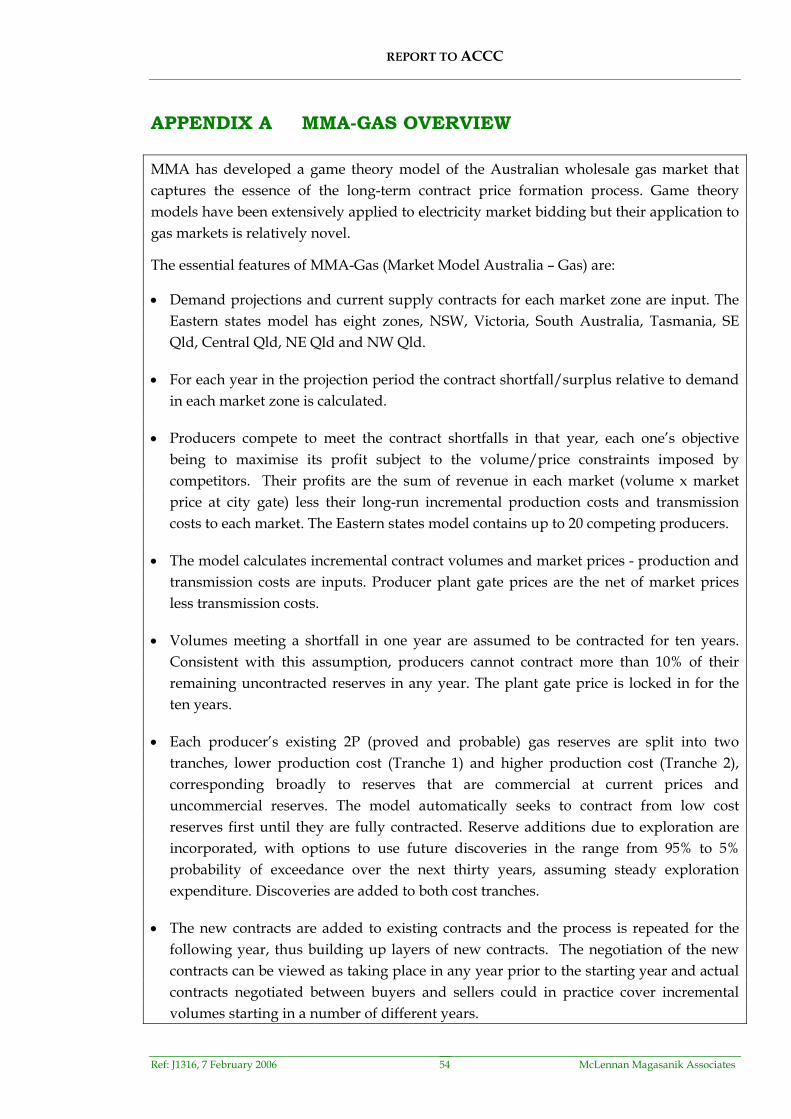
REPORT TO ACCC
Ref: J1316, 7 February 2006 McLennan Magasanik Associates 54
APPENDIX A MMA-GAS OVERVIEW
MMA has developed a game theory model of the Australian wholesale gas market that captures the essence of the long-term contract price formation process. Game theory models have been extensively applied to electricity market bidding but their application to gas markets is relatively novel.
The essential features of MMA-Gas (Market Model Australia – Gas) are:
• Demand projections and current supply contracts for each market zone are input. The Eastern states model has eight zones, NSW, Victoria, South Australia, Tasmania, SE Qld, Central Qld, NE Qld and NW Qld.
• For each year in the projection period the contract shortfall/surplus relative to demand in each market zone is calculated.
• Producers compete to meet the contract shortfalls in that year, each one’s objective being to maximise its profit subject to the volume/price constraints imposed by competitors. Their profits are the sum of revenue in each market (volume x market price at city gate) less their long-run incremental production costs and transmission costs to each market. The Eastern states model contains up to 20 competing producers.
• The model calculates incremental contract volumes and market prices - production and transmission costs are inputs. Producer plant gate prices are the net of market prices less transmission costs.
• Volumes meeting a shortfall in one year are assumed to be contracted for ten years. Consistent with this assumption, producers cannot contract more than 10% of their remaining uncontracted reserves in any year. The plant gate price is locked in for the ten years.
• Each producer’s existing 2P (proved and probable) gas reserves are split into two tranches, lower production cost (Tranche 1) and higher production cost (Tranche 2), corresponding broadly to reserves that are commercial at current prices and uncommercial reserves. The model automatically seeks to contract from low cost reserves first until they are fully contracted. Reserve additions due to exploration are incorporated, with options to use future discoveries in the range from 95% to 5% probability of exceedance over the next thirty years, assuming steady exploration expenditure. Discoveries are added to both cost tranches.
• The new contracts are added to existing contracts and the process is repeated for the following year, thus building up layers of new contracts. The negotiation of the new contracts can be viewed as taking place in any year prior to the starting year and actual contracts negotiated between buyers and sellers could in practice cover incremental volumes starting in a number of different years.
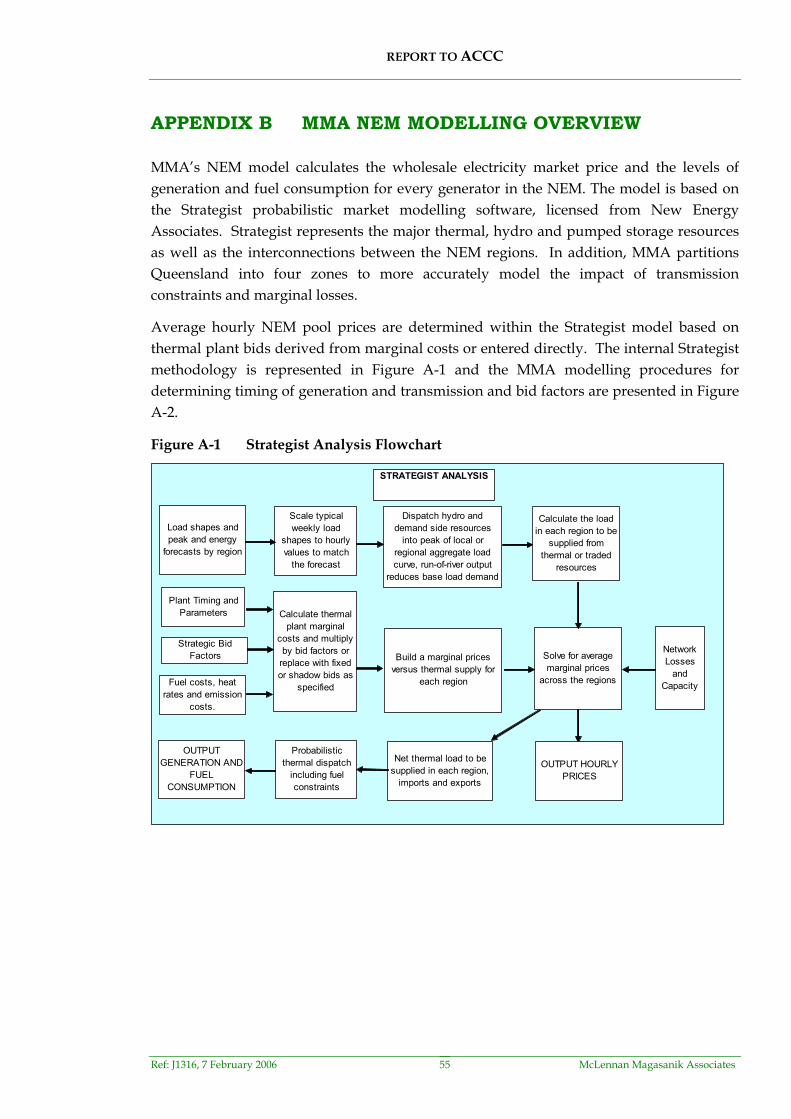
REPORT TO ACCC
Ref: J1316, 7 February 2006 McLennan Magasanik Associates 55
APPENDIX B MMA NEM MODELLING OVERVIEW
MMA’s NEM model calculates the wholesale electricity market price and the levels of generation and fuel consumption for every generator in the NEM. The model is based on the Strategist probabilistic market modelling software, licensed from New Energy Associates. Strategist represents the major thermal, hydro and pumped storage resources as well as the interconnections between the NEM regions. In addition, MMA partitions Queensland into four zones to more accurately model the impact of transmission constraints and marginal losses.
Average hourly NEM pool prices are determined within the Strategist model based on thermal plant bids derived from marginal costs or entered directly. The internal Strategist methodology is represented in Figure A-1 and the MMA modelling procedures for determining timing of generation and transmission and bid factors are presented in Figure A-2.
Figure A-1 Strategist Analysis Flowchart
Scale typical weekly load
shapes to hourly values to match
the forecast
Dispatch hydro and demand side resources
into peak of local or regional aggregate load curve, run-of-river output
reduces base load demand
Net thermal load to be supplied in each region,
imports and exports
Solve for average marginal prices
across the regions
Calculate thermal plant marginal
costs and multiply by bid factors or
replace with fixed or shadow bids as
specified
Build a marginal prices versus thermal supply for
each region
Calculate the load in each region to be
supplied from thermal or traded
resources
Probabilistic thermal dispatch
including fuel constraints
Fuel costs, heat rates and emission
costs.
Load shapes and peak and energy
forecasts by region
OUTPUT HOURLY PRICES
OUTPUT GENERATION AND
FUEL CONSUMPTION
STRATEGIST ANALYSIS
Strategic Bid Factors
Plant Timing and Parameters
Network Losses
and Capacity

REPORT TO ACCC
Ref: J1316, 7 February 2006 McLennan Magasanik Associates 56
Figure A-2 MMA Strategist Modelling Procedures
STRATEGISTMODEL
Review Price Path
Adjust Plant Timing
New Entry Costs
Review Gaming Opportunities and
Contract Positions
Adjust Bid Price Factors
Final Price Path Satisfies
Criteria
Review Inter-regional Price
Differences
Adjust Interconnection
Development Timing
MMA USE OF STRATEGIST
Strategist generates average hourly marginal prices for each hour of a typical week for each month of the year at each of the regional reference nodes, having regard to all possible thermal plant failure states and their probabilities. The prices are solved across the regions of the NEM having regard to inter-regional loss functions and capacity constraints. Failure of transmission links is not represented although capacity reductions are included based on historical chronological patterns. Constraints can be varied hourly if required and such a method is used to represent variations in the capacity of the Heywood interconnection, between Victoria and South Australia, which have been observed in the past when it was heavily loaded. Such variations occur during thunderstorms, to enhance system security, and during transmission line outages.
Bids are generally formulated as multiples of marginal cost and are varied above unity to represent the impact of contract positions and the price support provided by dominant market participants. Some cogeneration plants are bid below unity to represent the value of the steam supply which is not included in the power plant model.