Embed Size (px)
Citation preview

Roles of Macrophage Mitochondrial Oxidative Stress and Mitochondrial Fission in Atherosclerosis
Ying Wang
Submitted in partial fulfillment of the requirements for the degree of
Doctor of Philosophy in the Graduate School of Arts and Sciences
COLUMBIA UNIVERSITY
2014

© 2014
Ying Wang
All rights reserved
Abstract
Roles of Macrophage Mitochondrial Oxidative Stress and Mitochondrial Fission in Atherosclerosis
Ying Wang
Electron transportation (ET) coupled with oxidative phosphorylation (OXPHOS) in the
mitochondria produces limited, physiologic levels of reactive oxygen species (ROS). While this process
is adaptive under normal conditions, excessive mitochondrial oxidative stress (mitoOS) has been
correlated with a number of diseases, including atherosclerotic vascular disease in humans. However,
definitive evidence of causation and cell-specific pro-atherogenic mechanisms of mitoOS require further
investigation.
The high level of interest in this topic, the human relevance, and the potential therapeutic
implications prompted us to explore causation and mechanism with a focus on the key inflammatory cell
type in atherosclerosis, the macrophage (Chapter 2). For this purpose, we used a recently described
model, the mitochondrial catalase (mCAT) transgenic mouse, that decreases mitoOS in vivo. Normally,
glutathione perioxidase is the endogenous mitochondrial enzyme that catalyzes the reduction of H2O2 and
prevents its conversion into the most detrimental ROS hydroxyl nitrites. Catalase can carry out this role in
peroxisomes, where it is exclusively located. The mCAT transgenic mouse expresses human catalase
with a mitochondrial matrix-targeting motif, which quenches mitoOS and protects against mitoOS-induced
damage. To focus on myeloid-derived cells in atherosclerosis, we used two strategies: transplantation of
mCAT transgenic bone marrow cells into atheroprone Ldlr-/-
mice and crossing Ldlr-/-
mice with an
mCATfl/-
LysMCre model that expresses mCAT only in lysozyme M-expressing cells, notably differentiated
macrophages. After 8 wk western type diet (WD) feeding, both models demonstrated evidence of
decreased mitoOS in lesional macrophages, decreased atherosclerosis, suppression of Ly6chi monocyte
infiltration, and lower levels of the monocyte chemotactic protein-1 (MCP-1). The decrease in lesional
MCP-1 was associated with suppression of other markers of inflammation (iNOS and TNF-α) and with
decreased phosphorylation of the critical transcription factor RelA (NF-κB p65), indicating decreased
activation of the pro-inflammatory NF-κB pathway. Using models of mitoOS in cultured macrophages,
we showed that mCAT suppressed MCP-1 expression by decreasing activation of the Iκ-kinase (IKK) -
NF-κB (RelA) pathway. Taken together, we conclude that MitoOS in lesional macrophages amplifies
early atherosclerotic lesion development by promoting NF-κB-mediated entry of monocytes and other
inflammatory processes. In view of the mitoOS-atherosclerosis link in human atheromata, these findings
reveal a potentially new therapeutic target to prevent the early progression of atherosclerosis.
The mitochondrial dynamic processes of fission and fusion influence and integrate with multiple
physiologic and pathophysiologic processes. Mitochondrial fusion/fission dysregulation has been
implicated in atherosclerosis, but little is known about the role of myeloid cell specific mitochondrial
dynamics in the progression of atherosclerosis. Dynamin related protein 1(DRP1), a cytosolic GTPase
family member, is one of the molecules that mediate mitochondrial fission. In the second part of this
thesis (Chapter 3), we used western diet-fed Drp1fl/fl
LysmCre+/-
Ldlr-/-
mice to determine the role of Mφ
mitochondrial fission in both early atherogenesis and advanced atherosclerosis. Our data thus far show
that: (1) Mitochondria in lesional Mφs are elongated in Drp1fl/fl
LysmCre+/-
Ldlr-/
mice by transmission
electron microscopy (TEM) analysis; (2) Suppression of Mφ mitochondrial fission does not affect early
atherogenesis; (3) Inhibition of Mφ mitochondrial fission leads to a striking increase of necrotic core area
and the accumulation of apoptotic cells, which are likely due to the defective phagocytic clearance of
apoptotic cells (efferocytosis) in the advanced stage of atherosclerosis in vivo; (4) DRP1-deficient Mφs
are defective in efferocytosis in vitro and in vivo. (5) The phagocytic deficiency in DRP1-deficient Mφs is
associated with a reduced level of uncoupling protein 2 (UCP2), a mitochondria protein required for
continuous uptake and clearance of dead cells in phagocytes. We conclude that DRP1-mediated
mitochondrial fission in Mφs promotes the clearance of apoptotic cells and thereby blocks necrotic core
formation in advanced atherosclerosis. This study indicates that mitochondrial fusion/fission could be a
new therapeutic target to stabilize the advanced plaques and prevent acute atherothrombosis in humans.
In terms of mechanism, we hypothesize that mitochondrial fission stabilizes UCP2 in the inner membrane
of mitochondria. Further studies are required to elucidate how DRP1-UCP2 pathway maintains the
efferocytosis capability in phagocytosis.
In summary, my thesis studies have revealed the pathological significance of macrophage
mitoOS in early atherogenesis and a novel link of mitochondria dynamics to macrophage phagocytosis in
the setting of advanced atherosclerosis.

i
Contents
List of Figures ii
List of Abbreviations iv
Acknowledgements vi
Chapter 1: Introduction: Mitochondrial Derived ROS and its Regulation in Aherosclerosis 1
Mitochondrial Derived ROS and its regulation 2
Evidence of excessive mtROS in atherosclerotic lesion 3
Why does excessive mtROS occur in atherosclerosis 4
Consequences of excessive mtROS 10
Conclusion 12
Chapter 2: Macrophage Mitochondrial Oxidative Stress Promotes Atherosclerosis and Nuclear
Factor-κB-Mediated Inflammation in macrophages 15
Introduction 16
Methods 18
Results 24
Discussion 72
Chapter 3: Macrophage Mitochondrial Fission is Essential for Continued Clearance of Apoptotic
Cells and Plays a Protective Role in Advanced Atherosclerosis 75
Introduction 76
Methods 79
Results 83
Discussion 110
Conclusion 113
Reference 114

ii
List of Figures
Chapter 1: Introduction: Mitochondrial Derived ROS and its Regulation in Atherosclerosis
Figure I: Regulation of healthy level and excessive mtROS 13
Chapter 2: Macrophage Mitochondrial Oxidative Stress Promotes Atherosclerosis and Nuclear Factor-κB-Mediated Inflammation in macrophages
Figure 1.1: Oxidative damage of non-nuclear and nuclear DNA in cultured macrophages and aortic root lesional macrophages of WD-fed Ldlr
-/- mice 26
Figure 1.2: Oxidative damage to mitochondrial DNA in lesional macrophages correlates with atherosclerosis progression in Ldlr
-/- mice 29
Figure 2.1: Suppression of myeloid cell mitoOS protects against early atherogenesis in mCAT
transgenic Ldlr-/-
chimeric mice 32
Figure 2.2: The athero-protective effect of myeloid mCAT persists after 16 wks of WD feeding 38
Figure 2.3: Metabolic parameters of 8-wk WD-fed control Ldlr-/-
and mCAT Ldlr-/-
mice 40
Figure 2.4: Suppression of mitoOS in lysozyme M-expressing cells protects against early atherogenesis in Ldlr
-/- mice 41
Figure 3.1: Lesional monocyte infiltration and inflammation are decreased in mCAT transgenic
Ldlr-/-
chimeric mice 47
Figure 3.2: Lesional non-monocyte derived cell numbers, macrophage proliferation, macrophage
egress and retention markers are identical in mCAT transgenic Ldlr-/-
chimeric mice 49
Figure 3.3: Lesional monocyte infiltration and inflammation are decreased in mCAT transgenic Ldlr
-/- chimeric mice 51
Figure 4: Lesional inflammation and activation of NF-κB are decreased in mCAT transgenic Ldlr-/-
chimeric mice 54
Figure 5.1: Cultured macrophages from mCAT fl/-
LysMCre+/-
mice have less LPS-induced mitoOS, Mcp1, p-RelA, and p-IKK 60
Figure 5.2: mCAT does not suppress p-P38 or p-JNK activation, or mmLDL-induced Mcp1 mRNA in macrophages 64
Figure 6.1: Transfection of macrophages with RelA or IKK increases LPS-induced Mcp1 65
Figure 6.2: Restoration of RelA abrogates the difference in LPS or oxLDL-induced Mcp1 expression in control vs. mCAT-expressing macrophages 67
Figure 7: The effect of mCAT on LPS-induced Il10 and Ccl5 mRNA in cultured macrophages 69

iii
Figure 8: Transfection of macrophages with cytosolic catalase does not decrease LPS- induced Mcp1 and Tnfα 70
Chapter 3: Macrophage Mitochondrial Fission is Essential for Continued Clearance of Apoptotic Cells and Plays a Protective Role in Advanced Atherosclerosis 75
Figure 1: DRP1 deficient Mφs have elongated mitochondria and altered expression of molecules regulating mitochondrial dynamics 85
Figure 2: Mφ specific DRP1 deletion does not affect early atherogenesis 89
Figure 3: Deficiency in Mφ DRP1 increases lesion necrosis and apoptotic cells accumulation 91
Figure 4: Metabolic parameters of 12wk WD-fed Drp1fl/fl
Ldlr-/-
vs. Drp1fl/fl
LysMCre+/-
Ldlr-/-
mice 95
Figure 5: Impaired clearance of apoptotic cells in Drp1fl/fl
LysmCre+/-
mice 97
Figure 6: Impaired uptake of ACs in Mφs with mitochondrial fission deficiency 102
Figure 7: Continuous engulfment of cellular material is impaired in Drp1fl/fl
LysmCre+/-
Mφs 106
Figure 8: Impaired UCP2 induction and uncontrolled ↑ΔΨ in Mφs lacking of fission 108
Figure 9: Working model of how mitochondrial deficiency leads to impaired efferocytosis 109

iv
List of Abbreviations
AC: apoptotic cell
ET: electron transportation
ETC: electron transportation chain
ERK: Extracellular signal-regulated kinases
MAPK: P36 mitogen activated protein kinase
JAK: Janus kinase
JNK: c-Jun N-terminal kinases
ET: endothelin
macrophage: Mφ
mCAT: mitochondrial catalase
mtROS: mitohondrial Reactive Oxygen Species
mitoOS: mitochondrial oxidative stress
OXPHOS: oxidative phosphorylation
8-OHdG: 8-hydroxydeoxyguanosine
DRP1: dynamin related protein 1
FIS1: fission 1
UCP2: uncoupling protein 2
OPA1: optic atrophy 1
VSMC: vascular smooth muscle cell

v
WD: western diet
NOX: NADPH oxidase
ΔΨ: mitochondrial membrane potential

vi
Acknowledgements
First, it is my great honor to be the only PhD student Tabas Lab in the past 10 years. As the only student
in the lab, Dr. Tabas gave enough patient and freedom to me to learn from trials and errors. We have
unique 1 to1 meetings, when Dr. Tabas and I sit face to face to discuss the details of all the experiments
and project progress once every two weeks. Dr. Tabas is very busy, but he is always available to me
whenever I need his input. My training covers all corners of what is needed to be an independent
investigator. Besides doing experiments, I was also trained on how to think logically, how to give a
scientific talk in public, how to write a grand application, how to prepare a manuscript for publication and
how to critically judge peers’ work as a reviewer. Therefore, I would like to express my gratitude to Dr.
Tabas and Tabas Lab, for this comprehensive training.
People from Tabas lab are all very supportive for my study. We discuss experimental designs
and interpret data together almost every day, and everyone is my co-mentor during the PhD training.
George Kuriakose, the technician who has over twenty years’ experience in atherosclerosis study, has
assisted me with all the lesion analysis. Dr. Edward Thorpe, who is now the assistant professor in
Northwestern University, taught me how to write a grant. With his help, I was nominated by Columbia
University for a predoctoral student fellowship application from HHMI. Moreover, I was awarded the AHA
predoctoral student fellowship. Dr. Lale Ozcan, an outstanding scientist in the lab, directly supervised
me during my rotation in the Tabas lab. She was the one who led me into the interesting world of
mitochondria, and introduced me to the molecule called DRP1. Dr. Christopher Scull, a previous postdoc
fellow, was sitting next to me. He supported me to get over all the difficulties at the beginning of being a
PhD student. Dr. Connie Woo, a previous postdoc fellow, is now an assistant professor in the University
of Hong Kong. We used to interpret data together, and I learned how to be a scientific thinker from her. I
would also like to thank other members in the lab, Dr. Manikandan Subramanian, Dr. Xianghai Liao, Dr.
Xiaobo Wang, Dr. Bishuang Cai, Dr. Devram Ghorpade and Dr. Gabriella Fredman. Without their help
and guidance, I couldn’t have been so productive.
I am also grateful to my qualify, thesis and thesis defense committee members for their input into
my studies. The qualify committee: Dr. Henry Colecraft, Dr. Gilbert Di Paolo, Dr. Eric Schon, Dr. Alan Tall,

vii
and Dr. Jahar Battacharya, guided me to the correct directions of my study. The thesis committee, Dr.
Jahar Battacharya, Dr. Eric Schon, Dr. Alan Tall and Dr. Tabas, provided me tremendous good ideas and
helped speed up the project progress. To my defense committee, Dr. Jahar Battacharya, Dr. Eric, Schon,
Dr. Alan Tall, Dr. Domenico Accili and Dr. Tabas, I sincerely appreciate their critical judging and editing
this thesis. Their input composes an extraordinary important part of my PhD training.
Our collaborator Dr. Peter Rabinovitch shared this mCAT transgenic mice with us, and allowed us
to answer the question on the causative role of mitoOS in atherosclerosis. Dr. Masatoshi Nomura, from
Japan, provided us the DRP1fl/fl
mice, and gave us an opportunity to first study the roles of mitochondria
fission in myeloid cells.
There are so many world top scientists on CUMC campus, which provided me great opportunities
to learn from them. We got technical support from Dr. Sankar Ghosh, Dr. Rober Schwabe and Dr. Jean-
Philippe Pradere on Nf-kB study. We got consultations from outstanding statisticians Dr. Sekhar
Ramakrishnan and Steve Holleran. Lots of ideas and new assays came from the discussion with Drs in
Tall Lab: Dr. Chien Liang, Dr. Nan Wang, Dr. Carrie Welch, Dr. Andrew Murphy, Dr. Marrt Westerterp and
Dr. Mi Wang.
I would also like to thank the people from core facilities. They trained me how to use different
critical tools for my study. Kristy Brown helped me perform transmission electronic microscopy analysis
to access mitochondrial morphology. Dr. Theresa Swayne, Dr. Cedric Espenel and Dr. Adam White from
ICRC confocal microscope core facility taught me how to make the most use of confocal microscopy. Dr.
Siuhong Ho from CCTI FACS facility introduced me to flow cytometry analysis.
They whole thesis is supported by the training grand from Department of Physiology and Cellular
Biophysics, the predoctoral fellowship award from American Heart Association to Ying Wang, and the
research funding awarded to Dr. Ira Tabas from NIH.
Last but not least, I deeply appreciate the strong support from my family. My twin sister Dr. Wei
Wang, my husband Dr. Gary Wang, my Grandpa Dr. Zhenyi Wang, my parents Kang Huang and Dr.
Zhiqin Wang, and parents in-law Fengzhi Liu and Xiaojun Wang. With their support, I am able to be a

viii
mother and finish the PhD training within 5 years. The coming of my daughter, Emily Wang, makes me
stronger. She gave me all the courage to face and handle the difficulties in the long run of PhD training.
Thanks for the past five years, and I am ready to open the next page of my life.
Ying Wang
April 2014

1
Chapter 1*
Introduction: Mitochondrial Derived ROS and its Regulation in Atherosclerosis
* This chapter is a part of the article “Emerging roles of mitochondria ROS in atherosclerotic lesions: causation or association? J Atheroscler Thromb, 2014. The first author and corresponding author of this article is the author of this thesis.

2
Mitochondrial Derived ROS and its regulation
Mitochondrial reactive oxygen species (mtROS) are natural by-products of the electron
transportation chain (ETC), a key step in the generation of ATP through oxidative phosphorylation
(OXPHOS).1 In this process, as the electrons are shuttled through a group of protein complexes
(complex I-V), electron leakage from Complex I and III results in partial reduction of oxygen and the
production of superoxide (O2•- ). O2•
- is then converted to an intermediate product hydrogen peroxide
(H2O2) by matrix manganese superoxide dismutase (MnSOD, SOD2) or Cu/ZnSOD in the mitochondrial
intermembrane space. H2O2 is further reduced to H2O through glutathione peroxidase (GPX) and
circulating reduced glutathione (GSH) and oxidized glutathione (GSSH). This antioxidant system is
essential for preventing the generation and accumulation of highly reactive products such as peroxynitrite
(OONO-), a product of nitric oxide (NO) with O2•-, and hydroxal radical (•HO), a product of the Fenton
reaction between Fe2+
with H2O2. Consequently, this antioxidant system protects the mitochondria from
mtROS-induced mtDNA damage, protein modification (oxidation and nitration), and lipid peroxidation
under normal and pathological conditions.
Convincing evidence supports the concept that mtROS plays physiologic roles through second
messenger generation and signal transduction reactions to maintain cellular homeostasis in the vascular
wall.2 For example, sheer stress-induced H2O2 formation and adaptive vasodilation are mediated by O2•
-
from mitochondria.3, 4
However, excessive mtROS has been implicated in pathophysiologic processes in
humans and animal models, including cardiovascular, neurodegenerative diseases, and aging.5-7
The
balance between mtROS generation and clearance controls mitochondrial oxidative status. This balance
is regulated by the mitochondria metabolic status, cross inner-membrane potential (ΔΨ), ETC complexes
and antioxidant enzyme activities, uncoupling proteins (UCPs), components of mitochondrial fusion and
fission machinery (DRP1, OPA1 and MFNs), and mitochondrial autophagy “mitophagy”.

3
Evidence of excessive mtROS in atherosclerotic lesions
Due to the physical proximity of mtDNA to ETC-derived ROS and the lack of protective histone or
DNA repair mechanisms that occur in the nuclear genome, mtDNA is much more vulnerable to oxidative
damage than genomic DNA.8, 9
8-OHdG (8-hydroxydeoxyguanosine) is one of the major DNA products
formed upon oxidative damage of DNA in various pathological conditions.10-13
8-OHdG accumulation has
been observed in circulating leukocytes and in various cell types in human and murine atherosclerotic
lesions, such as those that occur in the aortic root of Ldlr-/-
and Apoe-/-
mice fed a high-fat Western-type
diet (WD).12-14
In line with this finding, a 5-kb mtDNA deletion, referred to as “the common mtDNA
deletion,” has been identified in mouse and human atherosclerotic lesions and was found to be closely
associated with the extent of atherosclerosis.15
Furthermore, human and rabbit atherosclerotic lesions
react with an antibody that recognizes an oxidized form of cardiolipin, a phospholipid exclusively
expressed in mitochondria, suggesting excessive mtROS.16
Thus, several lines of evidence indicate that
excessive mtROS-induced oxidative damage occurs in atherosclerotic lesions of both animal models and
humans.

4
Why does excessive mtROS occur in atherosclerosis?
Failure of mitochondrial antioxidant functions. The antioxidant enzyme systems located in the
inner membrane of mitochondria are the first line of defense against the excessive production of mtROS
from ETC. Emerging evidence supports the notion that in the early stages of disease development,
antioxidant enzyme levels and activities are compensatorily enhanced to maintain redox homeostasis.
However, as the disease progresses, antioxidant enzyme levels decline.17-19
With regard to
atherosclerosis, the aortae of Apoe-/-
mice were shown to respond to atherogenic stimuli by an early
increase and then subsequent decrease in the expression of antioxidant enzymes, including
mitochondrial specific antioxidant GPX1 and SOD2.19
Similarly, MnSOD expression and parallel enzyme
activities were reported to be enhanced only in viable cells, but not in apoptotic cells, in human
atherosclerotic lesions.17
In advanced atherosclerosis or atherosclerosis accompanied with hemodialysis
(HD), diabetes, and smoking, excessive mtROS is observed and is associated with a marked decrease in
the activity of these antioxidant enzymes. For example, HD patients were shown to have a significantly
higher carotid artery intima media thickness (CIMT) compared with healthy controls, and the levels of
SOD and GPX were negatively correlated with CIMT.12
Another study showed that the specific activity of
SOD2 in Apoe-/-
mice exposed to second hand smoke was significantly decreased and mitochondria
function was impaired.20
In another study, endothelial cells isolated from type 2 diabetes mice had a
lower level of SOD2 expression compared with non-diabetic controls, which was associated with a higher
amount of mtROS and impaired endothelial function.18
Together, these observations suggest that
mitochondrial oxidative stress and damage in the advanced stages of atherosclerosis are due, at least in
part, to the failure of antioxidant mechanisms. The underlying mechanisms explaining the failure of
mitochondrial antioxidant function in advanced disease stages are not completely understood. Examples
of hypotheses being explored in this area include peroxynitrite-mediated inactivation of MnSOD221
and
proteasome-mediated degradation of certain antioxidant enzymes.18
Experimental models have been used to test the concept that antioxidant enzyme disruption can
promote atherosclerosis. For example, athero-prone regions of the aorta in heterozygous Sod2+/-
Apoe-/-
mice have accelerated atherosclerosis, mtDNA damage, and accumulation of 3-nitrosylated proteins,
which is a protein marker of excess ROS. These changes were further amplified after exposure to

5
cigarette smoke, which enhances the degree of oxidative stress.20
Moreover, Apoe-/-
mice with a targeted
deletion of mitochondrial-localized GPX1 had accelerated atherosclerosis compared with Gpx1+/+
control
mice, but only after long-term WD feeding22
or under diabetic conditions.23
Our group has addressed this
issue by quelling endogenous mtROS in macrophages in the setting of atherosclerosis. We used a
macrophage-targeted transgenic catalase (mCAT) model in which the presence of catalase in the
mitochondria matrix degrades H2O2. Macrophages in mCAT lesions were protected from mtDNA
oxidation, and these mice had decreased atherosclerosis in the Ldlr-/-
background.24
The general role of ROS in atherosclerosis represents a highly controversial area.15, 25-27
One
possible explanation is the differential roles of various ROS-generating systems in lesional cells. For
example, mouse models of atherosclerosis with deletion of the NADPH oxidase (NOX) component P4727
or with overexpression of catalase,26, 27
which reduces cytosolic H2O2, had less atherosclerosis.
However, no athero-protective effect was found in a model with overexpression of Cu/Zn-SOD (Sod1), a
cytosolic SOD isoform that reduces O2•-.26
The explanation may lie in divergent intracellular signaling
pathways triggered by ROS from specific cellular compartments. For example, one study showed
cytosolic SOD1 can suppress smooth muscle cell (SMC) proliferation through the inhibition of mitogenic
ERK/P38 MAPK pathways. In contrast, mitochondrial SOD2 suppresses SMC proliferation by inhibiting
JAK2/STAT signaling.28
Another study demonstrated that angiotensin II activated the kinases MAPK,
JNK and ERK5 through NOX-derived ROS, while ET-1 activated these enzymes through mtROS.4
Therefore, in order to guide the development of antioxidant therapy, we need a more thorough
understanding of the differential roles of the various ROS-generating systems in cells in the specific
disease settings.
Autophagy (mitophagy) dysfunction. Macroautophagy (autophagy) is a cellular process that
delivers cytoplasmic contents to lysosomes for degradation and recycling. Because normal mitochondrial
function is critical for cell survival, cells develop a defense mechanism against aberrant or damaged
mitochondria. This machinery involves selective recognition, sequestration, and subsequent clearance
of damaged mitochondria using the common machinery of macroautophagy. This process has been
called mitochondria autophagy, or mitophagy.29
As such, mitophagy is another layer of protection against

6
excessive mtROS, because mtROS is known to accumulate in damaged mitochondria. Interestingly,
mtROS itself regulates mitophagy. Excessive mtROS can lead to mitochondrial depolarization, and the
loss of ΔΨ can trigger E3 ubiquitin ligase-mediated Parkin activation. Parkin then ubiquitinates
mitochondrial proteins, and these ubiquitinated proteins serve as a signal for mitophagy.30, 31
Parkin itself
can be modified by oxidative/nitrosative stress but then inactivated under excessive oxidative stress
conditions,32, 33
which can lead to the failure of mitophagy. ROS can also directly regulate
autophagosomes formation. ATG4, an essential component of autophagy, is subject to oxidation and
subsequent inactivation by excessive ROS, which can then lead to dysregulation of mitophagy.31
An interesting hypothesis is that basal mitophagy is athero-protective by disposing of damaged
mitochondria and this process may go awry in advanced atherosclerosis. Defective mitophagy would
then promote mitochondrial dysfunction and cell apoptosis, which is a process that can lead to the
formation of necrotic cores and unstable plaques. Two recent mouse atherosclerosis studies studied the
effect of deletion of the essential autophagy protein ATG5 in macrophages.34, 35
In one study, the primary
observation was larger lesion area associated with enhanced inflammasome activation. Given links
between mtROS and inflammasome activation,36, 37
the authors proposed that the potential underlying
mechanism was related to a defect in mitophagy, and although mtROS was not measured, there was an
increase in lesional protein oxidation and superoxide. The other study found an increase in necrotic
lesions in the ATG5-deficient mice, which was associated with an increase in lesional NOX activity and
ROS. Here again mtROS was not assayed, but ROS from NOX and other sources has been shown in
other models to induce mtROS from mitochondria in a process called ROS-induced ROS release
(RIRR).38
Although mtROS was not specifically assayed, we found that the mitochondria in macrophages
of the ATG5-deficient lesions demonstrated loss of normal cristae morphology and were swollen
(unpublished data). Thus, it is possible that production of mtROS could result from cytosolic ROS
accumulation,39, 40
and without mitophagy, mtROS-damaged mitochondria accumulate and activate
mitochondrial cell death pathways.38, 41
This hypothesis is supported by data from our group (unpublished)
and others that mtROS is higher in ATG5-deficient vs. wild-type macrophages42
and that damaged
mitochondria accumulated in ATG5-deficient lesions (above).
7
A recent study used a genetic model with deletion of LOX-1, the receptor that mediates oxLDL-
induced autophagy. They showed that human umbilical vein endothelial cells (HUVECs) without LOX-1
had diminished autophagy induction, increased mtROS, and damaged mtDNA-induced TLR9 activation
after oxLDL treatment in vitro. Furthermore, Lox1-/-
Ldlr-/-
mice had diminished autophagy, increased
mtROS-induced mtDNA damage, more potent activation of TLR9, and increased lesional macrophage
infiltration. These data raise the possibility that mtROS-induced mtDNA damage that escapes mitophagy
can induce a potent TLR9 activation in atherosclerosis.43
In summary, it is possible that a failure of
mitophagy in advanced atherosclerosis promotes excessive mtROS and the accumulation of damaged
mitochondria, which in turn could trigger inflammatory responses and cell death. However, this
hypothesis is based on models in which overall autophagy is disabled. Thus, more specific models in
which mitophagy is specifically inactivated or enhanced are needed to test the role of mitophagy in
atherosclerosis.
Mitochondrial fission and fusion. The mitochondrial dynamic processes of fission and fusion
influence and integrate with multiple physiologic and pathophysiologic processes, including mitosis,
mitochondria metabolism, mitochondrial quality control (mitophagy), mtROS, and cell death.44-46
Diseases such as pulmonary arterial hypertension, arterial restenosis, hypertension, Parkinson’s disease,
and obesity and diabetes have been associated with abnormalities in mitochondrial dynamics.47-49
Mitochondrial fission and fusion are regulated by several different GTPases. Mitofusin 1 (MFN1) and
mitofusin 2 (MFN2) regulate outer membrane fusion, whereas optic atrophy protein 1 (OPA1) mediates
inner membrane fusion. Mitochondrial fission is activated by a cytosolic molecule called dynamin-related
protein 1 (DRP1) and its docking protein fission 1 (FIS1) and mitochondria fission factor (MFF). It is
known that under stress conditions such as hyperglycemia, ischemia reperfusion, neurodegeneration,
and aging, mitochondria usually undergo hyperfission. Hyperfission has been shown to induce excessive
mtROS in vascular smooth muscle cells (VSMC), cardiomyocytes, renal cells, fibroblast, and neurons.44-46
MFN2 deficiency and DRP1 activation have been linked to smooth muscle cell (SMC) hyperproliferation in
pulmonary artery hypertension.50, 51
In atherosclerosis, data suggest that mitochondria dynamic changes
may facilitate mtROS production. For example, Mfn2 mRNA was progressively reduced in the lesions of

8
Apoe-/-
mice artery during the development of atherosclerosis.52
Given that mtROS increases with lesion
progression, this observation suggests the theoretical possibility that a decrease in MFN2 may
progressively shift the mitochondria morphology toward hyperfission, which in turn may contribute to
excessive mtROS production. Consistent with this idea, a study in rabbit reported that overexpression of
MFN2 was associated with reduced atherosclerosis.53
Interestingly, diabetic venous endothelial cells
were shown to have increased mitochondrial fission and a higher level of the mitochondrial fission protein
Fis1, which could contribute to mtROS overproduction and enhanced susceptibility to atherosclerosis.54
While these studies hint at some interesting associations between mitochondrial dynamics and
atherosclerosis, more precise in vivo models and more in-depth mechanist studies are needed to address
the functional significance of mitochondria fission and fusion in atherosclerosis.
Dysregulation of UCP2. Uncoupling protein 2 (UCP2) is a mitochondria inner membrane protein
that decreases mtROS production and is the dominant form of UCP that is expressed in vascular cells.
UCP2 promoter polymorphisms in humans are associated with multiple pathological conditions, including
obesity, diabetes, and atherosclerosis.55-58
Additionally, UCP2 expression is increased in the aorta of
cholesterol-fed C57BL/6J mice,59
and Ucp2-/-
mice have larger and more macrophage-rich atherosclerotic
lesions both in this model and in chow-fed Apoe-/-
mice.15
The increase in atherosclerosis is associated
with increased mtROS production. Interestingly, the compensatory enhancement of antioxidant activity,
including SOD2 and GPX1, that normally occurs in early lesions is blunted in the setting of UCP2
deficiency. These data suggest that UCP2 is up-regulated in response to an atherogenic diet and is
required to maintain normal antioxidant activity in the mitochondria of vascular cells. Mechanistically,
UCP2 can suppress mtROS production, maintain normal endothelial function (eNOS release), promote
vascular relaxation, decrease NF-κB activation, and inhibit the expression of the pro-inflammatory
adhesion molecule VCAM-1 expression in endothelial cells.60, 61
Overexpression of UCP2 in THP-1
monocytes quenches steady-state ROS production, which would be expected to decrease
transendothelial migration of monocytes.62
Taken together, these data suggest that UCP2 is a part of the
protective compensatory response that maintains the adaptive activation of SOD2 and GPX1 and their
activities during the early stage of atherosclerosis. While UCP2 can be activated by O2•−
,63
how UCP2 is

9
up-regulated and activated during early atherosclerosis and how it is affected by atherosclerosis
progression are not known. Thus, further causation studies are required to test the hypothesis that UCP2
dysfunction contributes to the failure of antioxidant capability and leads to mtROS overproduction in
advanced atherosclerosis.

10
Consequences of excessive mtROS
Overproduction of mtROS may increase inflammation in atherosclerosis. mtROS has been linked
to the activation of inflammatory pathways involving NF-κB, TLR9, and the inflammasome. Our group
reported that mtROS can activate the IKK-NF-κB pathway and thereby enhance the induction of the
chemokine CCL2 in LPS-treated macrophages. In atherosclerotic lesions, suppressing mtROS in
macrophages reduces inflammatory cytokine expression, including TNF-α and iNOS.24
Similar to
bacterial DNA, mtDNA contains inflammation-inducing unmethylated CpG motifs . In ischemia-
reperfusion, shock, tissue injury settings, and systemic inflammatory syndromes, damaged mtDNA is
sensed by TLR9 and thereby amplifies the inflammatory response. 64, 65
Blocking mtROS-induced mtDNA
leakage has been shown to suppress TLR9 activation in HUVECs in vitro and in Ldlr-/-
lesions. Activation
of TLR9 signaling correlates with an increased macrophages in lesions, suggesting a pro-inflammatory
role of mtDNA in atherosclerosis.43
Furthermore, human and animal studies have provided evidence
supporting the causative role of the NLRP3-IL-1β inflammasome activation in atherosclerosis,66-68
and
mtROS and oxidative mtDNA damage has been linked to inflammasome activation under multiple
pathological conditions.36, 37
The exact role of a mtROS-inflammasome axis in atherosclerosis requires
further investigation using tools that specifically manipulate and measure these processes.
mtROS and mtDNA damage in atherosclerosis. mtDNA contains 13 genes encoding essential
proteins involved in oxidative phosphorylation (OXPHOS), 12S and 16S ribosomal RNAs, and 22 transfer
RNAs. As mentioned previously in this review, mtDNA is more vulnerable to ROS-induced damage than
nuclear DNA.9 Signs of mtDNA damage, including mtDNA mutations and deletions, and the
aforementioned 5-kb mtDNA deletion have been identified in atherosclerotic lesions and are correlated
with the extent of atherosclerosis. Additionally, mtDNA mutations in the MT-RNR1, MT-TL1, MT-ND2,
MT-ND5 and MT-CYB genes are associated with atherosclerosis in human plaques.69
Diabetes is one of
the major risk factors for atherosclerosis, and there is a report that diabetic atherogenesis is associated
with decreased mtDNA copy number.70
A recent study examined Apoe-/-
mice that were haploinsufficient for the protein kinase ATM,
which coordinates both nuclear and mitochondrial DNA repair. These mice developed multiple features

11
of metabolic syndrome and accelerated atherosclerosis, with increased frequency of the 5-kb mtDNA
deletion and reduced oxidative phosphorylation. These changes were abrogated by transplantation of
WT bone marrow into to the ATM-deficient mice,71
indicating the involvement of myeloid-derived cells.
To further clarify the role of mtDNA in atherosclerosis, the same group targeted DNA polymerase gamma
(polG), the only enzyme responsible for proof-reading activity during mtDNA proliferation, and they found
that these Polg-/-
Apoe-/-
mice accumulated somatic point mutations in mtDNA and accelerated
atherosclerosis.72
Mechanistically, mtDNA damage directly compromises OXPHOS, and Polg-/-
Apoe-/-
lesions had enhanced mtDNA damage, reduced levels of ETC complex I, II and IV, and dysfunction of
mitochondrial OXPHOS. To probe the cellular mechanisms, the investigators treated HUVECs and
human aortic smooth muscle cells (HASMCs) with H2O2 and ONOO− and found mtDNA deletions,
decreased mtDNA-encoded mRNA and proteins, reduced ATP levels, and loss of ΔΨ.73
These data
support the notion that somatic mtDNA mutations are sufficient to cause atherosclerosis progression.
Lipid peroxidation and abnormal protein modification. mtROS also leads to abnormal
mitochondrial protein modification, including cysteine oxidation, cysteine nitrosylation and tyrosine
nitration, and lipid peroxidation followed by degradation. O2•- interacts with NO to form OONO
-, a highly
reactive species that can nitrate tyrosine residues and nitrosylate serine residues. •HO derived from H2O2
through the Fenton reaction leads to mtDNA oxidative damage and protein oxidation. These protein
modifications can result in detrimental consequences, such as alteration of protein function, activation of
immune and inflammatory responses, and activation of cell death pathways.16, 74
Oxidatively modified
proteins and lipoproteins, including oxidized LDL, lipid peroxidation products, and nitrated tyrosines, have
been identified in patients with coronary artery disease and in atherosclerotic animal models.15, 75, 76
Mitochondrial antioxidant enzymes and ETC complexes could be potential targets of such abnormal
protein modifications. For example, tyrosine nitration of MnSOD2 by OONO- causes inactivation of
MnSOD2, which may contribute to the overproduction of mtROS in vascular cells. 21, 77
Another study
using rat pulmonary microvascular endothelial cells demonstrated that NO and mitochondrial derived O2•-
altered mitochondrial function through tyrosine nitration of a mitochondrial protein called NDUFB8, which
then triggered RIP1-mediated cell necrosis.78
Moreover, oxidized cardiolipin increases as atherosclerosis

12
progresses, which may not only be a marker of mtROS but might contribute to pathophysiology.16
In
summary, mtROS-induced modification of mitochondrial proteins and lipids could very well contribute to
the pro-atherosclerotic effects of mtROS, but specific in vivo causation studies are needed to investigate
this mechanism.
Conclusion
An increasing numbers of studies have suggested an association between mtROS and
atherosclerosis, and a few of these have begun to address the critical issue of causation. Moreover,
mechanistic studies have explored how a healthy level of mtROS is maintained in physiology; how it may
go awry in pathophysiology, including advanced atherosclerosis; and how excessive mtROS promotes
disease progression (Figure I). Further understanding of these issues in the area of advanced
atherosclerosis progression may provide new and more specific therapeutics. This more targeted
approach may overcome some of the inconsistencies that have plagued the general field of anti-oxidant
therapy for atherosclerotic vascular disease.

13
Figure 1

14
Figure I: Regulation of healthy level and excessive mtROS.
A, Under physiological conditions, mtROS is generated as a byproduct of electron transport and
quenched by the mitochondrial antioxidant enzymes (MnSOD and GPX). Moreover, mtROS production is
tempered by uncoupling protein 2 (UCP2). In the course of normal mitochondrial physiology, sporadic
episodes of mitochondrial dysfunction are handled by a process involving mitochondrial fission and
mitophagy. Fission is promoted by the proteins DRP1 and FIS1, and the converse process of fusion is
promoted by MFN1/2 and OPA1. PINK1 and Parkin mediate the ubiquitination and recognition of
damaged mitochondria by the mitophagy complex, which is depicted by the double membrane structure.
B, Under pathophysiologic conditions, excess mtROS, especially the highly reactive molecules •HO and
OONO-, can result from (1) inactivation or degradation of MnSOD; (2) inactivation of Gpx; (3) dysfunction
of UCP2 ; (4) dysregulation of mitochondrial fission/fusion dynamics; (5) or inactivation mitophagy lead to
mitophagy deficiency. Excessive mtROS can damage electron complex complexes and reduce ATP
generation; oxidatively damage mtDNA, leading to inflammasome activation; trigger cytochrome C (CytoC)
release and apoptosis; and open the mitochondria permeable transition pore (mPTP) to cause cell
necrosis.

15
Chapter 2*
Macrophage Mitochondrial Oxidative Stress Promotes Atherosclerosis and Nuclear Factor-κB-Mediated
Inflammation in Macrophages
* This chapter is from the article “Macrophage Mitochondrial Oxidative Stress Promotes Atherosclerosis and Nuclear Factor-κB-Mediated Inflammation in Macrophages”. Circ Res. 2014 Jan 31;114(3):421-33, in which the first author is the author of this thesis.

16
Introduction
Oxidative phosphorylation in the mitochondria produces limited, physiologic levels of superoxide,
most of which is converted to hydrogen peroxide by superoxide dismutase (SOD).79
While this process is
adaptive under normal conditions, excessive mitochondrial oxidative stress (mitoOS) has been correlated
with a number of diseases, including atherosclerotic vascular disease in humans.80, 81
However, definitive
evidence of causation and cell-specific pro-atherogenic mechanisms of mitoOS require further
investigation.82, 83
For example, while several important studies demonstrated that genetic targeting of
Mn-SOD or uncoupling protein-2 increases mitoOS and worsens atherosclerosis,15, 84
the role of
endogenous mitoOS is not addressed by this experimental strategy. Another elegant study showed that
endothelial-targeted overexpression of thioredoxin 2, an anti-oxidant enzyme that has been identified in
mitochondria, increased total anti-oxidant activity, lowered ROS, promoted NO formation, and improved
endothelial function.81
When crossed onto the Apoe-/-
background, thoracic aortic rings showed improved
relaxation, and atherosclerotic lesion size was decreased. Whether the atherosclerosis endpoint was
mechanistically related to lesional endothelial mitoOS, the aortic ring data, or other possible mechanisms
remains to be determined in this model.
The high level of interest in this topic, the human relevance, and the potential therapeutic
implications prompted us to explore causation and mechanism with a focus on the key inflammatory cell
type in atherosclerosis, the macrophage. For this purpose, we used a recently described model, the
mitochondrial catalase (mCAT) transgenic mouse, that decreases mitoOS in vivo.5 Normally, glutathione
perioxidase is the endogenous mitochondrial enzyme that catalyzes the reduction of H2O2 and prevents
its conversion into the most detrimental ROS hydroxyl nitrites. Catalase can carry out this role in
peroxisomes, where it is exclusively located. The mCAT transgenic mouse expresses human catalase
with a mitochondrial matrix-targeting motif, which quenches mitoOS and protects against mitoOS-induced
damage. To focus on myeloid-derived cells in atherosclerosis, we used two strategies: transplantation of
mCAT transgenic bone marrow cells into atheroprone Ldlr-/-
mice and crossing Ldlr-/-
mice with an
mCATfl/-
LysMCre model that expresses mCAT only in lysozyme M-expressing cells, notably differentiated
macrophages. Both models demonstrated evidence of decreased mitoOS in lesional macrophages,
decreased atherosclerosis, and suppression of inflammatory monocyte infiltration. In vitro and in vivo

17
mechanistic studies suggest that macrophage mitoOS promotes monocyte chemotactic protein-1 (MCP-1)
production through enhancing the Iκ-kinase (IKK) - RelA NF-κB pathway.

18
Methods
Animals and Diets
C57BL/6J (000664) and Ldlr-/-
(002381) mice on the C57BL/6J background were purchased from Jackson
Laboratory. mCAT transgenic and floxed mice were generated as described previously 5, 85
and were
backcrossed >10 times onto the C57BL/6J background. For the atherosclerosis study, mCAT transgenic
and age/gender-matched littermates were used as donors. Ldlr-/-
male mice, at 14 weeks of age and 6
weeks after the bone marrow transplant, were placed on a Western-type diet (TD88137; Harlan Teklad)
for the indicated periods of time.
Atherosclerotic Lesion Analysis
For morphometric lesion analysis, sections were stained with Harris’ hematoxylin and eosin. The total
lesion area and necrotic area were quantified as previously described.86
For immunostaining, specimens
were immersed in OCT and 6-µm sections were prepared and placed on glass slides. The sections were
fixed and permeabilized with ice-cold acetone for 10 min. Paraffin-embedded specimens were sectioned,
de-paraffinized with xylene, and rehydrated in decreasing concentrations of ethanol. Sections were then
incubated overnight at 4C with anti-Mac-3 (BD Clone M3/84, 1:200), anti-8-OHdG (EMD Millipore,
AB5830, 1:200), anti-NF-κB P65 p-S536 (Cell Signaling, 3033, 1:40), FITC-labeled smooth muscle cell
-actin antibody (FITC-labeled, clone 1A4, Sigma-Aldrich, 1:1000), or anti-CD11c (PE labeled, clone
HL3, BD Biosciences, 1:200) antibody. The sections were then incubated with biotinylated anti-rat, anti-
goat IgG, or anti-rabbit secondary antibody (Vector) and then streptavidin-conjugated Alexa 488- or Alexa
594-labeled antibody (Life Technology). Sections were counter-stained with DAPI to identify nuclei
before mounting.
Measurement of 8-OHdG in Lesional and Cultured Macrophages
Evidence of mitoOS in lesional macrophages was obtained by assaying oxidative damage of non-nuclear
(mitochondrial) DNA. Specifically, cryo-sections were stained sequentially with anti-8-
hydroxydeoxyguanosine (8-OHdG) and anti-Mac-3 primary antibodies, biotinylated secondary antibodies
19
(Vector ABC Kit), Alexa 488- and 594-labeled streptavidin, and 4',6-diamidino-2-phenylindole (DAPI),
which was used to measure the total number of cells and to identify nuclei. Sections were then imaged
by confocal microscopy (Nikon A1 Confocal with -100X oil objective at -0.10-μm thickness). Data were
quantified as both the percentage of total Mac3+ cells and the total number of Mac3+ cells showing 8-
OHdG staining that did not overlap with DAPI, i.e., as an indicator of exposure of mitochondrial DNA to
oxidative stress. To assay mitochondrial 8-OHdG in cultured macrophages, sections were fixed and
permeabilized with pre-chilled acetone on ice for 10 min, stained with anti-8-OHdG and anti-ATP
synthase 5α (Abcam ab110273 1:200) primary antibodies at 4°C overnight, followed by anti-goat-
Alexa488 and anti-mouse-Alexa647 secondary antibodies. The sections were then counter-stained with
DAPI and visualized by confocal microscopy as above.
Measurement of Mitochondrial and Cytosolic ROS in Cultured Macrophages
Peritoneal macrophages from adult female C57BL/6J mice and mCAT transgenic mice were harvested 3
days after i.p. injection of concanavalin A or four days after i.p. injection of methyl-BSA (mBSA) in mice
previously immunized with mBSA.87
All macrophages were grown in full medium containing Dulbecco's
Modified Eagle Medium (DMEM; 25 mM glucose, phenol-red free), 10% fetal bovine serum (FBS), 20% L-
cell conditioned medium, and 1% penicillin/streptomycin/ glutamine solution (GIBCO) on non-tissue
culture coated plates. The medium was replaced every 24 h until the cells reached 90% confluence. On
the day of the experiment, the cells were pre-incubated with 5 µM of the mitochondrial superoxide
indicator MitoSOX at 37°C for 30 min. The cells were then rinsed in warm culture medium, and
treatments as described in the figure legends were started 6 h later. At the end of incubation period, cells
were dissociated from the petri dish and subjected to flow cytometric analysis (BD Canto II) using the
Phycoerythrin (PE) channel. Data were quantified as fold change of medium fluorescent intensity (MFI)
compared with baseline. For live cell imaging, cells were stained with Mitotracker Green (100 nM) for 15
min, followed by three washes with warm medium. The cells were then imaged immediately at room
temperature using confocal microscopy. For measuring cytosolic ROS, cells were incubated with 2.5 µM
CellROX Deep Red (Life Technology) at 37°C for 30 min and then subjected to FACS analysis.
20
Monocyte Infiltration Experiment
To track newly recruited monocytes in atherosclerotic lesions, the Ly6chi subset of monocytes was
labeled with fluorescent beads as described previously.88
Briefly, 96 h before the end of study, the mice
were injected i.v. with 250 μl clodronate-containing liposomes
(http://clodronateliposomes.org/ashwindigital.asp?docid=26) to deplete monocytes. After 48 h, the mice
were injected with 250 μl of a 1:4 dilution of 1 μm Fluoresbrite Plain YG microspheres (Polysciences).
After another 48 h, the mice were euthanized, and peripheral blood samples were analyzed by FACS to
quantify the efficiency of bead labeling of Ly6chi monocytes. The heart and aortic tissues were processed
as described above. The newly recruited bead-labeled monocytes in atherosclerotic lesions were
visualized by fluorescence microscopy and quantified using Image J.
Reagents
Falcon tissue culture plastic was purchased from Fisher Scientific. Tissue culture media, cell culture
reagents, and heat-inactivated fetal bovine serum (FBS) were from GIBCO. Lipopolysaccharide (LPS)
and concanavalin A were obtained from Sigma. All organic solvents were from Fischer Scientific.
MitoSOX, MitoTracker Green (MTG), CellROX Deep Red, and streptavidin-conjugated Alexa 488/594
were obtained from Life Technology. The insulin ELISA kit was from Millipore. Antibodies were
purchased from the following sources: Cell Signaling Technology for p-NF-κB(S536), NF-κB, P-IKKα/β
(T177), IKKβ , P38-MAPK, P-P38-MAPK, P-JNK(T183/Y185); BD Biosciences for CD45-APC, Gr-1-
PerCP, CD115-APC Cy5, Mac-3 antibody and biotinylated anti-rat IgG; Abcam for mouse monoclonal
antibody to β-actin and catalase; R&D for ICAM-1 (AF720) and VCAM-1 (AF643); and Jackson
ImmunoResearch for horseradish peroxidase-conjugated goat anti-rabbit IgG, donkey anti-mouse IgG
secondary antibodies. Lp(a) and oxLDL were purchased from biomedical technologies. mmLDL was the
gift from Dr. Yuri Miller at UCSD.
Bone Marrow Transplantation (BMT)

21
10-week-old male Ldlr-/-
mice were lethally irradiated using an X-ray source (Precision X-RAD 320
Biological Irradiator) at a dose of 1000 rad 4–6 h before transplantation. Bone marrow cells were
collected from the femurs and tibias of donor wild-type and mCAT transgenic mice by flushing with sterile
medium as described previously.89
All animal procedures used in this study followed Columbia
University’s institutional guidelines.
Immunoblot
Cells were lysed in a buffer containing 2x Laemmli sample buffer (Bio-Rad) plus 50 mM DTT and boiled at
100ºC for 5 min. Aliquots of lysate protein (100 µg) were separated on 4-20% gradient SDS-PAGE gels
(Invitrogen) and electrotransferred to 0.45-µm nitrocellulose membranes using a Bio-Rad mini-transfer
tank. Membranes were incubated at 4C with primary antibodies overnight, and the protein bands were
detected with horseradish peroxidase-conjugated secondary antibodies and Supersignal West Pico-
enhanced chemiluminescent solution (Pierce). Membranes were stripped with Restore Western Blot
Stripping Buffer (Pierce) for 15 min at room temperature before being immunoblotted with antibodies
against housekeeping proteins, which were used as loading controls. Image J software was used for
quantification of densitometric ratio of protein of interest loading control.
Macrophage Transfection
Mouse IKK (11103) and RelA (20012) plasmids were purchased from Addgene. Individual plasmids (0.5
µg) were mixed with 2 μl jetPEI macrophage transfection reagent (VWR, 103-01N) and incubated with
1.5x10⁵ peritoneal macrophages in 24-well plates at 80-90% confluence. After 40 h, the macrophages
were treated with LPS or vehicle as indicated. Transfection efficiency was assayed by immunoblot
analysis of IKK and RelA from total cell lysate.
Peripheral Blood Cell Profiling
At each time point, ~ 40 µl tail veil blood was collected in a heparinized capillary tube (Fisher Scientific)
from each mouse. A 20-µl aliquot was used for hemocytometer analysis (Oxford scientific), and the rest
was subjected to red blood cell lysis by incubation with 4 ml RBC lysis buffer (BD Biosciences) for 5 min

22
at room temperature. After adding PBS, the leukocytes were collected by centrifugation at 4°C and then
incubated for 15 min with combinations of CD45-APC, CD115-APC-Cy5, and Gr-1-PerCP antibodies (BD
Biosciences) in the dark at room temperature. After washing with PBS, the cells were analyzed by FACS
using FSC/SSC and CD45+ gating. The CD115
+Gr-1
+ population was defined as Ly6c
hi monocytes;
CD115+Gr-1
- population as Ly6c
low monocytes; and CD115
-Gr-1
+ as neutrophils.
Plasma Glucose, Cholesterol and Triglyceride Measurements
Fasting blood glucose levels were measured using ONETOUCH Ultra strips after 12 h of fasting. Total
plasma cholesterol, HDL-cholesterol, and triglyceride were measured using commercially available kits
(Wako Pure Chemical Industries). Pooled plasma from 3 mice were used to obtain FPLC lipoprotein
profiles. Profiles were obtained using FPLC gel filtration and a Superose 6 column (Amersham
Pharmacia) at a flow rate of 0.2 ml/min, followed by cholesterol assays of the fractions.
Laser Capture Microdissection and Quantitative PCR
Serial OCT-embedded sections were fixed in xylene for 10 min and then air-dried for 5 min at room
temperature. Lesional RNA was captured by a PALM laser capture microdissection machine. The
collected samples were lysed in RLT buffer (Qiagen) and were immediately frozen on dry ice. RNA was
extracted using the RNeasy Micro Kit (Qiagen). The purity of the RNA was measured by absorbance at
260 and 280 nm using NanoDrop spectrophotometry (Thermo Scientific). RNA with an A260/280 of >1.8
was used for cDNA synthesis with M-MLV reverse transcriptase (Life Technology). QPCR was performed
in a 7500 Real-Time PCR system (Applied Biosystem) using SYBR green chemistry. Mouse Tnfa, Mcp1,
Actb (β-actin), Ccr7, Gapdh, Ntn1, Ccr5, Ccl5, Cxcl1, Cxcr1, Cx3cl1 and Inos primers were purchased
from Qiagen.
Statistics
Values are given as means ± S.E.M. unless otherwise noted, with n number for each experiment listed in
the figure legends; absent error bars in the bar graphs signify S.E.M. values smaller than the graphic

23
symbols. Comparison of mean values between two groups was usually evaluated by a Student t-test.
When the data did not fit a normal distribution, the Mann-Whitney U rank-sum test was used.
Comparison of multiple mean values was evaluated by ANOVA. Linear regression analysis was
conducted using SigmaPlot 12.5 software. For all statistical methods, a P value less than 0.05 was
considered significant.

24
Results
Oxidative DNA Damage Surrounding Mitochondria in Lesional Macrophages Correlates with
Atherosclerosis Lesion Progression in Western Diet-Fed Ldlr-/-
Mice
Oxidative damage to nuclear and mitochondrial DNA (mtDNA) can be assessed by immunostaining for
nuclear and non-nuclear 8-OHdG, respectively.90, 91
Thus, a non-nuclear 8-OHdG immunostaining is
observed when mitochondria are exposed to excessive oxidative stress, referred to here as "mitoOS." To
illustrate this assay, cultured macrophages were subjected to various treatments and then immunostained
for 8-OHdG (green) and the mitochondrial marker ATP5α (red) (Figure 1.1A). For some of the treatments,
the cells were assayed by flow cytometry for mitoOS using MitoSOX and for general cellular reactive
oxygen species (ROS) using CellROX. Compared with vehicle control, H2O2 treatment, which causes
general oxidative stress in cells, yielded a positive 8-OHdG signal, some of which overlapped with the
mitochondrial marker (yellow staining in cytoplasm) and some of which was juxtaposed with DAPI (blue)-
stained nuclei. Short-term treatment with phorbol myristate acetate (PMA) activates NADPH oxidase, not
mitoOS, and we saw no 8-OHdG-mitochondrial co-localization despite robust activation of the CellROX
signal. As will be described in later sections, oxidized LDL (oxLDL) is an athero-relevant inducer of
oxidative stress in macrophages, and we found that it also activates mitoOS, i.e., there is ample evidence
of punctate yellow staining in the cytoplasm, indicative of 8-OHdG-mitochondrial co-localization.
Lipopolysaccharide (LPS) also activates mitoOS (below), and here again 8-OHdG-mitochondrial co-
localization was seen. These data provide validation for the use of non-nuclear 8-OHdG, which reflects
mitochondrial DNA oxidative damage, as a marker of mitoOS.
We next assessed nuclear and mitochondrial oxidative DNA damage in atherosclerotic lesional
macrophages in aortic root lesions from 8-wk Western diet (WD)-fed Ldlr-/-
mice. Sections were
immunostained with the macrophage marker anti-Mac3, the nuclear marker DAPI, and anti-8-OHdG, or
the respective isotype-matched IgGs as negative controls, as illustrated by the images in Figure 1.1B.
For quantification, lesional sections from multiple mice were viewed and quantified by confocal
fluorescence microscopy to look for punctate 8-OHdG staining that was either cytoplasmic or nuclear, i.e.,
similar to the pattern of non-nuclear or nuclear 8-OHdG staining in culture macrophages, respectively.
We found that lesional macrophages displayed clear evidence of non-nuclear 8-OHdG (Figure 1.2A).

25
Increasing WD feeding for 12 and 16 wks, which is known to increase aortic root lesion area92
(data not
shown), led to a progressive increase in both the percent and total number of macrophages showing this
pattern (Figure 1.2B). By comparison, the percent of macrophages with nuclear 8-OHdG staining showed
similar levels at 8 and 12 wks of WD feeding and then an increase above that level at 16 wks, while the
total number of nuclear 8-OHdG macrophages continuously increased as lesions progressed (Figure
1.2C). These data validate the use of the WD-fed Ldlr-/-
model to further study a known feature of human
atherosclerotic lesions,15
namely, a progressive increase in lesional mitoOS.

26
Figure 1.1 A

27
B
8-OHdG + DAPI
Transmission
Negative control
Mac3 + DAPI
28
Figure 1.1: Oxidative damage of non-nuclear and nuclear DNA in cultured macrophages and aortic root
lesional macrophages of WD-fed Ldlr-/-
mice.
(A) Peritoneal macrophages were incubated with vehicle control or H2O2 (30 min), PMA (5 min), oxLDL (6
h), or LPS (6 h). The cells were then immunostained using antibodies against 8-OHdG and the
mitochondrial marker ATP synthase 5α and viewed by fluorescence microscopy. The 4th columns of
images are higher magnifications of the boxed areas in 3rd
column of images. Bars, 5 μm for the first 3
column of images and 1 μm for the fourth column. Flow cytometric quantification of mitochondrial
superoxide (mitoSOX) and total cellular ROS (CellROX) are shown in the graphs (*P<0.05; n = 3 set of
macrophages in each group). (B) A section from an aortic root lesions of a 8-wk WD-fed Ldlr-/-
mouse
was subjected to immunofluorescence staining using anti-8-oxyhydrodioxy guanosine (8-OHdG), a
marker of DNA oxidative damage (green). Macrophages were stained using anti-Mac3 (red), and nuclei
were stained with DAPI (blue). Shown are representative images stained with anti-8-OHdG or anti-Mac3
vs. isotype-matched IgG control, as well as a transmission microscopy image. Bar, 10 µm.

29
B
Figure 1.2 A
DAPI 8-OHdG Mac3 Merge
DAPI 8-OHdG Mac3 Merge

30
C
31
Figure 1.2: Oxidative damage to mitochondrial DNA in lesional macrophages correlates with
atherosclerosis progression in Ldlr-/-
mice.
(A) Aortic root lesions of 8-wk WD-fed Ldlr-/-
mice were subjected to immunofluorescence staining using
anti-8-oxyhydrodioxy guanosine (8-OHdG), a marker of DNA oxidative damage (green). Macrophages
were stained using anti-Mac3 (red), and nuclei were stained with DAPI (blue). The upper row of images
shows a representative lesional section at low magnification, with the intima outlined with the dotted line.
Bar, 10 μm. The two boxed areas in the fourth low-magnification image are shown at higher
magnification in the lower two rows of images. In the merged image, when the green 8-OHdG signal is
nuclear, it retains its green fluorescence and is juxtaposed with the blue nuclei (arrowheads), whereas
when it is non-nuclear, the green fluorescence "merges" with the red cytoplasmic fluorescence (Mac3)
and appears as yellow dots (arrows). Bar, 2.5 μm. (B) Aortic root lesions from 8-, 12-, and 16-wk WD-fed
Ldlr-/-
mice were quantified for the percentage of non-nuclear 8-OHdG+ Mac3
+ cells among all lesional
Mac3+ macrophages and total number of non-nuclear 8-OHdG
+ Mac3
+ cells per section; the number of
mice examined for each of the three WD durations were 4, 5, and 5, respectively (*P<0.05 vs. 8-wk group;
#P<0.05 vs. 12-wk group; n = 4, 5, and 5 mice for 8-wk, 12-wk, and 16-wl lesions, respectively). (C)
Aortic root lesional macrophages from the indicated groups of mice (see Figure 1B) were stained for DAPI
and 8-OHdG, and then the macrophages in which 8-OHdG staining overlapped with DAPI (nuclear 8-
OHdG) were quantified and expressed as either percentage of nuclear 8-OHdG+Mac3
+ cells among
lesional macrophages (top) or total 8-OHdG+Mac3
+ cells per section (bottom) (n = 4, 5, and 5 mice for 8-
wk, 12-wk, and 16-w, lesions, respectively; *P<0.05 vs. 8-wk group; #P<0.05 vs. 12-wk group).

32
Suppression of MitoOS in Myeloid Cells Protects Against Atherosclerosis
To test the functional importance of mitoOS in lesional myeloid-derived cells, we transplanted bone
marrow from mCAT transgenic or littermate control mice into Ldlr-/-
recipients. Six weeks after
transplantation, the mice were placed on a high-fat Western-type diet (WD) for 8 weeks. Bone marrow-
derived macrophages (BMDMs) from the mice showed expression of human catalase mRNA only in the
mCAT group, and immunoblot assay of total catalase showed a higher level in the mCAT vs. control
macrophages (Figure 2.1A). Only macrophages from the mCAT mice showed co-localization of catalase
with the mitochondrial marker ATP synthase 5α (ATP5α) (Figure 2.1B). Using mRNA captured from
aortic root lesions by laser-capture microdissection (LCM), we found that human catalase mRNA was
expressed only in the mCAT group (Figure 2.1C), whereas lesional murine catalase mRNA did not differ
significantly between the two groups (data not shown).
We next analyzed non-nuclear 8-OHdG in lesional macrophages and found suppression of this
marker in the mCAT group (Figure 2.1D). In contrast, nuclear 8-OHdG was similar between the two
groups. These data support both the usefulness of the non-nuclear 8-OHdG marker in lesions and the
overall strategy of the experimental design. Most importantly, aortic root lesion area was, on average,
~2.5-fold lower in the mCAT group (Figure 2.1E). The decrease in atherosclerosis in the mCAT group
was maintained after 16 wks of WD feeding (Figure 2.2). The two groups of mice had similar weights,
fasting plasma glucose levels, and plasma lipids and lipoprotein concentrations after 8 wks of WD feeding
(Figure 2.3). As is usually the case with mouse models of atherosclerosis, the lesion area data showed a
wide range of variability, and we took advantage of this spread to test whether there was a correlation
between non-nuclear 8-OHdG and lesion area in the combined group of mice (Figure 2.1F). This
analysis revealed a strong positive correlation between these two parameters, whereas there was no
correlation between nuclear 8-OHdG and lesion area. Finally, we tested the effect of macrophage mCAT
using a non-BMT model. For this purpose, Ldlr-/-
mice were crossed with a cre-lox model that expresses
mCAT in cells expressing lysozyme M, which, in the setting of atherosclerosis, are mostly macrophages.93
Thus, 8-wk-WD-fed mCATfl/-
LysMCre+/-
Ldlr-/-
mice were compared with control mCAT fl/-
Ldlr-/-
mice. The
two groups of mice did not differ with respect to body weight, plasma lipids, or fasting glucose (data not
shown). The atherosclerotic lesion data were very similar to the those with the BMT model: the lesions

33
from the LysMCre mice contained macrophages having lower levels of non-nuclear but not nuclear 8-
OHdG, and the lesions were smaller in a manner that correlated strongly with lesional macrophage non-
nuclear 8-OHdG (Figure 2.3). In summary, expression of mitochondria-targeted catalase in myeloid cells
lowers a marker of mitoOS in lesional macrophages and, in direct proportion to this parameter, decreases
atherosclerotic lesion size.

34
Figure 2.1
Cultured BMDMs
Cultured BMDMs
B
C
A
Laser Capture Microdissection (LCM)

35
D
E

36
F

37
Figure 2.1: Suppression of myeloid cell mitoOS protects against early atherogenesis in mCAT transgenic
Ldlr-/-
chimeric mice.
mCAT transgenic (mCAT) Ldlr-/-
and littermate control Ldlr-/- chimeric mice were fed the WD for 8
wks, and bone marrow-derived macrophages (BMDMs) and aortic root lesions were analyzed as below.
(A) Relative expression of human catalase (Hucat) mRNA and protein in BMDMs (n = 4 control vs. 5
mCAT mice; *P<0.05). (B) Representative confocal microscopic images of catalase and ATP5α
(mitochondria marker) in BMDMs. The 4th column of images is a higher magnification of the boxed
sections in the 3rd
column of images. Bars, 5 μm for the first 3 column of images and 2 μm for the last
column. (C) Relative human catalase mRNA in aortic root lesions by laser capture microscopy (LCM). (D)
Quantification of nuclear and non-nuclear 8-OHdG-positive Mac3+ macrophages as a percentage of total
Mac3+ cells (two graphs on the left) and per section (two graphs on the right) in aortic root lesions (n = 10
control vs. 9 mCAT mice; *P<0.05; N.S., non-significant). (E) Representative H&E-stained aortic root
lesions, with the intima marked by dotted lines, and total lesion area quantification (n = 19 mice/group;
*P<0.05). Bar, 40 μm. (F) Graphs of nuclear and non-nuclear 8-OHdG vs. lesion area.

38
Figure 2.2 A
B

39
Figure 2.2: The athero-protective effect of myeloid mCAT persists after 16 wks of WD feeding.
(A) Representative H&E-stained aortic root lesions and total lesion area quantification in control Ldlr-/-
and mCAT Ldlr-/-
mice that were fed the WD for 16 wks (n = 9 control vs. 11 mCAT mice; *P<0.05).
Bar, 40 μm. (B) Quantification of nuclear and non-nuclear 8-OHdG -positive Mac3
+ macrophages as a
percentage of total Mac3+ cells (upper two graphs) in the aortic root lesions of the two groups of mice (n =
9 control vs. 11 mCAT mice; *P<0.05; N.S., non-significant). (C) Graph of nuclear and non-nuclear 8-
OHdG vs. lesion area.
C

40
Figure 2.3: Metabolic parameters of 8-wk WD-fed control Ldlr-/-
and mCAT Ldlr-/-
mice.
Plasma lipids, lipoproteins, fasting glucose, body weight, and FPLC profile of lipoprotein-cholesterol were
assayed for the two groups of mice (n = 10 control vs. 9 mCAT mice/group; N.S., not significant).
Figure 2.3

41
Figure 2.4 A
B
8-OHdG + Mac3 + DAPI
mCAT fl/-
mCAT fl/-
LysMCre+/-

42
D
C

43
Figure 2.4: Suppression of mitoOS in lysozyme M-expressing cells protects against early atherogenesis
in Ldlr-/-
mice.
mCATfl/-
Ldlr-/-
(control) and mCATfl/-
LysMCre+/-
Ldlr-/-
mice were fed the WD for 8 wks, and aortic root
lesions were analyzed as below. (A) Quantification of nuclear and non-nuclear 8-OHdG -positive Mac3
+
macrophages as a percentage of total Mac3+ cells (upper two graphs) and per section (lower two graphs)
in the aortic root lesions of the two groups of mice (n = 14 Cre- vs. 10 Cre+ mice; *P<0.05; N.S., non-
significant). (B) Representative images of nuclear and non-nuclear 8-OHdG staining in lesional
macrophages in the two groups of mice using the same staining procedure as in Figure 1. The first two
rows of images are low-magnification, with the intima outlined by the dotted line; the 3rd
row image is a
higher magnification of the boxed areas in the 2nd
row of images. As in Figure 1A, nuclear 8-OHdG is
depicted by arrowheads and non-nuclear 8-OHdG by the arrow. Bars, 10 μm for the first 2 rows of
images and 1 μm for the third row. (C) Representative images, with outlined intima, and quantification of
total lesion area in the two groups of mice (n = 14 Cre- vs. 10 Cre+ mice; *P<0.05). Bar, 40 μm; * P <
0.05. (D) Graph of nuclear and non-nuclear 8-OHdG vs. lesion area.

44
Suppression of MitoOS in Myeloid Cells Decreases Monocyte Infiltration, Inflammation, and RelA NF-κB
Activation in Atherosclerotic Lesions
To explore the mechanisms of how suppression of myeloid cell-derived mitoOS decreases
atherosclerosis, we analyzed the cells and extracellular matrix of aortic root lesions from 8-wk WD-fed
mCAT Ldlr-/-
and wild-type littermate Ldlr-/-
chimeric mice. At this stage of atherosclerosis, most of
the variability in aortic root lesion area among individual mice can be explained by the number of lesional
cells (Figure 3.1A), whereas the extracellular matrix area was very small and not noticeably different
between the two groups of lesions (data not shown). In particular, the mCAT-positive lesions had smaller
numbers of total cells, Mac3+ cells (macrophages), and CD11c+ cells (cells having properties of dendritic
cells94
). In contrast, the numbers of lesional smooth muscle cells and CD3+ T cells were similar between
the two groups of mice (Figure 3.1B).
The decrease in myeloid-derived cells in the mCAT-positive lesions could, in theory, be due to
increased apoptosis, followed by rapid efferocytosis,95
or to decreased proliferation. However, TUNEL-
positive staining as a marker of apoptosis was identical in these early lesions of the two groups(Figure
3.2A). The number of Ki67-positive lesional macrophages as a marker of macrophage proliferation was
similar between the two groups of mice, and cultured macrophages from mCAT-positive and control mice
had similar proliferation rates (Online Figure 3.2B). Another mechanism could be decreased retention or
increased egress of lesional macrophages, but the mRNA level for a key molecule that mediates retention,
netrin-1,96
was not decreased in the mCAT lesions, and the mRNA level for the egress mediator CCR797
was similar between the two groups (Figure 3.2C). Interestingly, there was a marked increase in netirn-1,
which might represent a compensatory response that is subservient to the dominant mechanism of
lesional myeloid cell decrease described below.
We next turned our attention to the hypothesis that suppression of mitoOS by mCAT decreased
blood monocyte infiltration into lesions, with an emphasis on the Ly6chi subpopulation of monocytes,
which contributes to lesion progression.98
Monocyte infiltration into lesions involves both chemokine-
mediated monocyte migration (chemokinesis) and endothelial cell monocyte-adhesion molecules. To test
whether chemokinesis was lower in mCAT mice, mCAT transgenic Ldlr-/-
and wild-type littermate
Ldlr-/-
chimeric mice were fed the WD for 6 wk and then injected with fluorescent beads. In particular, we

45
used a protocol, pioneered by Randolph and colleagues in which the injected beads preferentially label
Ly6chi monocytes.
88 Lesions were than analyzed for labeled cells 48 h later (Figure 3.3A). Total lesion
area significantly correlated with the number of beads (Figure 3.3A, left graph), consistent with the
important role of monocyte chemokinesis in lesion progression.98
Most importantly, mCAT-positive
lesions had a significantly lower number of bead-labeled cells, suggesting decreased chemokinesis
(Figure 3.3A, right graph). In consideration of the former mechanism, we assayed the expression levels
of intercellular adhesion molecule 1 (ICAM-1) and vascular cell adhesion molecule 1 (VCAM-1) on
lesional endothelium, but the levels were not decreased in the lesions of mCAT mice (Figure 3.3B). In
theory, this finding could be explained by a decrease in peripheral monocyte count,99
but the number of
circulating total leukocytes and subsets (both Ly6chi and Ly6c
low) were similar between the two groups of
mice (Figure 3.3C).
MCP-1 is a major monocyte chemokine in atherosclerosis,100, 101
and our group recently showed
that immunoneutralization of MCP-1 in WD-fed Ldlr-/-
mice decreased the entry of monocytes into
lesions94
. In this context, we interrogated lesions for Mcp1 mRNA and found a marked decrease in the
lesions of mCAT mice (Figure 4A, left graph). Note that plasma MCP-1 and lesional mRNAs for other
chemokines and their receptors, including Ccl5, Cx3cl1, Cxcl1, Ccr5, Cx3cr1, were not different between
the two groups of mice (Figure 4B). MCP-1 is induced in response to activation of inflammatory pathways
in macrophages, and so we reasoned that mCAT-mediated suppression of Mcp1 might be part of a larger
program of inflammation suppression. Consistent with this idea, the mRNAs of two other inflammatory
markers, Tnfa and Inos, were also markedly reduced in the lesions of the mCAT group (Figure 4A, middle
and right graph).
A key inflammatory pathway involves the transcription factor RelA (p65) of the NF-κB pathway.
To assess whether this pathway was affected by mCAT, we assayed a marker of pathway activation,
namely, nuclear localization of Ser536-phosphorylated RelA.102, 103
Analysis of macrophage-rich areas of
lesions for co-localization of DAPI and p-RelA showed a clear decrease in nuclear RelA in the lesions of
mCAT mice (Figure 4D). In contrast, SMC-rich areas and the endothelium showed no difference in
nuclear p-RelA between the two groups. These combined data are consistent with the idea that mCAT
expression in lesional myeloid cells suppresses inflammation in general and NF-κB and MCP-1

46
expression in particular, which is likely a key mechanism of decreased atherosclerosis in myeloid mCAT-
expressing mice.

47
Figure 3.1
B
A

48
Figure 3.1: Lesional monocyte infiltration and inflammation are decreased in mCAT transgenic Ldlr-/-
chimeric mice.
mCAT transgenic (mCAT) Ldlr-/-
and littermate control Ldlr-/- chimeric mice were fed the WD for 8
wks, and aortic root lesions were analyzed as below. Circulating Ly6hi monocytes in the mice were
labeled with green fluorescent beads in vivo prior to sacrifice (see text and Methods). (A) Graph of
lesional cell number vs. lesion area. (B) Quantification of the number of monocyte-derived cells (Mac3+
and/or CD11c+), smooth muscle cells (SMCs), and CD3+ cells in aortic root lesions (n = 10 control vs. 9
mCAT mice/group; *P<0.05).

49
Figure 3.2 A
B
C

50
Figure 3.2: Lesional non-monocyte derived cell numbers, macrophage proliferation, macrophage egress
and retention markers are identical in mCAT transgenic Ldlr-/-
chimeric mice.
Aortic root lesions of control Ldlr-/-
and mCAT Ldlr-/-
mice were stained and then quantified by
fluorescence microscopic image analysis for (A) TUNEL+ (apoptosis) per mm
2 lesion area; (B) Left graph:
Ki67+ cells among Mac3
+ macrophages (marker of proliferation). Right graph: peritoneal macrophages
isolated from mCAT fl/-
vs. mCAT fl/-
LysMCre+/-
mice were quantified for cell number before and each day
for 3 days after addition of GM-CSF-containing media (n = 3 sets of macrophages/group). (C) The
indicated mRNAs, relative to Gapdh, were assayed using LCM-captured RNA from aortic root lesions of
the 2 groups of mice (n = 5 mice/group).

51
A Figure 3.3

52
C
B
53
Figure 3.3: Lesional monocyte infiltration and inflammation are decreased in mCAT transgenic Ldlr-/-
chimeric mice.
Circulating Ly6hi monocytes in the mice were labeled with green fluorescent beads in vivo prior to
sacrifice (see text and Methods). (A) Graph of beads number vs. lesion area (upper graph);
Representative images, with intima outlined and bead-labeled cells depicted by arrows, and quantification
of the number of bead-labeled cells in aortic root lesions (n = 11 vs. 10 mice/group). Bar, 40 μm. (lower
graphs); (B) ICAM-1+ or VCAM-1
+ cells among lesional endothelial cells (n = 9 control vs. 8 mCAT
mice/group; N.S., not significant); (C) Blood from the two groups of mice was analyzed for the indicated
cell types by hemocytometer (upper three graphs) and analyzed for the indicated monocyte population by
flow cytometry (lower two graphs) (n = 5 mice/group; *P<0.05).

54
B
A Figure 4
C
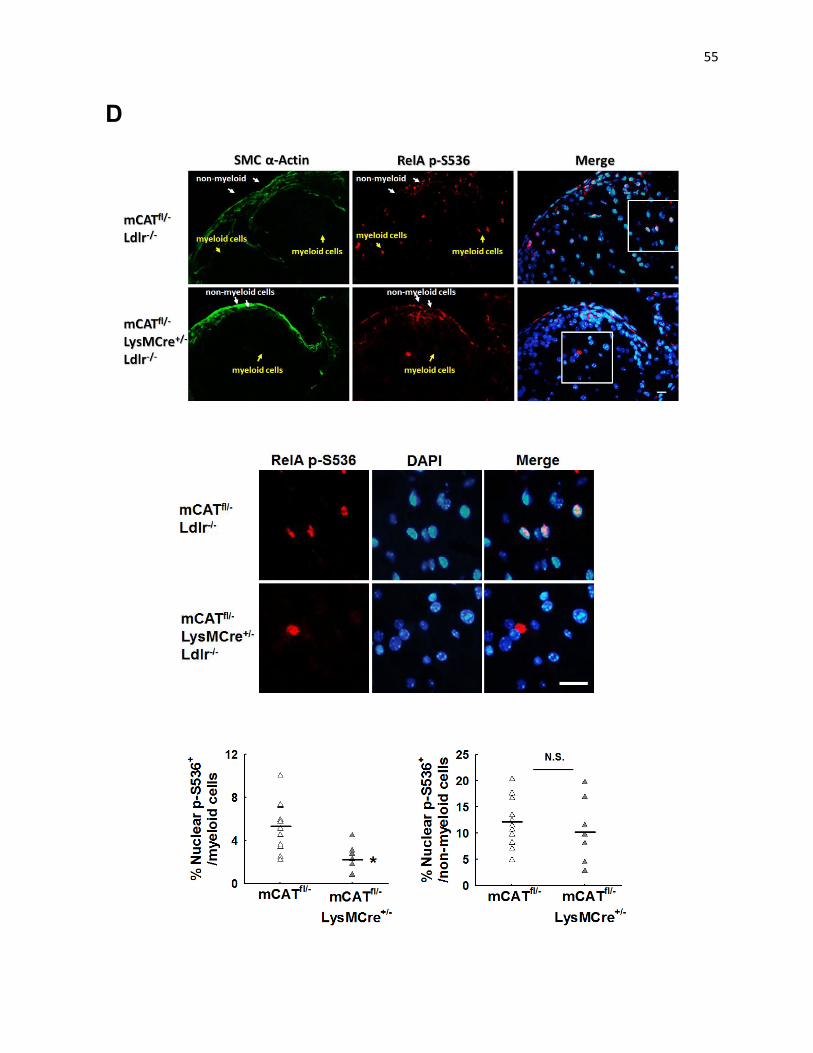
55
D

56
Figure 4: Lesional inflammation and activation of NF-κB are decreased in mCAT transgenic Ldlr-/-
chimeric mice.
(A) Relative level of lesional Mcp1, Tnfa, and Inos mRNA, relative to Gapdh, were assayed using LCM-
captured RNA from aortic root lesions of the two groups of mice (n = 5 mice/group; *P<0.05). (B) The
indicated mRNAs, relative to Gapdh, in the 2 groups of mice (n = 5 mice/group; *P<0.05). (C) Plasma
MCP-1 level as measured by ELISA (N.S., not significant).
(D) Representative immunofluorescence images and quantification of nuclear NF-κB RelA p-S536 in
lesional myeloid vs. non-myeloid cells (smooth muscle cells and endothelial cells) (n = 14 vs. 10
mice/group; *P<0.05; N.S., non-significant). Bar, 20 μm.

57
Quenching MitoOS in Cultured Macrophages Suppresses Inflammatory Cytokine and Chemokine
Expression and Decreases Activation of the IKK-RelA Pathway
To explore causation and mechanistic links among mitoOS, NF-κB, and MCP-1 expression, we turned to
cultured primary macrophages harvested from control or macrophage-mCAT-expressing mice (mCATfl/-
or
mCAT fl/-
LysMCre+/-
mice, respectively). MitoOS was quantified by FACS analysis of macrophages
incubated the mitochondria-targeted fluorescence sensor of superoxide, MitoSOX.104
The first goal was
to find activators of mitoOS that were relevant to atherosclerosis. One possibility would be a circulating
factor induced by hypercholesterolemia, but when macrophages incubated with serum from WD-fed vs.
chow diet-fed Ldlr-/-
mice, the level of MitoSOX fluorescence was similar (Figure 5.1A, left graph). We
therefore tested molecules or other factors that are either known to accumulate in atherosclerotic lesions
or mimic processes known to occur in these lesions (Figure 5.1A, right graph). Six of these factors
increased mitoOS in macrophages: Lp(a), which is a highly atherogenic lipoprotein known to carry
oxidized phospholipids (oxPLs)105
; oxPAPC (1-palmitoyl-2-arachidonoyl-sn-phosphatidylcholine), which is
a non-lipoprotein-bound oxPL106
; the combination of an inducer of endoplasmic reticulum stress,
thapsigargin, and another type of oxPL, KodiA-PC (1-[palmitoyl]-2-[5-keto-6-octene-
dioyl]phosphatidylcholine)107
; 7-ketocholesterol (7KC), which is an oxysterol that accumulates in
atheromata108
; lipopolysaccharide (LPS), which is a model of toll-like receptor activation in
atherosclerosis109
and oxidized LDL (oxLDL)110
, which turned out to be the most potent activator of
mitoOS in this screen. In contrast, a minimally oxidized form of LDL (mmLDL)111
and two inflammatory
cytokines, TNF-α and interleukin-1 (IL-1β), did not induce mitoOS in macrophages.
For the mechanistic studies that follow, we focused on two of the inducers, oxLDL and LPS. We
verified the increase in mitoOS by these stimulators using both non-nuclear 8-OHdG and MitoSOX and
showed these signals co-localized with the mitochondria markers ATP5α and Mitotracker Green (Figure
1.1A and Figure 5.1B). Most importantly, MitoSOX fluorescence induced by LPS and oxLDL were lower
in macrophages from mCAT-expressing mice (Figure 5.1C). We then determined whether this model
could mimic a major mechanistic finding in our in vivo studies, namely, that mCAT suppresses pro-
inflammatory cytokines and chemokines and RelA activation. The data show that Mcp1 and Tnfa mRNA
were induced by LPS and oxLDL, and both mRNAs were decreased in mCAT-expressing macrophages

58
(Figure 5.1D). The decrease of Mcp1 and Tnfa by mCAT was greatest at later time points, suggesting
that mitoOS maybe most important for mediating sustained expression of these molecules. Consistent
with the specificity of the model, mCAT does not suppress Mcp1 in mmLDL-treated macrophages.
We investigated a possible link between mitoOS and inflammation by examining NF-κB RelA
(p65) activation. As expected, LPS caused an increase in two markers of activation of this pathway, p-
Ser177
-IκB kinase (IKK) β and p-Ser536
-RelA. Most importantly, both of these markers were decreased in
mCAT-expression macrophages (Figure 5.1E). OxLDL-induced p-Ser536
-RelA was also decreased by
mCAT (Figure 5.1E). In contrast, the phosphorylation levels of two other LPS-TLR signaling molecules,
mitogen-activate protein kinase (MAPK) p38 and c-Jun N-terminal kinase (JNK), were not suppressed by
mCAT (Figure 5.2A). As an important negative control for this mCAT effect, we tested mmLDL, which
does not activate mitoOS (Figure 5.1A). mmLDL was unable to activate RelA, and the induction of Mcp1
was not affected by mCAT (Figure 5.2B). Thus, the macrophages incubated with LPS or oxLDL capture
the essential mechanistic features that were found in the macrophages of control vs. mCAT
atherosclerotic lesions.
These macrophage models were then used to address a critical causation question, namely,
whether restoration of the RelA pathway could blunt the ability of mCAT to suppress Mcp1 and Tnfa. We
began by testing our restoration strategies in control macrophages. The first strategy used RelA
transfection, which we found increased both p-RelA and also Mcp1 and Tnfa in response to LPS (Figure
6.1A). The second strategy used IKK transfection, which increased the level of p-IKK and p-RelA and the
expression of Mcp1 (Figure 6.1B). We then applied these strategies to control vs. mCAT-expressing
macrophages. In macrophages transfected with control vector, mCAT lowered both LPS-induced p-RelA
and Mcp1 and Tnfa as above (Figure 6A, left half of blot and first pair of bars in each group in the graphs).
In macrophages transfected with RelA, however, there was an increase in LPS-induced p-RelA, Mcp1,
and Tnfa, and, most importantly, mCAT did not suppress the cytokine mRNA levels under these
conditions (Figure 6.2A, right half of blot and second pair of bars in each group). Similar results were
obtained when restoration of the RelA pathway was accomplished using IKK transfection (Figure 6.2B)
and when the experiment was conducted using the oxLDL-macrophage model (Figure 6.2C).

59
Interestingly, Kanters et al.112
letion actually increased lesion
area in WD-fed Ldlr-/-
mice. Although the mechanism remains to be determined, macrophages from these
mice, when stimulated with LPS in vitro, secreted lower levels of the anti-inflammatory/anti-atherogenic
cytokine, interleukin 10 (IL-10). In contrast, we found that the suppression of the IKK pathway by mCAT
in macrophages was associated with a slight but significant increase in IL-10 (Figure 7A), which might
contribute to the beneficial effect of mCAT. In another study, consistent with our overall findings on the
role of RelA in atherosclerosis, Goossens et al.113
demonstrated that myeloid deficiency of IκB, a negative
regulator of RelA, promoted atherogenesis by enhancing leukocyte recruitment to the plaques. Although
this study did not probe mechanism in vivo, IκB deficiency in LPS-treated cultured macrophages was
associated with an increase in the chemokine CCL5 but not MCP-1. This finding contrasts with the
effects of suppressing RelA via mCAT, which we showed decreases Mcp1 but not Ccl5 both in vivo and
in the LPS-macrophage model (Figure 4B and 7B).
To test ROS-source specificity in activating RelA-MCP-1 signaling, we transfected macrophages with
cytosolic catalase (cCAT), which we showed suppresses LPS-induced cytosolic ROS (cellROX) but not
mitoOS (MitoSOX) (Figure 8A and 8B). cCAT did not suppress RelA and actually enhanced the
induction of Mcp1 and Tnfa mRNAs (Figure 8C), which is consistent with previous studies suggesting
non-mitochondrial ROS can inhibit pro-inflammatory cytokine induction114, 115
. Thus, mitoOS has distinct
roles in inflammatory signaling compared with other sources of cellular oxidative stress.
These combined in-vivo and in-vitro data support the hypothesis that an important pro-
atherogenic mechanism of macrophage mitoOS is the enhancement of IKK/RelA signaling, leading to
increased inflammation, including MCP-1-induced monocyte recruitment.

60
Figure 5.1 A
B

61
C
D

62
E

63
Figure 5.1: Cultured macrophages from mCAT fl/-
LysMCre+/-
mice have less LPS-induced mitoOS, Mcp1,
p-RelA, and p-IKK.
(A) Cultured macrophages from wild-type mice were pre-incubated with MitoSOX for 30 min and then
incubated for 18 h with DMEM containing 10% of the following sera: fetal bovine serum (FBS), serum
from chow diet-fed Ldlr-/-
mice, or serum from WD-fed fed Ldlr-/-
mice (left graph); Cultured macrophages
were incubated with MitoSOX for 30min and treated with the indicated stimuli for either 4 h (mmLDL) or
12 h (other stimuli). The doses were: Lp(a) 25 μg/ml, oxPAPC 25 μg/ml, KOdiA-PC 50 µg/ml,
thapsigargin 0.5 μM, mmLDL 50 μg/ml, oxLDL 50 μg/ml, 7KC 35 μg/ml, IL- -α 40 ng/ml,
LPS 100 ng/ml (Left graph); Cultured macrophages were The cells were then analyzed by flow cytometry,
and the data were quantified as MitoSOX mean fluorescence intensity (n = 3 sets of macrophages/group;
*P<0.05). (B) Representative images of macrophages stained with MitoSOX and then treated with LPS
cubation times, the cells were stained with
Mitotracker Green and DAPI and viewed by fluorescence microscopy. The 3rd
and 5th columns of images
are higher magnifications of the boxed areas in the 2nd
and 4th column of images, respectively. Bars, 10
μm for the first 4 columns of images and 2 μm for the fifth column. The flow cytometry data are shown in
the graphs (n = 3/group; *P<0.05). (C) Similar to (B) except that mitOS was measured, showing that
mCAT fl/-
LysMCre+/-
macrophages are protected from LPS- and oxLDL-induced mitoOS (n = 3 sets of
macrophages in each group). (D) Time course of Mcp1 and Tnfa mRNA levels, relative to Gapdh, after
LPS and oxLDL treatment (n = 3/group; *P<0.05). (E) Immunoblots showing decreased phosphorylation
of IKKβ (p-S177) and NF-κB RelA (p-S536) in mCATfl/-
LysMCre+/-
macrophages after 6 h of LPS or oxLDL
treatment; also shown are total catalase and, as a loading control. Densitometric quantification of the
phospho:total ratio of RelA and IKK from the immunoblots is shown in the bar graphs (n number/group
indicated below the graphs; *P<0.05).

64
Figure 5.2: mCAT does not suppress p-P38 or p-JNK activation in LPS-treated macrophages or does not
affect minimally oxidized LDL (mmLDL)-induced Mcp1 mRNA in macrophages.
(A) Macrophages from control (mCATfl/-
) and mCATfl/-
LysMCre+/-
mice were incubated with 100 ng/ml LPS
for the indicated times and then assayed by immunoblot for phospho- and total P38 MAPK, p-JNK, and β-
actin loading control. (B) Macrophages from WT mice were incubated with 50 mg/ml mmLDL for the
indicated times and then assayed by immunoblot for NF-κB RelA (p- -actin loading control
(left blot). mCATfl/-
and mCATfl/-
LysMCre+/-
macrophages mice were incubated with 50 mg/ml mmLDL for
the indicated times and then assayed for relative Mcp-1 mRNA by RT-QPCR. (n = 3 sets of
macrophages/group).
A
B
Figure 5.2
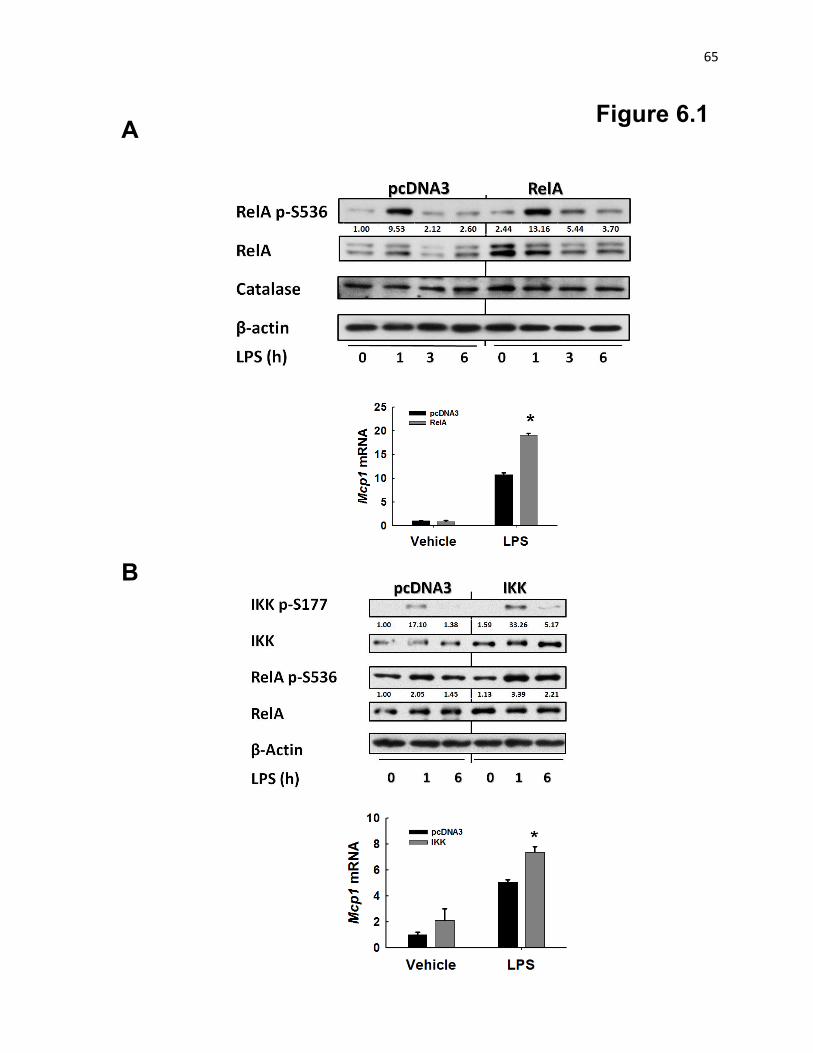
65
Figure 6.1 A
B

66
Figure 6.1: Transfection of macrophages with RelA or IKK increases LPS-induced Mcp1.
Macrophages were transfected with control plasmid (pcDNA3) or RelA-encoding plasmid (A) or IKK-
encoding plasmid (IKK) (B) and then assayed for the indicated proteins by immunoblot and for relative
Mcp1 mRNA by RT-QPCR (n = 3 sets of macrophages/group; *P<0.05).

67
Figure 6.2 A
B
B

68
Figure 6.2: Restoration of RelA abrogates the difference in LPS or oxLDL-induced Mcp1 expression in
control vs. mCAT-expressing macrophages.
(A) Macrophages were transfected with control (pcDNA3) or RelA-encoding plasmid and then assayed for
phospho- and total RelA by immunoblot, with GAPDH as the loading control, and Mcp1 mRNA by RT-
qPCR, relative to Gapdh, before and after 6 h of LPS treatment (n = 3 sets of macrophages in each
group). (B) The indicated groups of macrophages were transfected with control or IKK-encoding plasmid
and then assayed for phospho- and total IKK and RelA and for Mcp1 MRNA before and after 6 h of LPS
treatment (n = 3/group; *P<0.05). (C) The indicated groups of macrophages were transfected with control
or RelA-encoding plasmid and then assayed for phospho- and total RelA and for Mcp1 mRNA before and
after 6 h of oxLDL treatment (n = 3/group; *P<0.05; N.S., non-significant).
C
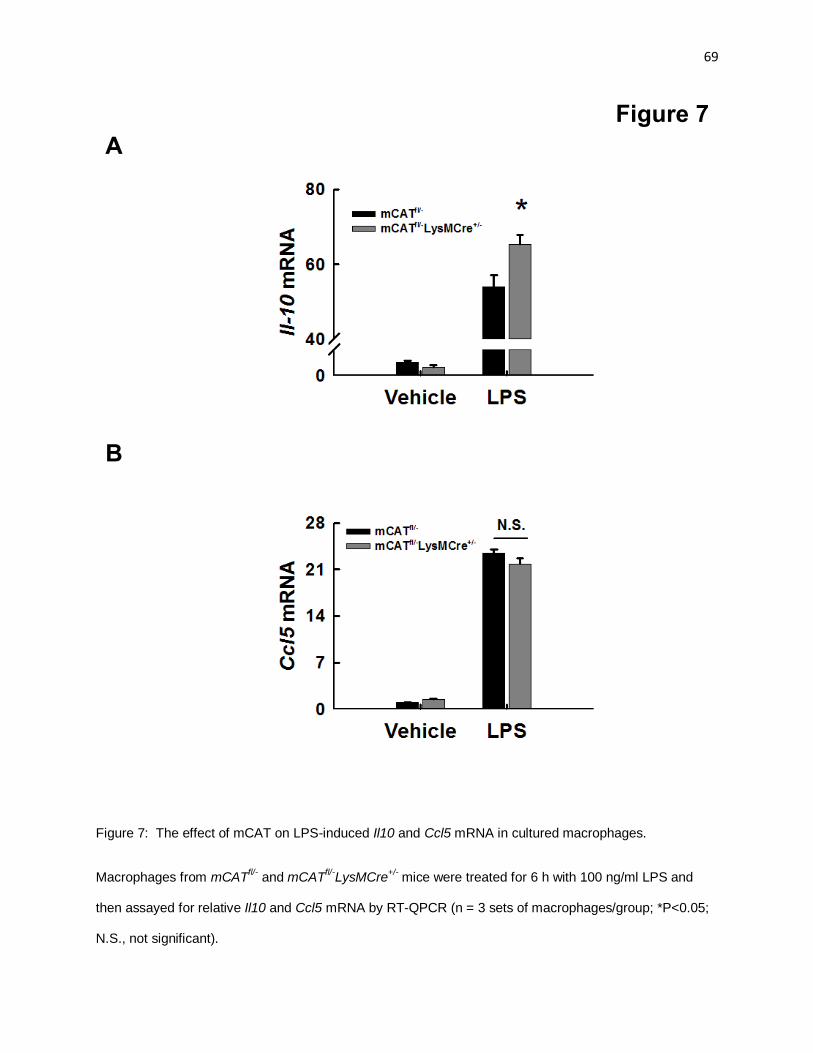
69
Figure 7: The effect of mCAT on LPS-induced Il10 and Ccl5 mRNA in cultured macrophages.
Macrophages from mCATfl/-
and mCATfl/-
LysMCre+/-
mice were treated for 6 h with 100 ng/ml LPS and
then assayed for relative Il10 and Ccl5 mRNA by RT-QPCR (n = 3 sets of macrophages/group; *P<0.05;
N.S., not significant).
Figure 7
A
B

70
Figure 8 A
B
C

71
Figure 8: Transfection of macrophages with cytosolic catalase does not decrease LPS-induced Mcp1
and Tnfα.
Macrophages were transfected with control plasmid (pcDNA3) or plasmid encoding cytosol-targeted
human catalase (cCAT). (A) Mitochondrial and cellular ROS were measured by mitoSOX and CellROX
staining, respectively, and quantified by flow cytometry as mean fluorescence intensity (MFI). (B-C)
Control and cCAT macrophages were incubated with 100 ng/ml LPS for 1 or 3 h and then assayed for the
indicated proteins by immunoblot and for relative Mcp1 and Tnfα mRNA levels by RT-QPCR (n = 3 sets of
macrophages/group; *P<0.05).
72
Discussion
In view of the association between markers of mitoOS and the progression of human atherosclerosis80
and the importance of inflammatory macrophages in atherosclerosis, the goal of the current study was to
provide causation data in vivo for the role of endogenous macrophage mitoOS in atherosclerosis and to
explore mechanism. Our data indicate that macrophage mitoOS is atherogenic and that a major
mechanism involves activation of an NF-κB—MCP1 pathway. Whether mitoOS in other lesional cell
types also contributes to atherogenesis remains to be determined.116-118
In an elegant study, Sessa and
colleagues81
showed that overexpression of thioredoxin-2 in endothelium lowered oxidative stress and
enhanced production of NO in endothelial cells, improved endothelial function in aortic rings, and
lessened atherosclerosis in Apoe-/-
mice. Although this study did not examine mitoOS per se, the fact that
thioredoxin-2 is localized to mitochondria raises the possibility that pro-atherogenic effects of mitoOS in
endothelial cells might complement the effects revealed here for macrophages. Moreover, Bennett and
colleagues25
have shown recently that mitochondrial DNA damage independently of mitoOS can lead to
pro-atherogenic changes in smooth muscle cells and monocytes. In the context of that report and our
finding that nuclear 8-OHdG becomes very high in the most advanced lesions, it is highly likely that non-
mitochondrial sources of oxidative stress are important in atherosclerosis, perhaps particularly so in
advanced lesions, which is supported by previous studies examining how targeting NADPH oxidase
subunits affects atherosclerosis.27, 119, 120
Our mechanistic studies support a model in which lesional macrophage mitoOS promotes inflammation in
general and MCP-1 induction in particular, which would then amplify the inflammatory milieu of lesions by
promoting additional monocyte entry. Although recent studies using Ccr2-/-
mice showed that MCP-1 can
promote the release of Li6chi monocytes from the bone marrow
121, MCP-1 can also contribute to
monocyte entry into local sites of inflammation, including atherosclerosis122-124
. Indeed, we found here
that mCAT expression in myeloid cells did not affect the level of plasma MCP-1 or the number of
circulating monocytes, and we showed recently that injection of anti-MCP-1 neutralizing antibody into a
similar model decreased monocyte entry into atherosclerotic lesions94
. Moreover, the level of other
potentially atherogenic chemokines and their receptors, including CCR5/CCL5 (RANTES),
CX3CR1/CX3CL1 (fraktalkine), and CXCL1/CXCR2125-127
, were similar between control and mCAT

73
lesions. Thus, suppression of the NF-κB—MCP-1—chemokinesis pathway is likely an important
mechanism behind the decrease in lesion cellularity in macrophage-mCAT mice.
The data herein have also revealed an interesting link between mitoOS and IKK-RelA activation.
Although a number of studies have shown that oxidative stress can activate NF-κB signaling128-131
, the
specific roles of different cellular sources of oxidative stress and how each may affect the NF-κB pathway
and its various downstream targets remains to be fully explored. In this regard, NF-κB target genes can
be affected by NF-κB activation kinetics, cell type, nature of the stimulus, and cofactors132, 133
. In a study
using murine embryonic fibroblasts and human peripheral blood mononuclear cells, the mitochondria-
targeted antioxidant Mitoquinone (MitoQ) was reported to suppress LPS-induced cytokine production, but
deletion of the NADPH oxidase subunits gp91phox
and p22phox
in macrophages actually showed a trend
toward increased cytokine production114
. With regard to the MitoQ result, the authors hypothesized that
the mechanism involved suppression of p38 and JNK MAPK signaling, but data specifically linking
mitoOS to these MAPKs were not provided. In another study, NADPH oxidase-deficient macrophages
from gp91phox
-null mice and CGD patients also produced increased inflammatory cytokines in response to
LPS independently of NF-κB115
. These data are consistent with our finding that quenching non-
mitochondrial ROS by cCAT leads to enhanced LKPS-induced inflammatory cytokine induction without
affecting NF-κB activation. Thus, the source and/or intracellular location of oxidative stress can have
distinct effects on activation of NF-κB signaling.
We provide evidence that mitoOS is linked to NF-κB through IKK, but exactly how mitoOS
activates IKK remains to be determined. Gloire et al.134
showed that H2O2 treatment of Jurkat cells led to
activation of IKK and RelA through a pathway involving the phosphatase SH2-containing inositol-5'-
phosphatase 1 (SHIP-1). Whether mitoOS enhances the activation of IKK through SHIP-1 remains to be
determined. Of interest, a recent study investigated the converse issue in macrophages, namely,
activation of mitoOS by inflammatory signaling26
. The investigators showed that activation of certain Toll-
like receptors led to recruitment of TRAF6 and ECSIT (Evolutionarily Conserved Signaling Intermediate in
Toll pathways) to mitochondria, ubiquitination of ECSIT by TNF receptor-associated factor 6 (TRAF6),
and induction of mitoOS, presumably by ubiquitination of ECSIT on the mitochondrial respiratory chain.

74
However, whether the mitoOS generated by this mechanism then mediated or amplified downstream
TLR-induced NF-κB signaling was not reported.
Oxidative stress in general has long been considered to be a therapeutic target for atherosclerotic
vascular disease. Enthusiasm was dampened, however, by studies in humans showing that vitamin E
was not protective against human coronary artery disease135
. While these data might be interpreted as
proof against the role of oxidative stress in atherosclerosis, a more likely explanation is that the choice
and/or timing of anti-oxidant treatment was not optimal. The association of mitoOS with human
atherosclerosis progression and the causal and mechanistic insights provided by the current findings and
previous studies raise the possibility that therapy targeted specifically to mitoOS may show benefit. In
this regard, Bennett and colleagues136
showed that systemic MitoQ administration decreased
macrophage content and cell proliferation in the atherosclerotic lesions of fat-fed Apoe-/-
mice. Although
the mechanism behind these findings with regard to atherogenesis per se is difficult to ascertain in view of
systemic metabolic effects of MitoQ administration, and although applicability to humans remains
unexplored, continuing insight into the mechanisms and consequences of oxidative stress in
atherosclerosis will lead to a more focused approach to this important area of biomedical research.
75
Chapter 3*
Macrophage Mitochondrial Fission is Essential for Continued Clearance of Apoptotic Cells and Plays a
Protective Role in Advanced Atherosclerosis.

76
Introduction
Mitochondrial morphology dynamics influence and integrate with multiple physiologic and
pathophysiologic processes, including mitosis, mitochondria distribution, mitochondria metabolism,
mitochondrial quality control (mitophagy), as well as mitochondrial oxidative stress and cell death
(apoptosis and necrosis).44-46
Diseases such as pulmonary arterial hypertension, arterial restenosis,
hypertension, Parkinson’s disease, obesity and diabetes have been associated with abnormalities in
mitochondrial dynamics.47-49
They are mediated by several different GTPases. Mitofusin 1 (MFN1) and
Mitofusin 2 (MFN2) regulate outer membrane fusion, whereas optic atrophy protein 1 (OPA1) mediates
inner membrane fusion. Mitochondrial fission is mediated by the cytosolic molecule called dynamin
related protein 1 (DRP1) and its non-GTPase receptor proteins such as fission protein 1(FIS1) and
mitochondrial fission factor (MFF).
Previous data have suggested that these GTPases play divergent roles in a cell type specific
manner in atherosclerosis. For example, Mfn2 mRNA was progressively reduced in the lesions of Apoe-/-
mice artery during the development of atherosclerosis. MFN2 suppresses VSMC proliferation both in
vitro and in vivo in the mouse vascular injury models.52
Consistent with this idea, a study in rabbit
reported that overexpression of MFN2 was associated with reduced atherosclerosis.53
MFN2 also
activates the mitochondria apoptotic pathway by inhibiting AKT signaling.137
These two functions of
MFN2 together contribute to atherosclerosis progression. Interestingly, diabetic venous endothelial cells
have increased mitochondrial fragmentation and a higher level of the mitochondrial fission protein Fis1,
which could contribute to mtROS overproduction and enhance susceptibility to atherosclerosis.54
While
these studies hint at some interesting associations between mitochondrial dynamics and atherosclerosis,
more precise in vivo models and more in-depth mechanist studies are needed to address the functional
significance of mitochondrial dynamics in atherosclerosis. It is important to note that in myeloid cells, the
dominant cell types in atherosclerosis, the roles of these GTPases are largely unclear.
Fission creates smaller and more discrete mitochondria, which are more capable of generating
reactive oxygen species, facilitating mitochondrial autophagy “mitophagy”, or accelerating cell
proliferation.49, 50, 138, 139
Fission is mediated by DRP1, a cytosolic protein that on activation translocates to
the outer mitochondrial membrane. There, DRP1 binds to its docking protein FIS1 or MFF, and
77
multimerizes to create a ring-like structure that constricts and divides the organelle. DRP1 is ubiquitously
expressed in all essential organs and cell types. Whole body DRP1 knockout mice are embryonic lethal,
and mice with neuronal specific deletion of DRP1 have impaired early brain development. These data
suggest its critical role in embryonic development, especially neuronal development. DRP1-mediated
mitochondrial fission has been reported to mediate cell apoptosis, but the role of DRP1 in cell death
varies depending on cell type and physiological contexts. Under conditions such as aging,
neurodegeneration, and ischemia-reperfusion, DRP1 activation promotes excessive ROS production.
With regard to vascular cells, DRP1-mediated mitochondrial mitotic fission permits hyperproliferation of
VSMC. In human aortic endothelial cells, DRP1 is upregulated upon high glucose challenge. Such
upregulation increases mitochondrial ROS production and mitochondrial fission.54
The specific functions
of DRP1 in myeloid cells, in the setting of atherosclerosis have not been examined.
Uncoupling protein 2 (UCP2) is a mitochondrial inner membrane protein and the dominant form of
UCP that is expressed in Mφ and lymphoid system. Its basic function is to uncouple the hydrogen
gradient cross the mitochondrial inner membrane with ATP synthesis. In this process, UCP2 lowers the
ΔΨ and reduces mitochondrial ROS production. UCP2 promoter polymorphisms in humans are
associated with multiple pathological conditions, including obesity, diabetes, and atherosclerosis.55-58
Additionally, UCP2 expression is increased in the aorta of cholesterol-fed C57BL/6J mice,59
and Ucp2-/-
mice have larger and more Mφ-rich atherosclerotic lesions both in this model and in chow-fed Apoe-/-
mice.15
Mechanistically, its athero-protective role is not well understood. Recently, Ravichandran’s group
discovered the essential role of UCP2 in continued uptake of apoptotic cells in phagocytes, through
lowering mitochondria membrane potential ΔΨ.140
Whether its athero-protective effect depends on
facilitating continued uptake of ACs and how the lower ΔΨ permits continued uptake of ACs are not clear.
Given that GTPases-mediated mitochondrial dynamic changes have unique functions in
individual cell types, we aimed to explore the role of DRP1-mediated mitochondrial fission in
atherosclerosis, with a focus on myeloid cells (monocyte-derived Mφs). In this study, we adopted a
mouse model whose EXON II of DRP1 (a part of GTPase domain) was flanked by two loxP sites (Drp1fl/fl
mice). By crossing this model with LysMCre transgenic mice, we conditionally knocked out DRP1 in
myeloid cells. We used western diet-fed Drp1fl/fl
LysmCre+/-
Ldlr-/-
mice to determine the role of Mφ

78
mitochondrial fission in both early atherogenesis and advanced atherosclerosis. We confirmed
that Drp1 mRNA was reduced by 80% in peritoneal Mφs in Drp1fl/fl
LysmCre+/-
Ldlr-/ mice. Our data thus
far show that: (1) Mitochondria in lesional Mφs are elongated in Drp1fl/fl
LysmCre+/-
Ldlr-/
mice by
transmission electron microscopy (TEM) analysis; (2) Suppression of Mφ mitochondrial fission does not
affect early atherogenesis; (3) Inhibition of Mφ mitochondrial fission leads to a striking increase of necrotic
core area and the accumulation of apoptotic cells, which are likely due to the defective phagocytic
clearance of apoptotic cells (efferocytosis) in the advanced stage of atherosclerosis in vivo; (4) DRP1-
deficient Mφs are defective in clearance of apoptotic cells both in vivo and in vitro. (5) The phagocytic
deficiency in DRP1-deficient Mφs is associated with a reduced level of uncoupling protein 2 (UCP2), a
mitochondria protein required for continued uptake and clearance of dead cells in phagocytes. We
conclude that DRP1-mediated mitochondrial fission in Mφs promotes the continued clearance of apoptotic
cells and thereby blocks necrotic core formation in advanced atherosclerosis. In terms of
mechanism, we hypothesize that mitochondrial fission stabilizes UCP2 in the inner membrane of
mitochondria. Further studies are required to elucidate how DRP1-UCP2 pathway maintains the
continued efferocytosis capability in phagocytes.

79
Methods
Animals and Diets
C57BL/6J (000664) and Ldlr-/-
(002381) mice on the C57BL/6J background were purchased from Jackson
Laboratory. DRP1 floxed mice were generated as described previously141
and were backcrossed >10
times onto the C57BL/6J background. DRP1 floxed miced were crossed with LysMCre mice93
to
conditionally knock out DRP1 in myeloid cells. For the atherosclerosis study, Drp1fl/fl
Ldlr-/-
and
Drp1fl/flL
LysmCre+/-
Ldlr-/-
male mice, at 8weeks of age , were placed on a Western-type diet (TD88137;
Harlan Teklad) for the indicated periods of time.
Atherosclerotic Lesion Analysis
For morphometric lesion analysis, sections were stained with Harris’ hematoxylin and eosin. The total
lesion area and necrotic area were quantified as previously described.86
For immunostaining, specimens
were immersed in OCT and 6-µm sections were prepared and placed on glass slides. The sections were
fixed and permeabilized with ice-cold acetone for 10 min. Paraffin-embedded specimens were sectioned,
de-paraffinized with xylene, and rehydrated in decreasing concentrations of ethanol. TUNEL staining
(Roche TMR in situ cell death kit, Cat No. 12 156 792 910) was performed according to manufacturer’s
instruction. Basically, sections were incubated with TMR reagents @ 37 °C for 30 mins, and then wash
with PBS x 3. Sections were then blocked with 10% goat serum for 30 mins and incubated overnight at
4C with anti-Mac-3 (BD Clone M3/84, 1:200), The sections were then incubated with anti-rat secondary
antibody (Ven-conjugated with Alexa 488 (Life Technology). Sections were counter-stained with DAPI to
identify nuclei before mounting.
In situ Efferocytosis Assay in Atherosclerosis Lesions
Following established procedures described previously. Efferocytosis was determined in situ by counting
the number of free versus Mφ-associated apoptotic cells in individual lesion sections. Apoptotic cells
were considered “free” when they were not surrounded by or in contact with Mφs, as described in detail in
the Results section.

80
Measurement of cell clearance in thymus
8wk old female mice (8/group) were intraperitoneally injected with 500ul PBS with 250μg dexamethasone
(Calbiochem) dissolved in DMSO. 18 hrs after injection, mice were sacrificed and thymuses were
extracted. For quantification of thymic cellularity, half leaf of the thymus was disrupted mechanically.
Thymocytes were resuspended in the same volume of staining buffer (BD Bioscience 554656) and
counted under cytometer. Half of the suspended cells were fixed in PBS (PH = 7.0)-buffered 4% PFA
for 15 min at room temperature, and were then permeablized with 0.1% Triton in 1% citrate buffer at
roome temperature for 8 mins, washed with PBS, incubated with TUNEL staining reagents (Roche, TMR)
for 10 mins @ 37°C, and analyzed by FACS. The rest half of the suspension was stained with annexin V
conjugated with Alexa 488 (life technology) and subjected to FACS analysis. The other half of the thymus
was fixed in formalin and embedded in paraffin. Thymic sections on glass slides were stained using the
In situ Cell Death Red kit according to manufacturer’s instructions (Roche). Sections were counter
stained with the Mφ marker F4/80 (ABD Serotec clone Cl: A3-1) before being mounted with Prlong
Antifade plus DAPI medium, and analyzed using an Olympus IX-70 inverted fluorescent microscope
equipped with a mercury 100-W lamp (CHIU Technical Corp.), filter wheels, fluorescent filters (Chroma),
an Olympus LCPlanF1 x 40 objective, DP Manager Basic imaging software (version 3.1; Olympus), and
an Olympus DP71 CCD camera.
Mφ phagocytosis assay
Cultured peritoneal Mφ (1.5 x 10⁶) were placed in a 24-well plate (phagocytes) and labeled with calcein
green (Life Technology, C34852). Apoptotic cells were induced as follows: Jurkat cells were irradiated
with UV for 10 mins, then waited for 4 hrs; peritoneal Mφs were treated with 7-ketocholesterol (50ug/ml)
for 18 hrs or oxLDL (50ug/ml) for 24 hrs. Apoptotic cells were labeled with annexin V conjugated with
Alexa 647. In most experiment apoptotic Jurkat cells were then added to phagocyte at 2.5 : 1 ratio,
unless otherwise noted. Apoptotic Mφs were added at 1:1 ratio. At the end of incubation, cells were
vigorously washed with cold PBS 3 times, and lifted for FACS analysis. FITC positivity was used to
distinguish free unbound targets from phagocytes. The “double-positive” cells represent targets engulfed
by phagocytes, or targets in the process of being engulfed.
81
Immunofluorescence staining in cultured Mφs
Cultured Mφs or MEFs were plated on cover slide bottom non-tissue culture coated dishes at relative low
confluence. They were washed with PBS, and fixed with ice-cold acetone on ice for 5 mins. After two
washes with PBS, cells were incubated with blocking buffer (PBS with 10% goad serum) for 1 hr. Cells
were than incubated with antibodies against DRP1 (BD clone 8/DLP1, 1:200 dilution) and COX IV (Cell
signaling, 4844, 1:200 dilution) @ 4°C overnight, followed by the incubation with Alexa 488-conjugated
anti-mouse and Alexa 594-conjugated anti-rabbit 2nd
antibody. The cells were then imaged by confocal
microscope (NIKON A1 Confocal with 100X oil objective).
RT-QPCR
RNA was extracted from cultured single layer of peritoneal Mφs using the RNeasy Micro Kit (Qiagen).
The purity of the RNA was measured by absorbance at 260 and 280 nm using NanoDrop
spectrophotometry (Thermo Scientific). RNA with an A260/280 of >1.8 was used for cDNA synthesis with
M-MLV reverse transcriptase (Life Technology). QPCR was performed in a 7500 Real-Time PCR system
(Applied Biosystem) using SYBR green chemistry. Mouse Dlp1 gene primer was designed targeting
EXON 2, which was flanked by two loxp sites. Forward : ATAAGCTGCAGGACGTCTTC; Reverse:
TGACCACACCAGTTCCTCT.
Transmission Electron Microscopy
Aortic roots from Drp1fl/fl
Ldlr-/-
and Drp1fl/fl
LysMCre+/-
Ldlr-/-
mice were fixed with 2.5% glutaraldehyde in
0.1 M Sorenson’s buffer (pH 7.2) for 1 h, post-fixed with 1% OsO4 in 0.1M Sorenson’s buffer, and
embedded in Lx-112 (Ladd Research Industries, Burlington, VT) and Embed-812 (EM Science, Fort
Washington, PA). Thin sections were prepared on a MT-7000 RMC cryoultramicrotome, stained with
uranyl acetate and lead citrate, and examined by transmission electron microscopy using a JEOL JEM-
1200 EXII. Cells full of lipid droplets (singly membrane vacuoles with medium electron density) were
defined as foam cells. Mitochondria are recognized as cytosolic double membrane structures with
relatively high electron density using a magnification of ×100,000.
82
Reagents
Falcon tissue culture plastic was purchased from Fisher Scientific. Tissue culture media, cell culture
reagents, and heat-inactivated fetal bovine serum (FBS) were from GIBCO. Jackson ImmunoResearch
for horseradish peroxidase-conjugated goat anti-rabbit IgG, donkey anti-mouse IgG secondary antibodies.
Plasma Glucose, Cholesterol and Triglyceride Measurements
Fasting blood glucose levels were measured using ONETOUCH Ultra strips after 12 h of fasting. Total
plasma cholesterol, HDL-cholesterol, and triglyceride were measured using commercially available kits
(Wako Pure Chemical Industries). Pooled plasma from 3 mice was used to obtain FPLC lipoprotein
profiles. Profiles were obtained using FPLC gel filtration and a Superose 6 column (Amersham
Pharmacia) at a flow rate of 0.2 ml/min, followed by cholesterol assays of the fractions.
Statistics
Values are given as means ± S.E.M. unless otherwise noted, with n number for each experiment listed in
the figure legends; absent error bars in the bar graphs signify S.E.M. values smaller than the graphic
symbols. Comparison of mean values between two groups was usually evaluated by a Student t-test.
When the data did not fit a normal distribution, the Mann-Whitney U rank-sum test was used.
Comparison of multiple mean values was evaluated by ANOVA. Linear regression analysis was
conducted using SigmaPlot 12.5 software. For all statistical methods, a P value less than 0.05 was
considered significant.

83
Results
Mitochondrial Morphology and Expression of GTPases that Regulate Mitochondrial Dynamics in Mφs
from Drp1fl/fl
vs. Drp1fl/fl
LysmCre+/-
Mice
To study the role of Mφ mitochondrial fission in atherosclerosis, we crossed Drp1fl/fl
mice141
with
LysmCre+/-
mice to specifically delete DRP1 in lysozyme-expressing myeloid cells. These mice were
further crossed with athero-prone mice (Ldlr-/-
) to study atherosclerosis. Drp1fl/fl
LysmCre+/-
mice are
viable and show no gross abnormalities during their development. I found that Drp1 mRNA level in
peritoneal Mφs from Drp1fl/fl
LysmCre+/-
mice was reduced by more than 80% compared with littermate
controls (Drp1fl/fl
) (Figure 1A), while Drp1 mRNA level the smooth muscle cells isolated from the aorta was
similar between the two groups of mice. As shown in Figure 1B, control Mφs express DRP1 (green) in
the cytosol or at the ends of newly fragmented mitochondria. Their mitochondria (stained with COXIV in
red) are of moderate length and evenly distributed all over the cell body. In contrast, Drp1fl/fl
LysmCre+/-
Mφs have barely detectable DRP1. Their mitochondria are elongated, inter-twined, and more likely to
cluster around peri-nuclear region, as shown in the boxed region of the representative images. In the
aortic root lesions of Drp1fl/fl
LysmCre+/-
Ldlr-/-
mice after 12 wk WD feeding, Mφs have significantly longer
mitochondrial length compared to Mφs in the Drp1fl/fl
Ldlr-/-
lesions (Figure 1C). Mitochondrial morphology
of neighboring smooth muscle cells (SMCs) are identical in the two groups (data not shown). Thus, with
lysmCre expression, the deletion of DRP1 is marked and specific to myeloid cells. More importantly,
deletion of DRP1 is sufficient to cause mitochondrial morphology changes.
Further, we examined the levels of GTPases that control mitochondrial dynamics. The levels of
another fission protein FIS1 are identical in Mφs from Drp1fl/fl
vs. Drp1fl/fl
LysmCre+/-
mice. Interestingly,
the outer membrane fusion protein MFN-1 is robustly decreased. OPA1 is the inner membrane fusion
protein. Constitutive OPA1 cleavage by YME1L and OMA1 at two distinct sites leads to the accumulation
of both long and short forms of OPA1.142
The long form of OPA1 is required for fusion, while the short
form promotes mitochondrial fragmentation.143
The long isoform is dominant in WT Mφs, while OPA1 is
excessively processed to short isoforms in DRP1-deleted Mφs. The decreased MFN-1 and excessive
processing of OPA1 might be a compensatory effect in cells whose fission is blocked. MFN2 is another
outer membrane fusion protein. It is functionally redundant with MFN1 in mediating mitochondrial fusion.

84
It is also the critical component of ER-mitochondria association membrane (MAM), the essential structure
facilitating ER mitochondria interaction. Interestingly, MFN2 levels are comparable in the two groups of
Mφs. Thus, GTPases that mediate mitochondrial fusion are compensatorily down-regulated or
inactivated in DRP1 deficient Mφs. Here, we use mitochondria volume indicators pyruvate
dehydrogenase E1 beta subunit (PDH1α) and ATP synthase subunit α (ATP5α) as mitochondria loading
controls. DRP1 deficient Mφs have similar mitochondrial volume as control Mφs, suggesting that
blocking of mitochondrial fission have negligible effects on mitochondria volume.

85
B
Figure 1 A
Peritoneal macrophages
Cultured peritoneal macrophages
Aortic smooth muscle cells
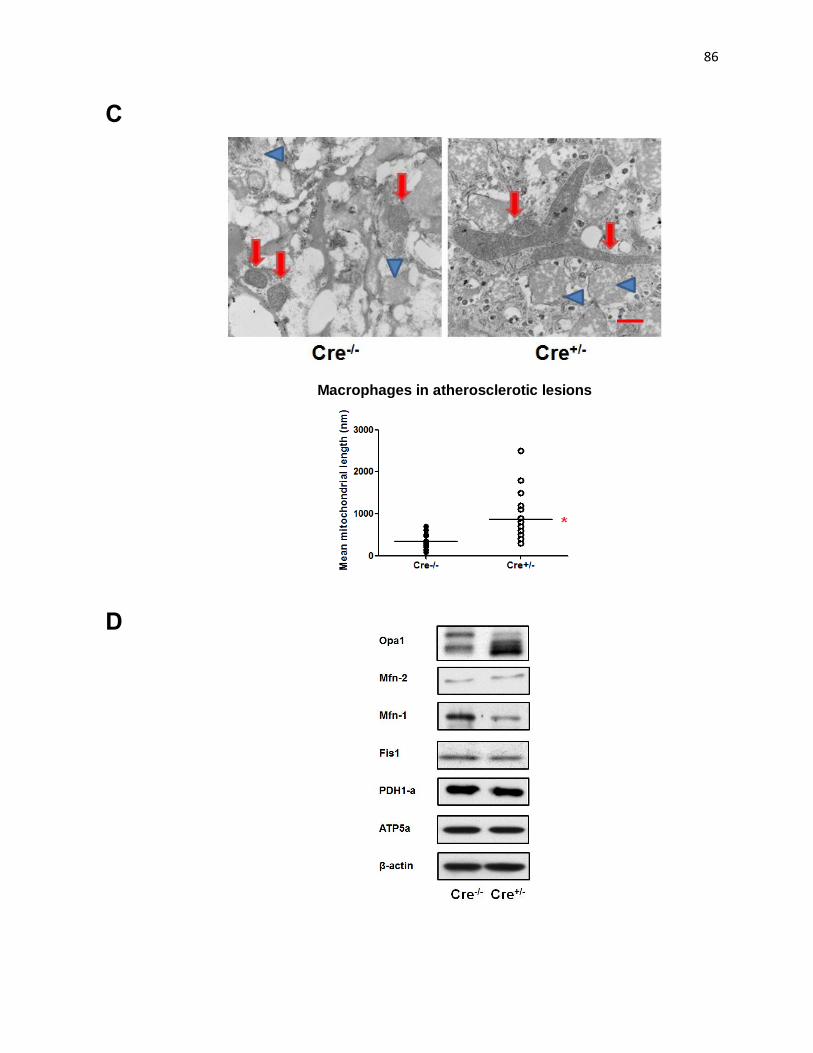
86
C
Macrophages in atherosclerotic lesions
D

87
Figure 1: DRP1 deficient Mφs have elongated mitochondria and altered expression of molecules
regulating mitochondrial dynamics.
Peritoneal Mφs and aortic smooth muscle cells from Drp1fl/fl
and Drp1fl/fl
LysmCre+/-
mice were assayed for
Drp1 mRNA, relative to β-actin by RT-QPCR (n = 3/group; * P<0.01). (B) Peritoneal Mφs were
immunostained using antibodies against DRP1 (green) and the mitochondria marker cytochrome C
oxidase IV (COX IV) and viewed by fluorescence microscopy. The 2th column of images is higher
magnification of the boxed areas in 1st column of images. The dotted white box in the representative
images of Drp1fl/fl
LysmCre+/-
Mφs displays a typical peri-nuclear located mitochondria clustering. Bars, 5
μm for the 1st column and 1 μm for the 2
nd column. (C) Aortic root lesions from Drp1
fl/fl Ldlr
-/-(control) and
Drp1fl/fl
LysmCre+/-
Ldlr-/-
mice after 12 wk WD feeding were subjected to transmission electron microscopy
(TEM) analysis (100000X). Representative images of lesional Mφs enriched with lipid droplets (blue
arrowheads), and mean length of mitochondria (red arrows) is quantified in the graph b helow (Bar,
500nm; n = 22 vs. 20; * P < 0.01). (D) Total cell lysates of Mφs from Drp1fl/fl
and Drp1fl/fl
LysmCre+/-
mice
were blotted with antibodies against the indicated molecules. β-actin was used as the loading control.

88
Mφ DRP1 Deletion Plays Negligible Roles in Early Atherogenesis.
Having confirmed the deletion of DRP1 in our model, we explored the role of Mφ specific DRP1-mediated
mitochondrial fission in early atherogenesis in the Ldlr-/-
background. After 8 wks WD, cross sections of
aortic root lesions from Drp1fl/fl
Ldlr-/-
(control) and Drp1fl/fl
LysMCre+/-
Ldlr-/-
mice were analyzed. Total
lesion areas of the two groups are similar, suggesting a negligible role of Mφ-specific DRP1-mediated
fission in atherogenesis in vivo (Figure 2).

89
Figure 2: Mφ specific DRP1 deletion does not affect early atherogenesis.
Drp1fl/fl
Ldlr-/-
(control) and Drp1fl/fl
LysMCre+/-
Ldlr-/-
mice were fed the WD for 8 wks, and aortic root lesions
were analyzed. Representative H&E-stained aortic root lesions, with the intima marked by dotted lines,
and total lesion area quantification (n = 11 mice/group; N.S., non-significant). Bar, 40 μm.
Figure 2
N.S
.
N.S
.
A

90
Deficiency in Mφ DRP1 Promotes Lesion Necrosis and Apoptotic Cells Accumulation
We further examined the role of Mφ specific DRP1 in advanced atherosclerosis, with a focus on necrotic
core formation and lesional cell apoptosis, the key features of clinically dangerous atherosclerotic plaques
in humans. After 12 wks of WD feeding, aortic root total lesion areas and the necrotic areas of
Drp1fl/fl
LysMCre+/-
Ldlr-/-
mice are larger than those of Drp1fl/fl
Ldlr-/-
mice. More strikingly, % of necrotic
area among total lesion area is significantly increased in Drp1fl/fl
LysMCre+/-
Ldlr-/-
lesions, which strongly
indicate that the KO lesions are more advanced and more necrotic (Figure 3A). The larger necrotic areas
are associated with more apoptotic cell accumulation in the DRP1 deleted lesions (Figure 3B), suggesting
that deletion of DRP1 in Mφs lead to a more advanced and vulnerable lesion phenotype.
Accumulation of apoptotic cells could be due to either more cell apoptosis or less clearance of
apoptotic cells by phagocytes (efferocytosis). As DRP1 has been suggested to mediate cell death, we
first assayed Mφs apoptosis by treating them with athero-relevant apoptosis inducers: 7 ketocholesterol
(7KC) or oxidized LDL (oxLDL) in vitro (Figure 3C). DRP1-deleted Mφs undergo a similar rate of
apoptosis as control Mφs. Then we tested whether DRP1-deleted Mφs were defective in efferocytosis in
the atherosclerosis lesions.144
Specifically, we measure the ratio of free-to-Mφ-associated apoptotic cells
in lesions by staining for nuclei, TUNEL, and Mφs. In this procedure, apoptotic bodies are detected as
TUNEL-positive nuclei (in red), whereas Mφ efferocytes are detected as cells having cytoplasm with
Mac3 positivity (a lesional Mφ marker, in green). TUNEL-positive nuclei that do not overlap with the Mac3
signals are considered “free”, whereas TUNEL-positive nuclei that overlap with Mac3 signals are
considered “Mφ-associated”. The images show examples of this procedure in Figure 3D. The upper and
middle images show an apoptotic body (ie, TUNEL-positive nucleus; arrows). The bottom left image also
shows a Mac3 positive cell, which is a lesional Mφ. In Drp1fl/fl
Ldlr-/-
lesions, the apoptotic body is in close
association with the Mφ in the left column. In contrast, the apoptotic body in the Drp1fl/fl
LysMCre+/-
Ldlr-/-
lesions is not closely associated with any Mφ (“free”), shown in the right column. Free versus Mφ-
associated apoptotic cells were quantified blinded in lesions from the two groups of mice. Quantitative
data show that there is a 3-fold increase in the ratio of free-to-Mφ-associated apoptotic cells in the lesions
from Drp1fl/fl
LysMCre+/-
Ldlr-/-
mice, suggesting a marked defect in efferocytosis with DRP1 deletion.

91
Figure 3 A
B
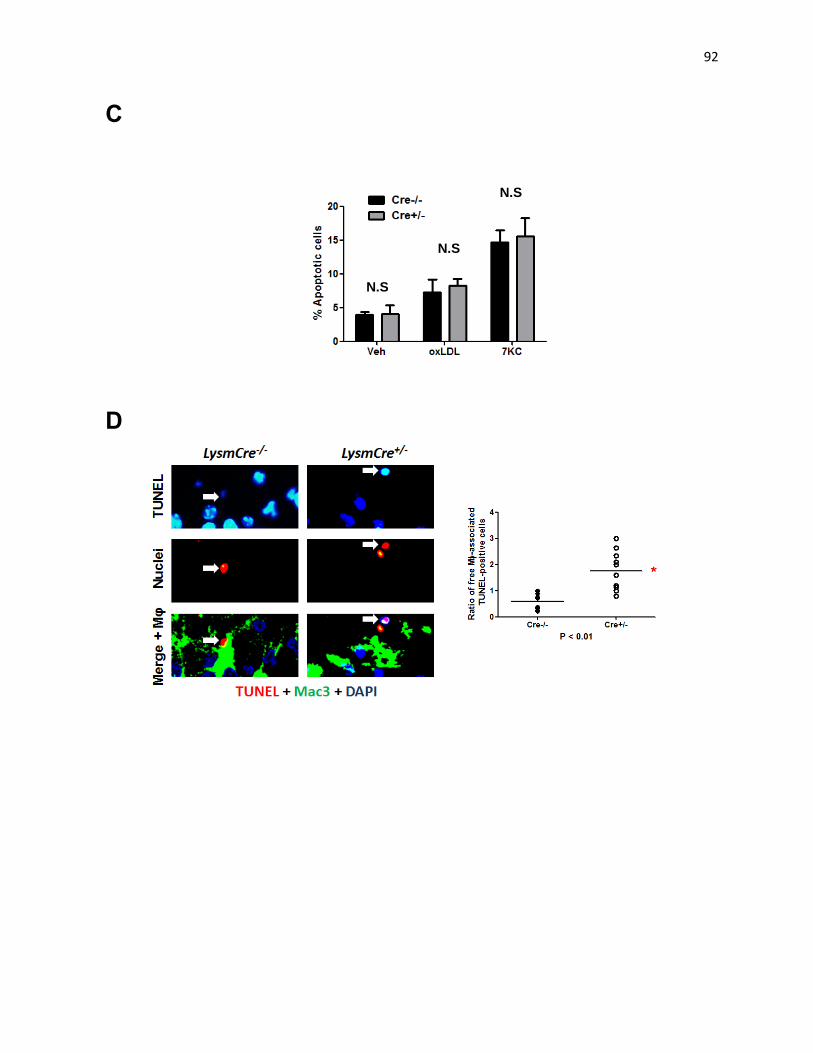
92
C
D
N.S
.
N.S
.
N.S
.

93
Figure 3: Deficiency in Mφ DRP1 increases lesion necrosis and apoptotic cells accumulation.
Drp1fl/fl
Ldlr-/-
(control) and Drp1fl/fl
LysMCre+/-
Ldlr-/-
mice were fed the WD for 12 wks, and aortic root lesions
were analyzed as below. (A) Representative H&E-stained aortic root lesions, wiith the necrotic area
boundary marked by yellow dotted lines (Bar, 40 μm), and quantification of total lesion area and necrotic
area (n = 14 vs. 12 mice; * P < 0.05). (B) The lesions were stained with apoptosis marker TUNEL (red
and depicted by arrows), Mφs (green, Mac3) and nuclei (blue, DAPI). Representative micrographs of
TUNEL (the left column) and merged images (the right colume), and data were quantified as the
percentage of TUNEL+ cells among all the Mac3+ cells in the graph on the right (Bar, 20 μm; n = 14 vs.
12 mice; * P<0.05). (C) Peritoneal Mφs Drp1fl/fl
(control) and Drp1fl/fl
LysMCre+/-
mice were treated with
vehicle (Veh), 7-ketocholesterol (7KC, 35g/ml) and oxidized LDL (oxLDL, 50g/ml) for 18 hrs, and assayed
for apoptosis (Annexin V) by FACS (n = 3 sets of Mφs in each group; N.S., none significant). (D)
Examples of nuclear (blue; DAPI), TUNEL (red), and Mφ Mac3 (green) staining to differentiate Mφ-
associated (left column of images) from free (right column of images) apoptotic cells in aortic root lesions
of Drp1fl/fl
Ldlr-/-
and Drp1fl/fl
LysMCre+/-
Ldlr-/-
mice, respectively. Arrows indicate apoptotic bodies.
Quantitation of the free-to-Mφ-associated ratio of apoptotic cells in the lesions of the 2 groups of mice
(Bar, 5 μm; n = 14 vs. 12 mice; *P<0.05).

94
Mφ DRP1 Deletion Does not Lead to Pro-atherosclerosis Metabolic Changes
We further characterized the systemic metabolic parameters that might contribute to atherosclerosis
progression. Glucose, triglyceride and cholesterol metabolisms are similar between the two groups.
Interestingly, there is about 1.6 fold increase in HDL cholesterol level in Drp1fl/fl
LysMCre+/-
Ldlr-/-
mice
(Figure 4). Because higher HDL levels protect against atherosclerosis, the changes in HDL level cannot
explain the larger necrotic areas in the Drp1fl/fl
LysMCre+/-
Ldlr-/-
mice. Thus, we conclude that the change
of metabolic parameters does not contribute to the more vulnerable plaque formation in Drp1fl/fl
LysMCre+/-
Ldlr-/-
mice. Why and how the deletion of DRP1 in Mφs leads to higher HDL level in the plasma is an
intriguing question requiring further investigation.

95
Figure 4: Metabolic parameters of 12-wk WD-fed Drp1fl/fl
Ldlr-/-
and Drp1fl/fl
LysMCre+/-
Ldlr-/-
mice.
Plasma lipids, lipoproteins, fasting glucose, body weight, and FPLC profile of lipoprotein-cholesterol were
assayed for the two groups of mice (n = 14 vs. 12 mice; N.S., not significant; * P = 0.008).
Figure 4
96
Impaired Clearance of Apoptotic Cells in Drp1fl/fl
LysmCre+/-
Mice in vivo
Based on our findings in the atherosclerotic lesions, we decided to examine the efferocytic capability of
DRP1 null macrophages under the condition when a significant population of cells within a tissue is
undergoing apoptosis. Injection of dexamethasone (Dex) in mice induces rapid and synchronized
thymocyte apoptosis and the subsequent clearance of apoptotic cells by the resident and infiltrated Mφs
(Figure 1A). Normally after 18 hrs dexamethasone injection, the thymus starts to shrink if the clearance
of apoptotic thymocytes by Mφs is effective, as we found in the control mice. In contrast, the thymus of
Drp1fl/fl
LysMCre+/-
mice does not decrease after Dex injection (the upper images, Figure 5B). Consistent
with that, the total cell number and thymus weight are significantly increased in Drp1fl/fl
LysMCre+/-
mice
compared to the controls (the lower graph, Figure 5B). Then we analyzed cell apoptosis by two different
assays: annexin V staining, a measure of phosphatidylserine (PS), and TUNEL staining (a measure of
cleaved DNA during cell apoptosis) (Figure 5C). Both assays show more AC accumulation in the thymus
of Drp1fl/fl
LysMCre+/-
mice. Since DRP1 deletion occurs only in lysozyme expressing cells in
Drp1fl/fl
LysMCre+/-
mice, the apoptosis of thymocytes in two groups of mice should be same. Therefore,
the accumulation of ACs in Drp1fl/fl
LysMCre+/-
mice is because of impaired clearance. The first step for
phagocytes to eat ACs is to migrate toward ACs that release “find-me” and “eat-me” signals. We found
that the migration toward ACs and MCP-1 were intact in DRP1 deleted Mφs (Figure 5D). Collectively,
Drp1fl/fl
LysMCre+/-
mice are defective of clearing apoptotic thymocytes in vivo, and the defect is not due to
their impaired migration capability.

97
Figure 5
B
A

98
1
C
D
D
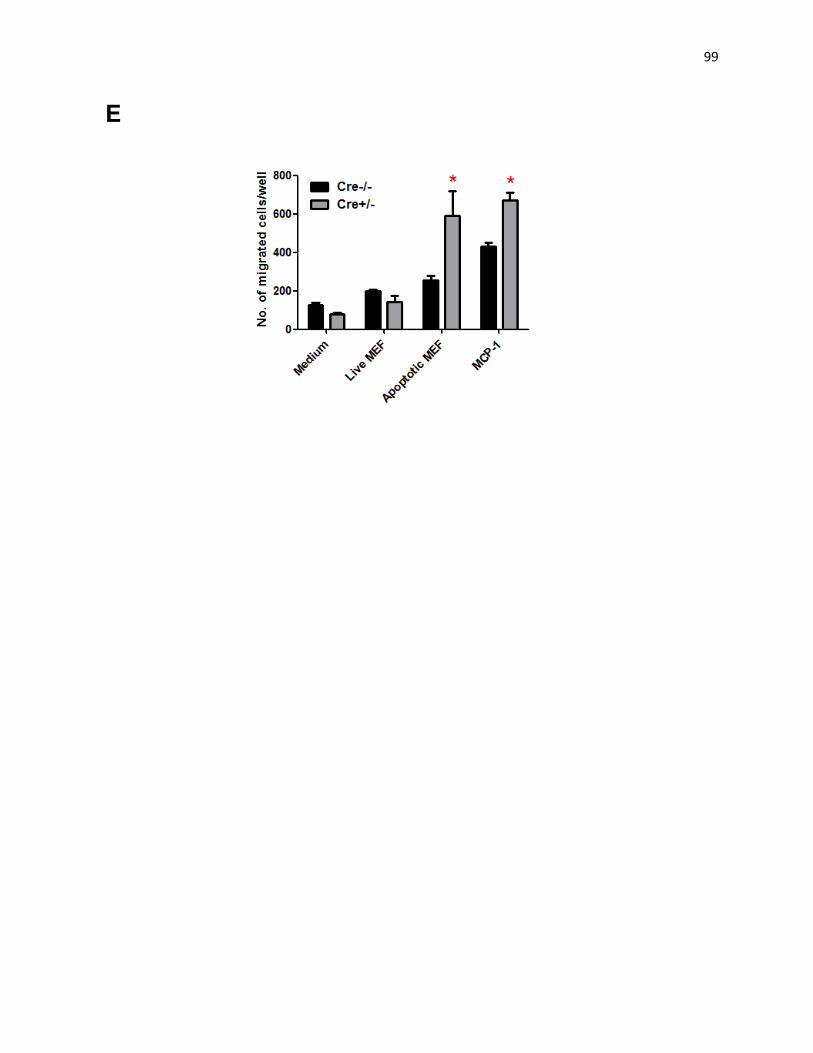
99
E
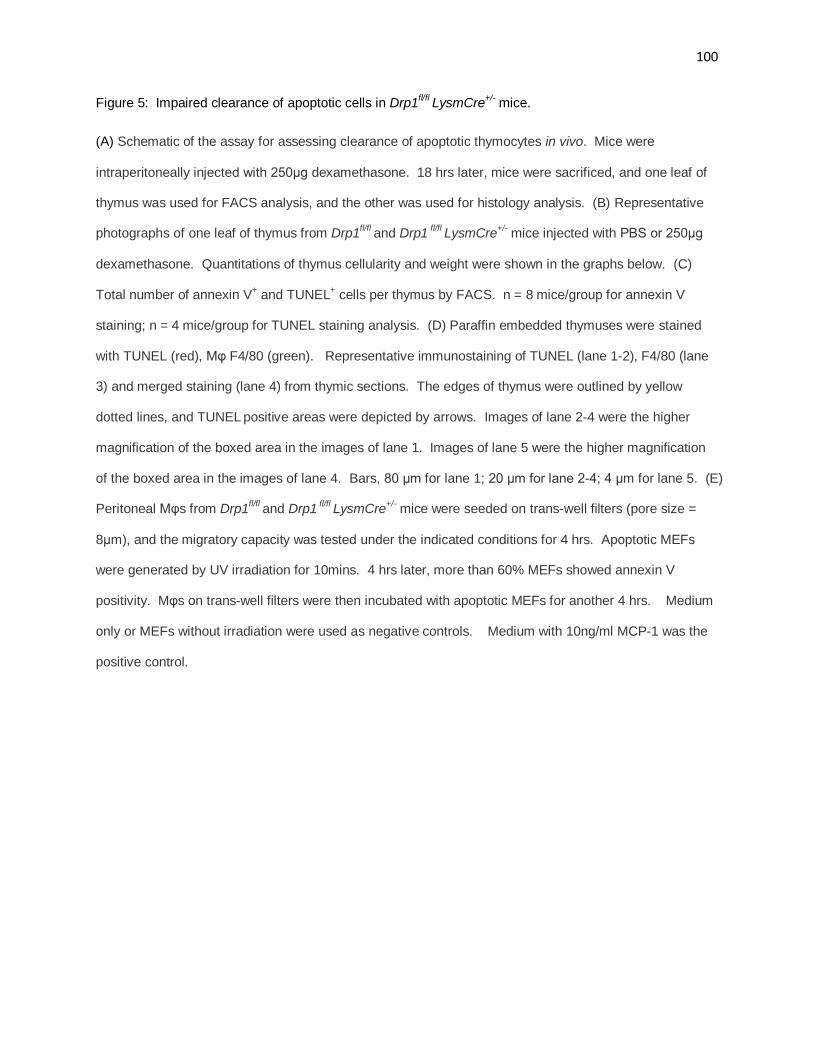
100
Figure 5: Impaired clearance of apoptotic cells in Drp1fl/fl
LysmCre+/-
mice.
(A) Schematic of the assay for assessing clearance of apoptotic thymocytes in vivo. Mice were
intraperitoneally injected with 250μg dexamethasone. 18 hrs later, mice were sacrificed, and one leaf of
thymus was used for FACS analysis, and the other was used for histology analysis. (B) Representative
photographs of one leaf of thymus from Drp1fl/fl
and Drp1 fl/fl
LysmCre+/-
mice injected with PBS or 250μg
dexamethasone. Quantitations of thymus cellularity and weight were shown in the graphs below. (C)
Total number of annexin V+ and TUNEL
+ cells per thymus by FACS. n = 8 mice/group for annexin V
staining; n = 4 mice/group for TUNEL staining analysis. (D) Paraffin embedded thymuses were stained
with TUNEL (red), Mφ F4/80 (green). Representative immunostaining of TUNEL (lane 1-2), F4/80 (lane
3) and merged staining (lane 4) from thymic sections. The edges of thymus were outlined by yellow
dotted lines, and TUNEL positive areas were depicted by arrows. Images of lane 2-4 were the higher
magnification of the boxed area in the images of lane 1. Images of lane 5 were the higher magnification
of the boxed area in the images of lane 4. Bars, 80 μm for lane 1; 20 μm for lane 2-4; 4 μm for lane 5. (E)
Peritoneal Mφs from Drp1fl/fl
and Drp1 fl/fl
LysmCre+/-
mice were seeded on trans-well filters (pore size =
8μm), and the migratory capacity was tested under the indicated conditions for 4 hrs. Apoptotic MEFs
were generated by UV irradiation for 10mins. 4 hrs later, more than 60% MEFs showed annexin V
positivity. Mφs on trans-well filters were then incubated with apoptotic MEFs for another 4 hrs. Medium
only or MEFs without irradiation were used as negative controls. Medium with 10ng/ml MCP-1 was the
positive control.

101
Defective Uptake of Apoptotic Cells in Mφs Lacking of Mitochondrial Fission in vitro
To explore the molecular and cellular mechanisms of efferocytosis deficiency in DRP1 deleted Mφs, we
performed Mφ efferocytosis assay in vitro. Specifically, we incubate peritoneal Mφs (phagocyte, labeled
with calcein green) with apoptotic cells (ACs, labeled with annexin V Alexa-647 conjugated) for the
indicated time periods at 37°C. ACs are UV-irradiated Jurkat cells, 7-KC and oxLDL treated
macrophgaes. Phagocytes are washed three times with PBS, lifted and subjected to FACS analysis.
Schematic of FACS analysis of phagocytes engulfing AC and without AC is demonstrated in Figure 6A.
Data are quantified as the population of phagocytes engulfing AC among all the phagocytes. Consistent
with our in vivo finding, the uptake of ACs in Drp1fl/fl
LysMCre+/-
Mφs is significantly impaired in vitro
(Figure 6B, the upper three graphs). Moreover, the defect of taking up ACs is not restricted to specific
cell types or apoptotic stimuli. Phagocytes can continuously take up apoptotic cells and lead to the
increment of annexin V mean fluorescence intensity (MFI). Annexin V MFI in the phagocytes is about 15%
lower in Drp1fl/fl
LysMCre+/-
Mφs, suggesting the continued uptake of apoptotic cells is impaired with DRP1
deletion (Figure 6B, the lower two graphs). We further perform dose curve and time course experiments,
by increasing the AC to phagocyte ratio or prolonging the incubation time. Both experiments indicate that
DRP1 deficiency does not affect the initial AC uptake, but impairs the continued uptake of ACs after
prolonged incubation or under the conditions where the AC to phagocyte ratio is high (Figure 6C).
Collectively, the in-vitro data support the notion that DRP1 is required for continued uptake of ACs in Mφs.
We further asked whether the continued uptake of ACs relied on mitochondrial fission or the other
functions of DRP1 than fission. To address this question, we used siRNA to knockdown DRP1’s docking
protein FIS1. FIS1 is located in the outer membrane of mitochondria, and DRP1-mediated outer
membrane fission depends on its binding to FIS1. As we have expected, more cells with siFIS1 have
long or net-like mitochondria relative to scrambled siRNA treated cells. Such morphology phenotype is
less pronounced than cells treated with siDRP1 (Figure 6D), which is consistent with previous reports in
other cells types than Mφs.145
Mφs with siFIS1 are also defective in continued uptake of ACs in vitro
(Figure 6E), suggesting such defect was caused by the lack of mitochondrial fission.

102
A
[Type a quote
from the
[Type a quote from the document or the summary of an
interesting point. You can position the text box anywhere in
Figure 6
B
C
[Type a quote from the document or the summary of an interesting
point. You can position the text box anywhere in the document. Use the

103
D
E
0 0

104
Figure 6: Impaired uptake of ACs in Mφs with mitochondrial fission deficiency.
(A) Schematic of the FACS assessing Mφ efferocytosis in vitro. Cultured peritoneal Mφs (phagocyte)
were incubated with apoptotic cells (ACs) for 45 mins and then lifted for FACS analysis. ACs were
generated as below: 4 hrs after Jurkat cells were irradiated by UV for 10 mins; Mφs treated with 7-
ketocholesterol (7KC, 35 μg/ml) for 18 hrs; or Mφs incubated with oxLDL (50 μg/ml) for 20 hrs. ACs were
stained with annexin V conjugated with Alexa 647 for 30mins before being added to phatocytes, which
were labeled with calcein green (FITC). Alexa 647 and calcein green double positive cells were
phagocytes engulfing ACs. Data were quantified as the percentage of phagocytes with AC among all the
phagocytes, or mean fluorescence intensity (MFI) of annexin V per phagocyte as measures of efferocytic
capacity. (B) Quantification of % of phagocytes taking up AC (upper three graphs); Mean fluorescence
intensity (MFI) of AC per phagocyte (lower two graphs). (C) Mφs were incubated with AC (UV-treated
Jurkat cells) for the indicated time (the left graph), or incubated with ACs at the indicated ratio (the right
graph) for 45 mins. Efferocytosis was assayed by FACS. (D) Mφs were transfected with scrambled
(SCR) or Drp siRNA (siDRP1) or Fis1 siRNA (siFIS1) for 84 hrs. Total cell lysates of Mφs treated with
indicated siRNAs were assayed for total DRP1 and Fis1. ATP5a and β-actin were used as mitochondria
volume and sample loading controls (the left blots). Representative images of mitochondria morphologies
in Mφs treated with indicated the siRNAs (the right images). The right column is the higher power
magnifications of the boxed areas in the left column. Bars, 5μm in the left column; 0.5μm in the left
column. (E) Mφs treated with indicated the siRNAs were loaded with UV-treated Jurkat cells for 45 mins.
The percentages of phagocytes with ACs and MFI of AC per phagocyte were quantified in graphs. * P <
0.05 compared to the scrambled siRNA treated cells.

105
Drp1fl/fl
LysmCre+/-
Mφs is Defective of Engulfing Cellular Materials with Metabolic Load
Clearance of ACs by phagocytes is a complicated process. It starts from the release of “find-me” signals
from ACs. After phagocytes sense those “find-me” signals, they migrate toward and then bind to ACs
who present “eat-me” signals on the cell surface. These signals are specific markers that can be
recognized by engulfing receptors on phagocytes. Once activated, these engulfment receptors signal
intracellularly to mediate the physical rearrangement of the phagocyte cytoskeleton required for corpse
uptake. To understand why DRP1 deficiency leads to efferocytosis deficiency, we first tested cell
migration capabilities. We found DRP1 deficiency was not associated with impaired cell migration, as
shown in Figure 5E. Then we determined whether DRP1 deficiency impaired binding. Phagocytes were
put in the cold (4°C) or incubated with an inhibitor of cytoskeleton rearrangement, cytochalasin D. Under
these conditions, phagocytes only bind to AC but do not start the engulfment process. We found that two
groups of cells had comparable binding capability in both conditions (Figure 7A). Then we examined the
next step, engulfment, in Drp1fl/fl
vs. Drp1fl/fl
LysMCre+/-
Mφs. Interestingly, DRP1 deletion does not affect
the uptake of IgG-opsonized latex beads, while DRP1 deletion robustly impairs the engulfment of IgG-
opsonized sheep red blood cells (sRBCs) (Figure 7B), Engulfment of synthetic latex beads and cellular
material (ACs or opsonized living cells) share common cytoskeleton rearrangement machinery.
Therefore, these data suggested that common cytoskeleton rearrangement machinery is intact in DRP1
null Mφs. The difference between beads and cell engulfment is that the cellular materials add a
“metabolic load” to the phagocytes, and how phagocytes handle such metabolic load may affect the
continued engulfment. Taken together, fission deficiency specifically impairs the engulfment of materials
with metabolic load, but not the engulfment of synthetic materials.

106
Figure 7: Continuous engulfment of cellular material is impaired in Drp1fl/fl
LysmCre+/-
Mφs.
Efferocytosis was assayed by FACS after cells were incubated in the following conditions: (A) pre-treated
with cytochalasin D (5μM) for 30 mins and then incubated with ACs at 37°C for another1 hr; or incubated
with ACs at 4°C for 1 hr. (B) Incubated with IgG-opsonized sRBCs or IgG-opsonized synthetic beads
(4.5 μm) synthetic latex beads for 1 hr at 37°C. The ratio of cell/beads to phagocyte is 10 to 1. * P <
0.05, n = 3 vs. 3/group.
Figure 7 A
B
0
0

107
Drp1fl/fl
LysmCre+/-
Mφs Have Reduced Level of UCP2 and Uncontrolled Elevation of ΔΨ
Uncoupling protein 2 (UCP2) is the proton carrier in the inner membrane of mitochondria. Instead of
using the proton gradient to make ATP, UCP2 uses the proton gradient to generate heat. In this process,
UCP2 acts to lower mitochondria membrane potential ΔΨ and prevent mitochondria hyperpolarization.
Recently, Ravichandran’s group has reported that UCP2 is upregulated after Mφs take up ACs but not
synthetic beads. UCP2 is required for continuous uptake of ACs through lowering mitochondrial ΔΨ.
Moreover, UCP2-/-
atherosclerosis lesions have same phenotypes as DRP1 null lesions, including larger
lesion sizes and more AC accumulation. Thus, we reasoned that UCP2 and DRP1 maybe in the same
pathway required for continued AC uptakes in Mφs. As we predicted, Drp1fl/fl
LysMCre+/-
Mφs express
lower level of UCP2 after taking up ACs (Figure 8A). Associated with the reduced level of UCP2
induction, the ΔΨ of phagocytes with mitochondrial fission deficiency is significantly elevated (Figure 8B).
Taken together, these data demonstrate that mitochondria fission (mediated by DRP1 and FIS1) is
required for UCP2 induction. The increased UCP2 will prevent the extensive elevation of ΔΨ and enable
Mφs to continuously take up ACs.
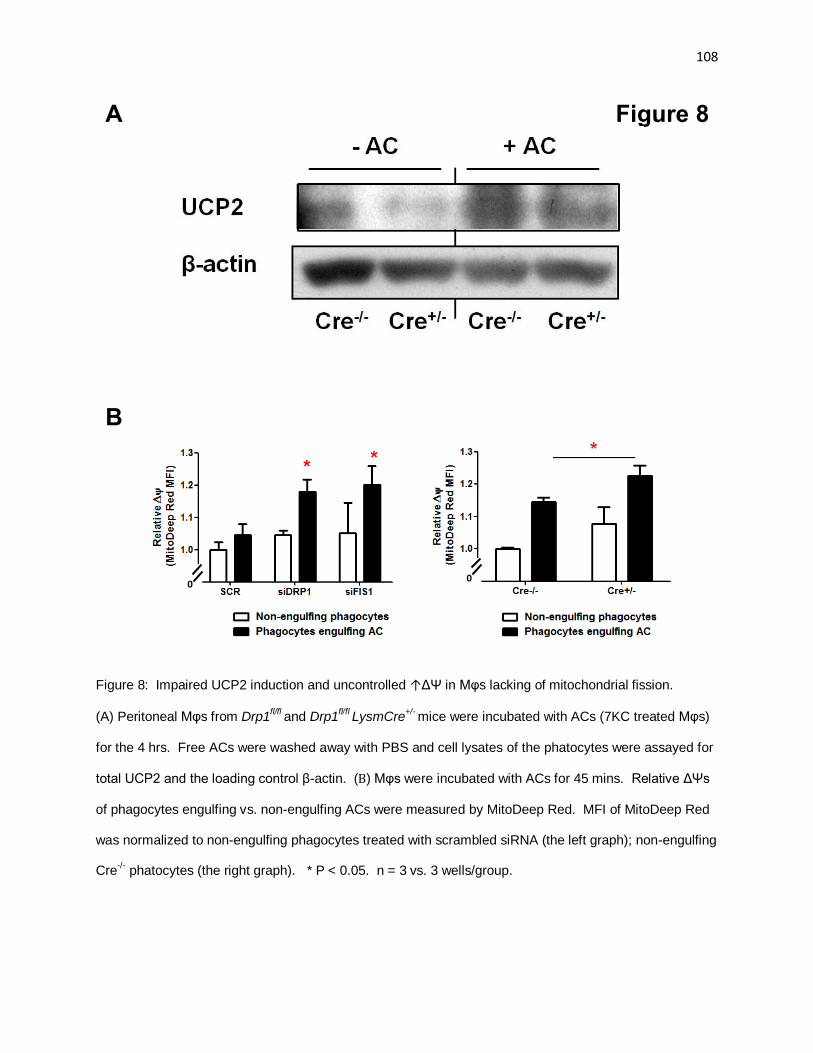
108
Figure 8: Impaired UCP2 induction and uncontrolled ↑ΔΨ in Mφs lacking of mitochondrial fission.
(A) Peritoneal Mφs from Drp1fl/fl
and Drp1fl/fl
LysmCre+/-
mice were incubated with ACs (7KC treated Mφs)
for the 4 hrs. Free ACs were washed away with PBS and cell lysates of the phatocytes were assayed for
total UCP2 and the loading control β-actin. (B) Mφs were incubated with ACs for 45 mins. Relative ΔΨs
of phagocytes engulfing vs. non-engulfing ACs were measured by MitoDeep Red. MFI of MitoDeep Red
was normalized to non-engulfing phagocytes treated with scrambled siRNA (the left graph); non-engulfing
Cre-/-
phatocytes (the right graph). * P < 0.05. n = 3 vs. 3 wells/group.
A Figure 8
B
0 0

109
Figure 9: Working model of how mitochondrial deficiency leads to impaired efferocytosis
Figure 9
DRP1-/-
or
Mitochondrial
fission deficiency
↓UCP2 ↑ΔΨ ↓Efferocytosis
↑Degradation
↓Translation

110
Discussion
Mφs are also called “macrophagocytes” because they are highly specialized in removal of dying or dead
cells and cellular debris (efferocytosis). Normally, the dying cells are quickly recognized and removed by
phagocytes to prevent inflammation and keep tissue homeostasis. However, under such chronic
conditions as atherosclerosis, obesity and auto-immune disorders, the efferocytic system is impaired. In
atherosclerosis, various induced mutations or metabolic disorders that cause defective efferocytosis lead
to increased necrotic core formation, increased inflammation and more advanced lesions in mouse
models.144, 146, 147
However, why efferocytosis becomes inefficient during the advanced stage of
atherosclerosis is unclear.
Exploring the roles of mitochondrial dynamics and their functional significance has recently
become a popular and intriguing topic. However, the specific role of mitochondrial dynamics in Mφs has
not been studied yet. In this study, we used a genetic mouse model to investigate the role of DRP1-
mediated mitochondria fission in Mφs. We have found that DRP1 is required for continued uptaking ACs
both in vitro and in vivo. Additionally, we tested its functional significance in the setting of advanced
atherosclerosis, and we showed that mitochondrial hyperfusion lead to increased necrotic core formation
and apoptotic cell accumulation. To our knowledge, this is the first study to link mitochondria dynamics to
the phagocytic function in phagocytes. Our study further implied that mitochondrial dynamics could be a
novel therapeutic target to maintain the efferocytic capacity in advanced lesions. To test this, we plan to
explore the mitochondrial dynamic changes during the natural progress of the disease. We will start from
the murine athero models, with a focus on mitochondria morphology and expression/activity of molecules
that regulate mitochondria fusion/fission in lesional Mφs and/or circulating monocytes. Further, we will
continue examining the mitochondria morphology in human lesions, and/or in circulating monocytes. If
mitochondrial hyperfusion does occur, we would like to understand the following questions: (1) Why does
hyperfusion happen? (2) Does hyperfusion cause efferocytosis deficiency in advanced atherosclerosis?
(3) Is the inhibition of hyperfusion sufficient to maintain efferocytic efficiency and to prevent necrotic core
formation?
Mechanistically, our study further revealed an unexpected association of mitochondria dynamics
with the level of a critical molecule called UCP2. UCP2 has been proven to be required for continued

111
uptake of ACs, and therefore the current working model is shown in Figure 9. To consolidate this working
model, we will test whether the restoration of UCP2 or pharmacological prevention ↑ΔΨ can correct the
efferocytic deficiency in DRP null Mφs.
The most interesting question in this model is the link between DRP1 depletion and reduced level
of UCP2. Our preliminary data indicate that UCP2 mRNA level is about two-fold elevated in DRP null
Mφs (data not shown), suggesting that this reduction in UCP2 protein involve a post-transcriptional
mechanism. It is known that UCP2 has a high turnover rate, and its degradation is mediated by UPS
(ubiquitin-proteasome system).148
Thus, one possibility is that DRP1 deletion leads to the enhanced
degradation of UCP2 by UPS. To test this hypothesis, we plan to pharmacologically inhibit protein
translation and measure the degradation rate of UCP2 in two groups of Mφs. If the degradation rates are
different, we will further examine if the UPS-mediated UCP2 degradation is accelerated with the deletion
of DRP1. If the degradation step is intact, we can test the less likely hypothesis that DRP1 deletion
decreases UCP2 translation or decreased post-translational mitochondrial import. Besides, it is possible
that DRP1-UCP link also exists in other disease models. In the past twenty years, the essential roles of
different family members of uncoupling protein have been suggested in a number of physiological and
pathological conditions, including the regulation of fatty acid metabolism and insulin secretion. It would
be very interesting to explore whether DRP1-UCP link is also essential under these conditions.
Another interesting point in this model is the link of DRP1 deletion (UCP2-/- or ↑ΔΨ) to the defect
of continuous uptake of substances with a metabolic load. We showed that DRP1 deletion does not
affect the continued uptake of synthetic latex beads, but impairs the ability to take up sRBCs and ACs.
Thus, we reasoned that how the phagocytes handle the excess metabolic burden acquired from the
ingested corpse, such as cholesterol, lipids, fatty acids and proteins, might affect the long-term
engulfment activity. Mitochondrial fission, UCP2, or ΔΨ could be the key player to regulate this process.
There are several hypotheses we are planning to test. (1) Existing evidences suggested that LXR and
PPAR are activated during AC clearance, via the sensing of the lipids and cholesterol acquired from AC.
Such activation leads to the upregulation of phagocytic receptors (Mer) and opsonins (Gas6, MFG-8E,
and C1qb) to facility the continued uptake. Thus, one possibility is that after engulfing the metabolic load,
DRP1 (UCP2 or ΔΨ) regulates the expression of these phagocytic receptor and opsonins through

112
LXR/PPAR. (2) LXR and PPAR activation increase the expression of the lipid transporter ABCA1 and
enhance the cholesterol efflux. The cholesterol content on the plasma membrane is critical to for
receptor mediated signal transduction. Thus, another possibility is that UCP2 or DRP1 can regulate
ABCA1 induction after engulfing corpse, and thus influence the intracellular signal transduction. (3) It has
been shown that high-glucose environment reduces corpse uptake. The ingestion of corpse could affect
the glucose level in the microenvironment. DRP1 (UCP2 or ΔΨ) can somehow maintain the glucose
level in the microenvironment and eventually facilitate continued corpse uptake.
In conclusion, we discovered a novel and essential role of mitochondria fission in efferocytosis in
myeloid cells. Mitochondrial fission could be a potential target to stablize the atherosclerotic lesion or
prevent chronic inflammations due to the impaired ability of AC clearance.

113
Conclusion
Atherosclerosis is a life-long chronic disease featured by unresolvable inflammation. It develops
from the early atheroma formation, through the intermediate stage when the foam cells are covered with a
“fibrous cap”, toward the advanced lesions that contain huge necrotic core areas. All these processes are
significantly determined by monocyte-derived Mφs, the dominant cell type in the atherosclerotic lesions.
Therefore, the thesis studies focus on exploring different pathological roles of Mφs during both the early
athergenesis and advanced atherosclerosis.
Mitochondrion is an interesting organelle beyond its role of generating ATP. In this thesis, we
have found two novel functions of mitochondria in Mφs. The natural byproducts of OXPHOS in
mitochondria, mitochondrial ROS, exert pro-inflammatory roles through regulating the activation of a key
transcription factor NF-κB and transcriptional upregulation of an essential chemokine MCP-1. Through
this mechanism, mitochondrial ROS in Mφs continuously amplify the chronic inflammation during early
atherogenesis. Unexpectedly, we discovered a novel function of mitochondrial dynamic changes in
regulating the phagocytic capacity of Mφs in the second part of this thesis. Such cutting-edge discovery
opens a new area of studies to explore the roles of mitochondrial dynamics in the immune system, in
particular different immune cells and their unique functions.
The whole thesis depends on the discoveries using experimental atherosclerosis models, and
there is still a lot to do before these new findings can be applied to the treatment of human
atherosclerosis,

114
Reference
1. Turrens JF. Mitochondrial formation of reactive oxygen species. J Physiol. 2003;552:335-344 2. Ali MH, Mungai PT, Schumacker PT. Stretch-induced phosphorylation of focal adhesion kinase in
endothelial cells: Role of mitochondrial oxidants. Am J Physiol Lung Cell Mol Physiol. 2006;291:L38-45
3. Zhang DX, Gutterman DD. Mitochondrial reactive oxygen species-mediated signaling in endothelial cells. Am J Physiol Heart Circ Physiol. 2007;292:H2023-2031
4. Liu Y, Zhao H, Li H, Kalyanaraman B, Nicolosi AC, Gutterman DD. Mitochondrial sources of h2o2 generation play a key role in flow-mediated dilation in human coronary resistance arteries. Circ Res. 2003;93:573-580
5. Schriner SE, Linford NJ, Martin GM, Treuting P, Ogburn CE, Emond M, Coskun PE, Ladiges W, Wolf N, Van Remmen H, Wallace DC, Rabinovitch PS. Extension of murine life span by overexpression of catalase targeted to mitochondria. Science. 2005;308:1909-1911
6. Mao P, Manczak M, Calkins MJ, Truong Q, Reddy TP, Reddy AP, Shirendeb U, Lo HH, Rabinovitch PS, Reddy PH. Mitochondria-targeted catalase reduces abnormal app processing, amyloid beta production and bace1 in a mouse model of alzheimer's disease: Implications for neuroprotection and lifespan extension. Hum Mol Genet. 2012;21:2973-2990
7. Dai DF, Hsieh EJ, Liu Y, Chen T, Beyer RP, Chin MT, MacCoss MJ, Rabinovitch PS. Mitochondrial proteome remodelling in pressure overload-induced heart failure: The role of mitochondrial oxidative stress. Cardiovasc Res. 2012;93:79-88
8. Ignarro LJ, Kadowitz PJ. The pharmacological and physiological role of cyclic gmp in vascular smooth muscle relaxation. Annu Rev Pharmacol Toxicol. 1985;25:171-191
9. Bohr VA, Anson RM. Mitochondrial DNA repair pathways. J Bioenerg Biomembr. 1999;31:391-398
10. Dalfino G, Simone S, Porreca S, Cosola C, Balestra C, Manno C, Schena FP, Grandaliano G, Pertosa G. Bone morphogenetic protein-2 may represent the molecular link between oxidative stress and vascular stiffness in chronic kidney disease. Atherosclerosis. 2010;211:418-423
11. de Souza-Pinto NC, Hogue BA, Bohr VA. DNA repair and aging in mouse liver: 8-oxodg glycosylase activity increase in mitochondrial but not in nuclear extracts. Free Radic Biol Med. 2001;30:916-923
12. Ari E, Kaya Y, Demir H, Cebi A, Alp HH, Bakan E, Odabasi D, Keskin S. Oxidative DNA damage correlates with carotid artery atherosclerosis in hemodialysis patients. Hemodial Int. 2011;15:453-459
13. Morita M, Yano S, Yamaguchi T, Sugimoto T. Advanced glycation end products-induced reactive oxygen species generation is partly through nf-kappa b activation in human aortic endothelial cells. J Diabetes Complications. 2013;27:11-15
14. Xiang F, Shuanglun X, Jingfeng W, Ruqiong N, Yuan Z, Yongqing L, Jun Z. Association of serum 8-hydroxy-2'-deoxyguanosine levels with the presence and severity of coronary artery disease. Coron Artery Dis. 2011;22:223-227
15. Ballinger SW, Patterson C, Knight-Lozano CA, Burow DL, Conklin CA, Hu Z, Reuf J, Horaist C, Lebovitz R, Hunter GC, McIntyre K, Runge MS. Mitochondrial integrity and function in atherogenesis. Circulation. 2002;106:544-549
16. Tuominen A, Miller YI, Hansen LF, Kesaniemi YA, Witztum JL, Horkko S. A natural antibody to oxidized cardiolipin binds to oxidized low-density lipoprotein, apoptotic cells, and atherosclerotic lesions. Arterioscler Thromb Vasc Biol. 2006;26:2096-2102

115
17. Perrotta I, Perrotta E, Sesti S, Cassese M, Mazzulla S. Mnsod expression in human atherosclerotic plaques: An immunohistochemical and ultrastructural study. Cardiovasc Pathol. 2013
18. Cho YE, Basu A, Dai A, Heldak M, Makino A. Coronary endothelial dysfunction and mitochondrial reactive oxygen species in type 2 diabetic mice. Am J Physiol Cell Physiol. 2013;305:C1033-1040
19. t Hoen PA, Van der Lans CA, Van Eck M, Bijsterbosch MK, Van Berkel TJ, Twisk J. Aorta of apoe-deficient mice responds to atherogenic stimuli by a prelesional increase and subsequent decrease in the expression of antioxidant enzymes. Circ Res. 2003;93:262-269
20. Harrison CM, Pompilius M, Pinkerton KE, Ballinger SW. Mitochondrial oxidative stress significantly influences atherogenic risk and cytokine-induced oxidant production. Environ Health Perspect. 2011;119:676-681
21. Navarro-Antolin J, Redondo-Horcajo M, Zaragoza C, Alvarez-Barrientos A, Fernandez AP, Leon-Gomez E, Rodrigo J, Lamas S. Role of peroxynitrite in endothelial damage mediated by cyclosporine a. Free Radic Biol Med. 2007;42:394-403
22. Torzewski M, Ochsenhirt V, Kleschyov AL, Oelze M, Daiber A, Li H, Rossmann H, Tsimikas S, Reifenberg K, Cheng F, Lehr HA, Blankenberg S, Forstermann U, Munzel T, Lackner KJ. Deficiency of glutathione peroxidase-1 accelerates the progression of atherosclerosis in apolipoprotein e-deficient mice. Arterioscler Thromb Vasc Biol. 2007;27:850-857
23. Lewis P, Stefanovic N, Pete J, Calkin AC, Giunti S, Thallas-Bonke V, Jandeleit-Dahm KA, Allen TJ, Kola I, Cooper ME, de Haan JB. Lack of the antioxidant enzyme glutathione peroxidase-1 accelerates atherosclerosis in diabetic apolipoprotein e-deficient mice. Circulation. 2007;115:2178-2187
24. Wang Y, Wang GZ, Rabinovitch P, Tabas I. Macrophage mitochondrial oxidative stress promotes atherosclerosis and nf-kb-mediated inflammation in macrophages. Circ Res. 2013
25. Myung SK, Ju W, Cho B, Oh SW, Park SM, Koo BK, Park BJ, Korean Meta-Analysis Study G. Efficacy of vitamin and antioxidant supplements in prevention of cardiovascular disease: Systematic review and meta-analysis of randomised controlled trials. BMJ. 2013;346:f10
26. Yang H, Roberts LJ, Shi MJ, Zhou LC, Ballard BR, Richardson A, Guo ZM. Retardation of atherosclerosis by overexpression of catalase or both cu/zn-superoxide dismutase and catalase in mice lacking apolipoprotein e. Circ Res. 2004;95:1075-1081
27. Barry-Lane PA, Patterson C, van der Merwe M, Hu Z, Holland SM, Yeh ET, Runge MS. P47phox is required for atherosclerotic lesion progression in apoe(-/-) mice. J Clin Invest. 2001;108:1513-1522
28. Madamanchi NR, Moon SK, Hakim ZS, Clark S, Mehrizi A, Patterson C, Runge MS. Differential activation of mitogenic signaling pathways in aortic smooth muscle cells deficient in superoxide dismutase isoforms. Arterioscler Thromb Vasc Biol. 2005;25:950-956
29. Kubli DA, Gustafsson AB. Mitochondria and mitophagy: The yin and yang of cell death control. Circ Res. 2012;111:1208-1221
30. Wang Y, Nartiss Y, Steipe B, McQuibban GA, Kim PK. Ros-induced mitochondrial depolarization initiates park2/parkin-dependent mitochondrial degradation by autophagy. Autophagy. 2012;8:1462-1476
31. Kim I, Rodriguez-Enriquez S, Lemasters JJ. Selective degradation of mitochondria by mitophagy. Arch Biochem Biophys. 2007;462:245-253
32. Wong ES, Tan JM, Wang C, Zhang Z, Tay SP, Zaiden N, Ko HS, Dawson VL, Dawson TM, Lim KL. Relative sensitivity of parkin and other cysteine-containing enzymes to stress-induced solubility alterations. J Biol Chem. 2007;282:12310-12318
116
33. Winklhofer KF, Henn IH, Kay-Jackson PC, Heller U, Tatzelt J. Inactivation of parkin by oxidative stress and c-terminal truncations: A protective role of molecular chaperones. J Biol Chem. 2003;278:47199-47208
34. Razani B, Feng C, Coleman T, Emanuel R, Wen H, Hwang S, Ting JP, Virgin HW, Kastan MB, Semenkovich CF. Autophagy links inflammasomes to atherosclerotic progression. Cell Metab. 2012;15:534-544
35. Liao X, Sluimer JC, Wang Y, Subramanian M, Brown K, Pattison JS, Robbins J, Martinez J, Tabas I. Macrophage autophagy plays a protective role in advanced atherosclerosis. Cell Metab. 2012;15:545-553
36. Zhou R, Yazdi AS, Menu P, Tschopp J. A role for mitochondria in nlrp3 inflammasome activation. Nature. 2011;469:221-225
37. Shimada K, Crother TR, Karlin J, Dagvadorj J, Chiba N, Chen S, Ramanujan VK, Wolf AJ, Vergnes L, Ojcius DM, Rentsendorj A, Vargas M, Guerrero C, Wang Y, Fitzgerald KA, Underhill DM, Town T, Arditi M. Oxidized mitochondrial DNA activates the nlrp3 inflammasome during apoptosis. Immunity. 2012;36:401-414
38. Zinkevich NS, Gutterman DD. Ros-induced ros release in vascular biology: Redox-redox signaling. Am J Physiol Heart Circ Physiol. 2011;301:H647-653
39. Dikalov SI, Nazarewicz RR, Bikineyeva A, Hilenski L, Lassegue B, Griendling KK, Harrison DG, Dikalova AE. Nox2-induced production of mitochondrial superoxide in angiotensin ii-mediated endothelial oxidative stress and hypertension. Antioxid Redox Signal. 2013
40. Jornot L, Maechler P, Wollheim CB, Junod AF. Reactive oxygen metabolites increase mitochondrial calcium in endothelial cells: Implication of the ca2+/na+ exchanger. J Cell Sci. 1999;112 ( Pt 7):1013-1022
41. Ramachandran A, Levonen AL, Brookes PS, Ceaser E, Shiva S, Barone MC, Darley-Usmar V. Mitochondria, nitric oxide, and cardiovascular dysfunction. Free Radic Biol Med. 2002;33:1465-1474
42. Castillo EF, Dekonenko A, Arko-Mensah J, Mandell MA, Dupont N, Jiang S, Delgado-Vargas M, Timmins GS, Bhattacharya D, Yang H, Hutt J, Lyons CR, Dobos KM, Deretic V. Autophagy protects against active tuberculosis by suppressing bacterial burden and inflammation. Proc Natl Acad Sci U S A. 2012;109:E3168-3176
43. Ding Z, Liu S, Wang X, Khaidakov M, Dai Y, Mehta JL. Oxidant stress in mitochondrial DNA damage, autophagy and inflammation in atherosclerosis. Sci Rep. 2013;3:1077
44. Archer SL. Mitochondrial dynamics--mitochondrial fission and fusion in human diseases. N Engl J Med. 2013;369:2236-2251
45. Brooks C, Wei Q, Cho SG, Dong Z. Regulation of mitochondrial dynamics in acute kidney injury in cell culture and rodent models. J Clin Invest. 2009;119:1275-1285
46. Ong SB, Subrayan S, Lim SY, Yellon DM, Davidson SM, Hausenloy DJ. Inhibiting mitochondrial fission protects the heart against ischemia/reperfusion injury. Circulation. 2010;121:2012-2022
47. Schermuly RT, Ghofrani HA, Wilkins MR, Grimminger F. Mechanisms of disease: Pulmonary arterial hypertension. Nat Rev Cardiol. 2011;8:443-455
48. Zorzano A, Liesa M, Palacin M. Role of mitochondrial dynamics proteins in the pathophysiology of obesity and type 2 diabetes. Int J Biochem Cell Biol. 2009;41:1846-1854
49. Wang H, Song P, Du L, Tian W, Yue W, Liu M, Li D, Wang B, Zhu Y, Cao C, Zhou J, Chen Q. Parkin ubiquitinates drp1 for proteasome-dependent degradation: Implication of dysregulated mitochondrial dynamics in parkinson disease. J Biol Chem. 2011;286:11649-11658
50. Marsboom G, Toth PT, Ryan JJ, Hong Z, Wu X, Fang YH, Thenappan T, Piao L, Zhang HJ, Pogoriler J, Chen Y, Morrow E, Weir EK, Rehman J, Archer SL. Dynamin-related protein 1-mediated

117
mitochondrial mitotic fission permits hyperproliferation of vascular smooth muscle cells and offers a novel therapeutic target in pulmonary hypertension. Circ Res. 2012;110:1484-1497
51. Ryan JJ, Marsboom G, Fang YH, Toth PT, Morrow E, Luo N, Piao L, Hong Z, Ericson K, Zhang HJ, Han M, Haney CR, Chen CT, Sharp WW, Archer SL. Pgc1alpha-mediated mitofusin-2 deficiency in female rats and humans with pulmonary arterial hypertension. Am J Respir Crit Care Med. 2013;187:865-878
52. Chen KH, Guo X, Ma D, Guo Y, Li Q, Yang D, Li P, Qiu X, Wen S, Xiao RP, Tang J. Dysregulation of hsg triggers vascular proliferative disorders. Nat Cell Biol. 2004;6:872-883
53. Guo YH, Chen K, Gao W, Li Q, Chen L, Wang GS, Tang J. Overexpression of mitofusin 2 inhibited oxidized low-density lipoprotein induced vascular smooth muscle cell proliferation and reduced atherosclerotic lesion formation in rabbit. Biochem Biophys Res Commun. 2007;363:411-417
54. Shenouda SM, Widlansky ME, Chen K, Xu G, Holbrook M, Tabit CE, Hamburg NM, Frame AA, Caiano TL, Kluge MA, Duess MA, Levit A, Kim B, Hartman ML, Joseph L, Shirihai OS, Vita JA. Altered mitochondrial dynamics contributes to endothelial dysfunction in diabetes mellitus. Circulation. 2011;124:444-453
55. Esterbauer H, Schneitler C, Oberkofler H, Ebenbichler C, Paulweber B, Sandhofer F, Ladurner G, Hell E, Strosberg AD, Patsch JR, Krempler F, Patsch W. A common polymorphism in the promoter of ucp2 is associated with decreased risk of obesity in middle-aged humans. Nat Genet. 2001;28:178-183
56. Oberkofler H, Iglseder B, Klein K, Unger J, Haltmayer M, Krempler F, Paulweber B, Patsch W. Associations of the ucp2 gene locus with asymptomatic carotid atherosclerosis in middle-aged women. Arterioscler Thromb Vasc Biol. 2005;25:604-610
57. Krempler F, Esterbauer H, Weitgasser R, Ebenbichler C, Patsch JR, Miller K, Xie M, Linnemayr V, Oberkofler H, Patsch W. A functional polymorphism in the promoter of ucp2 enhances obesity risk but reduces type 2 diabetes risk in obese middle-aged humans. Diabetes. 2002;51:3331-3335
58. Dhamrait SS, Stephens JW, Cooper JA, Acharya J, Mani AR, Moore K, Miller GJ, Humphries SE, Hurel SJ, Montgomery HE. Cardiovascular risk in healthy men and markers of oxidative stress in diabetic men are associated with common variation in the gene for uncoupling protein 2. Eur Heart J. 2004;25:468-475
59. Moukdar F, Robidoux J, Lyght O, Pi J, Daniel KW, Collins S. Reduced antioxidant capacity and diet-induced atherosclerosis in uncoupling protein-2-deficient mice. J Lipid Res. 2009;50:59-70
60. Lee KU, Lee IK, Han J, Song DK, Kim YM, Song HS, Kim HS, Lee WJ, Koh EH, Song KH, Han SM, Kim MS, Park IS, Park JY. Effects of recombinant adenovirus-mediated uncoupling protein 2 overexpression on endothelial function and apoptosis. Circ Res. 2005;96:1200-1207
61. Tian XY, Wong WT, Xu A, Lu Y, Zhang Y, Wang L, Cheang WS, Wang Y, Yao X, Huang Y. Uncoupling protein-2 protects endothelial function in diet-induced obese mice. Circ Res. 2012;110:1211-1216
62. Ryu JW, Hong KH, Maeng JH, Kim JB, Ko J, Park JY, Lee KU, Hong MK, Park SW, Kim YH, Han KH. Overexpression of uncoupling protein 2 in thp1 monocytes inhibits beta2 integrin-mediated firm adhesion and transendothelial migration. Arterioscler Thromb Vasc Biol. 2004;24:864-870
63. Echtay KS, Roussel D, St-Pierre J, Jekabsons MB, Cadenas S, Stuart JA, Harper JA, Roebuck SJ, Morrison A, Pickering S, Clapham JC, Brand MD. Superoxide activates mitochondrial uncoupling proteins. Nature. 2002;415:96-99
64. Oka T, Hikoso S, Yamaguchi O, Taneike M, Takeda T, Tamai T, Oyabu J, Murakawa T, Nakayama H, Nishida K, Akira S, Yamamoto A, Komuro I, Otsu K. Mitochondrial DNA that escapes from autophagy causes inflammation and heart failure. Nature. 2012;485:251-255

118
65. Sun S, Sursal T, Adibnia Y, Zhao C, Zheng Y, Li H, Otterbein LE, Hauser CJ, Itagaki K. Mitochondrial damps increase endothelial permeability through neutrophil dependent and independent pathways. PLoS One. 2013;8:e59989
66. Duewell P, Kono H, Rayner KJ, Sirois CM, Vladimer G, Bauernfeind FG, Abela GS, Franchi L, Nunez G, Schnurr M, Espevik T, Lien E, Fitzgerald KA, Rock KL, Moore KJ, Wright SD, Hornung V, Latz E. Nlrp3 inflammasomes are required for atherogenesis and activated by cholesterol crystals. Nature. 2010;464:1357-1361
67. Sheedy FJ, Grebe A, Rayner KJ, Kalantari P, Ramkhelawon B, Carpenter SB, Becker CE, Ediriweera HN, Mullick AE, Golenbock DT, Stuart LM, Latz E, Fitzgerald KA, Moore KJ. Cd36 coordinates nlrp3 inflammasome activation by facilitating intracellular nucleation of soluble ligands into particulate ligands in sterile inflammation. Nat Immunol. 2013;14:812-820
68. Xiao H, Lu M, Lin TY, Chen Z, Chen G, Wang WC, Marin T, Shentu TP, Wen L, Gongol B, Sun W, Liang X, Chen J, Huang HD, Pedra JH, Johnson DA, Shyy JY. Sterol regulatory element binding protein 2 activation of nlrp3 inflammasome in endothelium mediates hemodynamic-induced atherosclerosis susceptibility. Circulation. 2013;128:632-642
69. Sobenin IA, Sazonova MA, Postnov AY, Bobryshev YV, Orekhov AN. Mitochondrial mutations are associated with atherosclerotic lesions in the human aorta. Clin Dev Immunol. 2012;2012:832464
70. Chien MC, Huang WT, Wang PW, Liou CW, Lin TK, Hsieh CJ, Weng SW. Role of mitochondrial DNA variants and copy number in diabetic atherogenesis. Genet Mol Res. 2012;11:3339-3348
71. Mercer JR, Cheng KK, Figg N, Gorenne I, Mahmoudi M, Griffin J, Vidal-Puig A, Logan A, Murphy MP, Bennett M. DNA damage links mitochondrial dysfunction to atherosclerosis and the metabolic syndrome. Circ Res. 2010;107:1021-1031
72. Yu E, Calvert PA, Mercer JR, Harrison J, Baker L, Figg NL, Kumar S, Wang JC, Hurst LA, Obaid DR, Logan A, West NE, Clarke MC, Vidal-Puig A, Murphy MP, Bennett MR. Mitochondrial DNA damage can promote atherosclerosis independently of reactive oxygen species through effects on smooth muscle cells and monocytes and correlates with higher-risk plaques in humans. Circulation. 2013;128:702-712
73. Ballinger SW, Patterson C, Yan CN, Doan R, Burow DL, Young CG, Yakes FM, Van Houten B, Ballinger CA, Freeman BA, Runge MS. Hydrogen peroxide- and peroxynitrite-induced mitochondrial DNA damage and dysfunction in vascular endothelial and smooth muscle cells. Circ Res. 2000;86:960-966
74. Esposti MD. Lipids, cardiolipin and apoptosis: A greasy licence to kill. Cell Death Differ. 2002;9:234-236
75. Beckmann JS, Ye YZ, Anderson PG, Chen J, Accavitti MA, Tarpey MM, White CR. Extensive nitration of protein tyrosines in human atherosclerosis detected by immunohistochemistry. Biol Chem Hoppe Seyler. 1994;375:81-88
76. Hazen SL, Heinecke JW. 3-chlorotyrosine, a specific marker of myeloperoxidase-catalyzed oxidation, is markedly elevated in low density lipoprotein isolated from human atherosclerotic intima. J Clin Invest. 1997;99:2075-2081
77. van der Loo B, Labugger R, Skepper JN, Bachschmid M, Kilo J, Powell JM, Palacios-Callender M, Erusalimsky JD, Quaschning T, Malinski T, Gygi D, Ullrich V, Luscher TF. Enhanced peroxynitrite formation is associated with vascular aging. J Exp Med. 2000;192:1731-1744
78. Davis CW, Hawkins BJ, Ramasamy S, Irrinki KM, Cameron BA, Islam K, Daswani VP, Doonan PJ, Manevich Y, Madesh M. Nitration of the mitochondrial complex i subunit ndufb8 elicits rip1- and rip3-mediated necrosis. Free Radic Biol Med. 2010;48:306-317

119
79. Li Y, Huang TT, Carlson EJ, Melov S, Ursell PC, Olson JL, Noble LJ, Yoshimura MP, Berger C, Chan PH, Wallace DC, Epstein CJ. Dilated cardiomyopathy and neonatal lethality in mutant mice lacking manganese superoxide dismutase. Nat Genet. 1995;11:376-381
80. Corral-Debrinski M, Shoffner JM, Lott MT, Wallace DC. Association of mitochondrial DNA damage with aging and coronary atherosclerotic heart disease. Mutat Res. 1992;275:169-180
81. Zhang H, Luo Y, Zhang W, He Y, Dai S, Zhang R, Huang Y, Bernatchez P, Giordano FJ, Shadel G, Sessa WC, Min W. Endothelial-specific expression of mitochondrial thioredoxin improves endothelial cell function and reduces atherosclerotic lesions. Am J Pathol. 2007;170:1108-1120
82. Madamanchi NR, Runge MS. Mitochondrial dysfunction in atherosclerosis. Circ Res. 2007;100:460-473
83. Madamanchi NR, Zhou RH, Vendrov AE, Niu XL, Runge MS. Does oxidative DNA damage cause atherosclerosis and metabolic syndrome?: New insights into which came first: The chicken or the egg. Circ Res. 2010;107:940-942
84. Blanc J, Alves-Guerra MC, Esposito B, Rousset S, Gourdy P, Ricquier D, Tedgui A, Miroux B, Mallat Z. Protective role of uncoupling protein 2 in atherosclerosis. Circulation. 2003;107:388-390
85. Dai DF, Johnson SC, Villarin JJ, Chin MT, Nieves-Cintron M, Chen T, Marcinek DJ, Dorn GW, 2nd, Kang YJ, Prolla TA, Santana LF, Rabinovitch PS. Mitochondrial oxidative stress mediates angiotensin ii-induced cardiac hypertrophy and galphaq overexpression-induced heart failure. Circ Res. 2011;108:837-846
86. Seimon TA, Wang Y, Han S, Senokuchi T, Schrijvers DM, Kuriakose G, Tall AR, Tabas IA. Macrophage deficiency of p38alpha mapk promotes apoptosis and plaque necrosis in advanced atherosclerotic lesions in mice. J Clin Invest. 2009;119:886-898
87. Cook AD, Braine EL, Hamilton JA. The phenotype of inflammatory macrophages is stimulus dependent: Implications for the nature of the inflammatory response. J Immunol. 2003;171:4816-4823
88. Potteaux S, Gautier EL, Hutchison SB, van Rooijen N, Rader DJ, Thomas MJ, Sorci-Thomas MG, Randolph GJ. Suppressed monocyte recruitment drives macrophage removal from atherosclerotic plaques of apoe-/- mice during disease regression. J Clin Invest. 2011;121:2025-2036
89. Lim WS, Timmins JM, Seimon TA, Sadler A, Kolodgie FD, Virmani R, Tabas I. Signal transducer and activator of transcription-1 is critical for apoptosis in macrophages subjected to endoplasmic reticulum stress in vitro and in advanced atherosclerotic lesions in vivo. Circulation. 2008;117:940-951
90. Wu LL, Chiou CC, Chang PY, Wu JT. Urinary 8-ohdg: A marker of oxidative stress to DNA and a risk factor for cancer, atherosclerosis and diabetics. Clin Chim Acta. 2004;339:1-9
91. Valavanidis A, Vlachogianni T, Fiotakis C. 8-hydroxy-2' -deoxyguanosine (8-ohdg): A critical biomarker of oxidative stress and carcinogenesis. J Environ Sci Health C Environ Carcinog Ecotoxicol Rev. 2009;27:120-139
92. Ma Y, Wang W, Zhang J, Lu Y, Wu W, Yan H, Wang Y. Hyperlipidemia and atherosclerotic lesion development in ldlr-deficient mice on a long-term high-fat diet. PLoS One. 2012;7:e35835
93. Clausen BE, Burkhardt C, Reith W, Renkawitz R, Forster I. Conditional gene targeting in macrophages and granulocytes using lysmcre mice. Transgenic Res. 1999;8:265-277
94. Subramanian M, Thorp E, Hansson GK, Tabas I. Treg-mediated suppression of atherosclerosis requires myd88 signaling in dcs. J Clin Invest. 2013;123:179-188
95. Moore KJ, Tabas I. Macrophages in the pathogenesis of atherosclerosis. Cell. 2011;145:341-355 96. van Gils JM, Derby MC, Fernandes LR, Ramkhelawon B, Ray TD, Rayner KJ, Parathath S, Distel E,
Feig JL, Alvarez-Leite JI, Rayner AJ, McDonald TO, O'Brien KD, Stuart LM, Fisher EA, Lacy-Hulbert

120
A, Moore KJ. The neuroimmune guidance cue netrin-1 promotes atherosclerosis by inhibiting the emigration of macrophages from plaques. Nat Immunol. 2012;13:136-143
97. Trogan E, Feig JE, Dogan S, Rothblat GH, Angeli V, Tacke F, Randolph GJ, Fisher EA. Gene expression changes in foam cells and the role of chemokine receptor ccr7 during atherosclerosis regression in apoe-deficient mice. Proc Natl Acad Sci U S A. 2006;103:3781-3786
98. Tacke F, Alvarez D, Kaplan TJ, Jakubzick C, Spanbroek R, Llodra J, Garin A, Liu J, Mack M, van Rooijen N, Lira SA, Habenicht AJ, Randolph GJ. Monocyte subsets differentially employ ccr2, ccr5, and cx3cr1 to accumulate within atherosclerotic plaques. J Clin Invest. 2007;117:185-194
99. Swirski FK, Libby P, Aikawa E, Alcaide P, Luscinskas FW, Weissleder R, Pittet MJ. Ly-6chi monocytes dominate hypercholesterolemia-associated monocytosis and give rise to macrophages in atheromata. J Clin Invest. 2007;117:195-205
100. Gu L, Okada Y, Clinton SK, Gerard C, Sukhova GK, Libby P, Rollins BJ. Absence of monocyte chemoattractant protein-1 reduces atherosclerosis in low density lipoprotein receptor-deficient mice. Mol Cell. 1998;2:275-281
101. Boring L, Gosling J, Cleary M, Charo IF. Decreased lesion formation in ccr2-/- mice reveals a role for chemokines in the initiation of atherosclerosis. Nature. 1998;394:894-897
102. Yang F, Tang E, Guan K, Wang CY. Ikk beta plays an essential role in the phosphorylation of rela/p65 on serine 536 induced by lipopolysaccharide. J Immunol. 2003;170:5630-5635
103. Chen LF, Williams SA, Mu Y, Nakano H, Duerr JM, Buckbinder L, Greene WC. Nf-kappab rela phosphorylation regulates rela acetylation. Mol Cell Biol. 2005;25:7966-7975
104. Gusdon AM, Chen J, Votyakova TV, Mathews CE. Chapter 24 quantification, localization, and tissue specificities of mouse mitochondrial reactive oxygen species production. Methods Enzymol. 2009;456:439-457
105. Bergmark C, Dewan A, Orsoni A, Merki E, Miller ER, Shin MJ, Binder CJ, Horkko S, Krauss RM, Chapman MJ, Witztum JL, Tsimikas S. A novel function of lipoprotein [a] as a preferential carrier of oxidized phospholipids in human plasma. J Lipid Res. 2008;49:2230-2239
106. Gargalovic PS, Gharavi NM, Clark MJ, Pagnon J, Yang WP, He A, Truong A, Baruch-Oren T, Berliner JA, Kirchgessner TG, Lusis AJ. The unfolded protein response is an important regulator of inflammatory genes in endothelial cells. Arterioscler Thromb Vasc Biol. 2006;26:2490-2496
107. Seimon TA, Nadolski MJ, Liao X, Magallon J, Nguyen M, Feric NT, Koschinsky ML, Harkewicz R, Witztum JL, Tsimikas S, Golenbock D, Moore KJ, Tabas I. Atherogenic lipids and lipoproteins trigger cd36-tlr2-dependent apoptosis in macrophages undergoing endoplasmic reticulum stress. Cell Metab. 2010;12:467-482
108. Myoishi M, Hao H, Minamino T, Watanabe K, Nishihira K, Hatakeyama K, Asada Y, Okada K, Ishibashi-Ueda H, Gabbiani G, Bochaton-Piallat ML, Mochizuki N, Kitakaze M. Increased endoplasmic reticulum stress in atherosclerotic plaques associated with acute coronary syndrome. Circulation. 2007;116:1226-1233
109. Tobias PS, Curtiss LK. Toll-like receptors in atherosclerosis. Biochem Soc Trans. 2007;35:1453-1455
110. Steinberg D, Witztum JL. Oxidized low-density lipoprotein and atherosclerosis. Arterioscler Thromb Vasc Biol. 2010;30:2311-2316
111. Miller YI, Viriyakosol S, Worrall DS, Boullier A, Butler S, Witztum JL. Toll-like receptor 4-dependent and -independent cytokine secretion induced by minimally oxidized low-density lipoprotein in macrophages. Arterioscler Thromb Vasc Biol. 2005;25:1213-1219
112. Kanters E, Pasparakis M, Gijbels MJ, Vergouwe MN, Partouns-Hendriks I, Fijneman RJ, Clausen BE, Forster I, Kockx MM, Rajewsky K, Kraal G, Hofker MH, de Winther MP. Inhibition of nf-kappab activation in macrophages increases atherosclerosis in ldl receptor-deficient mice. J Clin Invest. 2003;112:1176-1185

121
113. Goossens P, Vergouwe MN, Gijbels MJ, Curfs DM, van Woezik JH, Hoeksema MA, Xanthoulea S, Leenen PJ, Rupec RA, Hofker MH, de Winther MP. Myeloid ikappabalpha deficiency promotes atherogenesis by enhancing leukocyte recruitment to the plaques. PLoS One. 2011;6:e22327
114. Bulua AC, Simon A, Maddipati R, Pelletier M, Park H, Kim KY, Sack MN, Kastner DL, Siegel RM. Mitochondrial reactive oxygen species promote production of proinflammatory cytokines and are elevated in tnfr1-associated periodic syndrome (traps). J Exp Med. 2011;208:519-533
115. v21282379Bylund J, MacDonald KL, Brown KL, Mydel P, Collins LV, Hancock RE, Speert DP. Enhanced inflammatory responses of chronic granulomatous disease leukocytes involve ros-independent activation of nf-kappa b. Eur J Immunol. 2007;37:1087-1096
116. Macritchie N, Grassia G, Sabir SR, Maddaluno M, Welsh P, Sattar N, Ialenti A, Kurowska-Stolarska M, McInnes IB, Brewer JM, Garside P, Maffia P. Plasmacytoid dendritic cells play a key role in promoting atherosclerosis in apolipoprotein e-deficient mice. Arterioscler Thromb Vasc Biol. 2012;32:2569-2579
117. Doring Y, Manthey HD, Drechsler M, Lievens D, Megens RT, Soehnlein O, Busch M, Manca M, Koenen RR, Pelisek J, Daemen MJ, Lutgens E, Zenke M, Binder CJ, Weber C, Zernecke A. Auto-antigenic protein-DNA complexes stimulate plasmacytoid dendritic cells to promote atherosclerosis. Circulation. 2012;125:1673-1683
118. Perry HM, Bender TP, McNamara CA. B cell subsets in atherosclerosis. Front Immunol. 2012;3:373
119. Kinkade K, Streeter J, Miller FJ. Inhibition of nadph oxidase by apocynin attenuates progression of atherosclerosis. Int J Mol Sci. 2013;14:17017-17028
120. Judkins CP, Diep H, Broughton BR, Mast AE, Hooker EU, Miller AA, Selemidis S, Dusting GJ, Sobey CG, Drummond GR. Direct evidence of a role for nox2 in superoxide production, reduced nitric oxide bioavailability, and early atherosclerotic plaque formation in apoe-/- mice. Am J Physiol Heart Circ Physiol. 2010;298:H24-32
121. Serbina NV, Pamer EG. Monocyte emigration from bone marrow during bacterial infection requires signals mediated by chemokine receptor ccr2. Nat Immunol. 2006;7:311-317
122. Charo IF, Taubman MB. Chemokines in the pathogenesis of vascular disease. Circ Res. 2004;95:858-866
123. Lu B, Rutledge BJ, Gu L, Fiorillo J, Lukacs NW, Kunkel SL, North R, Gerard C, Rollins BJ. Abnormalities in monocyte recruitment and cytokine expression in monocyte chemoattractant protein 1-deficient mice. J Exp Med. 1998;187:601-608
124. Kuziel WA, Morgan SJ, Dawson TC, Griffin S, Smithies O, Ley K, Maeda N. Severe reduction in leukocyte adhesion and monocyte extravasation in mice deficient in cc chemokine receptor 2. Proc Natl Acad Sci U S A. 1997;94:12053-12058
125. Huo Y, Weber C, Forlow SB, Sperandio M, Thatte J, Mack M, Jung S, Littman DR, Ley K. The chemokine kc, but not monocyte chemoattractant protein-1, triggers monocyte arrest on early atherosclerotic endothelium. J Clin Invest. 2001;108:1307-1314
126. Bursill CA, Castro ML, Beattie DT, Nakhla S, van der Vorst E, Heather AK, Barter PJ, Rye KA. High-density lipoproteins suppress chemokines and chemokine receptors in vitro and in vivo. Arterioscler Thromb Vasc Biol. 2010;30:1773-1778
127. 20702809v 20702809Drechsler M, Megens RT, van Zandvoort M, Weber C, Soehnlein O. Hyperlipidemia-triggered neutrophilia promotes early atherosclerosis. Circulation. 2010;122:1837-1845
128. Zamara E, Galastri S, Aleffi S, Petrai I, Aragno M, Mastrocola R, Novo E, Bertolani C, Milani S, Vizzutti F, Vercelli A, Pinzani M, Laffi G, LaVilla G, Parola M, Marra F. Prevention of severe toxic liver injury and oxidative stress in mcp-1-deficient mice. J Hepatol. 2007;46:230-238

122
129. Sung FL, Zhu TY, Au-Yeung KK, Siow YL, O K. Enhanced mcp-1 expression during ischemia/reperfusion injury is mediated by oxidative stress and nf-kappab. Kidney Int. 2002;62:1160-1170
130. Suzuki M, Tsujikawa M, Itabe H, Du ZJ, Xie P, Matsumura N, Fu X, Zhang R, Sonoda KH, Egashira K, Hazen SL, Kamei M. Chronic photo-oxidative stress and subsequent mcp-1 activation as causative factors for age-related macular degeneration. J Cell Sci. 2012;125:2407-2415
131. Park JG, Yoo JY, Jeong SJ, Choi JH, Lee MR, Lee MN, Hwa Lee J, Kim HC, Jo H, Yu DY, Kang SW, Rhee SG, Lee MH, Oh GT. Peroxiredoxin 2 deficiency exacerbates atherosclerosis in apolipoprotein e-deficient mice. Circ Res. 2011;109:739-749
132. Gloire G, Legrand-Poels S, Piette J. Nf-kappab activation by reactive oxygen species: Fifteen years later. Biochem Pharmacol. 2006;72:1493-1505
133. Hildebrand DG, Alexander E, Horber S, Lehle S, Obermayer K, Munck NA, Rothfuss O, Frick JS, Morimatsu M, Schmitz I, Roth J, Ehrchen JM, Essmann F, Schulze-Osthoff K. Ikappabzeta is a transcriptional key regulator of ccl2/mcp-1. J Immunol. 2013;190:4812-4820
134. Gloire G, Charlier E, Rahmouni S, Volanti C, Chariot A, Erneux C, Piette J. Restoration of ship-1 activity in human leukemic cells modifies nf-kappab activation pathway and cellular survival upon oxidative stress. Oncogene. 2006;25:5485-5494
135. Williams KJ, Fisher EA. Oxidation, lipoproteins, and atherosclerosis: Which is wrong, the antioxidants or the theory? Curr Opin Clin Nutr Metab Care. 2005;8:139-146
136. Mercer JR, Yu E, Figg N, Cheng KK, Prime TA, Griffin JL, Masoodi M, Vidal-Puig A, Murphy MP, Bennett MR. The mitochondria-targeted antioxidant mitoq decreases features of the metabolic syndrome in atm+/-/apoe-/- mice. Free Radic Biol Med. 2012;52:841-849
137. Guo X, Chen KH, Guo Y, Liao H, Tang J, Xiao RP. Mitofusin 2 triggers vascular smooth muscle cell apoptosis via mitochondrial death pathway. Circ Res. 2007;101:1113-1122
138. Taguchi N, Ishihara N, Jofuku A, Oka T, Mihara K. Mitotic phosphorylation of dynamin-related gtpase drp1 participates in mitochondrial fission. J Biol Chem. 2007;282:11521-11529
139. Dagda RK, Cherra SJ, 3rd, Kulich SM, Tandon A, Park D, Chu CT. Loss of pink1 function promotes mitophagy through effects on oxidative stress and mitochondrial fission. J Biol Chem. 2009;284:13843-13855
140. Park D, Han CZ, Elliott MR, Kinchen JM, Trampont PC, Das S, Collins S, Lysiak JJ, Hoehn KL, Ravichandran KS. Continued clearance of apoptotic cells critically depends on the phagocyte ucp2 protein. Nature. 2011;477:220-224
141. Ishihara N, Nomura M, Jofuku A, Kato H, Suzuki SO, Masuda K, Otera H, Nakanishi Y, Nonaka I, Goto Y, Taguchi N, Morinaga H, Maeda M, Takayanagi R, Yokota S, Mihara K. Mitochondrial fission factor drp1 is essential for embryonic development and synapse formation in mice. Nat Cell Biol. 2009;11:958-966
142. Ehses S, Raschke I, Mancuso G, Bernacchia A, Geimer S, Tondera D, Martinou JC, Westermann B, Rugarli EI, Langer T. Regulation of opa1 processing and mitochondrial fusion by m-aaa protease isoenzymes and oma1. J Cell Biol. 2009;187:1023-1036
143. Ishihara N, Fujita Y, Oka T, Mihara K. Regulation of mitochondrial morphology through proteolytic cleavage of opa1. EMBO J. 2006;25:2966-2977
144. Thorp E, Cui D, Schrijvers DM, Kuriakose G, Tabas I. Mertk receptor mutation reduces efferocytosis efficiency and promotes apoptotic cell accumulation and plaque necrosis in atherosclerotic lesions of apoe-/- mice. Arterioscler Thromb Vasc Biol. 2008;28:1421-1428
145. Loson OC, Song Z, Chen H, Chan DC. Fis1, mff, mid49, and mid51 mediate drp1 recruitment in mitochondrial fission. Mol Biol Cell. 2013;24:659-667
146. Li S, Sun Y, Liang CP, Thorp EB, Han S, Jehle AW, Saraswathi V, Pridgen B, Kanter JE, Li R, Welch CL, Hasty AH, Bornfeldt KE, Breslow JL, Tabas I, Tall AR. Defective phagocytosis of apoptotic cells

123
by macrophages in atherosclerotic lesions of ob/ob mice and reversal by a fish oil diet. Circ Res. 2009;105:1072-1082
147. Ait-Oufella H, Pouresmail V, Simon T, Blanc-Brude O, Kinugawa K, Merval R, Offenstadt G, Leseche G, Cohen PL, Tedgui A, Mallat Z. Defective mer receptor tyrosine kinase signaling in bone marrow cells promotes apoptotic cell accumulation and accelerates atherosclerosis. Arterioscler Thromb Vasc Biol. 2008;28:1429-1431
148. Rousset S, Mozo J, Dujardin G, Emre Y, Masscheleyn S, Ricquier D, Cassard-Doulcier AM. Ucp2 is a mitochondrial transporter with an unusual very short half-life. FEBS Lett. 2007;581:479-482