Embed Size (px)
Citation preview

University of Central Florida University of Central Florida
STARS STARS
Electronic Theses and Dissertations, 2004-2019
2018
Role of Single Nucleotide Polymorphisms (SNPs) in PTPN2/22 Role of Single Nucleotide Polymorphisms (SNPs) in PTPN2/22
and Mycobacterium Avium Subspecies Paratuberculosis (MAP) in and Mycobacterium Avium Subspecies Paratuberculosis (MAP) in
Rheumatoid Arthritis and Crohn's Disease Rheumatoid Arthritis and Crohn's Disease
Robert Sharp University of Central Florida
Part of the Biotechnology Commons
Find similar works at: https://stars.library.ucf.edu/etd
University of Central Florida Libraries http://library.ucf.edu
This Doctoral Dissertation (Open Access) is brought to you for free and open access by STARS. It has been accepted
for inclusion in Electronic Theses and Dissertations, 2004-2019 by an authorized administrator of STARS. For more
information, please contact [email protected].
STARS Citation STARS Citation Sharp, Robert, "Role of Single Nucleotide Polymorphisms (SNPs) in PTPN2/22 and Mycobacterium Avium Subspecies Paratuberculosis (MAP) in Rheumatoid Arthritis and Crohn's Disease" (2018). Electronic Theses and Dissertations, 2004-2019. 6225. https://stars.library.ucf.edu/etd/6225

ROLE OF SINGLE NUCLEOTIDE POLYMORPHISMS (SNPS) IN PTPN2/22 AND
MYCOBACTERIUM AVIUM SUBSPECIES PARATUBERCULOSIS (MAP) IN RHEUMATOID
ARTHRITIS AND CROHN’S DISEASE
by:
ROBERT C. SHARP
B.S. University of Central Florida, 2013
M.S. University of Central Florida, 2014
A dissertation submitted in partial fulfillment of the requirements
for the degree of Doctor of Philosophy in Biomedical Sciences
in the Burnett School of Biomedical Sciences
in the College of Medicine
at the University of Central Florida
Orlando, Florida
Fall Term
2018
Major Professor: Saleh A. Naser

ii
© 2018 Robert C. Sharp

iii
ABSTRACT
Both genetic pre-disposition and potential environmental triggers are shared between
Rheumatoid arthritis (RA) and Crohn’s disease (CD). We hypothesized that single nucleotide
polymorphisms (SNPs) in the negative T-cell regulators Protein Tyrosine Phosphatase Non-
receptor type 2 and 22 (PTPN2/22) lead to a dysregulated immune response as seen in RA and
CD. To test the hypothesis, peripheral leukocytes samples from 204 consented subjects were
TaqMan genotyped for 9 SNPs in PTPN2/22. The SNPs effect on PTPN2/22 and IFN-y
expression was determined using RT-PCR. Blood samples were analyzed for the Mycobacterium
avium subspecies paratuberculosis (MAP) IS900 gene by nPCR. T-cell proliferation and
response to phytohematoagglutonin (PHA) mitogen and MAP cell lysate were determined by
BrdU proliferation assay. Out of 9 SNPs, SNP alleles of PTPN2:rs478582 occurred in 79% RA
compared to 60% control (p-values ≤ 0.05). SNP alleles of PTPN22:rs2476601 occurred in 29%
RA compared to 6% control (p-values ≤ 0.05). For the haplotype combination of
PTPN2:rs478582/PTPN22rs2476601, 21.4% RA had both SNPs (C-A) compared to 2.4%
control (p-values ≤ 0.05). PTPN2/22 expression in RA was decreased by an average of 1.2 fold.
PTPN2:rs478582 upregulated IFN-y in RA by an average of 1.5 fold. Combined
PTPN2:rs478582/PTPN22:rs2476601 increased T-cell proliferation by an average of 2.7 fold
when treated with PHA. MAP DNA was detected in 34% RA compared to 8% controls (p-values
≤ 0.05), where samples with PTPN2:rs478582 and/or PTPN22:rs2476601 were more MAP
positive. PTPN2:rs478582/PTPN22:rs2476601 together with MAP infection significantly
increased T-cell response and IFN-y expression in RA samples. The same experimental approach
was followed on blood samples from CD patients. Both PTPN2:rs478582/PTPN22:rs2476601

iv
affected PTPN2/22 and IFN-y expression along with T-cell proliferation significantly more than
in RA. MAP DNA was detected in 64% of CD. This is the first study to report the correlation
between SNPs in PTPN2/22, IFN-y expression and MAP in autoimmune disease.

v
This is dedicated to all my family and friends who have supported me throughout my entire life.
Without you all, I would be nothing. Thank you.

vi
ACKNOWLEDGMENTS
I would like to thank my dad Bob Sharp for being a great role model of how a man should act,
my mom Lissa Sharp for being so loving and supportive throughout my life, and Carson Sharp
who is not only a great brother, but also a great friend. I would also like to thank my
grandparents Nanny and Pa for their support throughout my entire college career and showing
their love and support. I would like to thank my extended family and friends for their continued
support throughout my life and keeping me on the right path. I also would like to thank Christine
Vazquez for being there for me for both the good and the bad of my graduate career. You are the
love of my life and the fire that keeps me motivated to continue to be a hard worker.
I also would like to thank Dr. Saleh Naser for being a wonderful mentor and showing me how to
be a great scientist, but more so, a great person. His wisdom and kindness has helped me open
doors to new opportunities that I would never thought was imaginable. Thank you for turning
this redneck into a full-blown scientist.
I also would like to thank my dissertation committee of Dr. Griff Parks, Dr. Dinender Singla, Dr.
Herve Roy and Dr. Shazia Beg. Additional thanks goes to Dr. Shazia Beg for being an integral
part of our projects and for providing patient samples to us.
Lastly, I would like to thank both the Florida Legislative Grant for funding our projects and both
the University of Central Florida and the Burnett School of Biomedical Sciences’ Rudy J.
Wodzinski Scholarship for funding me personally.
vii
TABLE OF CONTENTS
LIST OF FIGURES ...................................................................................................................... xii
LIST OF TABLES ....................................................................................................................... xiv
LIST OF ACRONYMS/ABBREVIATIONS ............................................................................... xv
CHAPTER ONE: INTRODUCTION ............................................................................................. 1
Autoimmune Diseases ................................................................................................................ 1
Crohn’s Disease (CD) ............................................................................................................. 1
Rheumatoid Arthritis (RA) ..................................................................................................... 2
Common Genes Associated with Autoimmune Diseases ....................................................... 3
Genetic Variations of PTPN2/22 ................................................................................................ 4
PTPN2 Role in Autoimmune Diseases ................................................................................... 4
PTPN22 Role in Autoimmune Diseases ................................................................................. 9
PTPN2/22 and Environmental Triggers in Autoimmune Diseases .......................................... 12
SNPs and Environmental Triggers Associated with Autoimmune Diseases ........................ 12
SNPs in PTPN2/22 and Infections in Autoimmune Disease ................................................ 13
Figures....................................................................................................................................... 16
References ................................................................................................................................. 18

viii
CHAPTER TWO: POLYMORPHISMS IN PROTEIN TYROSINE PHOSPHATASE NON-
RECEPTOR TYPE 2 AND 22 (PTPN2/22) ARE LINKED TO HYPER-PROLIFERATIVE T-
CELLS AND SUSCEPTIBILITY TO MYCOBACTERIA IN RHEUMATOID ARTHRITIS .... 27
Introduction ............................................................................................................................... 27
Materials and Methods .............................................................................................................. 30
Clinical Samples ................................................................................................................... 30
Detection of MAP IS900 DNA in Peripheral Leukocytes .................................................... 35
PTPN2/22 Genotyping .......................................................................................................... 36
PTPN2/22 and IFN-γ Gene Expression ................................................................................ 37
Isolation of Peripheral Lymphocytes and Proliferation Assay ............................................. 39
Statistical Analysis ................................................................................................................ 41
Results ....................................................................................................................................... 41
Mycobacterium avium subspecies paratuberculosis IS900 DNA Detected in RA Frequency
of SNP Alleles in PTPN2/22 in RA ...................................................................................... 41
Frequency of SNP Alleles in PTPN2/22 in RA .................................................................... 42
Effect of PTPN2:rs478582 and PTPN22:rs2476601 on PTPN2/22 Expression .................. 43
Effect of PTPN2:rs478582 and PTPN22:rs2476601 on T-cell Response ............................ 46
Effect of PTPN2:rs478582 and PTPN22:rs2476601 on IFN-γ Expression .......................... 48
Effect of PTPN22:rs478582 and PTPN22:rs2476601 on Susceptibility to MAP Expression
............................................................................................................................................... 49

ix
Effect of Combined PTPN2:rs478582, PTPN22:rs2476601, and MAP on PTPN2/22
Expression ............................................................................................................................. 50
Effect of Combined PTPN2:rs478582, PTPN22:rs2476601, and MAP on IFN-γ Expression
............................................................................................................................................... 53
Effect of Medication to Susceptibility to MAPbacteremia ................................................... 54
Discussion ................................................................................................................................. 54
Figures....................................................................................................................................... 60
References ................................................................................................................................. 69
CHAPTER THREE: ROLE OF PTPN2/22 POLYMORPHISMS IN PATHOPHYSIOLOGY OF
CROHN’S DISEASE.................................................................................................................... 74
Introduction ............................................................................................................................... 74
Materials and Methods .............................................................................................................. 75
Clinical Samples ................................................................................................................... 75
PTPN2/22 Genotyping .......................................................................................................... 80
PTPN2/22 and IFN-γ Gene Expression ................................................................................ 80
Detection of MAP IS900 DNA ............................................................................................. 82
T-cell Isolation and Proliferation Assay ............................................................................... 84
Statistical Analysis ................................................................................................................ 85
Results ....................................................................................................................................... 85
PTPN2/22 SNP Allele Frequency in CD .............................................................................. 85

x
Relationship of PTPN2:rs478582 and PTPN22:rs2476601 on Expression on PTPN2/22 and
IFN-γ in CD .......................................................................................................................... 87
Effect of PTPN2:rs478582 and PTPN22:rs2476601 on Susceptibility of MAP Infection in
CD ......................................................................................................................................... 89
Relationship of Combined MAP Presence with PTPN2:rs478582 and PTPN22:rs2476601
on Expression of PTPN2/22 and IFN-γ in CD...................................................................... 92
T-cell Proliferation Response in CD ..................................................................................... 93
Discussion ................................................................................................................................. 94
Figures....................................................................................................................................... 99
References ............................................................................................................................... 105
CHAPTER FOUR: MULTIPLEX PCR AND FLUORESCENT IN SITU HYBRIDIZATION
(FISH) COUPLED PROTOCOL FOR DETECTION OF PATHOGENS INVOLVED IN
INFLAMMATORY BOWEL DISEASE PATHOGENESIS .................................................... 110
Introduction ............................................................................................................................. 110
Materials and Methods ............................................................................................................ 111
Bacterial Cultures................................................................................................................ 111
Intestinal Tissue .................................................................................................................. 113
DNA Extraction .................................................................................................................. 113
Validation of DNAzol® Extraction Method by MAP IS900 nPCR ................................... 115
Development of Multiplex PCR ......................................................................................... 119

xi
Development of Fluorescent in situ Hybridization (FISH) for Imaging for Gut Bacteria .. 120
Results ..................................................................................................................................... 122
Specificity and Sensitivity between DNAzol® and Phenol/Chloroform/Isoamyl-Alcohol
DNA Extraction Protocols .................................................................................................. 122
Multiplex PCR on Bacterial Species and IBD Patient Biopsy Samples ............................. 123
FISH Procedure on Bacterial Species and IBD Patient Biopsy Samples ........................... 126
Detection of Both Non-Pathogenic E.coli and MAP Coinfection in CD Patient Biopsy
Samples Using FISH ........................................................................................................... 127
Discussion ............................................................................................................................... 127
Figures..................................................................................................................................... 131
References ............................................................................................................................... 141
CHAPTER FIVE: CONCLUSION/FUTURE DIRECTIONS ................................................... 145
Figures..................................................................................................................................... 147
References ............................................................................................................................... 149
APPENDIX: CONSENTS FOR PUBLICATIONS ................................................................... 151

xii
LIST OF FIGURES
Figure 1. Single Nucleotide Polymorphisms (SNPs) in Protein Tyrosine Phosphatase Non-
Receptor Type 2 and 22 (PTPN2/22) and Mycobacterium avium subspecies paratuberculosis
(MAP) Interaction in Autoimmune Disease ................................................................................. 16
Figure 2. Effect of SNPs in PTPN2/22 on T-cell Response ......................................................... 60
Figure 3. Detection of Mycobacterium avium subspecies paratuberculosis (MAP) in blood
samples from RA .......................................................................................................................... 61
Figure 4. Genotyping of 9 SNPs in PTPN2/22 in RA .................................................................. 62
Figure 5. T-cell Response in RA Associated with PTPN2:rs478582 and PTPN22:rs2476601 ... 64
Figure 6. Effect of PTPN2:rs478582/PTPN22:rs2476601 on IFN-γ Expression in RA .............. 66
Figure 7. Effect of PTPN2:rs478582 and PTPN22:rs2476601 on Susceptibility to MAP Infection
....................................................................................................................................................... 67
Figure 8. Combined Effect of MAP and PTPN2:rs478582 on IFN-γ Expression in RA. ............ 68
Figure 9. Shared Genetic Predispositions and Environmental Triggers between Common
Autoimmune Diseases .................................................................................................................. 99
Figure 10. Allele Frequency in Nine Single Nucleotide Polymorphisms in Crohn’s Disease and
Healthy Control Subjects ............................................................................................................ 100
Figure 11. Relative mRNA Expression (2(-∆CT) × 1000) of PTPN2, PTPN22 and IFN-γ ........... 102
Figure 12. The Effect of Both Mycobacterium avium subspecies paratuberculosis and
PTPN2:rs478582 on IFN-γ Gene Expression in Crohn’s Disease and Healthy Control Subjects
..................................................................................................................................................... 103
Figure 13. Complex Interaction of Crohn’s Disease Pathophysiology ...................................... 104
xiii
Figure 14. Comparison of Specificity and Sensitivity of IS900 nPCR between DNAzol® and
Phenol/Chloroform/Isoamyl-Alcohol DNA Extraction Protocols .............................................. 131
Figure 15. Multiplex PCR for Bacterial Positive Controls ......................................................... 133
Figure 16. Multiplex PCR for IBD Patient Biopsy Samples ...................................................... 134
Figure 17. Gram Stain, Acid-Fast Stain and FISH for Bacterial Cultures .................................. 135
Figure 18. Detection of Bacterial Species via FISH in IBD Patient Biopsy Samples ................ 137
Figure 19. Detection of Multiple Bacterial Species via FISH in CD Patient Biopsy Samples ... 139
Figure 20. Role of Polyamines in Humans ................................................................................. 147
Figure 21. Potential Use of Polyamines in Autoimmune Disease Patients ................................ 148

xiv
LIST OF TABLES
Table 1. Demographics, Treatment History, and Results of MAP and Allele Frequency of
rs478582/rs2476601 in RA Samples Used in Study .................................................................... 31
Table 2. List of SNPs in PTPN2/22 Examined in this Study........................................................ 37
Table 3. Effect of PTPN2:rs478582 and PTPN22:rs2476601 on PTPN2/22 Expression ........... 44
Table 4. Effect of Combined PTPN2:rs478582 and MAP Presence on PTPN2 Expression ....... 51
Table 5. Effect of Combined PTPN22:rs2476601 and MAP Presence on PTPN22 Expression . 52
Table 6. Demographics and Results of MAP Presence and Frequency of
PTPN2:rs478582/PTPN22:rs2476601 in CD Subjects ................................................................ 77
Table 7. MAP IS900 nPCR Presence and Correlation with PTPN2:rs478582/PTPN22:rs2476601
in Clinical Subjects ....................................................................................................................... 90
Table 8. Bacteria Cultures Used in Study ................................................................................... 112
Table 9. Nucleotide Primers Used in IS900 nPCR, Multiplex PCR and FISH Probes............... 116
Table 10. Multiplex PCR and FISH Results for IBD Patient Samples ....................................... 125

xv
LIST OF ACRONYMS/ABBREVIATIONS
AIEC: Adherent-Invasive Escherichia coli
Anti-CCP: Anti-Cyclic Citrullinated Proteins
ATG12: Autophagy-related protein 12
ATG16L1: Autophagy-related protein 16-1
ATG5: Autophagy-related protein 5
ATG7: Autophagy-related protein 7
BAX: Bcl-2-Associated X protein
BCL-2: B-cell Lymphoma Two Protein Family
BLAST: Basic Local Alignment Search Tool
BrdU: Bromodeoxyuridine
CCR6: Chemokine Receptor 6
CD: Crohn’s Disease
CD40: Cluster of Differentiation 40
CFU: Colony Forming Units
CSLM: Confocal Scanning Laser Microscopy
CTLA4: Cytotoxic T-Lymphocyte-Associated Protein 4
DMARDs: Disease-Modifying Anti-Rheumatic Drugs
EDTA: Ethylenediaminetetraacetic Acid
ESR: Erythrocyte Sedimentation Rate
FISH: Fluorescent in situ Hybridization
GAD65: Glutamic Acid Decarboxylase 65 kDa

xvi
GWAS: Genome-Wide Association Studies
HLA: Human Leukocyte Antigen
HLA-DRB1: HLA class II histocompatibility antigen, DRB1 beta chain
HSP65: Heat Shock Protein 65 kDa
IBD: Inflammatory Bowel Disease
ICAM-1: Intercellular Adhesion Molecule 1
IFN-α: Interferon Alpha
IFN-β: Interferon Beta
IFN-γ: Interferon Gamma
IL-1: Interleukin 1
IL-17: Interleukin 17
IL-2: Interleukin 2
IL-2: Interleukin 2
IL-23: Interleukin 23
IL23R: Interleukin-23 Receptor
IL-6: Interleukin 6
IL-8: Interleukin 8
IRF5: Interferon Regulatory Factor 5
IRGM: Immunity-Related GTPase family M protein
IS900: Insertion Sequence 900
JAK-STAT: Janus Kinases-Signal Transducer and Activator of Transcription protein
JNK: c-Jun N-terminal Kinases
K. pneumonaie: Klebsiella pneumoniae

xvii
L. monocytogenes: Listeria monocytogenes
LB Broth: Luria Broth
M. avium: Mycobacterium avium subspecies avium
M. fortuitum: Mycobacterium fortuitum subspecies fortuitum
M. smegmatis: Mycobacterium smegmatis
M. tuberculosis: Mycobacterium tuberculosis
M. xenopi: Mycobacterium xenopi
MAC: Mycobacterium avium complex
MAP: Mycobacterium avium subspecies paratuberculosis
MCP1: Monocyte Chemoattractant Protein 1
Multiplex PCR: Multiplex Polymerase Chain Reaction
NOD2: Nucleotide-binding Oligomerization Domain-containing protein 2
nPCR: Nested PCR
NSAIDs: Non-Steroid Anti-Inflammatory Drugs
OR: Odds Ratio
P. gingivalis: Porphyromonas ginivalis
P. mirablis: Proteus mirablis
PBS: Phosphate Buffer Saline
PFA: Paraformaldehyde
PHA: Phytohematoagglutunin
PPD-Like: Purified Protein Derivative-Like
PTP1B: Protein-Tyrosine Phosphatase 1B
PTPN2: Protein Tyrosine Phosphatase Non-receptor type 2

xviii
PTPN22: Protein Tyrosine Phosphatase Non-receptor type 22
PTPs: Protein Tyrosine Phosphatases
RA: Rheumatoid Arthritis
RF: Rheumatoid Factor
RPMI: Roswell Park Memorial Institute Medium
RT-PCR: Real Time PCR
S.aureus: Staphylococcus aureus
SDS: Sodium Dodecyl Sulfate
SNPs: Single Nucleotide Polymorphisms
STAT1: Signal Transducer and Activator of Transcription protein 1
STAT3: Signal Transducer and Activator of Transcription protein 3
T1D: Type 1 Diabetes
TE: Tris-EDTA
TLR: Toll-Like Receptor
TNF-α: Tumor Necrosis Factor Alpha
TRAF1: TNF Receptor-Associated Factor 1
UC: Ulcerative Colitis
UCF4: University of Central Florida 4
1
CHAPTER ONE: INTRODUCTION
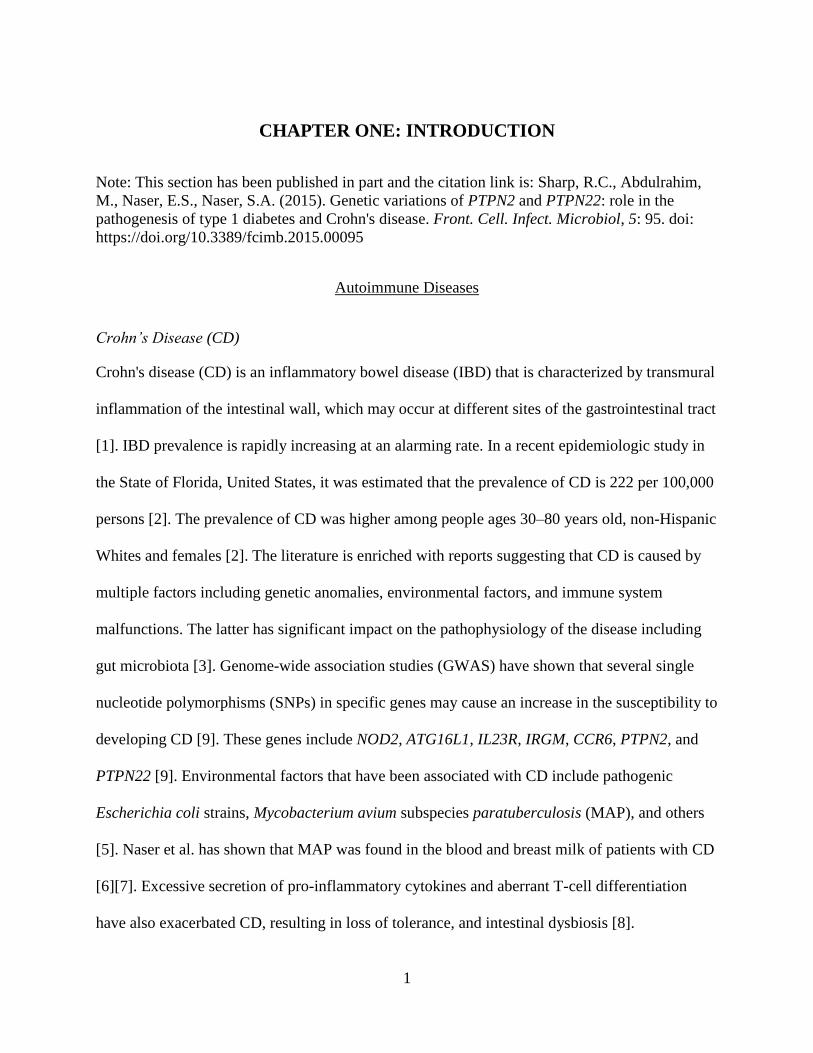
Note: This section has been published in part and the citation link is: Sharp, R.C., Abdulrahim,
M., Naser, E.S., Naser, S.A. (2015). Genetic variations of PTPN2 and PTPN22: role in the
pathogenesis of type 1 diabetes and Crohn's disease. Front. Cell. Infect. Microbiol, 5: 95. doi:
https://doi.org/10.3389/fcimb.2015.00095
Autoimmune Diseases
Crohn’s Disease (CD)
Crohn's disease (CD) is an inflammatory bowel disease (IBD) that is characterized by transmural
inflammation of the intestinal wall, which may occur at different sites of the gastrointestinal tract
[1]. IBD prevalence is rapidly increasing at an alarming rate. In a recent epidemiologic study in
the State of Florida, United States, it was estimated that the prevalence of CD is 222 per 100,000
persons [2]. The prevalence of CD was higher among people ages 30–80 years old, non-Hispanic
Whites and females [2]. The literature is enriched with reports suggesting that CD is caused by
multiple factors including genetic anomalies, environmental factors, and immune system
malfunctions. The latter has significant impact on the pathophysiology of the disease including
gut microbiota [3]. Genome-wide association studies (GWAS) have shown that several single
nucleotide polymorphisms (SNPs) in specific genes may cause an increase in the susceptibility to
developing CD [9]. These genes include NOD2, ATG16L1, IL23R, IRGM, CCR6, PTPN2, and
PTPN22 [9]. Environmental factors that have been associated with CD include pathogenic
Escherichia coli strains, Mycobacterium avium subspecies paratuberculosis (MAP), and others
[5]. Naser et al. has shown that MAP was found in the blood and breast milk of patients with CD
[6][7]. Excessive secretion of pro-inflammatory cytokines and aberrant T-cell differentiation
have also exacerbated CD, resulting in loss of tolerance, and intestinal dysbiosis [8].

2
Rheumatoid Arthritis (RA)
Rheumatoid arthritis (RA) is a deliberating autoimmune disease that affects synovial joints of
individuals, where an increase of inflammation that leads to cartilage damage and bone erosion
occurs [9]. The prevalence of RA in the United States alone is estimated to be at 1.36 million
adults, where it continues to rise each year [10]. Diagnosis of RA begins with examination of the
effected joints on the body and then with a serological blood test that examine autoantibodies
such as rheumatoid factor (RF) and anti-cyclic citrullinated proteins (anti-CCP) [9][11].
As with other autoimmune diseases, such as type 1 diabetes (T1D) and CD, RA is multifactorial
autoimmune diseases that has both genetic predisposition and environmental triggers. When
examining GWAS, there are many SNPs that have been associated with RA including HLA
genes, such has HLA-DRB1 and non-HLA genes, such as CD40, PTPN2, and PTPN22
[12][13][14]. Environmental elements along with these genetic mutations have also been
examined in RA. Both chemical pressures, such as smoking tobacco or drinking alcohol, and
biological pressures, such as viral and bacterial infections, have been linked to RA [15][16].
When examining biological triggers for RA, some of the viruses and bacterial species that have
been associated with this disease include Rubella virus, Porphyromonas gingivalis, and
Mycobacterium species [16]. Both the genetic factors and the environmental triggers together in
RA patients will lead to an excess production of pro-inflammatory cytokines, such as TNF-α, IL-
6, and IFN-γ [17]. This excess amount of pro-inflammatory cytokines will lead to the intense
inflammation and overall destruction of the joints in RA patients [17].

3
Common Genes Associated with Autoimmune Diseases
GWAS have identified many genes to be involved in the development of autoimmune diseases
such as T1D, CD, and RA. Most often, the mutation is due to a SNP resulting in immune system
impairment and ultimately increased susceptibility to disease. The potential role of some of these
genetic mutations have been examined in previous studies, but the mechanisms by which these
mutated genes play a role in autoimmune diseases is still unclear and requires further research.
Recently, two possible candidate genes that are involved with T1D, CD, and RA have been
examined. These genes are PTPN2 (protein tyrosine phosphatase non-receptor type 2) and
PTPN22 (protein tyrosine phosphatase non-receptor type 22) [1][4][12][13][18][19][20][21].
PTPN2/22 genes both encode for protein tyrosine phosphatases (PTPs) signaling molecules that
modulate and regulate a variety of cellular processes such as cell growth, differentiation, mitotic
cycle, oncogenic transformation, and survival [22][23]. Studies have shown that PTPs in general
are key regulators of signaling transduction. Most cells of the immune system show high
expression of tyrosine phosphorylation and express more PTP genes than other tissues in the
body. In fact, a distinct phenotype exists among PTP-knockout mice having deficient or
hyperactive immune status with severe abnormalities in hematopoiesis. This suggests a crucial
role of PTP in maintaining a balanced immune system [23]. Predisposing variants in these genes
can potentially lead to a less efficient suppression of inflammatory response due to a reduced
amount of negative regulation, which may contribute to autoimmune diseases.

4
Genetic Variations of PTPN2/22
PTPN2 Role in Autoimmune Diseases
The PTPN2 gene is located on chromosome 18 and is a member of the PTP family, which
dephosphorylates receptor protein tyrosine residues and regulates many signaling pathways and
processes [20]. The protein has two major isoforms—one in the endoplasmic reticulum (48 kD)
and the other in the nucleus (45 kD) [20]. PTPN2 is produced by alternative splicing and share a
highly conserved PTP catalytic domain but different C-terminus [20]. PTPN2 expression plays
an important role in regulating signal transduction and it is of pivotal importance to the
pathogenesis of many autoimmune diseases.
The involvement of the PTPN2 gene in autoimmune diseases is complex due to its ubiquitous
expression which may play a role in tissue cell apoptosis [24]. This modulation occurs after
exposure to type I (IFN-α and IFN-β) and type II interferon (IFN-γ), which leads to destruction
of a variety of tissue cells including beta cells, intestinal tissues, and synovial joints [24][25][26].
Moreover, studies indicated that local IFN production interacts with PTPN2 expression and
induces a malfunctioning pro-apoptotic activity of Bim, a BH3-only protein [24][25][26]. Bim is
a member of the B-cell lymphoma two protein family (Bcl-2) that mediates apoptosis by
activating Bax and Bak. This ultimately results in an increase of cell death via JNK activation
and intrinsic apoptotic pathways [24]. PTPN2 is a negative regulator of the JAK-STAT signaling
pathway, which is activated downstream by IFN receptors [24][25][26]. Studies have shown that
the PTPN2 gene knockdown exacerbates type I and II IFN-induced cell death by inducing BAX
translocation to the mitochondria after subsequent exposure to type I and II IFNs [24][25][26].
This occurs because when PTPN2 is mutated or knockdown, there is less of a negative regulation

5
of apoptotic processes, thus, increasing the signaling of the destruction of cells. Along with these
reactions, there is an increase of Bim phosphorylation, which is regulated by JNK1 that also
induces apoptosis of the tissue cells.
Recently, the role of PTPN2 in chemokine producing cells, such as pancreatic beta cells, have
shown to control endocrine function and insulin secretion. In a study by Xi et al. the deficiency
in PTPN2 expression by knockout affected beta cell function in mice [27]. The reduced insulin
secretion was associated with a decreased insulin content and glucose sensing, which showed
that STAT3 could be a relevant target for the PTPN2 phosphatase regulation in the pancreas
[27]. PTPN2 regulates insulin signaling by inactivating its receptor through de-phosphorylation
of the insulin receptor β-chain in conjunction with the PTP1B phosphatase. This regulates
gluconeogenesis in the liver by attenuating STAT3 signaling, which decreases glucose levels
[20][28]. A deficiency of PTPN2 expression will lead to a cytokine-induced beta cell apoptosis
of the pancreatic cells after inducing the mitochondrial apoptotic pathway along with impacting
glucose homeostasis/utilization [24][28]. With these two systems out of control, T1D could
occur in patients who have a mutation in the PTPN2 gene. This evidence shows that adequate
PTPN2 expression is required for STAT dimer regulation during chemokine production in
various cell types.
With the help of CD4+ helper T cells, CD8+ cytotoxic T-cells are the primary mediators of cell
destruction via secretory (perforin/granzyme) or Fas mediated pathways. Wiede et al. showed
that a variant in PTPN2 (rs1893217) in mice greatly increases T cell receptor signaling, which
can lead to reduced self-antigen tolerance due to decreased negative regulation [29]. With this

6
occurring, the response after self-antigen presentation could cause destruction of a variety of cell
types [29]. Moreover, the risk variant rs1893217 in the PTPN2 gene is associated with a
reduction in the receptor signaling of IL-2, which alters expression of FOXP3+ T regulatory cells
(Tregs) in autoimmune disease patients [20]. Tregs are a group of T-cells that modulate the
immune system homeostasis by maintaining tolerance to self-antigens. They also prevent
autoimmune diseases by acting as suppressors to the immune response. This dysregulation of
FOXP3+ Tregs leads to both T-cells and B-cells being unregulated due to FOXP3+ Treg cells
suppressing their activation [20]. With these altered FOXP3+ Tregs, over reactivity of both T-
cells and B-cells could cause self-antigens to be recognized as foreign [20]. It explains how
genetic variations in PTPN2 could lead to the development of autoimmunity due to the
deregulation of Tregs homeostasis [20].
When examining the effect of PTPN2 in cell regulation, the epithelial barrier of CD patients is a
good model to look into. It is a fact that epithelial barrier dysfunction coincides with immune
response dysregulation in CD, where PTPN2 regulates intestinal epithelial barrier function and is
activated by IFN-γ which is up regulated by TNF-α in intestinal epithelial cells
(IEC)[25][30][31]. IFN-γ is an effector cytokine for Th-1 and potentially Th17-propagated
immune responses [25][31]. Scharl et al. showed that PTPN2 gets activated by IFN-γ and in turn,
it limits the pro-inflammatory cytokine-induced signaling and barrier defects [3]. IFN-γ plays a
role in CD pathogenesis and is noted to increase the permeability of intestinal epithelial barrier
[3]. IFN-γ is involved in tissue destruction and possibly, in reduction of barrier functions as a
result of reconfigured tight junctions [3]. PTPN2 usually protects the barrier by reducing its
permeability and prevent induction of pore forming protein claudin-2 [3]. Claudin-2 is part of a

7
family of proteins that regulates paracellular permeability and functions as sealer-like in tight
junctions [3]. Expressions or localization changes in claudins result in increased barrier
permeability [3]. Recent study showed that claudin-2 upregulation in CD increased number of
tight junction strand breakages [25]. PTPN2 expression plays a role in the regulation of
inflammatory response, as loss of it leads to a severe IFN-γ signaling cascade, leading to
problems in the intestinal epithelial barrier function [3][25]. PTPN2 has an important role in
cytokine signaling of immune cells by inactivating STAT1 and STAT3; where the loss of PTPN2
gene expression enhances STAT phosphorylation [3]. This evidence shows the importance in
how a mutation altering function of the PTPN2 gene could lead to deleterious effects and may
explain the pathogenesis of associated diseases.
Loss of PTPN2 expression is associated with increased expression and secretion of pro-
inflammatory cytokines [1][3][31][32]. As previously stated, there is an aberrant T-cell
differentiation and tissue cell destruction in autoimmune diseases, which PTPN2 seems to play a
role in. It is very important to regulate T helper (Th)-cell differentiation into effector T-cell
populations to maintain tolerance toward self-antigens. There is a potential role of the PTPN2
protein in regulating differentiation of CD4+ Th-cells into its subset population. A loss of the
PTPN2 protein in T-cells results in a disease promoting state. Loss of PTPN2 in T-cell
compartments leads to enhanced induction of Th1 and Th17 cells while having an impaired
induction of regulatory T-cells [31]. In several mouse models as shown by Spalinger et al.,
increased inflammation occurred as a result of high numbers of Th1 and Th17 cells due to the
loss of the PTPN2 protein function, where higher amounts of pro-inflammatory cytokine
production was examined [31].

8
PTPN2 also plays a role in autophagosome formation in tissue cells. Autophagy is an essential
process for maintaining cell homeostasis, survival, and modulating inflammation. Studies have
shown that knockdown of PTPN2 caused impaired autophagosome formation and dysfunctional
autophagy resulting in response to TNF-α and IFN-γ [19][32][33][34]. Moreover, silencing
PTPN2 in vitro exacerbates intestinal epithelial barrier dysfunction when exposed to IFN-γ [33].
Impairment in this gene shows that the pathway that leads to the perpetual tissue inflammation is
associated with autoimmune diseases. Loss of PTPN2 expression can also lead to an increase in
cytokine-induced mTOR phosphorylation, which leads to a decrease in autophagy
[19][32][33][34]. It was reported that PTPN2 deficiency leads to a reduction of expression of
autophagy genes that include: beclin 1, ATG7, ATG5, ATG12 conjugates, and ATG16L1
[20][32][33][34]. Consequently, this leads to low amounts of autophagy proteins that create an
abnormal autophagosome in the intestinal cells [25].
PTPN2 expression is very important in immune regulation as can be noted with PTPN2 deficient
mice that suffer severe inflammation and die swiftly after birth. A balance between inflammatory
and regulatory T-cells should be maintained for optimal tolerance and protection against
pathogens. The mutation in PTPN2 could not only cause T1D, CD, or RA, but could also have
comorbidity with each other due to the presence of this mutation in both disease states. With this
unregulated immune system due to the loss of PTPN2 function, cytokines that play a role in
inflammation are substantially increased, and T-cells/B-cells begin to react to self-antigens.
These changes will affect major tissue areas of the body, such as pancreatic beta cells, intestinal

9
tissues, or synovial joints, of these genetically susceptible patients and lead to T1D, CD, and/or
RA.
PTPN22 Role in Autoimmune Diseases
The PTPN22 gene is located on chromosome 1p13, which is a member of the PTPs that
negatively regulate T-cell activation [20]. The encoded protein is a lymphoid specific
intracellular phosphatase that associates with the molecular adapter protein CBL [20]. PTPN22
has alternatively spliced transcript variants encoding several distinct isoforms [20]. It is located
in the cytoplasm, and consists of an N-terminal phosphatase domain and a long non-catalytic C
terminal with several proline rich motifs [20]. PTPN22 dephosphorylates kinases Lck, Fyn, and
ZAP70, which are all involved in T-cell signaling [20]. A SNP mutation (rs2476601) in PTPN22
is associated with autoimmune diseases [4][18][35]. Variants within these genes lead to the
development of an abnormal immune response [4][18][35]. The PTPN22 rs2476601 SNP causes
a single substitution of arginine for tryptophan in the encoded protein (R620W) leading to
problems in T-cell receptor and B-cell receptor signaling [36]. This may ultimately result in an
unbalanced establishment of tolerance in both T-cells and B-cells [36].
In B-cells, PTPN22 SNPs prevent the removal of developing auto-reactive B-cells [36]. Menard
et al. showed that new mature naive B-cells from carriers of this variant had higher frequencies
of auto-reactive clones as opposed to non-carriers [36]. This demonstrates defective central and
peripheral B-cell tolerance checkpoints leading to the development of the previously mentioned
auto-reactive B-cells. To be noted, there are essentially two methods to removing autoreactive B-
cells. First, a central tolerance checkpoint is done to remove most of the developing B-cells

10
expressing polyreactive antibodies in the bone marrow [37]. Second, a peripheral tolerance
checkpoint is done in order to counter select autoreactive new B-cells before entering
compartments designed for mature naive B-cell [37]. This shows that a single risk allele would
have a dominant effect of changing auto-reactive B-cell counter-selection before onset of any
autoimmunity. Menard et al. also performed gene array experiments on mature naive B-cells
with the risk variant and found an upregulation of genes such as CD40, TRAF1, and IRF5 [36].
These genes encode proteins promoting B-cell activation and are susceptibility genes of many
deregulated immune diseases [36]. They concluded that the association of the PTPN22 gene with
autoimmunity is due to impaired removal of auto-reactive B-cells and the upregulation of the
genes mentioned above [36].
In T-cells, PTPN22 is directly involved in threshold setting for T-cell receptor signaling [38].
Recent studies on PTPN22 knockout mice suggested that the increase risk of developing
autoimmune diseases could occur through alterations of the periphery Treg cells while PTPN22
knockout increases the thymic selection of Treg cells [39]. Both Wu et al. and Zheng et al.
reported a “gain-of-function” model of Treg cell selection, where even though PTPN22 knockout
did have reduced TCR signaling, they did not have an impairment of their ability to negatively
select autoreactive T-cells in the thymus [40][41]. Overall, this shows that the PTPN22 SNP does
not necessarily affect Treg cells, but could possibly affect other T-cells once they leave out of the
thymus or even have other effects on the immune system. With the “loss-of-function” model, it
shows that if PTPN22 is knocked out or mutated, then there is a loss of self-tolerance earlier on
in the T-cell life, which can then be activated by self-antigens. This also leads to a higher
amounts of T-cell activity and pro-inflammatory cytokine production due to loss of negative

11
regulation. Even though the role of PTPN22 mutation is still debatable, both models (“gain-of-
function”) and (“loss-of-function”) can still play a role in the development of autoimmune
diseases.
PTPN22 expression could potentially influence immuno-receptors, which could explain how it
contributes to the development of diseases. Immuno-receptor signaling is governed by Src and
Syk kinases, which are substrates of the PTPN22 protein [42]. A function of PTPN22 is to
downregulate T-cell signaling by interacting with its negative regulatory kinase, C-terminal Src
tyrosine kinase or Csk. A mutation of the PTPN22 gene ends up encoding products with different
Csk binding affinities [42]. The R620W (rs2476601) substitution in PTPN22 decreases the
ability of the phosphatase to bind to the SH3 domain of Csk, thus, showing how PTPN22
expression is associated with T-cell signaling pathways [42]. This can be used as a marker for
disease progression by the noted appearance of autoantibodies and increased pro-inflammatory
cytokine levels when examining autoimmune diseases [20][35].
When examining the PTPN22 rs2476601 SNP in CD, for example, the alteration in PTPN22
expression levels and its dysfunction can have deleterious effects depending on the mechanism
involved [4]. Normally, the intestinal immune system is usually tightly controlled by an existing
balance of pro-inflammatory and anti-inflammatory cytokines. Patients suffering from IBD have
a disturbed balance with more pro-inflammatory cytokines present. CD have a reduced
expression of PTPN22 in intestinal tissues [32][34]. Spalinger et al. showed that PTPN22
expression regulates intracellular signaling as induced by IFN-γ in human monocytes [32].
Studies have shown that knocking down the PTPN22 gene alters the activation of inflammatory

12
signal transducers and increases the secretion of Th17-related inflammatory mediators [32]. By
this mechanism, genetic variants may induce pathogenesis of CD by prompting Th17 vs Th1
differentiation [32]. Spalinger et al. also found that the loss of PTPN22 protein function results in
increased p38-MAPK but reduces STAT1 and STAT3 signaling [32]. This leads to increase
levels of IL-6 and IL-17 secretion, and decrease expression and secretion of T-bet, ICAM-1,
MCP-1, IL-2, IL-8, and IL-12p40 [32]. The reduced PTPN22 levels contribute to increased
levels of IL-6 found in CD [32]. Also, p38 activation and IL-6 secretion by antigen presenting
cells play a huge role in differentiation of CD4+ T cells into Th17 cells, which induces CD
pathogenesis [32]. The mechanism behind how PTPN22 genetic variants are associated with CD
is an example on what happens in other autoimmune pathogenesis as well.
PTPN22 plays an important role in cytokine secretion balance, which is crucial for activation and
regulation of the immune system [32]. Mutations of PTPN22 not only will lead to cytokine
imbalance, but it can also lead to T-cells and B-cells losing their ability to recognize self-
antigens from foreign antigens. These imbalances can lead to the destruction of tissues, which
can lead to autoimmune diseases like T1D, CD, and RA.
PTPN2/22 and Environmental Triggers in Autoimmune Diseases
SNPs and Environmental Triggers Associated with Autoimmune Diseases
Although autoimmune diseases have always been established to be associated with genetic
mutations in specific immunoregulatory genes, recent literature has shown that certain
environmental triggers (chemical, bacterial, or viral) have also been investigated to be involved
in the pathophysiology of these diseases. The interplay between genetic mutations and

13
environmental triggers is a topic of research in autoimmune etiology that is beginning to become
more relevant in the field [43][44][45][46][47][48]. For CD patients, SNPs found in NOD2 have
shown to increase susceptibility to bacterial infections [44][45]. The prevalence of an increase of
SNPs found in HLA genes together with smoking tobacco has been found more so in RA patients
than other autoimmune diseases as well [46][47]. Overall, the literature shows that when SNPs
are involved in these autoimmune diseases, there appears to be some connection to an
environmental trigger that goes with the pathophysiology of the diseases. This proposes the
hypothesis that genetic factors and an environmental trigger need to be present together to
produce an autoimmune response.
SNPs in PTPN2/22 and Infections in Autoimmune Disease
When examining SNPs in PTPN2/22 along with environmental triggers in autoimmune disease,
it is shown that these two factors could be related to each other [24][25][48][49]. SNPs in
PTPN2/22 have shown to possibly increase the susceptibility and the impact of viral and
bacterial infections in T1D, CD, and RA [24][25][48][49]. This is due to the dysregulation of the
immune system, where the viral and bacterial infections exacerbate inflammation
[24][25][48][49]. For example, loss of function or poor activity of PTPN2/22 has shown to
increase type 1 and type 2 IFN production, which leads to higher amounts of apoptosis in beta
cells, intestinal tissues, and synovial joints [24][25][48][49]. With a viral or bacterial infection in
these genetically susceptible individuals, this should significantly increase IFN production, thus
further advancing the apoptotic processes in the specific tissue areas [24][25][48][49].

14
When examining T1D, CD, and RA, it is shown that infections with Mycobacterium species
could be associated with the pathophysiology of these diseases [6][7][47]. However, correlation
between SNPs in PTPN2/22 and mycobacterial infection have not been fully established. In this
dissertation, exploration of SNPs in PTPN2/22 along with mycobacterial infection is investigated
in autoimmune disease patient samples. We hypothesized that SNPs in PTPN2/22 lead to a
dysregulated immune response, susceptibility to environmental triggers, and continued apoptosis
as seen in chronic inflammation in autoimmune disease patients.
Our hypothesis is based on our earlier finding as shown in Figure 1 that since SNPs in PTPN2/22
are proposed to cause an increase of pro-inflammatory cytokines, there will be a higher
activation of both CD4+ helper T-cells and CD8+ cytotoxic T-cells
[20][29][32][36][38][40][41]. With this higher levels of pro-inflammatory cytokines, there will
be a higher increase of cellular death of macrophages from CD8+ cytotoxic T-cells and a higher
amount of macrophage activation from CD4+ helper T-cells [50][51][52][53]. Since MAP can
avoid phagosome-lysosome fusion and can survive in the macrophages, higher amounts of
macrophage activation from overactive CD4+ helper T-cells will lead to a higher chance of MAP
to thrive in the macrophages [54][55][56]. Moreover, overactive CD8+ cytotoxic T-cells will
increase overall cell death in MAP infected macrophages, thus releasing the MAP bacterium that
survive the apoptosis or necrosis process in the macrophages [54][55][56]. Overall, chronic
inflammation and destruction of tissue cells in autoimmune diseases could potentially occur due
to the increase of overactive T-cells and increased tissue apoptosis by both SNPs in PTPN2/22
and the constant cycle of MAP infecting macrophages (Figure 1).

15
The second part of this dissertation will be focused on confirmation that MAP is found more
readily in CD patients than in other IBD groups, such as ulcerative colitis (UC). There have been
many different pathogenic bacterial infections that have been associated with IBD including not
only MAP, but also Klebsiella pneumoniae (K. pneumoniae) and pathogenic adherent-invasive
Escherichia coli (AIEC) [5][6][7][57][58][59]. The hypothesis proposed is that MAP is found in
the CD patients more so than the other bacterial pathogens examined, where MAP should not be
found in the UC patients. To elucidate this hypothesis, a development of a multiplex polymerase
chain reaction (multiplex PCR) and a fluorescent in situ hybridization (FISH) visualization
method was designed to examine the presence of MAP, K. pneumoniae, and AIEC together in
one clinical sample.

16
Figures
Figure 1. Single Nucleotide Polymorphisms (SNPs) in Protein Tyrosine Phosphatase Non-Receptor Type 2 and 22
(PTPN2/22) and Mycobacterium avium subspecies paratuberculosis (MAP) Interaction in Autoimmune Disease

17
The proposed hypothesis suggests that when SNPs in PTPN2/22 is present along with a MAP infection, chronic inflammation
occurs leading to autoimmune diseases such as type 1 diabetes (T1D), Crohn’s disease (CD), and rheumatoid arthritis (RA). SNPs
in PTPN2/22 will make CD8 + cytotoxic and CD4+ helper T-cells overactive, thus producing high amounts of pro-inflammatory
cytokines. These cytokines will activate more macrophages and induce more cell destruction in infected macrophages. MAP
infection exacerbates the disease since MAP survives in the macrophage and able to re-infect new macrophages, thus causing
more pro-inflammatory cytokines production, more inflammation and worsening the disease.

18
References
[1]. Scharl, M., Mwinyi, J., Fischbeck, A., Leucht, K., Eloranta, J. J., Arikkat, J., et al. (2012a).
Crohn's disease-associated polymorphism within the PTPN2 gene affects muramyl-dipeptide-
induced cytokine secretion and autophagy. Inflamm. Bowel Dis. 18, 900–912. doi:
10.1002/ibd.21913
[2]. Francois, M. R. (2006). Final Report of the Epidemiologic Study of Crohn's Disease and
Ulcerative Colitis. Bureau of Epidemiology, Florida Department of Health.
[3]. Scharl, M., Paul, G., Weber, A., Jung, B. C., Docherty, M. J., Hausmann, M., et al. (2009).
Protection of epithelial barrier function by the Crohn's disease associated gene protein tyrosine
phosphatase n2. Gastroenterology 137, 2030–2040. e2035. doi: 10.1053/j.gastro.2009.07.078
[4]. Barrett, J. C., Hansoul, S., Nicolae, D. L., Cho, J. H., Duerr, R. H., Rioux, J. D., et al. (2008).
Genome-wide association defines more than 30 distinct susceptibility loci for Crohn's disease.
Nat. Genet. 40, 955–962. doi: 10.1038/ng.175
[5]. Nazareth, N., Magro, F., Machado, E., Ribeiro, T. G., Martinho, A., Rodrigues, P., et al.
(2015). Prevalence of Mycobacterium avium subsp. paratuberculosis and Escherichia coli in
blood samples from patients with inflammatory bowel disease. Med. Microbiol. Immunol. 204,
681–692. doi: 10.1007/s00430-015-0420-3
[6]. Naser, S. A., Ghobrial, G., Romero, C., and Valentine, J. F. (2004). Culture of
Mycobacterium avium subspecies paratuberculosis from the blood of patients with Crohn's
disease. Lancet 364, 1039–1044. doi: 10.1016/S0140-6736(04)17058-X

19
[7]. Naser, S. A., Schwartz, D., and Shafran, I. (2000). Isolation of Mycobacterium avium subsp
paratuberculosis from breast milk of Crohn's disease patients. Am. J. Gastroenterol. 95, 1094–
1095. doi: 10.1111/j.1572-0241.2000.01954.x
[8]. Sartor, R. B. (2006). Mechanisms of disease: pathogenesis of Crohn's disease and ulcerative
colitis. Nat. Clin. Pract. Gastroenterol. Hepatol. 3, 390–407. doi: 10.1038/ncpgasthep0528
[9]. McInnes, I.B. and Schett, G. (2011). The pathogenesis of rheumatoid arthritis. N Engl J Med
2011, 365: 2205-2219. doi: 10.1056/NEJMra1004965
[10]. Hunter, T.M., Boytsov, N.N., Zhang, X., Schroeder, K., Michaud, K., and Araujo, A.B.
(2017). Prevalence of rheumatoid arthritis in the United States adult population in healthcare
claims databases, 2004-2014. Rheumatology International, 37:1551-1557. doi: 10.1007/s00296-
017-3726-1
[11]. Song, Y.W. and Kang, E.H. (2009). Autoantibodies in rheumatoid arthritis: rheumatoid
factors and anticitrullinated protein antibodies. QJM: An International Journal of Medicine, 103:
139-146. doi: http://doi.org/10.1093/qjmed/hcp165
[12]. Stahl, E.A., Raychaudhuri, S., Remmers, E.F., Xie, G., Eyre, S., Thomson, B.P., et. al.
(2010). Genome-wide association study meta-analysis identifies seven new rheumatoid arthritis
risk loci. Nature Genetics, 42: 508-514. doi: 10.1038/ng.582
[13]. Thompson, S.D., Sudman, M., Ramos, P.S., Marion, M.C., Ryan, M., Tsoras, M., et. al.
(2010). The susceptibility loci juvenile idiopathic arthritis shares with other autoimmune diseases
extend to PTPN2, COG6, and ANGPT1. Arthritis & Rheumatism, 62: 3265-3276. doi:
10.1002/art.27688

20
[14]. Eyre, S., Bowes, J., Diogo,D., Lee Annette, Barton, A., Martin, P., et. al. (2012). High-
density genetic mapping identifies new susceptibility loci for rheumatoid arthritis. Nature
Genetics, 44: 1336-1340. doi: 10.1038/ng.2462
[15]. Liao, K.P., Alfredsson, L., and Karlson, E.W. (2010). Environmental influences on risk for
rheumatoid arthritis. Curr. Opin. Rheumatol., 21: 279-283. doi:
10.1097/BOR.0b013e32832a2e16
[16]. Tobon, G.J., Youinou, P., Saraux, A. (2010). The environment, geo-epidemiology, and
autoimmune disease: rheumatoid arthritis. Autoimmunity Reviews, 9: A288-A292. doi:
https://doi.org/10.1016/j.autrev.2009.11.019
[17]. Brennan, F.M. and McInnes, I.B. (2008). Evidence that cytokines play a role in rheumatoid
arthritis. Journal of Clinical Investigation, 118: 3537-3545
[18]. Burn, G. L., Svensson, L., Sanchez-Blanco, C., Saini, M., and Cope, A. P. (2011). Why is
PTPN22 a good candidate susceptibility gene for autoimmune disease? FEBS Lett. 585, 3689–
3698. doi: 10.1016/j.febslet.2011.04.032
[19]. Scharl, M., and Rogler, G. (2012). The role for protein tyrosine phosphatase nonreceptor
type 2 in regulating autophagosome formation. Ann. N. Y. Acad. Sci. 1257: 93–102. doi:
10.1111/j.1749-6632.2012.06578.x
[20]. Cerosaletti, K., and Buckner, J. H. (2012). Protein tyrosine phosphatases and type 1
diabetes: genetic and functional implications of PTPN2 and PTPN22. Rev. Diabet. Stud. 9, 188–
200. doi: 10.1900/RDS.2012.9.188
[21]. Espino-Paisan, L., de la Calle, H., Fernández-Arquero, M., Figueredo, M. A., de la Concha,
E. G., Urcelay, E., et al. (2011). A polymorphism in PTPN2 gene is associated with an earlier
onset of type 1 diabetes. Immunogenetics, 63: 255–258. doi: 10.1007/s00251-010-0500-x

21
[22]. Estus, J. L., and Family Investigation of Nephropathy Diabetes Research Group, Fardo, D.
W. (2013). Combining genetic association study designs: a GWAS case study. Front. Genet.
4:186. doi: 10.3389/fgene.2013.00186
[23]. Chistiakova, D. A., and Chistiakova, E. I. (2010). T-cell protein tyrosine phosphatase: a
role in inflammation and autoimmunity. Int. J. Diabetes Mellit., 2:114–118. doi:
10.1016/j.ijdm.2010.05.012
[24]. Santin, I., Moore, F., Colli, M. L., Gurzov, E. N., Marselli, L., Marchetti, P., et al. (2011).
PTPN2, a candidate gene for type 1 diabetes, modulates pancreatic beta-cell apoptosis via
regulation of the BH3-only protein Bim. Diabetes, 60: 3279–3288. doi: 10.2337/db11-0758
[25]. McCole, D. F. (2012). Regulation of epithelial barrier function by the inflammatory bowel
disease candidate gene, PTPN2. Ann. N. Y. Acad. Sci,. 1257: 108–114. doi: 10.1111/j.1749-
6632.2012.06522.x
[26]. Ciccacci, C., Conigliaro, P., Perricone, C., Rufini, S., Triggianese, P., Politi, C., Novelli,
G., Perricone, R., and Borgiani, P. Polymorphisms in STAT-4, IL-10, PSORS1C1, PTPN2 and
MIR146A genes are associated differently with prognostic factors in Italian patients affected by
rheumatoid arthritis. Clin. Exp. Immunol., 186: 157-163. doi: 10.1111/cei.12831
[27]. Xi, Y., Liu, S., Bettaieb, A., Matsuo, K., Matsuo, I., Hosein, E., et al. (2015). Pancreatic T
cell protein-tyrosine phosphatase deficiency affects beta cell function in mice. Diabetologia, 58:
122–131. doi: 10.1007/s00125-014-3413-7
[28]. Fukushima, A., Loh, K., Galic, S., Fam, B., Shields, B., Wiede, F., et al. (2010). T-cell
protein tyrosine phosphatase attenuates STAT3 and insulin signaling in the liver to regulate
gluconeogenesis. Diabetes, 59: 1906–1914. doi: 10.2337/db09-1365

22
[29]. Wiede, F., Ziegler, A., Zehn, D., and Tiganis, T. (2014). PTPN2 restrains CD8(+) T cell
responses after antigen cross-presentation for the maintenance of peripheral tolerance in mice. J.
Autoimmun.,53: 105–114. doi: 10.1016/j.jaut.2014.05.008
[30]. Osterman, M. T., and Lichtenstein, G. R. (2007). Current and future anti-TNF therapy for
inflammatory bowel disease. Curr. Treat. Options Gastroenterol., 10: 195–207. doi:
10.1007/s11938-007-0013-3
[31]. Spalinger, M. R., Kasper, S., Chassard, C., Raselli, T., Frey-Wagner, I., Gottier, C., et al.
(2015). PTPN2 controls differentiation of CD4(+) T cells and limits intestinal inflammation and
intestinal dysbiosis. Mucosal Immunol, 8: 918–929. doi: 10.1038/mi.2014.122
[32]. Spalinger, M. R., Lang, S., Weber, A., Frei, P., Fried, M., Rogler, G., et al. (2013b). Loss of
protein tyrosine phosphatase nonreceptor type 22 regulates interferon-gamma-induced signaling
in human monocytes. Gastroenterology, 144: 978–988. e910. doi: 10.1053/j.gastro.2013.01.048
[33]. Scharl, M., Wojtal, K. A., Becker, H. M., Fischbeck, A., Frei, P., Arikkat, J., et al. (2012b).
Protein tyrosine phosphatase nonreceptor type 2 regulates autophagosome formation in human
intestinal cells. Inflamm. Bowel Dis., 18: 1287–1302. doi: 10.1002/ibd.21891
[34]. Spalinger, M. R., Lang, S., Vavricka, S. R., Fried, M., Rogler, G., and Scharl, M. (2013a).
Protein tyrosine phosphatase non-receptor type 22 modulates NOD2-induced cytokine release
and autophagy. PLoS ONE, 8:e72384. doi: 10.1371/journal.pone.0072384
[35]. Hermann, R., Lipponen, K., Kiviniemi, M., Kakko, T., Veijola, R., Simell, O., et al. (2006).
Lymphoid tyrosine phosphatase (LYP/PTPN22) Arg620Trp variant regulates insulin
autoimmunity and progression to type 1 diabetes. Diabetologia, 49: 1198–1208. doi:
10.1007/s00125-006-0225-4
23
[36]. Menard, L., Saadoun, D., Isnardi, I., Ng, Y. S., Meyers, G., Massad, C., et al. (2011). The
PTPN22 allele encoding an R620W variant interferes with the removal of developing
autoreactive B cells in humans. J. Clin. Invest., 121: 3635–3644. doi: 10.1172/JCI45790
[37]. Wardemann, H., Yurasov, S., Schaefer, A., Young, J. W., Meffre, E., and Nussenzweig, M.
C. (2003). Predominant autoantibody production by early human B cell precursors. Science, 301:
1374–1377. doi: 10.1126/science.1086907
[38]. Vang, T., Congia, M., Macis, M. D., Musumeci, L., Orrú, V., Zavattari, P., et al. (2005).
Autoimmune-associated lymphoid tyrosine phosphatase is a gain-of-function variant. Nat.
Genet., 37: 1317–1319. doi: 10.1038/ng1673
[39]. Maine, C. J., Hamilton-Williams, E. E., Cheung, J., Stanford, S. M., Bottini, N., Wicker, L.
S., et al. (2012). PTPN22 alters the development of regulatory T cells in the thymus. J. Immunol.,
188: 5267–5275. doi: 10.4049/jimmunol.1200150
[40]. Wu, D. J., Zhou, W., Enouz, S., Orru, V., Stanford, S. M., Maine, C. J., et al. (2014).
Autoimmunity-associated LYP-W620 does not impair thymic negative selection of autoreactive
T-cells. PLoS ONE, 9:e86677. doi: 10.1371/journal.pone.0086677
[41]. Zheng, P., and Kissler, S. (2013). PTPN22 silencing in the NOD model indicates the type 1
diabetes-associated allele is not a loss-of-function variant. Diabetes, 62: 896–904. doi:
10.2337/db12-0929
[42]. Ladner, M. B., Bottini, N., Valdes, A. M., and Noble, J. A. (2005). Association of the
single nucleotide polymorphism C1858T of the PTPN22 gene with type 1 diabetes. Hum.
Immunol., 66: 60–64. doi: 10.1016/j.humimm.2004.09.016
[43]. Knip, M. and Simell, O. (2012). Environmental triggers of type 1 diabetes. Cold Spring
Harb. Perspect. Med., 2: 7. doi: 10.1101/cshperspect.a007690

24
[44]. Khor, B., Gardet, A., and Xavier, R.J. (2011). Genetics and pathogenesis of inflammatory
bowel disease. Nature, 474: 307-317. doi: http://doi.org/10.1038/nature10209
[45]. Baumgart, D.C. and Sandborn, W.J. (2013). Crohn’s disease. The Lancet, 381: 19-25. doi:
https://doi.org/10.1016/S0140-6736(12)60026-9
[46]. Javierre, B.M., Hernando, H., and Ballestar, E. (2011). Environmental triggers and
epigenetic deregulation in autoimmune disease. Discov. Med., 12: 535-545
[47]. Tobon, G.J., Youinou, P., and Saraux, A. (2010). The environment, geo-epidemiology, and
autoimmune disease: Rheumatoid arthritis. Autoimmunity Reviews., 9: A288-A292. doi:
https://doi.org/10/1016/j.autrev.2009.11.019
[48]. Ellis, J.A., Kemp, A.S., and Ponsonby, A. (2014). Gene-environment interaction in
autoimmune disease. Expert Rev. Mol. Med., 16: e4. doi:10.1017/erm.2014.5
[49]. Bottini, N. and Peterson E.J. (2013). Tyrosine phosphatase PTPN22: multifunctional
regulator of immune signaling, development, and disease. Annu. Rev. Immunol., 32:83-119. doi:
10.1146/annurev-immunol-032713-120249
[50]. Spalinger, M.R., McCole, D.F., Rogler, G., and Scharl, M. (2016).Protein tyrosine
phosphatase non-receptor type 2 and inflammatory bowel disease. World J. Gatroenterol., 22:
1034-1044. doi: 10.3748/wjg.v22.i3.1034
[51]. Klareskog, L., Catrina, A.I., Paget, S. (2009). Rheumatoid arthritis. The Lancet, 373: 659-
672. doi: https://doi.org/10.1016/S0140-6736(09)60008-8
[52]. Wang, Y., Shaked, I., Stanford, S.M., Zhou, W., Curtsinger, J.M., Mikulski, Z., Shaheen,
Z.R., et al. (2013). Immunity, 39: 111-133. doi: https://doi.org/10.1016/j.immuni.2013.06.013

25
[53]. Spalinger, M.R. and Scharl, M. (2015). The role of protein tyrosine phosphatase non-
receptor type 22 in regulating intestinal homeostasis. United European Gastroenterology
Journal, 0: 1-8. doi: 10.1177/2050640615600115
[54]. Sohal, J.S., Singh, S.V., Tyagi, P., Subhodh, S., Singh, P.K., Singh, A.V., Narayanasamy,
K., Sheoran, N., and Sandhu, K.S. (2008). Immunology of mycobacterial infections: with special
reference to Mycobacterium avium subspecies paratuberculosis. Immunobiology, 213: 585-598.
doi: https://doi.org/10.1016/j.imbio.2007.11.002
[55]. Ahmad, S. (2011). Pathogenesis, immunology, and diagnosis of latent Mycobacterium
tuberculosis infection. Clinical and Developmental Immunology, 2011: 1-17. doi:
http://dx.doi.org/10.1155/2011/814943
[56]. Atreya, R., Bulte, M., Gerlach, G. Goethe, R., Hornef, M.W., Kohler, H., Meens, J.,
Mobius, P., Roeb, E., and Weiss, S. (2014). Facts, myths and hypotheses on the zoonotic nature
of Mycobacterium avium subspecies paratuberculosis. International Journal of Medical
Microbiology, 304: 858-867. doi: https://doi.org/10.1016/j.ijmm.2014.07.006
[57]. Martinez-Medina, M., Aldeguer, X., Lopez-Siles, M., Gonzalez-Huix, F., Lopez-Oliu, C.,
Dahbi, G., Blanco, J.E., Blanco, J., Garcia-Gil, L.J., and Darfeuille-Michaud, A. (2009).
Molecular diversity of Escherichia coli in the human gut: new ecological evidence supporting
the role of adherent-invasive E.coli (AIEC) in Crohn’s disease. Inflamm. Bowel Dis., 15: 872-
882. doi: 10.1002/ibd.20860
[58]. Rashid, T., Wilson, C., and Ebringer, A. (2013). The link between ankylosing spondylitis,
Crohn’s disease, Klebsiella, and starch consumption. Clinical and Developmental Immunology.,
2013: 1-9. doi: http://dx.doi.org/10.1155/2013/872632

26
[59]. Kim, D.H. and Lee, I.A. (2011). Klebsiella pneumoniae increases the risk of inflammation
and colitis in a murine model of intestinal bowel disease. Scand. J. Gasteroenterol., 46: 684-693.
doi: 10.3109/00365521.2011.560678

27
CHAPTER TWO: POLYMORPHISMS IN PROTEIN TYROSINE
PHOSPHATASE NON-RECEPTOR TYPE 2 AND 22 (PTPN2/22) ARE
LINKED TO HYPER-PROLIFERATIVE T-CELLS AND
SUSCEPTIBILITY TO MYCOBACTERIA IN RHEUMATOID ARTHRITIS
Note: This chapter has been published in part and the citation link is: Sharp, R.C., Beg, S.A., and
Naser, S.A. (2018). Polymorphisms in protein tyrosine phosphatase non-receptor type 2 and 22
(PTPN2/22) are linked to hyper-proliferative T-cells and susceptibility to Mycobacteria in
rheumatoid arthritis. Front. Cell. Infect. Microbiol., 8:11. doi:
https://doi.org/10.3389/fcimb.2018.00011
Introduction
In RA, several SNPs have been reported in HLA class 2 histocompatibility antigen, DRB1 beta
chain (HLA-DRB1), PTPN22, cytotoxic T-lymphocyte-associated protein 4 (CTLA4), and cluster
of differentiation 40 (CD40) [1][2][3]. SNPs in these genes alter or stimulate the activation and
regulation of major components of the immune system (T-cells, B-cells, macrophages, etc.) and
osteoclasts which could lead to immune-dysregulation [1][3][4]. Consequently, this leads to
accumulation of immune cells in and around synovial joints and excessive production of anti-
CCP, RF, and various pro-inflammatory cytokines such as TNF-α, IFN-γ, IL-1, and IL-6
[1][3][4]. Specifically, SNPs in immune regulatory genes such as PTPN2/22 could potentially
cause these problems in RA. We agree that the prevalence of SNPs in PTPN2/22 may vary and
we support the possibility that the effect on gene expression may be significant which ultimately
may void their functions as negative regulators (Figure 2). Consequently, T-cells remain
constantly active, leading to hypersecretion of pro-inflammatory cytokines and inflammation
along with tissue damage [5][6].

28
RA is an idiopathic autoimmune disease with suspected genetic predisposition and
environmental triggers association. Due to intense inflammation, hyperplasia of the joints occurs
along with cartilage and bone destruction, which leads to extreme pain and deformity of the
extremities [1][3][7]. RA symptoms include joint swelling and pain of three or more joints,
morning stiffness lasting 30 min and subcutaneous rheumatoid nodules [8]. Anti-CCP along with
RF have also been useful to diagnose RA, more so than erythrocyte sedimentation rate (ESR)
and C-reactive protein serum levels [7][9][10][11][12]. Although, anti-CCP seems to be more
specific, but less sensitive than RF in RA diagnosis. Overall, ~30% of patients with RA are
negative for anti-CCP [9][10][11]. RF, on the other hand, seems to have lower specificity but
higher sensitivity compared to anti-CCP test. Overall, ~30–40% of patients with RA are negative
for rheumatoid factor [9][10][11]. The limitation in early and accurate diagnosis of RA affects
many patients who are left with continued pain and debilitating suffering. It is imperative that
new and improved methods of testing for RA (i.e., genetic testing or identification of potential
environmental antigens) is discovered to not only better diagnose RA, but to also find better
treatments for the disease as well.
Treatment of inflammatory diseases such as RA and CD includes non-steroid anti-inflammatory
drugs (NSAIDs), glucocorticoids, and disease-modifying anti-rheumatic drugs (DMARDs)
[3][8][13]. NSAIDs and glucocorticoids are used for RA patients to help reduce overall pain and
stiffness [3][8][13]. However, these medications have a wide-variety of long-term side effects
such as ulceration, osteoporosis, hypertension, weight gain, etc., thus NSAIDs and
glucocorticoids need to be paired with other medications to reduce the side effects [3][8][14].
DMARDs includes synthetic products such as methotrexate, sulfasalazine and

29
hydroxychloroquine and includes biologics such as adalimumab/infliximab (anti-TNF-α),
tocilizumab (anti-IL-6 receptor), abatacept (T-cell co-stimulator), and rituximab (B-cell
deactivator) [3][8]. Using multi-therapy or mono-therapy of different DMARDs is controversial
and is continued to be argued among clinicians due to conflicting side effects of each medication.
Problems with both synthetic and biological DMARDs continue to be the high risk of developing
sides effects including GI intolerance, hypersensitivity to the medication, production of
antibodies against the medication, and increasing the risk of developing opportunistic infections
such as Mycobacterium tuberculosis infection [3][15][16]. DMARDs and synthetic DMARDs
are re-classified as DMAIDs when used in inflammatory bowel treatment such as CD [17].
Infliximab is most commonly prescribed medication for both RA and CD [17][18]. RA and CD
patients share the same treatments, thus it is possible that both RA and CD pathogenesis share
common factors involved in disease pathogenesis [17][18][19][20][21]
Environmental triggers involved in RA include cigarette smoking, air pollutants, and bacteria
including Porphyromonas ginivalis (P. gingivalis) and Proteus mirablis (P. mirablis)
[3][22][23]. Molecular mimicry between a haemolysin protein sequence (ESRRAL) produced by
P. mirablis and a RA susceptibility sequence (EQRRAA) was reported, thus showing possible
connections to genetic pre-disposition and an environmental trigger synergistic threat [24]. Most
recently, MAP has been associated with other autoimmune diseases including CD, T1D, and
possibly in RA [6][25][26][27]. The association of MAP with these inflammatory diseases was
based on shared genetic predisposition and molecular mimicry with environmental antigens
[6][25][26][27]. MAP infection in a genetically predisposition patient should trigger, exacerbate
and possibly dysregulate the immune system by stimulating the production of pro-inflammatory

30
cytokines and, through molecular mimicry, production of autoantibodies [6][25][26][27]. This is
the first study designed to explore the effect of an environmental trigger, such as MAP, and
SNPs in PTPN2/22 on gene expression and the consequent effect on T-cells reactivity and
inflammation. We hypothesize that SNPs in PTPN2/22 and, along with MAP infection, causes
hyper-proliferative T-cells and overexpression of IFN-γ, leading to possible inflammation in RA
patients.
Materials and Methods
Clinical Samples
Three 4.0-mL K2-EDTA coded blood tubes were obtained from 132 consented RA and healthy
control subjects that were acquired from the University of Central Florida Health Center. The
study was approved by the University of Central Florida Institutional Review Board
#IRB00001138. Each subject completed and signed a written consent form before samples were
collected. The average age of healthy controls was 30.7 ± 13.4 with a gender ratio of 41.9% male
and 58.1% female subjects. The average age of RA patients was 49.9 ± 13.7 with a gender ratio
of 11.4% male and 88.6% female subjects. Many factors including the higher prevalence of RA
in older females than in males (3:1 ratio) found in other studies, the preference of a female
rheumatologists by female RA patients, and the selection of rheumatologists around the area has
been noted and considered in this study [28][29]. Table 1 lists age, gender and other
demographic information and current medications for all RA subjects participating in this study.
One tube of blood sample was processed for detection of MAP IS900 DNA. Another tube of
blood sample was processed for PTPN2/22 genotyping and gene expression experiments,
whereas the third tube of blood sample was utilized in T-cell proliferation study.

31
Table 1. Demographics, Treatment History, and Results of MAP and Allele Frequency of rs478582/rs2476601 in RA
Samples Used in Study
SAMPLE CODE DIAGNOSIS GENDER AGE MEDICATIONS
CURRENTLY TAKEN
MAP
STATUS
PTPN2:
rs478582*
PTPN22:
rs2476601**
MAP-1000 RA F 60 Hydroxychloroquine - CC GG
MAP-1001 RA M 75 Methotrexate,
Prednisone
- TT GG
MAP-1003 RA F 68 Humira®, Methotrexate,
Prednisone
- TC GG
MAP-1004 RA F 37 Methotrexate - TC GG
MAP-1002 RA F 62 Methotrexate + TC GA
MAP-1005 RA M 30 Methotrexate,
Prednisone
- TC GG
MAP-1006 RA F 55 Methotrexate - CC GG
MAP-1007 RA F 59 Methotrexate,
Hydroxychloroquine
- TC GG
MAP-1008 RA F 68 Methotrexate - TC GG
MAP-1009 RA F 33 Methotrexate,
Prednisone
- TC GG
MAP-1010 RA F 62 Methotrexate,
Prednisone, Humira®,
Sulfasalazine
- CC GG
MAP-1011 RA F 45 Humira® + TC GA
MAP-1012 RA F 76 Hydroxychloroquine + CC GG
MAP-1013 RA F 52 Enbrel®, Methotrexate + CC GG
MAP-1014 RA F 43 Methotrexate + TC GG
MAP-1015 RA F 47 Enbrel®, Methotrexate + TC GG
MAP-1016 RA M 48 Methotrexate,
Prednisone
+ TC GG
MAP-1017 RA F 22 Methotrexate, Simponi® - CC GA

32
SAMPLE CODE DIAGNOSIS GENDER AGE MEDICATIONS
CURRENTLY TAKEN
MAP
STATUS
PTPN2:
rs478582*
PTPN22:
rs2476601**
MAP-1019 RA F 52 Enbrel® - TC GG
MAP-1020 RA F 60 Orencia®, Methotrexate - CC GA
MAP-1021 RA F 57 Methotrexate, Simponi® - TC GG
MAP-1023 RA F 51 Methotrexate,
Prednisone
- CC GG
MAP-1024 RA F 62 Methotrexate, Humira® - CC GA
MAP-1022 RA F 62 Hydroxychloroquine,
Methotrexate
- CC GG
MAP-1025 RA F 49 None - CC GG
MAP-1026 RA F 64 None - TC GG
MAP-1027 RA+IBD F 56 Prednisone, Xeljanz® + CC GG
MAP-1028 RA+IBD F 61 Methotrexate, Humira® - CC GA
MAP-1029 RA F 25 Orencia®, Prednisone - CC GG
MAP-1300 RA F 39 Orencia®, Methotrexate - TC GA
MAP-1031 RA F 58 Enbrel®, Leflunomide + TT GG
MAP-1032 RA F 30 Humira® - TC GG
MAP-1033 RA F 56 Hydroxychloroquine + TC GG
MAP-1034 RA F 43 Humira®,
Hydroxychloroquine
- TC GG
MAP-1035 RA F 28 Humira®, Methotrexate,
Hydroxychloroquine
- TT GG
MAP-1036 RA F 49 Methotrexate,
Hydroxychloroquine
+ CC GA
MAP-1037 RA F 53 Enbrel® - TT GA
MAP-1039 RA F 56 Hydroxychloroquine - CC GA
MAP-1040 RA F 56 Enbrel®, Methotrexate - TT GG
MAP-1041 RA F 30 Humira®, Prednisone,
Leflunomide
- TC GG
MAP-1042 RA F 44 Methotrexate + CC GG

33
SAMPLE CODE DIAGNOSIS GENDER AGE MEDICATIONS
CURRENTLY TAKEN
MAP
STATUS
PTPN2:
rs478582*
PTPN22:
rs2476601**
MAP-1043 RA+UC+T1D F 28 Sulfasalazine,
Budesonide
+ TT GA
MAP-1044 RA F 39 Hydroxychloroquine + TC GA
MAP-1046 RA F 54 Hydroxychloroquine - CC GA
MAP-1047 RA F 65 None - TC GG
MAP-1048 RA M 65 Methotrexate + TT GA
MAP-1049 RA F 59 Stelara® - TC GA
MAP-1050 RA F 73 Humira® + TC GG
MAP-1051 RA F 34 Prednisone - TC GG
MAP-1052 RA F 20 Hydroxychloroquine - CC GG
MAP-1053 RA F 63 Cimzia®, Methotrexate,
Predenisone
- CC GA
MAP-1054 RA F 36 Methotrexate + TC GA
MAP-1057 RA F 51 Methotrexate,
Predenisone
- TC AA
MAP-1055 RA F 63 Methotrexate,
Hydroxychloroquine,
Predenisone
+ TT GG
MAP-1056 RA F 47 None + TT GG
MAP-1058 RA M 42 Methotrexate, Humira® - TT GG
MAP-1059 RA F 51 Humira® - TT GG
MAP-1060 RA M 47 Prednisone + TC GG
MAP-1061 RA F 52 Hydroxychloroquine + TC GG
MAP-1062 RA+T1D F 50 None - TT GG
MAP-1063 RA+SLE F 29 Orenseia®,
Methotrexate,
Predenisone
- TC GG
MAP-1064 RA+UC F 40 None - CC GG
MAP-1065 RA F 42 Methotrexate, Humira® - TT GA
MAP-1066 RA F 65 None - TC GG

34
SAMPLE CODE DIAGNOSIS GENDER AGE MEDICATIONS
CURRENTLY TAKEN
MAP
STATUS
PTPN2:
rs478582*
PTPN22:
rs2476601**
MAP-1068 RA+CD F 28 Humira® - CC GG
MAP-1069 RA M 56 Enbrel®, Methotrexate - TC GG
MAP-1070 RA F 48 Enbrel® - TT GA
MAP-1067 RA M 70 Methotrexate, Cimzia® + TT GG
MAP-1071 RA F 32 Methotrexate + TC GG
MAP-1072 RA F 58 None + TC GG
RA: Rheumatoid Arthritis
IBD: Inflammatory Bowel Disease
UC: Ulcerative Colitis
T1D: Type 1 Diabetes
SLE: Systemic Lupus Erythematosus
CD: Crohn’s Disease
*: TT = Homozygous Major Allele/No SNP
TC = Heterozygous Allele
CC = Homozygous Minor Allele
**: GG = Homozygous Major Allele/ No SNP
GA = Heterozygous Allele
AA = Homozygous Minor Allele

35
Detection of MAP IS900 DNA in Peripheral Leukocytes
Blood sample tubes designated for MAP IS900 detection were centrifuged at 3,000 RPMs for 10
min at room temperature. A 1.0 mL sample of plasma was transferred to sterile 1.5 mL
microcentrifuge tube and was stored at −20°C for further analysis. Buffy coat layer containing
peripheral leukocytes were also transferred into new sterile 1.5 mL microcentrifuge tube
containing double volume of red cell lysis buffer (ammonium chloride solution, G-
Biosciences®). Tubes were then incubated by rocking on a gentle shaker for 10 min, which then
were centrifuged at 5,000 RPMs for 5 min at room temperature. The supernatant was removed
and purified buffy coat pellets were stored in Tris-EDTA (TE) buffer and subjected to genomic
DNA extraction using a modified DNAzol® extraction protocol as follows. Fresh or thawed
buffy coat pellets suspended in 1.0 mL DNAzol® reagent was mixed with 400 μL of 100%
isopropanol. Tubes were then incubated for 15 min at room temperature followed by
centrifugation at 8,000 RPMs for 6 min. The supernatant was discarded and DNA pellets were
washed once with 500 μL DNAzol® reagent and centrifuged at 8,000 RPMs for 5 min. Genomic
DNA pellets were washed again with 1.0 mL of 75% ethanol and centrifuged at 8,000 RPMs for
5 min. DNA pellets were then dried in a speedvac for 5 min. Dried DNA pellets were dissolved
in 20 μL molecular biological grade sterile H2O and stored at −20°C for analysis by nest
polymerase chain reaction (nPCR). Detection of MAP IS900 DNA was done following our
nPCR protocol and nucleotide primers as described previously [30]. The presence of a 298 bp
band on a 2% agarose gel was indicative of presence of MAP in patient sample. Positive MAP
DNA control originated from our UCF4, a culture of clinical strain isolated from CD patient.

36
Negative control tube for each PCR step contained all PCR ingredients except DNA template
was used.
PTPN2/22 Genotyping
Genotyping of PTPN2/22 for 9 SNPs were performed on DNA from peripheral blood.
Genotyping was done at the University of Florida Pharmacotherapy and Translational Research
Department (Gainesville, FL) using the TaqMan™ SNP Genotyping Assays (Applied
Biosystems™). We investigated 4 SNPs specific to PTPN2 including rs1893217, rs2542151,
rs7234029, and rs478582 along with 5 SNPs specific for PTPN22 including rs2476601,
rs2488457, rs33996649, rs34209542, and rs2476599. Table 2 summarizes SNPs allele mutations
and amino acid mutations used in this study. Briefly, 1 mL blood was stored at −20°C until all
samples were collected. DNA extractions were performed on whole blood samples using
QIAamp® DNA Blood Mini Kit (Qiagen™) following the manufacturer's protocol. Similarly,
TaqMan™ genotyping assays for PTPN2/22 were performed on DNA samples following
manufacturer protocol (Applied Biosystems™). Briefly, reaction mixtures consisted of 2x
TaqMan™ Master Mix and 20x Assay Working Stock (primers with VIC and FAM fluorophore
attachment) were transferred into a 384-well microtiter plate. DNA samples and controls were
then added to the plate which then was subjected to RT-PCR using Applied Biosystems™
QuantStudio™ RT-PCR System. The protocol consisted of 95°C for 10 min for 1 cycle, 92°C for
15 s and 58°C for 1 min for 50 cycles. The plate was read for VIC and FAM fluorophores for
each sample at 551 and 517 nm, respectively. Fluorescence of VIC or FAM alone determined
that the sample had allele 1 or allele 2, while VIC and FAM together determined that the sample
is heterozygous for each allele.

37
Table 2. List of SNPs in PTPN2/22 Examined in this Study
GENE RS# MUTATION LOCATION MUTATION PHENOTYPE
PTPN2 rs2542151 T>G 5.5 kb Upstream
(Espino-Paisan et
al., 2011)
High Susceptibility to CD, UC,
T1D, T2D, RA, and Juvenile
Idiopathic Arthritis
rs1893217 T>C Intron 7
(Espino-Paisan et
al., 2011)
High Susceptibility to CD, T1D,
MS, RA, and Celiac Disease
rs7234029 A>G Intronic Section
(Zhang et al.,
2014)
High Susceptibility to CD, UC,
RA, and Juvenile Idiopathic
Arthritis
rs478582 T>C Intron 3
(Espino-Paisan et
al., 2011)
High Susceptibility to T1D, MS,
RA, and Celiac Disease
PTPN22 rs2476601 G>A R620W
(Qu et al., 2005)
High Susceptibility to CD, T1D,
MS, RA, SLE, and Celiac
Disease
rs2488457 C>G Promoter Region
(Fan et al., 2015)
High Susceptibility to UC, T1D,
RA, SLE, and Juvenile
Idiopathic Arthritis
rs33996649 C>T R263Q
(Rodriguez et al.,
2011)
High Susceptibility to CD, UC,
and RA
rs34209542 A>G Intronic Section
(Skinningsrud et
al., 2008)
High Susceptibility to T1D, RA,
and Juvenile Idiopathic Arthritis
rs2476599 G>A Intron 19
(Taniyama et al.,
2010)
High Susceptibility to RA
PTPN2/22 and IFN-γ Gene Expression
A total of 1 mL of fresh whole blood was transferred into 2.0 mL RNA-ase free microcentrifuge
tube and was immediately processed for RNA extraction. RNA was isolated from peripheral

38
leukocytes and then used to synthesis cDNA for determining gene expression of PTPN2/22 and
IFN-γ via RT-PCR. RNA extraction was performed following the TRIzol® Reagent (Invitrogen)
manufacturer's instruction. Briefly,1.0 mL of whole blood was transferred into 2.0 mL RNase
free microcentrifuge tubes and centrifuged at 3,000 RPMs for 15 min. Plasma was discarded and
buffy coat layer containing peripheral leukocytes were transferred to new RNA-ase free
microcentrifuge tubes with double volume of red cell lysis buffer (ammonium chloride solution,
G-Biosciences®). Tubes were incubated by rocking on gentle shaker for 10 min which then was
centrifuged at 5,000 RPMs for 5 min at room temperature. Supernatant was then removed and
peripheral leukocyte pellets were suspended in 1.0 mL of TRIzol®. Tubes were then incubated
by rocking on a gentle shaker for 15 min. A volume of 0.2 mL of chloroform was then added to
each tube. The mixture was then incubated at room temperature for 3 min. Tubes were then
centrifuged at 11,400 RPMs for 15 min at 4°C. The colorless, upper aqueous phase containing
RNA was transferred into new 2.0 mL RNA-ase free microcentrifuge tubes. A volume of 0.5 mL
of 100% isopropanol was added followed by incubation at room temperature for 10 min. Tubes
were then centrifuged at 11,400 RPMs for 10 min at 4°C. RNA pellets were washed in 1 mL of
75% ethanol and then centrifuged at 8,700 RPMs for 5 min at 4°C. RNA pellets were air-dried
for 15–30 min and then suspended in 20 μL of RNase free H2O and heated at 60°C for 10 min.
cDNA synthesis was performed following the iScript™ Reverse Transcription (Bio-Rad®)
manufacturer's instruction. Briefly, 600 ng of RNA from each sample was added to PCR reaction
tubes containing 0.2 mL PCR reaction, 4 μL of iScript™ Reverse Transcription (Bio-Rad®), and
up to 20 uL RNase free H2O. Tubes were then placed in a thermal cycler (MyGene™ Series

39
Pelteir Thermal Cycler) and ran for 5 min at 25°C, 20 min at 46°C, and 1 min at 95°C. Final
concentration of cDNA for each sample was 30 ng/μL.
RT-PCR reactions in a 96-well microamp plate consisted of 1 μL of cDNA (30 ng), 10 μL of
Fast SYBR Green Mastermix (Thermofisher Scientific®), 1 μL of either PTPN2, PTPN22, or
IFN-γ PrimePCR SYBER Green Assay mix (Bio-Rad®). and 8 μL of molecular biological grade
sterile H2O. Oligonucleotide primers for 18s RNA gene (forward primer: 5′-GTA ACC CGT
TGA ACC CCA TT-3′; reverse primer: 5′-CCA TCC AAT CGG TAG TAG CG-3′) were used
as a control and to obtain baseline CT readings. RT-PCR reaction was performed using the 7500
Fast Real-Time PCR System (Applied Biosystems®). Relative mRNA expression levels were
calculated using ΔCT (Sample RT-PCR CT reading–18s CT baseline) and using the equation
(2−ΔCT × 1,000).
Isolation of Peripheral Lymphocytes and Proliferation Assay
Isolation of peripheral lymphocytes was performed using Lymphoprep™ reagent (Axis-Shield®)
as described previously [31]. A stock of 2X freezing media containing 10.0 mL of 25% human
serum albumin (Gemini®), 10.0 mL of sterile RPMI-1640 (Sigma-Aldrich®), and 5.0 mL
DMSO was made for the use of preserving lymphocytes for storage at −80°C. Isolated
lymphocytes were transferred into 1.0 mL cryogenic vials (Nalgene®) with double the amount of
2x freezing media added to samples and stored at −80°C for future use. Lymphocytes were
thawed and washed with cRPMI, which contained 10% sterile heat-inactivated FBS (Sigma-
Aldrich®) and 1% sterile antibiotic/antimycotic solution (Sigma-Aldrich®) added to RPMI-1640
before T-cell isolation. T-cell isolation from lymphocyte samples were done using EasySep™

40
Human T-cell Isolation Kit (Stemcell™) following manufacturer's instruction. Briefly, isolated
lymphocytes were transferred into a 2.0 mL round-bottom microcentrifuge tubes. The Isolation
Cocktail mixture was added at 50 μL/mL to sample tubes and was incubated at room temperature
for 5 min. The RapidSpheres™ mixture was added to the tubes at 40 μL/mL and were placed in
the EasySep™ magnet for 3 min. Isolated T-cells were poured from the tubes in the magnet to
new 2.0 mL microcentrifuge tubes. T-cells were then counted using trypan blue solution (0.4%,
Sigma®) cell viability assay.
T-cell proliferation assay was done using bromodeoxyuridine (BrdU) labeling proliferation
ELISA kit (Roche Molecular Biochemicals®) as described previously [31].
Phytohematoagglutunin (PHA) was used to evaluate T-cell response. Purified Protein
Derivative-like (PPD-like) from MAP was prepared by purification of supernatant from
sonicates of protein extract obtained from clinical strain UCF4 culture pellet. It was used to
determine T-cell response and prior exposure to MAP antigens. Briefly, 1 × 10⁵ of isolated T-
cells were transferred in triplicates onto a 96-well culture plate and were incubated in either
RPMI only, PHA (10 μg/mL, Sigma-Aldrich®) or PPD-like (5 μg/mL) along with respected
patients' plasma for 72 h at 37°C and 5% CO2. T-cells were then labeled with BrdU and
incubated for 24 h at 37°C and 5% CO2. Cell proliferation was measured through Roche BrdU
proliferation ELISA kit as described previously [31]. Relative T-cell proliferation levels of
samples were compared to blanks (RPMI only) and controls (isolated T-cells in RPMI only) by
examining fold change in absorbance reading of each well at 450 nm.

41
Statistical Analysis
Samples were analyzed for significance using unpaired, two-tailed t-tests; unpaired, two-tailed z-
score; and odds ratio. GraphPad Prism 7 was used for statistical analysis and creation of graphs.
P-values ≤ 0.05 were considered significant. Relative mRNA gene expression was determined by
the use of ΔCT of the gene of interest found in each sample and the equation 2−ΔCT × 1,000 [32].
Results
Mycobacterium avium subspecies paratuberculosis IS900 DNA Detected in RA Frequency of
SNP Alleles in PTPN2/22 in RA
Purified DNA from peripheral leukocytes of 118 subjects (70 RA and 48 healthy controls) was
analyzed by nPCR using oligonucleotide primers specific to MAP IS900. MAP DNA was
detected in blood samples from RA subject as illustrated in Figure 3A. The 298 bp PCR product
purified from representative gels was sequenced and BLAST analysis confirmed the identity of
MAP, which has previously been used to confirm if patient samples are considered having the
MAP infection [25][[26][30]. As shown in Figure 3B, out of 70 blood samples from RA subjects,
24 (34.3%) were positive for MAPbacteremia compared to only 4 out 48 (8.3%) healthy controls
(p-value ≤ 0.05). The odds ratio (OR) value was determined to be 5.74 (95% CI: 1.84–17.9; p-
value ≤ 0.05), where the presence of MAP DNA is most likely to occur in RA patients. MAP
bacteria has been successfully re-cultured from at least one RA buffy coat sample (MAP-1015,
see Table 1) via BD Bactec™ MGIT™ Para-TB medium (Becton, Dickinson and Company).
The cultured sample was confirmed to be MAP positive by way of nPCR as previously
mentioned. Culturing of MAP bacteria from other RA patient samples is still ongoing.

42
Frequency of SNP Alleles in PTPN2/22 in RA
TaqMan™ genotyping was done on purified DNA from 132 subjects (70 RA and 62 healthy
controls). DNA from each subject was analyzed for 4 SNPs specific to PTPN2 (rs1893217,
rs2542151, rs7234029, rs478582) and 5 SNPs specific to PTPN22 (rs2476601, rs2488457,
rs33996649, rs34209542, rs2476599). Data referred to as homozygous major allele is considered
normal/no SNP, while heterozygous allele and homozygous minor allele were considered
abnormal and designated as SNP positive. As shown in Figure 4, Out of 4 SNPs specific to
PTPN2, rs478582 was significant in RA since heterozygous (TC) or minor (CC) alleles were
detected in 55/70 (78.6%) RA samples compared to 36/60 (60.0%) healthy controls (p-value ≤
0.05, Figure 4A). Specifically, 22/70 (31.4%) minor (CC) alleles were detected in RA compared
to 9/60 (15.0%) healthy controls (p-value ≤ 0.05), whereas heterozygous (TC) alleles were
detected in 33/70 (47.1%) RA compared to 28/60 (46.7%) healthy controls. Out of 5 SNPs
specific to PTPN22, rs2476601 was significant in RA since heterozygous (GA) or minor (AA)
alleles were detected in 20/70 (28.6%) RA samples compared to only 4/62 (6.45%) healthy
controls (p-values ≤ 0.05, Figure 4B). Specifically, heterozygous alleles (GA) were detected in
19/70 (27.1%) RA compared to 4/62 (6.45%) healthy controls (p-value ≤ 0.05). There was rare
minor (AA) alleles detected in all samples. The OR value for the significance of
PTPN2:rs478582 was 2.28 (95% CI: 1.05–4.93; p-value ≤ 0.05) whereas OR value for
PTPN22:rs2476601 was 5.90 (95% CI: 1.89–18.4; p-value ≤ 0.05).
For determination of haplotype combinations, we examined the significant SNPs
PTPN2:rs478582 and PTPN22:rs2476601 allele combinations to confirm the allele distribution
among samples (Figure 4C). Examination of the following haplotype combinations were

43
determined in the samples, where PTPN2:rs478582 and PTPN22:rs2476601 allele types were
combined respectively: T-G, C-G, T-A, and C-A. T-G haplotype (major/major) was found more
significantly in healthy controls (21/59 = 35.6%) than in RA samples (10/70 = 14.3%, p-value ≤
0.05). C-G haplotype (heterozygous or minor/major) was found in 40/70 (57.1%) RA samples
compared to healthy 34/59 (57.6%). T-A haplotype (major/heterozygous or minor) was found
more in RA samples (5/70 = 7.14%), compared to healthy controls (2/59 = 3.39%), while C-A
(heterozygous or minor/heterozygous or minor) was found significantly more in RA samples
(15/70 = 21.4%) than in healthy controls (2/59 = 2.39%, p-value ≤ 0.05). When examining the
haplotypes in more detail, CC-GA haplotype was found more significantly (p-value ≤ 0.05) in
RA patients (8/70 = 11.4%) than in healthy controls (1/59 = 1.69%).
Effect of PTPN2:rs478582 and PTPN22:rs2476601 on PTPN2/22 Expression
Gene expression of PTPN2/22 in 37 RA and 31 healthy controls were reported. The overall
relative mRNA expression of PTPN2 was lower in RA compared to healthy controls (8.22 ± 5.33
and 10.3 ± 6.95, respectively). Similarly, relative mRNA expression of PTPN22 was also lower
in RA compared to healthy controls (2.55 ± 1.74, and 3.24 ± 1.84, respectively). Examination of
relative mRNA expression of PTPN2/22 in relationship with samples with either
PTPN2:rs478582 or PTPN22:rs2476601 was examined as seen in Table 3.

44
Table 3. Effect of PTPN2:rs478582 and PTPN22:rs2476601 on PTPN2/22 Expression
DIAGNOSIS PTPN2 EXPRESSION OF
SAMPLES WITH PTPN2:RS478582
(2(-∆CT) X 1000)
PTPN22 EXPRESSION OF
SAMPLES WITH
PTPN22:RS2476601
(2(-∆CT) X 1000)
TT TC CC TC +
CC
GG GA AA GA +
AA
RA 7.38 ±
4.91
(N=13)
7.42 ±
4.01
(N=15)
10.7 ±
7.33
(N=9)
8.67 ±
5.59
(N=24)
2.41 ±
1.98
(N=24)
2.77 ±
1.28
(N=12)
3.16
(N=1)
2.79 ±
1.23
(N=13)
HEALTHY 9.49 ±
5.13
(N=8)
10.3 ±
7.01
(N=18)
11.9 ±
9.73
(N=5)
10.6 ±
7.47
(N=23)
3.24 ±
1.91
(N=27)
3.40 ±
1.19
(N=4)
NA 3.40 ±
1.19
(N=4)
The effect of PTPN2:rs478582 on gene expression was evaluated. The average relative mRNA
expression in RA with heterozygous (TC) or minor (CC) allele was 8.67 ± 5.59 (N = 24)
compared to 10.6 ± 7.47 (N = 23) in healthy controls with similar SNPs and lower than healthy
controls without SNPs (TT) (9.49 ± 5.13; N = 8). Specifically, the average relative mRNA
expression in RA with heterozygous (TC) allele was 7.42 ± 4.01 (N = 15) which is much lower
than healthy control with the heterozygous (TC) allele (10.3 ± 7.01; N = 18) and normal (TT)
healthy controls (9.49 ± 5.13; N = 8). The effect of minor (CC) allele on PTPN2 expression in
RA was 10.7 ± 7.33 (N = 9) and lower than healthy controls with minor (CC) allele (11.9 ± 9.73;
N = 5). The effect of PTPN2:rs478582 on mRNA expression in each subject group was not
significant. Among healthy controls, the average relative mRNA expression in samples with
heterozygous (TC) or minor (CC) allele was 10.6 ± 7.47 (N = 23) compared to 9.49 ± 5.13 (N =

45
8) in normal (TT) samples. The average relative mRNA expression with only heterozygous (TC)
allele was 10.3 ± 7.01(N = 18), whereas samples with minor (CC) allele had 11.9 ± 9.73 (N = 5)
compared to normal (TT) healthy controls (9.49 ± 5.13 N = 8). Among RA samples, the average
relative mRNA expression in samples with the heterozygous (TC) or minor (CC) allele was 8.67
± 5.59 (N = 24) compared to 7.38 ± 4.91 (N = 13) in normal (TT) samples. The average relative
mRNA expression samples with only heterozygous (TC) allele was 7.42 ± 4.0 (N = 15), whereas
samples with the minor (CC) allele had 10.7 ± 7.33 (N = 9) compared to RA normal (TT)
samples (7.38 ± 4.91; N = 13). The overall average relative mRNA expression in all samples
with heterozygous (TC) or minor allele (CC) was 9.63 ± 6.58 (N = 47) compared to 8.19 ± 4.98
(N = 21) in samples without any SNP. Specifically, the average relative mRNA expression in all
samples with only heterozygous (TC) allele was 8.99 ± 5.94 (N = 33) and with only the minor
(CC) allele was 11.2 ± 7.91 (N = 14) compared to the samples without any SNP (8.19 ± 4.98; N
= 21).
Correlation analyses were also performed to determine if PTPN22:rs2476601 alters PTPN22
expression. The average relative mRNA expression in RA with heterozygous (GA) or minor
allele (AA) was 2.79 ± 1.23 (N = 13) compared to 3.40 ± 1.19 (N = 4) in healthy controls with
similar SNP and normal (GG) healthy control (3.24 ± 1.91, N = 27). Specifically, the average
relative mRNA expression in RA with only heterozygous (GA) allele was 2.77 ± 1.28 (N = 12)
compared to 3.40 ± 1.19 (N = 4) in healthy controls with similar SNP and normal (GG) healthy
controls (3.24 ± 1.91; N = 27). There was rare occurrence of minor (AA) allele in all samples.
Among each group, there was not any significance. Among healthy controls, the average relative
mRNA expression in samples with heterozygous (GA) or minor (AA) allele was 3.40 ± 1.19 (N

46
= 4) compared to 3.24 ± 1.91 (N = 27) normal (GG) samples. The average relative mRNA
expression with only heterozygous (GA) allele was 3.40 ± 1.19 (N = 4), where there were no
samples with minor (AA) allele. Among RA samples, the average relative mRNA expression in
samples with the heterozygous (GA) or minor (AA) allele was 2.79 ± 1.23 (N = 13) compared to
2.41 ± 1.98 (N = 24) in normal (GG) samples. The average relative mRNA expression samples
with heterozygous (GA) allele only was 2.77 ± 1.28 (N = 12) compared to 3.16 in minor (AA)
allele. There was no significant difference in the overall average relative mRNA expression in all
samples with heterozygous (GA) or minor allele (AA) and samples without any SNP.
Specifically, the average relative mRNA expression in all samples with only heterozygous (GA)
allele was 2.92 ± 1.25 (N = 16) and with only the minor (AA) allele was 3.16 (N = 1) compared
to the samples without any SNP (2.85 ± 1.97, N = 51).
Effect of PTPN2:rs478582 and PTPN22:rs2476601 on T-cell Response
To evaluate the effect of PTPN2:rs478582 and/or PTPN22:rs2476601 on T-cell function, we
treated purified T-cells from RA (N = 25) and healthy controls (N = 15) with PHA and MAP
PPD-like and measured T-cell proliferative response (Figure 5). T-cells were isolated and
purified from clinical samples, which tested positive for heterozygous and/or homozygous minor
alleles for PTPN2:rs478582 and/or PTPN22:rs2476601.
Effect of PTPN2:rs478582 on T-cell Response
Unlike T-cells from RA subjects, there was an increase in T-cell proliferation response between
healthy controls with heterozygous (TC) allele (2.1± 0.3-fold increase, N = 5) and those without
SNP (TT) (1.7 ± 0.5-fold increase, N = 5) when induced with PHA (Figure 5A). On the contrary,

47
there was 2.0 ± 0.4-fold increase (N = 5) in T-cells response in RA samples with minor (CC)
allele compared to a 1.8 ± 0.3-fold increase (N = 5) in RA normal (TT) T-cells. There was no
difference in T-cell response in healthy controls with (N = 3) and without (N = 5) minor allele.
The effect of heterozygous (TC) allele on T-cell proliferation response from healthy controls
treated with MAP PPD-like (Figure 5D) resulted in a 1.9 ± 0.3-fold increase (N = 5) compared to
only 1.4 ± 0.2-fold increase (N = 5) in normal (TT) T-cells from healthy control (p-value ≤ 0.05).
T-cells from healthy controls with minor (CC) allele responded to MAP PPD-like with 1.6 ± 0.2-
fold increase (N = 3) compared to 1.4 ± 0.2 (N = 5) in normal T-cells from healthy controls. RA
samples with heterozygous (TC) allele had a significantly higher T-cell proliferation response
fold increase to MAP PPD-like (1.9 ± 0.2, N = 5) compared to healthy controls with normal (TT)
(1.4 ± 0.2, N = 5, p-value ≤ 0.05).
Effect of PTPN22:rs2476601 on T-cell Response
The effect of heterozygous (GA) allele on T-cell proliferation response from healthy controls
treated with PHA (Figure 5B) resulted in a 2.0-fold increase (N = 1) compared to only 1.7 ± 0.5-
fold increase (N = 5) in normal (GG) T-cells from healthy controls. Similarly, T-cells from RA
subjects with heterozygous (GA) allele responded with a 2.2 ± 0.1 (N = 5) fold increase
compared to a 1.8 ± 0.3-fold increase (N = 5) in normal (GG) T-cells from RA subjects (p-value
≤ 0.05). There were no patient samples with just the minor (AA) allele to do T-cell proliferation.
The effect of heterozygous (GA) allele on T-cell proliferation response from healthy controls
treated with MAP PPD-like (Figure 5E) resulted in a 2.2 (N = 1) fold increase compared to only
1.4 ± 0.2 (N = 5) fold increase in normal (GG) T-cells from healthy controls. T-cells from RA
samples with heterozygous (GA) allele responded lower (2.3 ± 0.2-fold increase, N = 5) to MAP

48
PPD-like than normal T-cells (3.4 ± 1.8-fold increase, N = 5). RA samples with normal (GG) T-
cells had a significantly higher response to MAP PPD-like (3.4 ± 1.8, N = 5) compared to
healthy controls with normal (GG) (1.4 ± 0.2, N = 5, p-value ≤ 0.05). RA samples with
heterozygous (GA) allele had a significantly higher T-cell proliferation response to MAP PPD-
like (2.3 ± 0.2, N = 5) compared to healthy controls with normal (GG) (1.4 ± 0.2, N = 5, p-value
≤ 0.05).
Effect of Combined PTPN2:rs478582 and PTPN22:rs2476601 on T-cell Response
Response of T-cells from RA samples with both SNPs treated with PHA was 2.7 ± 2.2-fold
increase (N = 5) compared to a 1.8 ± 0.3-fold increase (N = 5) in T-cells from RA samples
without SNP (Figure 5C). There was no difference in T-cells response against PHA in samples
from healthy controls with (N = 1) and without combined SNPs (N = 5). T-cells from RA
samples with both SNPs responded to MAP PPD-like with a 7.4 ± 6.7-fold increase (N = 5)
compared to a 3.4 ± 1.8-fold increase (N = 5) in normal RA samples (Figure 5F). Similarly, T-
cells from healthy controls with combined SNPs resulted in 1.7-fold increase (N = 1) when
treated with MAP PPD-like compared to only 1.4 ± 0.2-fold increase (N = 5) in T-cells from
healthy control without SNPs.
Effect of PTPN2:rs478582 and PTPN22:rs2476601 on IFN-γ Expression
The effect of PTPN2:rs478582 and PTPN22:rs2476601 on IFN-γ expression was determined on
35 RA and 24 healthy controls (Figure 6). The average relative mRNA expression of IFN-γ in all
samples with PTPN2:rs478582 heterozygous (TC) or minor (CC) allele, regardless of disease,
was 0.39 ± 0.31 (N = 38) compared to 0.28 ± 0.16 (N = 21) in normal (TT) samples.

49
Specifically, the average relative mRNA expression of IFN-γ in all samples with
PTPN2:rs478582 minor (CC) allele was 0.48 ± 0.39 (N = 12). In RA samples, the average
relative mRNA expression of IFN-γ in samples with PTPN2:rs478582 heterozygous (TC) or
minor (CC) allele was 0.33 ± 0.32 (N = 22), compared to 0.22 ± 0.16 in 13 normal (TT) RA
samples (Figure 6A). Surprisingly, the effect of the PTPN2:rs478582 minor (CC) allele on IFN-γ
expression in RA samples was more significant (0.43 ± 0.41; N = 8). However, the average
relative mRNA expression of IFN-γ in healthy control samples with and without
PTPN2:rs478582 heterozygous (TC) or minor (CC) allele was similar [0.47 ± 0.28 (N = 16),
0.39 ± 0.12 (N = 8), respectively (Figure 6A)]. As observed in RA samples, the effect of
PTPN2:rs478582 minor (CC) allele on IFN-γ expression in healthy controls was elevated (0.58 ±
0.39; N = 4). Correlation analyses were also performed to determine if PTPN22:rs2476601 alters
IFN-γ expression (Figure 6B). In healthy controls, the average relative mRNA expression of
IFN-γ in samples with the heterozygous (GA) or minor allele (AA) for PTPN22:rs2476601 was
0.67 ± 0.28 compared to 0.40 ± 0.21 in normal (GG) samples (p-value ≤ 0.05). There was no
significant effect for PTPN22:rs2476601 heterozygous (GA) or minor allele (AA) on IFN-γ
expression in RA samples.
Effect of PTPN22:rs478582 and PTPN22:rs2476601 on Susceptibility to MAP Expression
Correlation analyses were performed to determine if PTPN2:rs479592 in RA may affected
susceptibility to MAP infection (Figure 7A). Out of 55 RA samples with either heterozygous
(TC) or minor (CC) allele for PTPN2:rs478582, 18/55 (32.7%) were positive for
MAPbacteremia compared to only 2/31 (6.5%; p-value ≤ 0.05) in healthy controls. The OR value
was 7.05 (95% CI: 1.51–32.9). Specifically, MAP presence in RA samples with only

50
heterozygous (TC) allele was 13/33 (39.3%) compared to none in 23 healthy controls samples
(p-value ≤ 0.05).
Similarly, correlation analyses were performed to determine if PTPN22:rs2476601 in RA may
affected susceptibility to MAP infection (Figure 7B). Out of 20 RA samples with either the
heterozygous or minor allele for PTPN22:rs2476601, 7/20 (35.0%) had MAPbacteremia
compared to none in healthy controls. OR value of significance was 5.00 (95% CI: 0.23–106.1).
Specifically, MAP presence in RA samples with heterozygous allele was 7/19 (36.8%) compared
to none in healthy controls. MAP was absent in all samples with minor allele.
We also investigated the PTPN2/22 expression in MAP positive samples. Overall, samples with
MAPbacteremia had an average relative PTPN2 mRNA expression of 10.0 ± 6.31 (N = 15)
compared to 9.00 ± 6.16 (N = 52) in MAP-free samples, regardless of disease. In RA samples
with MAP, the average relative mRNA expression of PTPN2 was 9.53 ± 5.42 (N = 12) compared
to 7.59 ± 5.28 (N = 25) in MAP-free samples. Only three healthy controls samples were positive
for MAP and they had average relative mRNA expression of PTPN2 11.9 ± 10.57 compared to
10.3 ± 6.71 (N = 27) in MAP-free samples. There was no change in PTPN22 expression in
samples with or without MAP.
Effect of Combined PTPN2:rs478582, PTPN22:rs2476601, and MAP on PTPN2/22 Expression
The correlation of PTPN2/22 expression in samples with either PTPN2:rs478582 or
PTPN22:rs2476601 that had MAP presence was examined as seen in Tables 4, 5. The overall
relative mRNA expression of PTPN2 was lower in RA compared to healthy controls (8.22 ± 5.33

51
and 10.3 ± 6.95, respectively). The effect of PTPN2:rs478582 on PTPN2 gene expression in RA
with heterozygous (TC) or minor (CC) allele was 8.67 ± 5.59 (N = 24) compared to 10.6 ± 7.47
(N = 23) in healthy controls with similar SNPs and lower than healthy controls without SNPs
(TT) (9.49 ± 5.13; N = 8). In MAP positive RA samples with PTPN2:rs478582, the average
relative mRNA expression of PTPN2 was 9.49 ± 6.15 compared to 6.01 ± 4.70 (N = 8) in normal
(TT) MAP-free samples. Only one healthy control sample was positive for MAP and had
heterozygous (TC) allele had an average relative mRNA expression in PTPN2 of 24.1 compared
to 8.36 ± 4.42 (N = 4) in healthy controls without MAP presence and without the SNP.
Table 4. Effect of Combined PTPN2:rs478582 and MAP Presence on PTPN2 Expression
DIAGNOSIS PTPN2 EXPRESSION OF SAMPLES
WITH PTPN2:RS478582 AND MAP
NEGATIVE
(2(-∆CT) X 1000)
PTPN2 EXPRESSION OF
SAMPLES WITH
PTPN2:RS478582 AND MAP
POSITIVE
(2(-∆CT) X 1000)
TT TC CC TC +
CC
TT TC CC TC +
CC
RA 6.0 ±
4.7
(N=8)
7.78 ±
4.67
(N=10)
9.14 ±
6.84
(N=7)
8.33 ±
5.5
(N=17)
9.59 ±
4.89
(N=5)
6.73 ±
2.57
(N=5)
16.4 ±
8.17
(N=2)
9.49 ±
6.15
(N=7)
HEALTHY 10.7 ±
5.44
(N=6)
10.3 ±
7.0
(N=18)
11.9 ±
9.73
(N=5)
10.6 ±
7.47
(N=23)
5.86 ±
0.75
(N=2)
NA 24.1
(N=1)
24.1
(N=1)

52
Table 5. Effect of Combined PTPN22:rs2476601 and MAP Presence on PTPN22 Expression
DIAGNOSIS PTPN22 EXPRESSION OF SAMPLES
WITH PTPN22:RS2476601 AND MAP
NEGATIVE
(2(-∆CT) X 1000)
PTPN22 EXPRESSION OF
SAMPLES WITH
PTPN22:RS2476601 AND MAP
POSITIVE
(2(-∆CT) X 1000)
GG GA AA GA +
AA
GG GA AA GA +
AA
RA 2.27 ±
1.72
(N=16)
2.51 ±
1.57
(N=7)
3.16
(N=1)
2.59 ±
1.47
(N=8)
2.8 ±
2.49
(N=8)
3.12 ±
0.7
(N=5)
NA 3.12 ±
0.7
(N=5)
HEALTHY 3.22 ±
1.94
(N=26)
3.4 ±
1.19
(N=4)
NA 3.4 ±
1.19
(N=4)
2.83 ±
1.95
(N=3)
NA NA NA
Similarly, relative mRNA expression of PTPN22 was also lower in RA compared to healthy
controls (2.55 ± 1.74, and 3.24 ± 1.84, respectively). The average relative mRNA expression in
RA with heterozygous (GA) or minor allele (AA) was 2.79 ± 1.23 (N = 13) compared to 3.40 ±
1.19 (N = 4) in healthy controls with similar SNP and normal (GG) healthy control (3.24 ± 1.91,
N = 27). Overall, samples with MAP presence and the PTPN22:rs2476601 heterozygous (GA)
or minor (AA) allele had an average relative mRNA expression of 3.12 ± 0.70 (N = 5) compared
to 2.85 ± 1.89 (N = 41) in normal MAP free samples. In MAP positive RA samples with
PTPN22:rs2476601, the average relative mRNA expression of PTPN22 was 3.12 ± 0.70 (N = 5)
compared to normal MAP-free (2.24 ± 1.67; N = 17). None of healthy control samples has both
MAP presence and PTPN22:rs2476601.
Only 3 RA samples had PTPN2:rs478582, PTPN22:rs2476601 and were positive for MAP.
PTPN2/22 expression and T-cell response were not significantly different from early
observation.

53
Effect of Combined PTPN2:rs478582, PTPN22:rs2476601, and MAP on IFN-γ Expression
Overall, there was no significant difference in IFN-γ mRNA expression in 59 samples with or
without MAP presence. The average relative mRNA expression in IFN-γ was 0.35 ± 0.26 in
samples with MAP present, while samples without MAP presence (N = 45) was 0.35 ± 0.28.
Similar data was observed when gene expression was evaluated in RA and healthy control
samples.
Correlation analyses were performed to determine if MAP presence with PTPN2:rs478582
heterozygous (TC) or minor (CC) allele changes gene expression of IFN-γ (Figure 8). Overall,
samples with MAP presence and PTPN2:rs478582 (N = 7) had an average relative mRNA
expression in IFN-γ of 0.43 ± 0.32, while samples without MAP presence and the SNP (N = 14)
was 0.29 ± 0.17. In RA samples, the average relative mRNA expression in IFN-γ in samples with
MAP presence and PTPN2:rs478582 (N = 6) was 0.39 ± 0.33 compared to 0.21 ±0.18 (N = 8) in
RA samples without MAP presence and without the SNP. In healthy controls, the average
relative mRNA expression in IFN-γ in samples with MAP presence and PTPN2:rs478582 (N =
1) was 0.67 compared to 0.39 ± 0.10 in healthy controls without MAP presence and without the
SNP (N = 6).
Correlation analyses were also performed to determine if MAP presence with
PTPN22:rs2476601 heterozygous (GA) or minor (AA) allele changes gene expression of IFN-γ.
Overall, samples with MAP presence and PTPN22:rs2476601 (N = 5) had an average relative
mRNA expression in IFN-γ of 0.15 ± 0.07, while samples without MAP presence and the SNP
(N = 34) was 0.32 ± 0.22. In healthy controls, there were no samples with both MAP presence

54
and PTPN22:rs2476601 together. In RA patients, the average relative mRNA expression in IFN-
γ in samples with MAP presence and the PTPN22:rs2476601 SNP (N = 5) was 0.15 ± 0.07
compared to 0.27 ± 0.24 in RA patients without MAP presence and without the SNP (N = 17).
Only 3 RA samples had PTPN2:rs478582, PTPN22:rs2476601 and were positive for MAP. IFN-
γ expression and T-cell response were not significantly different from early observation.
Effect of Medication to Susceptibility to MAPbacteremia
The effect of the medications taken by RA participants, as shown in Table 1, were evaluated for
the susceptibility of MAP. Four different medication groups were studied for MAP
susceptibility: hydroxychloroquine (TLR repressor), methotrexate (anti-folate), prednisone
(steroid), and anti-TNF-α medications (Humira®, Enbrel®, Simponi®, and Cimzia®). Out of 14
RA patients on hydroxychloroquine, 6 (42.9%) were positive for MAPbacteremia, while 12 out
of 37 (32.4%) of RA patients on methotrexate also were positive for MAPbacteremia. For RA
patients on prednisone, 4 out of 16 (25.0%) of RA patients were positive for MAPbacteremia,
while 6 out of 23 (26.1%) RA patients on anti-TNF-α medications (Humira®, Enbrel®,
Simponi®, and Cimzia®) also were positive for MAPbacteremia.
Discussion
Extensive efforts are ongoing to investigate pathogenesis and effective treatment for
inflammatory diseases. Current medications are expensive and the side effects are lengthy. For
example, RA etiology remains unknown, but there are established protocols for diagnosis of and
management of symptoms. However, the side effects of all RA medications are serious and

55
undesirable [3][8][16]. Therefore, it is imperative that the pathogenesis of RA is deciphered in
order to develop protocols for accurate and early detection and treatment of the disease. RA
patients suffer from elevation of pro-inflammatory cytokines such as IFN-γ and TNF-α and their
impact on apoptosis and development of chronic inflammation [1][3][8]. Only environmental
factors and genetic predisposition mutations have been linked to RA [2][3][22][23]. This study is
focused on investigating the effect of SNPs on key negative regulators genes such as PTPN2/22
expression and their impact on upregulation of pro-inflammatory cytokines, apoptosis and
inflammation. We hypothesized that heterozygous and/or homozygous minor allele mutation(s)
in health-keeping genes such as PTPN2/22 in RA lead to elevated IFN-γ, TNF-α, apoptosis, and
development of inflammation. To our knowledge, this is the first study designed to elucidate the
molecular cause of inflammation in RA in association with environmental triggers such as MAP.
The latter has been associated with similar inflammation in CD, T1D, multiple sclerosis, and
others [6][25][26][27][31]. This study is first to report the detection of MAP DNA in more than
of one third of RA patients (Figure 3B). The data is significant, intriguing, and should be a
motive to expand future investigations to include a larger pool of samples. As well-advertised,
the incidence of M. tuberculosis infection in RA, is among the most accepted side effect of the
treatment [1][3][16]. Therefore, detection of MAP infection in RA patients should be
investigated further as to whether it is a complication of the treatment or a possible culprit of the
disease. Although MAP IS900 DNA is good in detecting MAP presence in patient samples, it
does not provide information about the MAP bacteria viability. This in turn does not show
accurate status of either active or previous infection in the patient sample. Thus, culturing of the
blood from RA patients is necessary to determine if an active MAP infection is present in the
patients.

56
Genetic predisposing is key for susceptibility to disease, severity of inflammation and possible
ability to respond to treatment. Due to the large number of published SNPs in PTPN2/22, we
selected 9 SNPs in this study based on shared occurrence in other diseases with similar approved
treatment protocol [1][2][3][6]. Specifically, we focused on SNPs in PTPN2/22, which increase
susceptibility to RA and CD. The latter is well-investigated in our laboratory in association with
MAP [6][30][31]. This study identified PTPN2:rs478582 to be significant in RA (p-values ≤
0.05, OR = 2.28) compared to healthy controls (Figure 4A). Similarly, PTPN22:rs2476601 was
significant in RA (p-values ≤ 0.05, OR = 5.90) compared to healthy controls (Figure 4B). The
data specifically linked PTPN2:rs478582 minor (CC) allele to be more significantly associated
with RA (p-values ≤ 0.05). In short, our data suggest to clinicians that minor (CC) allele in
PTPN2 increases the risk of acquiring RA by a fold of 2.1. Moreover, PTPN22:rs2476601
heterozygous (GA) allele in PTPN22 was more significant in RA (p-values ≤ 0.05), indicating
that patients with this SNP are at risk of acquiring RA by a fold of 4.3. Further examination of
RA genotyping showed that patient samples with both PTPN2:rs478582 and PTPN22:rs2476601
alleles (regardless of heterozygous or minor alleles) showed to be more significant (p-values ≤
0.05) compared to healthy controls, showing a 6.5-fold increased risk of developing RA. Some
of the limitations of looking into SNPs in a diverse population, such as from this study, is that it
is difficult to determine the alterations of allelic distribution between different population groups.
Thus, it is important that further population studies that focus on examining PTPN2/22 SNPs
from other subpopulation groups, such as race, country of origin, and age/gender in RA patients
should be done.

57
The effect of SNPs on PTPN2/22 gene expression and function have been debated heavily in the
literature [6][33][34][35]. This study demonstrated that RA samples with either
PTPN2:rs478582/PTPN22:rs2476601 heterozygous or minor alleles could potentially alter the
PTPN2/22 gene or the protein activity of PTPN2/22 in T-cells, thus could possibly void the
negative regulatory function of PTPN2/22. The effects of PTPN2:rs478582/PTPN22:rs2476601
in PTPN2/22 were also examined further to determine the effect on T-cell and production of
IFN-γ.
Since PTPN2/22 is found in all T-cell types, we decided not to segregate the T-cell
subpopulations and instead look into total T-cell activity. However, further studies need to be
done on the effects of SNPs in PTPN2/22 in different subpopulations of T-cells. Stimulation of
T-cells from RA samples associated with PTPN2:rs478582 and induced with PHA led marked
increase in T-cell proliferation. T-cells from RA patients associated PTPN22:rs2476601 had
even more significant increase in T-cell proliferation (p-values ≤ 0.05). Moreover, it was
shockingly surprising to see T-cell reactivity response treatment with MAP PPD-like.
Specifically, T-cells, isolated from the blood of RA patients associated with
PTPN2:rs478582/PTPN22:rs2476601 combined SNPs, proliferated by several folds more than
those cells from health controls. Thus, T-cells from RA samples associated with SNPs in
PTPN2/22 seem to demonstrate three characteristics: first, they are hyperactive, second they
seem to lack a negative feedback control, and third they reacted to MAP PPD-like significantly
indicating prior exposure to MAP antigens. Hyperactive T-cells with lack of negative feedback
control may explain the marked increase in pro-inflammatory cytokines such as TNF-α and IFN-
γ in RA. The examination of T-cells in this study has been an exploratory study, thus it is

58
necessary to examine bigger populations of RA and health control subjects in the future. Along
with this, further investigation on the outcome of the other immune cells, such as B-cells, NK
cells, and macrophages, need to be examined in RA patients with SNPs in PTPN2/22 to conclude
how the hyper-proliferative T-cells react to other immune cells.
The hyperactivity to MAP PPD-like in the RA T-cells may be correlated to presence of MAP in
RA samples and possibly activation of M. tuberculosis in some RA patients with biologic drugs
treatments. The study provided more evidence that SNPs in PTPN2/22 may have increased
susceptibility to MAP infection as shown in Figure 7. Specifically, PTPN2:rs478582 correlated
with MAP infection in 32.7% (OR = 7.05) RA patients. Similarly, PTPN22:rs2476601
correlated with MAP infection in 35.0% (OR = 5.00) RA patients (p-values ≤ 0.05). The data
also demonstrated that presence of MAP did not alter PTPN2/22 expression.
To elucidate whether medications may have any effect on the outcome of this study, we
examined the effect of current medications taken by the RA participants on the risk of
susceptibility to MAP infection. As shown in Table 1, out of all the DMARDs
(hydroxychloroquine, methotrexate, prednisone, Humira®, Enbrel®, etc.) that the RA patients
were on, hydroxychloroquine was found to increase MAP susceptibility the most in RA patients
by a 1.3-fold change compared to RA patients not on hydroxychloroquine and had
MAPbacteremia. These findings suggest that more investigation is needed by testing larger
number of patients with RA. We also discovered that IFN-γ expression was lower in RA patients
who are on DMARDs treatment compared to RA patients who are on different treatments (Table
1). Specifically, blood samples from RA patients treated with Humira® expressed lower IFN-γ

59
(0.15 ± 0.10, N = 11) compared to blood samples from other RA patients (0.29 ± 0.27; p-values
≤ 0.05) or even healthy controls (0.44 ± 0.24; p-values ≤ 0.05). Moreover, RA samples
associated with PTPN2:rs478582/PTPN22:rs2476601 heterozygous or minor alleles had higher
IFN-γ expression than RA group without (Figure 6). These finding demonstrates that SNPs in
PTPN2/22 may led to elevated IFN-γ levels and inflammation in RA patients. However, since we
focused only on PTPN2/22 on the control of IFN-γ expression in this study, we did not examine
the other cytokines that control IFN-γ production. Further investigation is needed to examine the
effects of both pro-inflammatory cytokines, such as TNF-α, and anti-inflammatory cytokines,
such as IL-6, in subjects with SNPs in PTPN2/22.
Overall, the data supports our hypothesis that SNPs in PTPN2/22 leads to loss functions of these
genes resulting in hyper-proliferative T-cells and increase susceptibility to Mycobacteria
including MAP. Along with genetic testing for SNPs and proper treatment, personalized
treatment for RA is plausible. More studies are encouraged to explore the incidence and impact
of these SNPs on health keeping genes and susceptibility to infection in RA.

60
Figures
Figure 2. Effect of SNPs in PTPN2/22 on T-cell Response

61
Figure 3. Detection of Mycobacterium avium subspecies paratuberculosis (MAP) in blood
samples from RA
Nested PCR was performed on genomic DNA from blood samples from RA subjects (A) and
healthy controls (B). DNA from MAP strain UCF4 was used as a positive control (+); a negative
control (without DNA template) was also included (−). M corresponds with molecular weight
marker. *:P-values ≤ 0.05.

62
Figure 4. Genotyping of 9 SNPs in PTPN2/22 in RA

63
(A) Represents the allele frequency in PTPN2: rs1893217, rs2542151, rs7234029, rs478582. (B) Represents the allele frequency
in PTPN22: rs2476601, rs2488457, rs33996649, rs34209542, rs2476599. (C) Represents haplotype combinations between
PTPN2:rs478582 and PTPN22:rs2476601 including T-G (major/major), C-G (heterozygous or minor/major), T-A
(major/heterozygous or minor), and C-A (minor/minor). *:P-values ≤ 0.05.

64
Figure 5. T-cell Response in RA Associated with PTPN2:rs478582 and PTPN22:rs2476601
(A,B) Against Phytohematoagglutonin (PHA). (D,E) Against MAP Purified Protein Derivative-
Like (PPD-Like). PTPN2:rs478582- heterozygous allele (TC), minor allele (CC), and wild type
(TT). PTPN22:rs2476601-heterozygous allele (GA), minor allele (AA), and wild type (GG). The

65
effect of combined SNPs in PTPN2/22 in T-cells induced with either PHA or MAP PPD-like is
illustrated in (C,F). *: P-values ≤ 0.05.
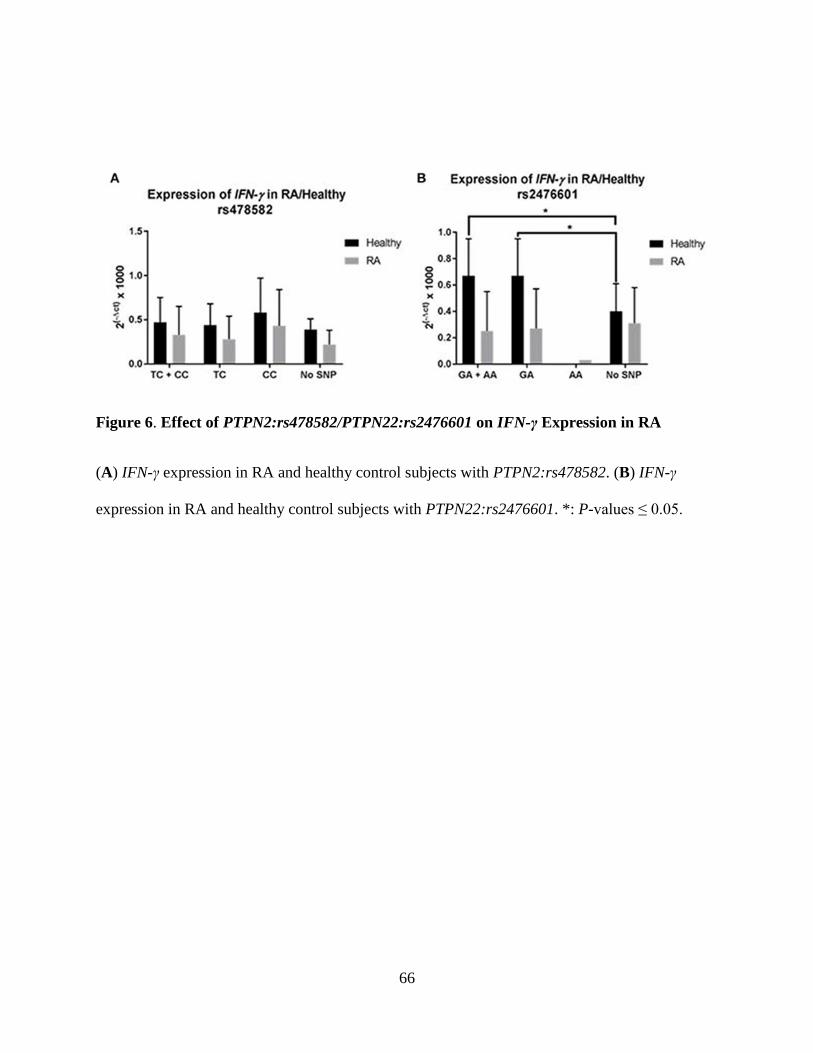
66
Figure 6. Effect of PTPN2:rs478582/PTPN22:rs2476601 on IFN-γ Expression in RA
(A) IFN-γ expression in RA and healthy control subjects with PTPN2:rs478582. (B) IFN-γ
expression in RA and healthy control subjects with PTPN22:rs2476601. *: P-values ≤ 0.05.

67
Figure 7. Effect of PTPN2:rs478582 and PTPN22:rs2476601 on Susceptibility to MAP
Infection
(A) MAP in the blood from RA and healthy samples associated with PTPN2:rs478582
[heterozygous allele (TC), minor allele (CC) and combined alleles (TC + CC)]. (B) MAP in the
blood from RA and healthy samples-associated with PTPN22:rs2476601 [heterozygous allele
(GA), minor allele (AA), and combined alleles (GA + AA)]. *: P-values ≤ 0.05.

68
Figure 8. Combined Effect of MAP and PTPN2:rs478582 on IFN-γ Expression in RA.

69
References
[1]. McInnes, I. B., and Schett, G. (2011). The pathogenesis of rheumatoid arthritis. N. Engl. J.
Med., 365:2205–2219. doi: 10.1056/NEJMra1004965
[2]. Yarwood, A., Huizinga, W. J., and Worthington, J. (2014). The genetics of rheumatoid
arthritis: risk and protection in different stages of the evolution of RA. Rheumatology, 55:199–
209. doi: 10.1093/rheumatology/keu323
[3]. Smolen, J. S., Aletha, D., and McInnes, I. B. (2016). Rheumatoid arthritis. Lancet., 388:22–
28. doi: 10.1016/S0140-6736(16)30173-8
[4]. Brennan, F. M., and McInnes, I. B. (2008). Evidence that cytokines play a role in rheumatoid
arthritis. J. Clin. Invest., 118:3537–3545. doi: 10.1172/JCI36389
[5]. Gurzov, E. N., Stanley, W. J., Brodnicki, T. C., and Thomas, H. E. (2015). Protein tyrosine
phosphatases: molecular switches in metabolism and diabetes. Trends Endocrinol. Metab.,
26:30–39. doi: 10.1016/j.tem.2014.10.004
[6]. Sharp, R. C., Abdulrahim, M., Naser, E. S., and Naser, S. A. (2015). Genetic variations in
PTPN2 and PTPN22: role in the pathogenesis of type 1 diabetes and Crohn's disease. Front.
Cell. Infect. Microbiol., 5:95. doi: 10.3389/fcimb.2015.00095
[7]. Aletaha, D., Neogi, T., Silman, A. J., Funovits, J., Felson, D. T., Bingham, C. O. III., et al.
(2010). 2010 Rheumatoid arthritis classification criteria: an American college of
rheumatology/European league against rheumatism collaborative initiative. Arthritis Rheum.,
62:2569–2581. doi: 10.1002/art.27584
[8]. Majithia, V., and Geraci, S. A. (2007). Rheumatoid arthritis: diagnosis and management.
Am. J. Med., 120:936–939. doi: 10.1016/j.amjmed.2007.04.005

70
[9]. Nishimura, K., Sugiyama, D., Kogata, Y., Tsuji, G., Nakazawa, T., Kawano, S., et al. (2007).
Meta-analysis: diagnostic accuracy of anti-cyclic citrullinated peptide antibody and rheumatoid
factor for rheumatoid arthritis. Ann. Intern. Med., 146:797–808. doi: 10.7326/0003-4819-146-11-
200706050-00008
[10]. Egerer, K., Feist, E., and Burmester, G. (2009). The serological diagnosis of rheumatoid
arthritis. Dtsch. Arztebl. Int., 106:159–163. doi: 10.3238/arztebl.2009.0159
[11]. Pincus, T., and Sokka, T. (2009). Laboratory tests to assess patients with rheumatoid
arthritis: advantages and limitations. Rheum. Dis. Clin. North Am., 35:731–734. doi:
10.1016/j.rdc.2009.10.007
[12]. Taylor, P., Gartemann, J., Hsieh, J., and Creeden, J. (2011). A systematic review of serum
biomarkers anti-cyclic citrullinated peptide and rheumatoid factor as tests for rheumatoid
arthritis. Autoimmune Dis., 2011:1–18. doi: 10.4061/2011/815038
[13]. Smolen, J. S., Aletaha, D., Koeller, M., Weisman, M. H., and Emery, P. (2007). New
therapies for treatment of rheumatoid arthritis. Lancet., 3701:861–1874. doi: 10.1016/S0140-
6736(07)60784-3
[14]. Fakhrudin, N., Hastuti, S., Andriani, A., Widyarini, S., and Nurrochmad, A. (2015). Study
on the antiinflammatory activity of Artocarpus altilis leaves extract in mice. Int. J.
Pharmacognosy Phytochem. Res., 7:1080–1085
[15]. Bartelds, G. M., Wijbrandts, C. A., Nurmohamed, M. T., Stapel, S., Lems, W. F., Aarden,
L., et al. (2007). Clinical response to adalimumab: relationship to anti-adalimumab antibodies
and serum adalimumab concentrations in rheumatoid arthritis. Ann. Rheum. Dis., 66:921–926.
doi: 10.1136/ard.2006.065615

71
[16]. Dixon, W. G., Hyrich, K. L., Watson, K. D., Lunt, M., Galloway, J., Ustianowski, A., et al.
(2010). Drug-specific risk of tuberculosis in patients with rheumatoid arthritis treated with anti-
TNF therapy: results from the British Society for Rheumatology Biologics Register (BSRBR).
Ann. Rheum. Dis., 69:522–528. doi: 10.1136/ard.2009.118935
[17]. Allen, P. B., Olivera, P., Emery, P., Moulin, D., Jouzeau, J. Y., Netter, P., et al. (2017).
Review article: moving towards common therapeutic goals in Crohn's disease and rheumatoid
arthritis. Aliment. Pharmacol. Ther., 45:1058–1072. doi: 10.1111/apt.13995
[18]. Kuek, A., Hazleman, B. L., and Ostor, A. J. K. (2007). Immune-mediated inflammatory
diseases (IMIBs) and biological therapy: a medical revolution. Postgrad. Med. J., 978:251–260.
doi: 10.1136/pgmj.2006.052688
[19]. Georgiadis, A. N., Tzambouras, N., Ioachim, E., Tsianos, E. V., Agnantis, N., and Drosos,
A. A. (2003). Seropositive rheumatoid arthritis associated with Crohn's disease. Clin. Exp.
Rheumatol., 21:363–365.
[20]. Zhernakova, A., van Diemen, C. C., and Wijmenga, C. (2009). Detecting shared
pathogenesis from the shared genetics of immune-related diseases. Nat. Rev. Genet., 10:43–55.
doi: 10.1038/nrg2489
[21]. Voight, B. F., and Cotsapas, C. (2012). Human genetics offers an emerging picture of
common pathways and mechanisms in autoimmunity. Curr. Opin. Immunol., 24:552–557. doi:
10.1016/j.coi.2012.07.013
[22]. Klareskog, L., Malmstrom, V., Lundberg, K., Padyukov, L., and Alfredsson, L. (2011).
Smoking, citrullination and genetic variability in the immunopathogenesis of rheumatoid
arthritis. Semin. Immunol., 23:92–98. doi: 10.1016/j.smim.2011.01.014

72
[23]. Fisher, B. A., Cartwright, A. J., Quirke, A. M., de Pablo, P., Romaguera, D., Panico, S., et
al. (2015). Smoking, Porphyromonas gingivalis and the immune response to citrullinated
autoantigens before the clinical onset of rheumatoid arthritis in a Southern European nested case-
control study. BMC Musculoskelet. Disord., 16:331. doi: 10.1186/s12891-015-0792-y
[24]. Ebringer, A., and Wilson, C. (2000). HLA molecules, bacteria and autoimmunity. J. Med.
Microbiol., 49:305–311. doi: 10.1099/0022-1317-49-4-305
[25]. Naser, S. A., Collins, M. T., Crawford, J. T., and Valentine, J. F. (2009). Culture of
Mycobacterium avium subspecies paratuberculosis (MAP) from the blood of patients with
Crohn's disease: a follow-up blind multi center investigation. Open Inflamm. J., 2:22–23.
[26]. Naser, S. A., Thanigachalam, S., Dow, C. T., and Collins, M. T. (2013). Exploring the role
of Mycobacterium avium subspecies paratuberculosis in the pathogenesis of type 1 diabetes
mellitus: a pilot study. Gut Pathog., 5:14. doi: 10.1186/1757-4749-5-14
[27]. Masala, S., Paccagnini, D., Cossu, D., Brezar, V., Pacifico, A., Ahmed, N., et al. (2011).
Antibodies recognizing Mycobacterium avium paratuberculosis epitopes cross-react with the
beta-cell antigen ZnT8 in Sardinian type 1 diabetic patients. PLoS ONE, 6:e26931. doi:
10.1371/journal.pone.0026931
[28]. Kvien, T. K., Uhlig, T., Odegard, S., and Heiberg, M. S. (2006). Epidemiological aspects of
rheumatoid arthritis. Ann. N. Y. Acad. Sci., 1069:212–222. doi: 10.1196/annals.1351.019
[29]. van Vollenhoven, R. F. (2009). Sex differences in rheumatoid arthritis: more than meets the
eye…. BMC Med., 7:12. doi: 10.1186/1741-7015-7-12
[30]. Naser, S. A., Ghobrial, G., Romero, C., and Valentine, J. F. (2004). Culture of
Mycobacterium avium subspecies paratuberculosis from the blood of patients with Crohn's
disease. Lancet, 364:1039–1044. doi: 10.1016/S0140-6736(04)17058-X

73
[31]. Naser, S. A., Romero, C., Elwasila, S., Ghonaim, M., Naser, N., and Valentine, J. F.
(2009). Functional dysregulation of PBMC and PMN in Crohn's Disease. Open Inflamm. J.,
2:24–33. doi: 10.2174/1875041900902010024
[32]. Sullivan, R. R., Faris, B. R., Eborn, D., Grieger, D. M., Cino-Ozuna, A. G., and Rozell, T.
G. (2013). Follicular expression of follicle stimulating hormone receptor variants in the ewe.
Reprod. Biol. Endocrinol., 11:113. doi: 10.1186/1477-7827-11-113
[33]. Vang, T., Congia, M., Macis, M. D., Musuemci, L., Orru, V., Zavattari, P., et al. (2005).
Autoiumme-associated lymphoid tyrosine phosphatase is a gain-of-function variant. Nat. Genet.,
37:1317–1319. doi: 10.1038/ng1673
[34]. Serrano, A., Marquez, A., Mackie, S. L., Carmona, F. D., Solans, R., Miranda-Filloy, J. A.,
et al. (2013). Identification of the PTPN22 functional variant R620W as susceptibility genetic
factor for giant cell arteritis. Ann. Rheum. Dis., 72:1882–1886. doi: 10.1136/annrheumdis-2013-
203641
[35]. Spalinger, M. R., Lang, S., Weber, A., Frei, P., Fried, M., Rogler, G., et al. (2013). Loss of
protein tyrosine phosphatase nonreceptor type 22 regulates interferon-gamma-induced signialing
in human monocytes. Gastroenterology, 144:978–988. doi: 10.1053/j.gastro.2013.01.048

74
CHAPTER THREE: ROLE OF PTPN2/22 POLYMORPHISMS IN
PATHOPHYSIOLOGY OF CROHN’S DISEASE
Note: This chapter has been published in part and the citation link is: Sharp, R.C., Beg, S.A., and
Naser, S.A. (2018). Role of PTPN2/22 polymorphisms in pathophysiology of Crohn’s disease.
World J. Gastroenterol., 24: 657-670. doi: 10.3748/wjg.v24.i6.657
Introduction
With a majority of autoimmune diseases sharing the SNPs with each other in immune regulatory
genes, such as PTPN2/22, it is possible that the pathogenesis of these disorders could also share
some of the same common environmental triggers with each other as well (Figure 9)
[1][2][3][4][5]. Recent studies have shown that MAP infections have been associated with a
variety of different inflammatory disorders including CD [6][7][8][9][10]. Mycobacterial
infections causes problems in these autoimmune disease patients when the patient is genetically
predisposed, causing the immune system to become dysregulated [6][7][8][9][10]. This
dysregulation will lead to high amounts of pro-inflammatory cytokines, production of
autoantibodies, and high amounts of apoptosis occurring in a variety of cell types, thus leading to
chronic inflammation [6][7][8][9][10].
In addition to sharing the same genetic predispositions and environmental triggers, many
autoimmune diseases share the same medical treatments as well. For instance, anti-TNF-α
therapeutics such as adalimumab and infliximab are used for RA and CD [1][2]. However, anti-
TNF-α medications along with NSAIDs, glucocorticoids, and other disease-modifying drugs
cause several side effects [1][2][3][4][5]. These side effects include osteoporosis, hypertension,
GI intolerance, autoantibodies against medications, and increased risk of developing

75
opportunistic infections, especially mycobacterial infections [1][2][3][4][5]. With the undesirable
side effects of these medications, it is important that the pathophysiology of autoimmune
diseases, such as CD, are thoroughly examined in order to develop more accurate detection of
disease and to develop more personal treatment with little side effects.
In this study, we focus on the pathogenesis of CD, where we explore the effect of both the
genetic predisposition of SNPs in PTPN2/22 and the environmental trigger of MAP infection.
We hypothesize that SNPs in PTPN2/22 lead to loss of negative regulation in T-cells and, with a
MAP infection, increases production of pro-inflammatory cytokines such as IFN-γ. This leads to
an increase inflammation and apoptosis in the intestinal tissues of CD patients.
Materials and Methods
Clinical Samples
A total of 133 consented CD subjects and healthy controls donated two to three 4.0 mL K2-
EDTA coded blood tubes for us in this study. The study was approved by the University of
Central Florida Institutional Review Board #IRB00001138. Each subject completed and signed a
written consent form before samples were collected. Healthy control subjects completed a survey
that question if said subjects had any medical abnormality (CD, T1D, RA or “other diseases”).
No healthy control subjects had any type of medical conditions to the best of their knowledge.
The severities of the CD subjects’ symptoms were scored from moderate to severe symptoms.
The average age of CD subjects was 39.6 ± 14.3 with a gender ratio of 48.6% male and 51.4%
female. The average age of healthy controls was 30.7 ± 13.4 with a gender ratio of 41.9% male
and 58.1% female subjects. Table 6 lists age, gender and other demographic information for all

76
CD subjects in this study. From the blood tubes, the following procedures were done to the
samples: PTPN2/22 genotyping, gene expression profiling, MAP IS900 nPCR detection, and T-
cell proliferation assays.
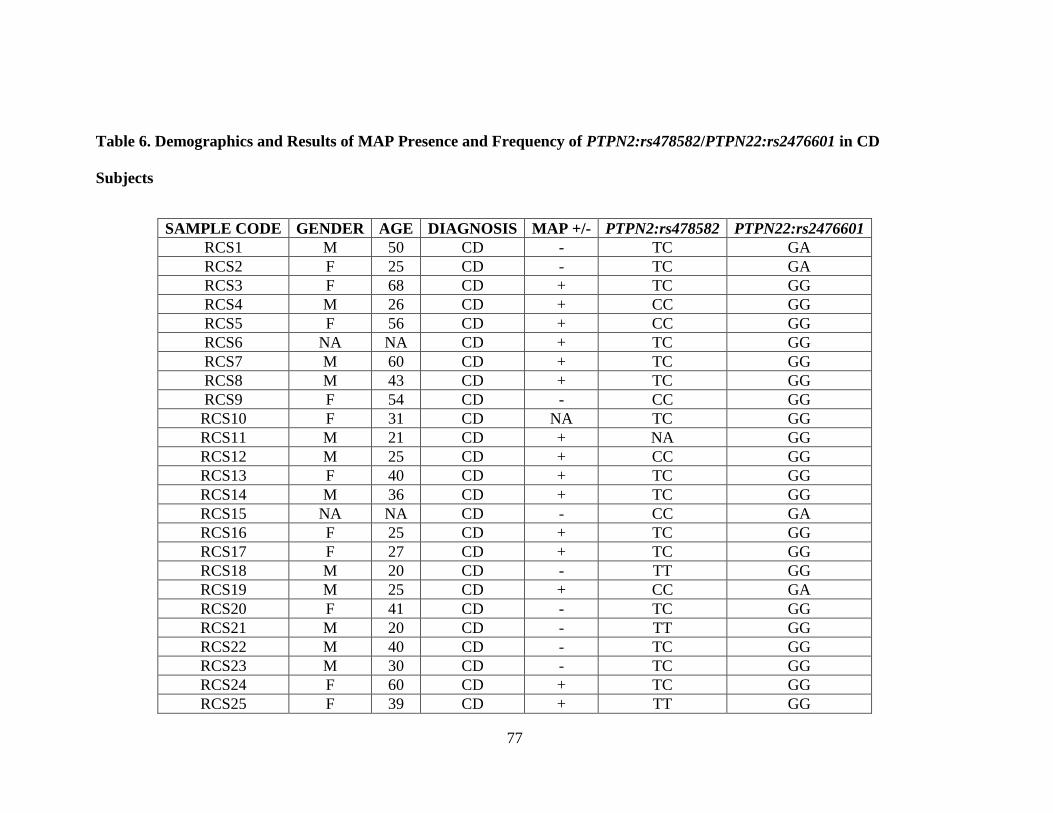
77
Table 6. Demographics and Results of MAP Presence and Frequency of PTPN2:rs478582/PTPN22:rs2476601 in CD
Subjects
SAMPLE CODE GENDER AGE DIAGNOSIS MAP +/- PTPN2:rs478582 PTPN22:rs2476601
RCS1 M 50 CD - TC GA
RCS2 F 25 CD - TC GA
RCS3 F 68 CD + TC GG
RCS4 M 26 CD + CC GG
RCS5 F 56 CD + CC GG
RCS6 NA NA CD + TC GG
RCS7 M 60 CD + TC GG
RCS8 M 43 CD + TC GG
RCS9 F 54 CD - CC GG
RCS10 F 31 CD NA TC GG
RCS11 M 21 CD + NA GG
RCS12 M 25 CD + CC GG
RCS13 F 40 CD + TC GG
RCS14 M 36 CD + TC GG
RCS15 NA NA CD - CC GA
RCS16 F 25 CD + TC GG
RCS17 F 27 CD + TC GG
RCS18 M 20 CD - TT GG
RCS19 M 25 CD + CC GA
RCS20 F 41 CD - TC GG
RCS21 M 20 CD - TT GG
RCS22 M 40 CD - TC GG
RCS23 M 30 CD - TC GG
RCS24 F 60 CD + TC GG
RCS25 F 39 CD + TT GG

78
SAMPLE CODE GENDER AGE DIAGNOSIS MAP +/- PTPN2:rs478582 PTPN22:rs2476601
RCS26 F 30 CD + CC GA
RCS27 F 43 CD + CC GG
RCS28 M 30 CD + TC GA
RCS29 M 28 CD + TC GG
RCS30 M 66 CD + TT GG
RCS31 M 53 CD - TT GG
RCS32 M 28 CD - TC GA
RCS33 F 38 CD + CC GG
RCS34 M 44 CD - CC GA
RCS35 M 53 CD - TC GG
RCS36 M 24 CD + TC GG
RCS37 F 51 CD + TC GG
RCS38 F 46 CD + TC GG
RCS39 M 24 CD - CC GG
RCS40 F 63 CD + TC GG
RCS41 F 25 CD - TC GG
RCS42 F 66 CD - TC GG
RCS43 F 27 CD + TC GG
RCS44 F 25 CD + TC GG
RCS45 F 38 CD + TC GG
RCS46 F 26 CD - CC AA
RCS47 M 54 CD + TT GA
RCS48 F 31 CD + TC GG
RCS49 M 56 CD - CC GG
RCS50 F 53 CD - TC GG
RCS51 F 51 CD - TT GA
RCS52 F 23 CD + TC GG
RCS53 M 26 CD + TC GG
RCS54 M 38 CD - TT GG
RCS55 F 31 CD + TC GG
RCS56 M 61 CD + TC GG

79
SAMPLE CODE GENDER AGE DIAGNOSIS MAP +/- PTPN2:rs478582 PTPN22:rs2476601
RCS57 F 24 CD + TC GG
RCS58 M 57 CD - CC GG
RCS59 F 30 CD + TT GG
RCS60 M 51 CD - CC GG
RCS61 F 55 CD - CC GG
RCS62 F 61 CD - TT GG
RCS63 F 31 CD + TC GG
RCS64 F 56 CD NA TC GG
RCS65 M 25 CD + NA NA
RCS66 F 53 CD + NA NA
RCS67 M 30 CD - TC GG
RCS68 F 49 CD - CC GG
RCS69 M 28 CD + TT GG
RCS70 M 26 CD + TT GG
RCS71 M 26 CD + CC GG
RCS72 M 58 CD + CC GG
CD: Crohn’s Disease
*: TT = Homozygous Major Allele/No SNP
TC = Heterozygous Allele
CC = Homozygous Minor Allele
**: GG = Homozygous Major Allele/ No SNP
GA = Heterozygous Allele
AA = Homozygous Minor Allele

80
PTPN2/22 Genotyping
TaqMan™ SNP Genotyping Assays (Applied Biosystems™) were used to genotype nine SNPs
in PTPN2/22 from the isolated DNA from subjects’ blood samples. Samples and reagents were
sent to the University of Florida Pharmacotherapy and Translational Research Department
(Gainesville, FL) to perform genotyping assays. Out of the nine SNPs, four SNPs were specific
to PTPN2 that includes rs1893217, rs2542151, rs7234029, rs478582 along with five SNPs that
were specific to PTPN22 that includes rs2476601, rs2488457, rs33996649, rs34209542,
rs2476599. Briefly, DNA was extracted from whole blood samples using QIAamp® DNA Blood
Mini Kit (Qiagen™) following manufacturer’s protocol. TaqMan™ genotyping assays for
PTPN2/22 SNPs were performed on DNA samples following manufacturer protocol (Applied
Biosystems™). Briefly, DNA samples and the TaqMan™ SNP Genotyping Assays mixtures
(primers with Vic and Fam fluorophore attachment) were transferred into a 384-well plate along
with 2 × TaqMan™ Master Mix and 20 × Assay Working Stock in each well. Plates were treated
to an RT-PCR protocol consisting of 95 °C for 10 min for 1 cycle, 92 °C for 15 s and 58 °C for 1
min for 50 cycles. The plates were then read for VIC (551 nm) and FAM (517 nm) fluorescence,
where VIC or FAM alone determined allele 1 or allele 2 in the samples, while VIC and FAM
together determined heterozygous for each allele in the samples.
PTPN2/22 and IFN-γ Gene Expression
Gene expression of PTPN2/22 and IFN-γ was performed by converting RNA from subjects’
whole blood samples to cDNA and performing RT-PCR. RNA from the subjects’ blood samples

81
were isolated from peripheral leukocytes via TRIzol® Reagent (Invitrogen) per manufacturer’s
instruction. Briefly, 1.0 mL of whole blood from subjects’ samples were transferred into a
microcentrifuge tubes and centrifuged for 3,000 rpm for 15 min until the leukocytes formed a
buffy coat layer, which was then transferred to new 2.0 mL RNase free microcentrifuge tubes.
Tubes containing the leukocytes from subjects’ samples were then suspended in 1.0 mL of
TRIzol®, where the tubes were incubated and gently rocked for 15 min at room temperature.
Next, 0.2 mL of chloroform was then mixed in each tube and then incubated at room temperature
for 3 min. Tubes were then centrifuged at 11,400 rpm for 15 min at 4 °C, where afterwards the
upper aqueous phase containing RNA was transferred to new 2.0 mL RNase free microcentrifuge
tubes. Next, 0.5 mL of 100% isopropanol was added to the tubes containing subjects’ RNA
samples, where they were incubated at room temperature for 10 min. Tubes were then
centrifuged at 11,400 rpm for 10 min at 4 °C, where afterwards the RNA pellets were washed in
1 mL of 75% ethanol. Washed RNA pellets were then centrifuged for 8700 rpm for 5 min at 4 °C
and then air-dried until fully dried. Dried RNA pellets were then suspended in 20 μL of RNase
free H2O and boiled to 60 °C for 10 min.
Conversion of RNA to cDNA was done following the iScript™ Reverse Transcription (Bio-
Rad®) manufacturer’s instruction. RNA concentration from each subjects’ samples were first
quantified via NanoDrop ND-1000 Spectrophotometer (ThermoFisher Scientific®) and then
diluted to 600 ng of total RNA. Next, diluted RNA samples were then added to PCR reaction
tubes that contained 0.2 mL PCR reaction, 4 μL of iScript™ Reverse Transcription (Bio-Rad®),
and up to 20 μL RNase free H2O. The PCR reaction tubes then underwent a PCR protocol

82
consisting of 5 min at 25 °C, 20 min at 46 °C and 1 min at 95 °C, where the final concentration
of cDNA for each sample was 30 ng/μL.
For the RT-PCR reaction, 1 μL of cDNA (30 ng) was added to a 96-well microamp plates along
with 10 μL of Fast SYBR Green Mastermix (ThermoFisher Scientific®), 1 μL of PrimePCR
SYBR Green Assay mix (Bio-Rad®) specific to target gene, and 8 μL of sterile H2O. For the
positive control for the RT-PCR reactions, the 18s RNA gene was the target to determine if the
reaction work and to obtain baseline CT readings. The oligonucleotide primers for the 18s RNA
gene that were used for the RT-PCR reaction was the following: forward primer: 5’-GTA ACC
CGT TGA ACC CCA TT-3’ and reverse primer: 5’-CCA TCC AAT CGG TAG TAG CG-3’.
RT-PCR reactions were performed using the 7500 Fast Real-Time PCR System (Applied
Biosystems®), where relative gene expression levels were calculated using ∆CT (sample gene
CT reading-18s RNA gene CT baseline reading) and using the equation (2(-∆CT) × 1,000).
Detection of MAP IS900 DNA
MAP IS900 DNA was detected via nPCR from cultured peripheral leukocytes that were isolated
from the subjects’ blood samples as described previously [11]. Briefly, subjects’ blood sample
tubes were centrifuged for 3,000 rpm for 10 min at room temperature, where the buffy coat layer
containing peripheral leukocytes was present and transferred to new sterile 2.0 mL
microcentrifuge tubes. The peripheral leukocytes were then washed twice by adding double the
volume of red cell lysis buffer (ammonium chloride solution, G-Biosciences®) to each tube and
incubating/gently rocking for 10 min and then centrifuged at 5,000 rpm for 5 min at room
temperature. The supernatant from each subjects’ samples were then removed and the isolated

83
peripheral leukocyte pellets were re-suspended in TE buffer. The isolated pellets were then
cultured in BD Bactec™ MGIT™ Para-TB medium (Becton, Dickinson and Company©) tubes
supplemented with 800 uL of Bactec™ MGIT™ Para-TB Supplement (Becton, Dickinson and
Company©) for six months at 37 °C in a BD Bactec™MGIT™ 320 Analyzer (Becton,
Dickinson and Company©).
After six months of culturing, subjects’ cultured samples underwent DNA extraction by using a
modified DNAzol® (ThermoFisher Scientific®) extraction protocol as follows. A 2.0 mL
sampling of culture from each subjects’ tubes were obtained and pipetted into new sterile 2.0 mL
microcentrifuge tubes. The tubes were then centrifuged at 13,000 rpm for 2.5 min, where
afterwards the supernatant was discarded from the tubes and the culture pellets were saved. The
subjects’ culture pellet tubes were then mixed with 1.0 mL DNAzol® reagent and then mixed
with 400 μL of 100% isopropanol. The tubes were then incubated for 15 min at room
temperature followed by centrifugation at 8,000 rpm for 6 min, where afterwards the supernatant
was discarded, leaving a DNA pellet. DNA pellets from the subjects’ samples were then washed
once with 500 μL DNAzol® reagent and centrifuged at 8,000 rpm for 5 min. Supernatant was
then discarded from the tubes and the DNA pellets were then washed again with 1.0 mL of 75%
ethanol, where they were centrifuged at 8,000 rpm for 5 min. DNA pellets were then dried after
supernatant was removed via speedvac for 5 min. The dried DNA pellets were then dissolved in
50 μL of TE buffer.
MAP IS900 DNA was then detected in each subjects’ samples by the use of our nPCR protocol
and nucleotide primers as described previously [11]. Subjects were considered to have MAP

84
presence when a 298 bp band on a 2% agarose gel is shown after nPCR reaction. The positive
MAP DNA control that was used originated from our laboratory cultured clinical strain UCF4,
which was isolated from a CD patient. The negative controls for each PCR step that was used
contained all PCR reagents except for the DNA template used in the reactions.
T-cell Isolation and Proliferation Assay
T-cells were fully isolated from subjects’ whole blood samples by the use of RosetteSep™
Human T-cell Enrichment Cocktail (StemCell™ Technology) as per manufacture’s instruction.
For the T-cell isolation and proliferation assays, the entire T-cell populations were examined in
this study and were not segregated by subpopulations. Briefly, 50 μL/mL of RosetteSep™
Human T-cell Enrichment Cocktail was added to each subjects’ whole blood samples and was
incubated at 20 min at room temperature. Samples were then diluted with equal volumes of PBS
with 2% fetal bovine serum (FBS, Sigma-Aldrich®) and mixed gently. The mixtures from each
subjects’ samples were then layered on top of a Lymphoprep™ (Axis-Shield®) density medium
in a separated tube and centrifuged for 20 min at 2,500 rpm at room temperature. Separated T-
cells from each subjects’ samples were then found on top of the density medium layer and were
collected into new sterile 2.0 mL microcentrifuge tubes and washed twice with PBS with 2%
FBS.
Subjects’ isolated T-cells were then plated on a 96-well plate, where T-cell proliferation assays
were done using bromodeoxyuridine (BrdU) labeling proliferation ELISA kit (Roche Molecular
Biochemicals®) as described previously [12]. To stimulate the subjects’ isolated T-cells,
phytohematoagglutunin (PHA) was used as a positive control mitogen. The test mitogen used in

85
the T-cell proliferation assays was purified protein derivative-like (PPD-like) from UCF4 MAP
bacterial cultures that were prepared by purification of supernatant from sonicated protein
extract. Briefly, 1 × 10⁵ isolated T-cells from each subjects’ samples were transferred in
triplicates to 96-well plates and incubated in the following conditions: RPMI-1640 (Sigma-
Aldrich®) only, PHA (10 μg/mL, Sigma-Aldrich®) or MAP PPD-like (5 μg/mL) along with
respected subjects’ plasma. The plates were then incubated for 72 h at 37 °C and 5% CO2 and
then labeled with 20 μL/well of BrdU and incubated again for 24 h at 37 °C and 5% CO2. The T-
cell proliferation assay was done through the Roche BrdU proliferation ELISA kit as described
previously [12]. Relative T-cell proliferation levels of samples were compared to the control
group (isolated T-cells in RPMI only) by examining the fold change in the absorbance reading of
each well at 450 nm.
Statistical Analysis
Samples were analyzed for significance using unpaired, two-tailed t-tests; unpaired, two-tailed z-
scores; and odds ratio. GraphPad Prism 7 was used for statistical analysis and creation of graphs.
P-values < 0.05 were considered significant.
Results
PTPN2/22 SNP Allele Frequency in CD
Allele frequency of the nine SNPs examined in PTPN2/22 found in both CD subjects and healthy
controls are shown in Figure 10. All genotyped samples were found in Hardy-Weinberg
equilibrium. Out of the four SNPs found in PTPN2 (rs1893217, rs2542151, rs7234029, and
rs478582), rs478582 was significant in the CD, where heterozygous (TC) or minor (CC) alleles

86
when examined together were detected in 57/69 (82.6%) in CD compared to 36/59 (61.0%)
healthy controls (OR = 3.03, 95% CI: 1.35-6.84, P-values < 0.05, Figure 10A). Specifically, the
heterozygous (TC) alleles were detected in 38/69 (55.1%) CD compared to the 28/59 (47.5%) of
healthy controls, while homozygous (CC) alleles were detected in 19/69 (27.5%) CD compared
to 8/59 (13.6%) healthy controls. SNPs rs1893217, rs2542151, and rs7234029 were found to be
not significant in CD compared to the healthy controls. Out of the five SNPs specific to PTPN22
(rs2476601, rs2488457, rs33996649, rs34209542, and rs2476599), none of SNPs were
considered significant in CD compared to the healthy controls (Figure 10B). However, since
PTPN22:rs2476601 is found significantly in various inflammatory autoimmune diseases, we
continued to investigate the SNP in more detail along with PTPN2:rs478582
[6][13][14][15][16][17]. For PTPN22:rs2476601, CD with either heterozygous (GA) or minor
(AA) alleles were detected in 11/70 (15.7%) subjects, while 4/62 (6.45%) was detected in
healthy controls (OR = 2.7, 95% CI: 0.81-8.98, P-values > 0.05). Specifically, the heterozygous
(GA) alleles were detected in 10/70 (14.3%) CD compared to the 4/62 (6.45%) of healthy
controls, while homozygous (AA) alleles were rare in all samples.
For confirmation that CD subjects were significant in having SNP alleles for PTPN2:rs478582
and PTPN22:rs2476601, determination of haplotype combinations were done (Figure 10C).
Examination of the following haplotype combinations between PTPN2:rs478582 and
PTPN22:rs2476601 were examined: T-G, C-G, T-A, and C-A. The T-G haplotype (major/major)
was found more significantly in the healthy controls (21/59 = 35.6%) than in CD (10/69 =
14.5%, P-values < 0.05). The C-G haplotype (heterozygous or minor/major) and the C-A
(heterozygous or minor/heterozygous or minor) were found more in CD (48/69 = 69.6%; 9/69 =

87
13.0%, respectively) than in healthy controls (34/59 = 57.6%; 2/59 = 3.39%, respectively). The
C-A haplotype was found more significantly in CD than the healthy controls (P-values < 0.05).
Relationship of PTPN2:rs478582 and PTPN22:rs2476601 on Expression on PTPN2/22 and
IFN-γ in CD
The average relative gene expression (2(-∆CT) × 1,000) of PTPN2, regardless of SNPs, in CD was
significantly lower (5.27 ± 2.68, n = 38) than in healthy controls (10.5 ± 6.95, n = 30, P-values <
0.05, Figure 11A). Similarly, the average relative gene expression of PTPN22, regardless of
SNPs, was also significantly lower in CD (1.76 ± 1.12, n = 38) than in healthy controls (3.24 ±
1.84, n = 30, P-values < 0.05, Figure 11B). The evaluation of the effect of PTPN2:rs478582 and
PTPN22:rs2476601 on expression of PTPN2/22 and IFN-γ was determined.
For subjects with either heterozygous (TC) or minor (CC) alleles in PTPN2:rs478582, regardless
of disease, expression of PTPN2 did not change when compared to the normal (TT) subjects.
However, when examining the CD and healthy control subjects in each allele group, CD overall
had a lower average relative gene expression of PTPN2. The average relative gene expression in
CD with heterozygous (TC) or minor (CC) alleles in PTPN2:rs478582 was significantly lower
(5.34 ± 2.77, n = 31) compared to 10.2 ± 7.15 (n = 21) in healthy controls with similar SNPs (P-
values < 0.05). Specifically, when examining subjects with heterozygous (TC) alleles in
PTPN2:rs478582, CD average relative gene expression was 5.22 ± 2.57 (n = 22), which was
significantly lower than the healthy controls with heterozygous (TC) alleles (10.5 ± 7.15, n = 17,
P-values < 0.05). When examining subjects with homozygous (CC) alleles in PTPN2:rs478582,
CD average relative gene expression was 5.64 ± 3.37 (n = 9), which was lower than the healthy
controls with homozygous (CC) alleles (8.89 ± 8.03, n = 4).

88
For subjects with either heterozygous (GA) or minor (AA) alleles in PTPN22:rs2476601,
regardless of disease, expression of PTPN22 did not change when compared to the normal (GG)
subjects. However, when examining the CD and healthy control subjects in each allele group,
CD overall had a lower average relative gene expression of PTPN22. The average relative gene
expression in CD with heterozygous (GA) or minor (AA) alleles in PTPN22:rs2476601 was
significantly lower (1.58 ± 0.93, n = 6) compared to 3.40 ± 1.19 (n = 4) in healthy controls with
similar SNPs (P-values < 0.05). Specifically, when examining subjects with heterozygous (GA)
alleles in PTPN22:rs2476601, CD average relative gene expression was 1.48 ± 1.00 (n = 5),
which was significantly lower than the healthy controls with heterozygous (GA) alleles (3.40 ±
1.19, n = 4, P < 0.05). Minor (AA) alleles in PTPN22:rs2476601 was rare in all subjects.
Correlation analyses were performed to determine if expression of relative gene expression of
IFN-γ changed in subjects with PTPN2:rs478582 or PTPN22:rs2476601 (Figure 11C and 11D,
respectively). The average relative gene expression of IFN-γ in CD subjects with the
PTPN2:rs478582 heterozygous (TC) or minor (CC) allele was 0.41 ± 0.31 (n = 38), which was
significantly higher compared to the CD subjects with normal (TT) alleles (0.21 ± 0.22, n = 12, P
< 0.05). Specifically, CD subjects with the heterozygous (TC) allele had significantly higher
(0.41 ± 0.31, n = 24, P < 0.05) IFN-γ relative gene expression than CD subjects with normal
(TT) alleles, while CD subjects with the minor (CC) alleles had higher gene expression as well
(0.40 ± 0.31, n = 14). There was no significant change in IFN-γ relative gene expression in the
CD subjects with the PTPN22:rs2476601 heterozygous (GA) or minor (AA) alleles. However, in
healthy controls, subjects with the heterozygous (GA) or minor (AA) alleles had a significantly

89
higher gene expression (0.67 ± 0.28, n = 4, P < 0.05) than healthy controls with normal (GG)
alleles (0.40 ± 0.21, n = 20).
Effect of PTPN2:rs478582 and PTPN22:rs2476601 on Susceptibility of MAP Infection in CD
Overall detection of MAP IS900 DNA was found in CD and healthy control subjects and were
correlated with PTPN2:rs478582 and PTPN22:rs2476601 (Table 7). Out of 70 CD subjects, 43
(61.4%) were positive for MAPbacteremia compared to only 4/48 (9.33%) of healthy controls (P
< 0.05, OR = 17.5, 95% CI: 5.65-54.3).
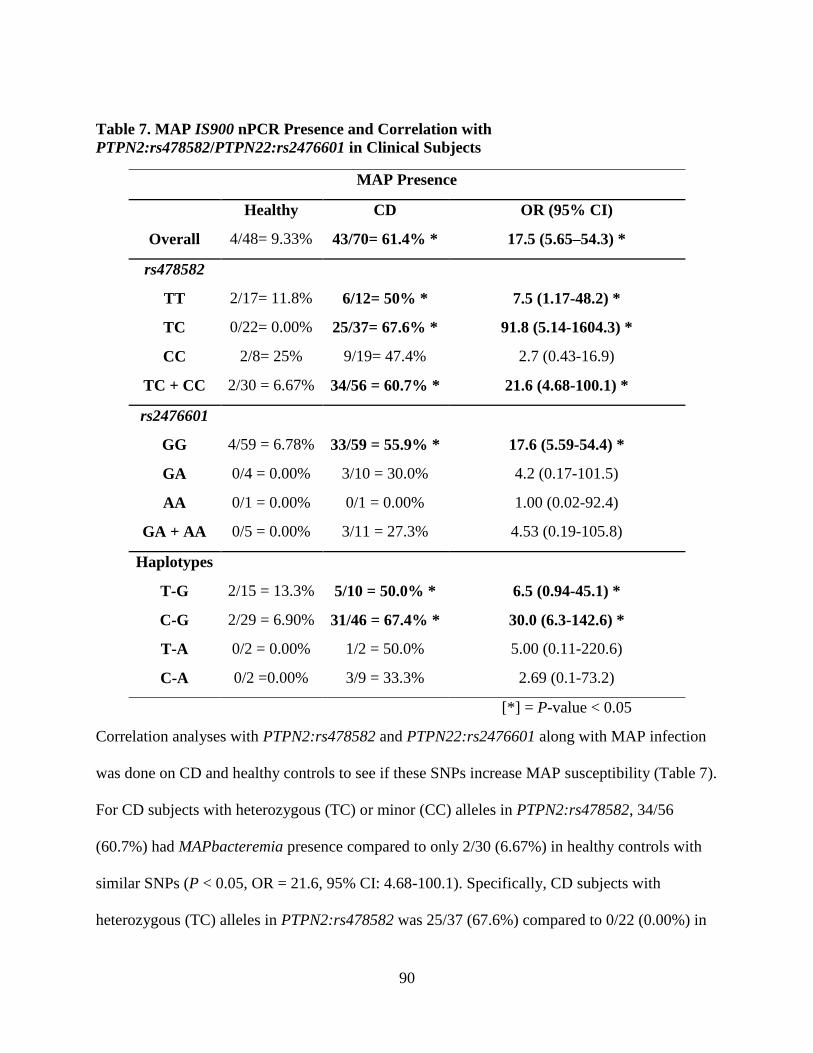
90
Table 7. MAP IS900 nPCR Presence and Correlation with
PTPN2:rs478582/PTPN22:rs2476601 in Clinical Subjects
MAP Presence
Healthy CD OR (95% CI)
Overall 4/48= 9.33% 43/70= 61.4% * 17.5 (5.65–54.3) *
rs478582
TT 2/17= 11.8% 6/12= 50% * 7.5 (1.17-48.2) *
TC 0/22= 0.00% 25/37= 67.6% * 91.8 (5.14-1604.3) *
CC 2/8= 25% 9/19= 47.4% 2.7 (0.43-16.9)
TC + CC 2/30 = 6.67% 34/56 = 60.7% * 21.6 (4.68-100.1) *
rs2476601
GG 4/59 = 6.78% 33/59 = 55.9% * 17.6 (5.59-54.4) *
GA 0/4 = 0.00% 3/10 = 30.0% 4.2 (0.17-101.5)
AA 0/1 = 0.00% 0/1 = 0.00% 1.00 (0.02-92.4)
GA + AA 0/5 = 0.00% 3/11 = 27.3% 4.53 (0.19-105.8)
Haplotypes
T-G 2/15 = 13.3% 5/10 = 50.0% * 6.5 (0.94-45.1) *
C-G 2/29 = 6.90% 31/46 = 67.4% * 30.0 (6.3-142.6) *
T-A 0/2 = 0.00% 1/2 = 50.0% 5.00 (0.11-220.6)
C-A 0/2 =0.00% 3/9 = 33.3% 2.69 (0.1-73.2)
[*] = P-value < 0.05
Correlation analyses with PTPN2:rs478582 and PTPN22:rs2476601 along with MAP infection
was done on CD and healthy controls to see if these SNPs increase MAP susceptibility (Table 7).
For CD subjects with heterozygous (TC) or minor (CC) alleles in PTPN2:rs478582, 34/56
(60.7%) had MAPbacteremia presence compared to only 2/30 (6.67%) in healthy controls with
similar SNPs (P < 0.05, OR = 21.6, 95% CI: 4.68-100.1). Specifically, CD subjects with
heterozygous (TC) alleles in PTPN2:rs478582 was 25/37 (67.6%) compared to 0/22 (0.00%) in

91
healthy controls with heterozygous (TC) alleles (P < 0.05, OR = 91.8, 95% CI: 5.14-1640.3).
The CD subjects with heterozygous (TC) or minor (CC) alleles group (34/56 = 60.7%) and CD
subjects with heterozygous (TC) allele group (25/37 = 67.6%) in PTPN2:rs478582 had higher
MAPbacteremia compared to CD subjects with normal (TT) alleles (6/12 = 50%).
For CD subjects with heterozygous (GA) alleles in PTPN22:rs2476601, 3/10 (30.0%) had
MAPbacteremia compared to 0/4 (0.00%) in healthy controls with heterozygous (GA) alleles
(OR = 4.2, 95% CI: 0.17-101.5). Presence of MAPbacteremia was rare in all subjects with the
minor (AA) allele.
Correlation of haplotype combinations of PTPN2:rs478582 and PTPN22:rs2476601 alleles on
susceptibility to MAPbacteremia was analyzed, where CD subjects with the C-G haplotype
(heterozygous or minor/major) had 31/46 (67.4%) with MAPbacteremia presence compared to
2/29 (6.90%) of healthy controls with the C-G haplotype (P-values < 0.05, OR = 30.0, 95%CI:
6.3-142.6). The T-A haplotype (major/heterozygous or minor) and the C-A haplotype
(heterozygous or minor/heterozygous or minor) was rare in all samples. However, CD subjects
with the T-A haplotype had 1/2 (50.0%) with MAPbacteremia presence compared to the 0/2
(0.00%) in healthy controls with the T-A haplotype, while CD subjects with the C-A haplotype
had 3/9 (33.3%) with MAPbacteremia presence compared to the 0/2 (0.00%) in healthy controls
with the C-A haplotype.

92
Relationship of Combined MAP Presence with PTPN2:rs478582 and PTPN22:rs2476601 on
Expression of PTPN2/22 and IFN-γ in CD
When examining CD and healthy control subjects with or without MAPbacteremia presence
alone, there was no change in PTPN2/22 and IFN-γ relative gene expression when examining
correlation data. However, PTPN2/22 was significantly lower in CD subjects than in the health
control subjects regardless of MAPbacteremia presence or not. CD subjects who had
MAPbacteremia presence had an average relative gene expression of 5.25 ± 2.58 (n = 21) in
PTPN2 compared to the healthy controls with MAPbacteremia presence (11.9 ± 10.5, n =3, P <
0.05). CD subjects who had an absence of MAPbacteremia presence had an average relative gene
expression of 5.28 ± 2.87 (n = 17) in PTPN2 compared to the healthy controls without
MAPbacteremia presence (10.3 ± 6.71, n = 27, P < 0.05). For PTPN22 average relative gene
expression, CD subjects with MAPbacteremia presence had 1.73 ± 0.97 (n = 21) compared to
healthy controls with MAPbacteremia presence (2.83 ± 1.94, n = 3). CD subjects without
MAPbacteremia presence had an average relative gene expression of 1.81 ± 1.31 (n = 17) in
PTPN22 compared to the healthy controls without MAPbacteremia presence (3.29 ± 1.86, n =
27, P-values < 0.05).
The effect of combined MAPbacteremia presence and either PTPN2:rs478582 or
PTPN22:rs2476601 did not significantly change PTPN2/22 expression in all CD and healthy
control samples. However, when examining the combined effects of MAPbacteremia presence
and either PTPN2:rs478582 or PTPN22:rs2476601, the average relative gene expression of IFN-
γ does increase in subjects compared to subjects without MAPbacteremia presence and no SNPs.
For CD subjects with both MAPbacteremia and heterozygous (TC) or minor (CC) alleles in

93
PTPN2:rs478582, the average relative gene expression of IFN-γ was higher (0.40 ± 0.29 n = 22)
compared to the CD subjects without MAPbacteremia and PTPN2:rs478582 (0.23 ± 0.31, n = 5,
Figure 12). For CD subjects with both MAPbacteremia and heterozygous (GA) or minor (CC)
alleles in PTPN22:rs2476601, the average relative gene expression of IFN-γ was higher (0.42 ±
0.32, n = 4) compared to the CD subjects without MAPbacteremia and PTPN22:rs2476601 (0.37
± 0.31, n = 18).
T-cell Proliferation Response in CD
T-cell functionality when SNPs and MAPbacteremia was presented in subjects was determined
in five CD and five healthy control subjects. All five CD subjects that had their T-cell response
tested had SNPs in either PTPN2:rs478582 and/or PTPN22:rs2476601, while the five healthy
control subjects had no observed SNPs present. Overall, when the subjects’ T-cells were treated
with PHA, the average overall fold change in the CD subjects was 2.22 ± 1.36 (n = 5) fold
increase compared to the healthy controls (1.67 ± 0.51 fold increase, n = 5). Similarly, when the
same T-cells were treated with MAP PPD-like, the average overall fold change in CD subjects
was 2.01 ± 0.79 (n = 5) compared to the healthy controls (1.39 ± 0.24 fold increase, n = 5).
Out of the five CD subjects, 3/5 were tested for having MAPbacteremia presence. When
examining T-cells treated with PHA from CD subjects tested positive for MAPbacteremia
presence, the average overall fold change was 2.7 ± 1.65 (n = 3) compared to the CD subjects’ T-
cells that were absence of MAPbacteremia presence and treated with PHA (1.51 ± 0.51 fold
increase, n = 2). Similarly, when the same T-cells were treated with MAP PPD-like, the average

94
overall fold change in CD subjects with MAPbacteremia was 2.5 ± 0.59 (n = 3) compared to the
CD subjects’ T-cells without MAPbacteremia presence (1.27 ± 0.12 fold increase, n = 2).
Discussion
The pathogenesis of CD, as with other autoimmune diseases, involves both genetic pre-
disposition leading to higher immune responses and an environmental trigger that exacerbates
the immune response. However, with current diagnosis and treatment, it has been difficult to
treat CD symptoms due to loss of treatment response and many side effects [1][2][3][4][5]. Thus,
understanding the key elements of CD pathogenesis (genetic SNPs and environmental triggers),
it is possible to find new treatment targets for the disease and new diagnosis techniques as well.
CD pathogenesis is very dependent on the overproduction of pro-inflammatory cytokines such as
TNF-α and IFN-γ, which promote chronic inflammation, increased granuloma formation, and
increased apoptosis of intestinal tissues [3][4][18][19]. Since the majority of CD medications are
blocking pro-inflammatory cytokines such as TNF-α and IFN-γ, other types of targets has been
ignored [1][2][3][4][5] [18][19]. This study is focused on finding new targets for both diagnosis
and treatment of CD, where we looked into the SNPs of negative regulatory genes PTPN2/22
and their impact on: increased production of pro-inflammatory cytokines, apoptosis,
mycobacterial susceptibility, and inflammation. To our knowledge, this is the first study to look
into SNPs in both PTPN2/22 together along with correlation with gene expression and MAP
susceptibility in CD.
The effect of SNPs in PTPN2/22 in CD pathogenesis has been highly debated in the literature,
thus we selected nine SNPs that not only was found associated with CD, but with other diseases

95
as well [6][14][15][16][17][20][21][22]. Out of the nine SNPs examined in this study,
PTPN2:rs478582 was found to be significant in CD (P-values < 0.05, OR = 3.03) compared to
the healthy controls (Figure 10A). Although PTPN22:rs2476601 was found to not be significant
to CD (P > 0.05, OR = 2.7) compared to the healthy controls, we continued to study the effects
of the SNP along with PTPN2:rs478582 due to PTPN22:rs2476601 being associated with
autoimmune diseases in general (Figure 10B) [6][13][14][15][16][17][20][21][22]. Since a
diverse population (no restriction on race, place of origin, age, or gender) was used in this study,
alterations of allele distribution in the SNPs could possibly happen due to SNPs overall
fluctuating between different population groups[6][13][14][15][16][17][20][21][22]. Further
isolated population studies on PTPN2/22 SNPs in CD subjects need to be investigated more.
Knowledge of which SNP is more associated with CD could possibly be used as a diagnosis tool
for clinicians when examining patients with CD like symptoms.
Gene expression of PTPN2/22 correlated with the SNPs PTPN2:rs478582 and
PTPN22:rs2476601 was also done to determine if the SNPs did change PTPN2/22 levels.
Although overall PTPN2/22 expression was significantly decreased in CD subjects (P < 0.05,
Figure 11A and 11B), the SNPs PTPN2:rs478582 and PTPN22:rs2476601 did not change gene
expression between normal, heterozygous, or minor alleles. However, IFN-γ gene expression
was found significantly higher in both CD and healthy controls (P < 0.05) along with an overall
increased T-cell activity in subjects that had heterozygous/minor alleles in either
PTPN2:rs478582 and/or PTPN22:rs2476601 (Figure 11C and 11D). These correlation analyzes
shows that the SNPs PTPN2:rs478582 and PTPN22:rs2476601 may not necessarily change the
regulation of the PTPN2/22 gene, but could possible disrupt the protein activity of PTPN2/22.

96
For the PTPN2:rs478582 SNP, a base change (T > C) in intron 3 occurs, where it is theorized
that splicing problems could occur during the RNA splicing [23][24][25][26]. This could lead to
loss of activity in the protein once fully translated [23][24][25][26]. The PTPN22:rs2476601
SNP is a base change (G > A) that occurs in exon 14, which physically changes the amino acid
arginine (R) to a tryptophan (W) on the 620 amino acid residue on the catalytic portion of the
PTPN22 protein [17][24][25][26]. It has been highly debated what the R620W does to the
PTPN22 protein, but it is suspected to cause the protein to be less active [17][24][25][26].
Overall, the SNPs PTPN2:rs478582 and PTPN22:rs2476601 seem to cause a loss of function in
PTPN2/22, thus leading to less negative regulated T-cells. This will lead to a high production of
pro-inflammatory cytokines, which will lead to increased inflammation/apoptosis in intestinal
tissues in CD subjects. Other SNPs in PTPN2/22 will need to be studied further to see if those
SNPs will alter gene expression of PTPN2/22 instead of PTPN2:rs478582 and
PTPN22:rs2476601 just altering protein activity. Although we only examined the effect of
PTPN2/22 on the expression of IFN-γ, other factors do control IFN-γ expression and production.
These include cytokines, such as TNF-α and IL-12, which stimulate T-cell production of IFN-γ
and cytokines, such as IL-6 and IL-10, which decrease T-cell production of IFN-γ [27].
However, since CD and other inflammatory autoimmune disorders are T-cell mediated, we
focused only on PTPN2/22 regulation on IFN-γ expression. This is due to PTPN2/22 ultimately
acting as negative regulators of T-cell activity and thus controlling IFN-γ production from T-
cells. Further investigation of the effect of these other regulatory IFN-γ production cytokines in
subjects with SNPs in PTPN2/22 is needed.

97
Although the role MAP has been studied in CD pathogenesis extensively, correlation studies
with SNPs in PTPN2/22 and MAP susceptibility have not been done before until this study
[4][6][7][8][9][10][11][12][18]. Overall, the correlation analyzes of SNPs in PTPN2/22 and
MAPbacteremia presence showed that the SNPs might have increased susceptibility in CD
subjects (Table 7). Specifically, 60.7% (OR = 21.6, P < 0.05) of CD subjects with
PTPN2:rs478582 SNP (heterozygous or minor group) had MAPbacteremia presence, while
27.3% (OR = 4.53) subjects with the PTPN22:rs2476601 SNP (heterozygous or minor group)
had MAPbacteremia. Limitations however in the detection of MAP IS900 DNA from the blood
of subjects’ samples do not provided the information that the MAP bacteria is alive or dead, thus
does not show active infection or previous infection. Further culturing of the blood from the
subjects is necessary to determine live MAP infection in the subjects examined. The findings
found in this study suggest that SNPs in PTPN2/22 increases susceptibility to MAPbacteremia,
which is possible due to the lack of negative regulation in the T-cells. Since T-cells control
macrophage activity and mycobacterial species such as MAP can survive in infected
macrophages, it is important that the T-cells are regulated correctly in order to prevent MAP
infection [28][29][30][31][32]. If problems involving the PTPN2/22 gene regulation or function
the PTPN2/22 protein occurs, T-cells will be overactive and in turn will make macrophages
overactive as well (Figure 13) [28][29][30][31][32]. This increased activity of macrophages will
not only lead to increased pro-inflammatory cytokines like TNF-α, but could allow MAP and
other intracellular pathogens to survive and grow faster due to the increased activation of newer
macrophages [28][29][30][31][32].This is why SNPs in PTPN2/22 and the hyperactivity of T-
cells should increase susceptibility to intracellular pathogens such as MAP.

98
To further test if T-cells from the CD subjects with the PTPN2:rs478582 and the
PTPN22:rs2476601 were overactive, we induced isolated T-cells from CD subjects with either
PHA or MAP PPD-like. Although we did not isolate out total T-cell populations from mucosal
intestinal tissues and instead from peripheral blood draws, we believe that T-cell proliferation
will be the same regardless of the source of origin. This is possible due to PTPN2/22 being found
in every T-cell population, regardless of the site of isolation, thus SNPs in PTPN2/22 should
affect all T-cells in the body in the same way. Overall, CD subjects with the SNPs proliferated
more than healthy controls without the SNPs. In addition, CD subjects who had MAPbacteremia
presence and SNPs in PTPN2/22 proliferated more than CD subjects who did not have
MAPbacteremia presence. These analyzes showed that for T-cells to become overactive, both
SNPs in PTPN2/22 and the presence of MAPbacteremia is required to induce the pathogenesis
process of CD. This is further evidence that for the pathogenesis of any autoimmune disease,
both genetic predisposition and an environmental trigger are needed to cause disease. Further
investigation in gene expression of pro-inflammatory cytokines produced (IFN-γ for example) by
T-cells after being induced with antigens need to be examined. Along with this, further
investigation of subpopulations of T-cell activity is needed to determine which T-cell population
is more active in subjects with SNPs in PTPN2/22.
Overall, SNPs in PTPN2/22 lead to overactive T-cell activity and increased susceptibility to
intracellular pathogens such as MAP. With genetic testing for SNPs and detection/treatment for
mycobacterial infections such as MAP, it is possible for personalized treatment of CD to be an
option. Further studies in SNPs in PTPN2/22 and other immunity specific genes need to be
researched and correlated with bacterial infections to improve CD diagnosis and treatment.

99
Figures
Figure 9. Shared Genetic Predispositions and Environmental Triggers between Common
Autoimmune Diseases
For autoimmune diseases, many share the same treatments and some of the same genetic single
nucleotide polymorphisms in specific immunity genes. Thus, it is possible that these disorders
share the same environmental triggers as well, such as Mycobacterium avium subspecies
paratuberculosis (MAP) bacterial infection.

100
Figure 10. Allele Frequency in Nine Single Nucleotide Polymorphisms in Crohn’s Disease and Healthy Control Subjects
101
A: Represents allele frequency of PTPN2 SNPs: rs1893217, rs2542151, rs7234029, rs478582; B: Represents allele frequency of
PTPN22 SNPs: rs2476601, rs2488457, rs33996649, rs34209542, rs2476599; C: Represents haplotype combinations
PTPN2:rs478582 and PTPN22:rs2476601. *: P < 0.05, healthy vs CD. T-G: Major/major; C-G: SNP/major; T-A: Major/SNP; C-
A: SNP/SNP.

102
Figure 11. Relative mRNA Expression (2(-∆CT) × 1000) of PTPN2, PTPN22 and IFN-γ
Relative mRNA expression of PTPN2 (A) and PTPN22 (B) in CD and healthy control subjects.
Relative mRNA expression of IFN-γ was correlated with CD and healthy control subjects with
either PTPN2:rs478582 (C) or PTPN22:2476601 (D). *: P < 0.05.

103
Figure 12. The Effect of Both Mycobacterium avium subspecies paratuberculosis and
PTPN2:rs478582 on IFN-γ Gene Expression in Crohn’s Disease and Healthy Control
Subjects

104
Figure 13. Complex Interaction of Crohn’s Disease Pathophysiology
The effect of single nucleotide polymorphisms (SNPs) in protein tyrosine phosphatase non-
receptor type 2 and 22 (PTPN2/22) and Mycobacterium avium subspecies paratuberculosis
(MAP) in a dysregulated immune response in Crohn’s disease (CD).

105
References
[1]. Cheifetz, A.S. and Feuerstein, J.D. (2017). Treatment of Inflammatory Bowel Disease with
Biologics. Springer International Publishing. doi: https://doi.org/10.1007/978-3-319-60276-9
[2]. Smolen, J.S., Aletaha, D., and McInnes, I.B. (2016). Rheumatoid arthritis. Lancet, 388:2023-
2038. doi: 10.1016/S0140-6736(16)30173-8
[3]. Kuek, A., Hazleman, B.L., and Ostör, A.J. (2007). Immune-mediated inflammatory diseases
(IMIDs) and biologic therapy: a medical revolution. Postgrad Med. J., 83:251-260. doi:
10.1136/pgmj.2006.052688
[4]. Qasem, A., Naser, A.E., and Naser S.A. (2017). The alternate effects of anti-TNFα
therapeutics and their role in mycobacterial granulomatous infection in Crohn’s disease. Expert
Rev. Anti. Infect. Ther., 15:637-643. doi: https://doi.org/10.1080/14787210.2017.1328276
[5]. Allen, P.B., Olivera, P., Emery, P., Moulin, D., Jouzeau, J.Y., Netter, P., Danese, S., Feagan,
B., Sandborn, W.J., Peyrin-Biroulet, L. (2017). Review article: moving towards common
therapeutic goals in Crohn’s disease and rheumatoid arthritis. Aliment Pharmacol Ther.,
45:1058-1072. doi: 10.1111/apt.13995
[6]. Sharp, R.C., Abdulrahim, M., Naser, E.S., and Naser, S.A. (2015). Genetic Variations of
PTPN2 and PTPN22: Role in the Pathogenesis of Type 1 Diabetes and Crohn’s Disease. Front
Cell Infect Microbiol., 5:95. doi: 10.3389/fcimb.2015.00095
[7]. Naser, S.A., Thanigachalam, S., Dow, C.T., and Collins, M.T. (2013). Exploring the role of
Mycobacterium avium subspecies paratuberculosis in the pathogenesis of type 1 diabetes
mellitus: a pilot study. Gut Pathog., 5:14. doi: 10.1186/1757-4749-5-14
106
[8]. Naser, S.A., Collins, M.T., Crawford, J.T., and Valentine, J.F. (2010). Culture of
Mycobacterium avium subspecies paratuberculosis (MAP) from the Blood of Patients with
Crohn’s disease: A Follow-Up Blind Multi Center Investigation. Open Inflamm J., 3:22-23.
[9]. Masala, S., Paccagnini, D., Cossu, D., Brezar, V., Pacifico, A., Ahmed, N., Mallone, R., and
Sechi, L.A. (2011). Antibodies recognizing Mycobacterium avium paratuberculosis epitopes
cross-react with the beta-cell antigen ZnT8 in Sardinian type 1 diabetic patients. PLoS One.,
6:e26931. doi: 10.1371/journal.pone.0026931
[10]. Sechi, L.A. and Dow, C.T. (2015). Mycobacterium avium ss. paratuberculosis Zoonosis -
The Hundred Year War - Beyond Crohn’s Disease. Front Immunol., 6:96. doi:
10.3389/fimmu.2015.00096
[11]. Naser, S.A., Ghobrial, G., Romero, C., and Valentine, J.F. (2004). Culture of
Mycobacterium avium subspecies paratuberculosis from the blood of patients with Crohn’s
disease. Lancet, 364:1039-1044. doi: 10.1016/S0140-6736(04)17058-X
[12]. Naser, S.A., Romero, C., Elwasila, S., Ghonaim, M., Naser, N., and Valentine, J,F. (2009).
Functional Dysregulation of PBMC and PMN in Crohn’s Disease. Open Inflamm. J., 2:24-33.
doi: 10.2174/1875041900902010024
[13]. Hewagama, A. and Richardson, B. (2009). The genetics and epigenetics of autoimmune
diseases. J Autoimmun., 33:3-11. doi: 10.1016/j.jaut.2009.03.007
[14]. Gurzov, E.N., Stanley, W.J., Brodnicki, T.C., and Thomas, H.E. (2015). Protein tyrosine
phosphatases: molecular switches in metabolism and diabetes. Trends Endocrinol Metab., 26:30-
39. doi: 10.1016/j.tem.2014.10.004

107
[15]. Serrano, A., Márquez, A., Mackie, S.L., Carmona, F.D., Solans, R., Miranda-Filloy, J.A.,
Hernández-Rodríguez, J., Cid, M.C., Castañeda, S., and Morado, I.C. (2013). Identification of
the PTPN22 functional variant R620W as susceptibility genetic factor for giant cell arteritis.
Ann. Rheum. Dis., 72:1882-1886. doi: 10.1136/annrheumdis-2013-203641
[16]. Spalinger, M.R., Lang, S., Weber, A., Frei, P., Fried, M., Rogler, G., and Scharl, M. (2013).
Loss of protein tyrosine phosphatase nonreceptor type 22 regulates interferon-γ-induced
signaling in human monocytes. Gastroenterology, 144:978-988.e10. doi:
10.1053/j.gastro.2013.01.048
[17]. Qu, H., Tessier, M.C., Hudson, T.J., and Polychronakos, C. (2005). Confirmation of the
association of the R620W polymorphism in the protein tyrosine phosphatase PTPN22 with type
1 diabetes in a family based study. J. Med. Genet., 42:266-270. doi: 10.1136/jmg.2004.026971
[18]. Naser, S.A., Sagramsingh, S.R., Naser, A.S., and Thanigachalam, S. (2014).
Mycobacterium avium subspecies paratuberculosis causes Crohn’s disease in some
inflammatory bowel disease patients. World J. Gastroenterol., 20:7403-7415. doi:
10.3748/wjg.v20.i23.7403
[19]. Manuc, T.E., Manuc, M.M., and Diculescu, M.M. (2016). Recent insights into the
molecular pathogenesis of Crohn’s disease: a review of emerging therapeutic targets. Clin. Exp.
Gastroenterol., 9:59-70. doi: 10.2147/CEG.S53381
[20]. Glas, J., Wagner, J., Seiderer, J., Olszak, T., Wetzke, M., Beigel, F., Tillack, C., Stallhofer,
J., Friedrich, M., and Steib, C. (2012). PTPN2 gene variants are associated with susceptibility to

108
both Crohn’s disease and ulcerative colitis supporting a common genetic disease background.
PLoS One., 7:e33682. doi: 10.1371/journal.pone.0033682
[21]. Barrett, J.C., Hansoul, S., Nicolae, D.L., Cho, J.H., Duerr, R.H., Rioux, J.D., Brant, S.R.,
Silverberg, M.S., Taylor, K.D., Barmada, M.M., and et al. (2008). Genome-wide association
defines more than 30 distinct susceptibility loci for Crohn’s disease. Nat Genet., 40:955-962. doi:
10.1038/ng.175
[22]. Waterman, M., Xu, W., Stempak, J.M., Milgrom, R., Bernstein, C.N., Griffiths, A.M.,
Greenberg, G.R., Steinhart, A.H., and Silverberg, M.S. (2011). Distinct and overlapping genetic
loci in Crohn’s disease and ulcerative colitis: correlations with pathogenesis. Inflamm. Bowel
Dis., 17:1936-1942. doi: 10.1002/ibd.21579
[23]. Espino-Paisan, L., de la Calle, H., Fernández-Arquero, M., Figueredo, M.A., de la Concha,
E.G., Urcelay, E., and Santiago, J.L. (2011). A polymorphism in PTPN2 gene is associated with
an earlier onset of type 1 diabetes. Immunogenetics, 63:255-258. doi: 10.1007/s00251-010-0500-
x
[24]. Hendriks, W.J. and Pulido, R. (2013). Protein tyrosine phosphatase variants in human
hereditary disorders and disease susceptibilities. Biochim. Biophys. Acta., 1832:1673-1696. doi:
10.1016/j.bbadis.2013.05.022
[25]. Vang, T., Miletic, A.V., Bottini, N., and Mustelin, T. (2007). Protein tyrosine phosphatase
PTPN22 in human autoimmunity. Autoimmunity, 40:453-461. doi: 10.1080/08916930701464897

109
[26]. Zikherman, J. and Weiss, A. (2011). Unraveling the functional implications of GWAS: how
T cell protein tyrosine phosphatase drives autoimmune disease. J. Clin. Invest., 121:4618-4621.
doi: 10.1172/JCI60001
[27]. Schoenborn, J.R. and Wilson, C.B. (2007). Regulation of interferon-gamma during innate
and adaptive immune responses. Adv. Immunol., 96:41-101. doi: 10.1016/S0065-2776(07)96002-
2
[28]. Janeway Jr, C.A., Travers, P., Walport, M,, and Shlomchik, M.J. (2001). Macrophage
activation by armed CD4 TH1 cells. Immunobiology: The Immune System in Health and
Disease, 5th edition
[29]. Prezzemolo, T., Guggino, G., La Manna, M.P., Di Liberto, D., Dieli, F., and Caccamo, N.
(2014) Functional Signatures of Human CD4 and CD8 T Cell Responses to Mycobacterium
tuberculosis. Front Immunol., 5:180. doi: 10.3389/fimmu.2014.00180
[30]. Alberts, B., Johnson, A., Lewis, J., Raff, M., Roberts, K., and Walter, P. (2002). Helper T
Cells and lymphocyte activation. Molecular Biology of the Cell, 4th edition
[31]. Bermudez, L.E., Danelishvili, L., and Early, J. (2006). Mycobacteria and macrophage
apoptosis: complex struggle for survival. Microbe Wash. D.C., 1:372-375.
[32]. Early, J., Fischer, K., and Bermudez, L.E. (2011). Mycobacterium avium uses apoptotic
macrophages as tools for spreading. Microb. Pathog., 50:132-139. doi:
10.1016/j.micpath.2010.12.004

110
CHAPTER FOUR: MULTIPLEX PCR AND FLUORESCENT IN SITU
HYBRIDIZATION (FISH) COUPLED PROTOCOL FOR DETECTION OF
PATHOGENS INVOLVED IN INFLAMMATORY BOWEL DISEASE
PATHOGENESIS
Introduction
IBD, which consists of UC and CD, share a variety of different genetic factors, environmental
triggers, and treatment plans [1-5]. Multiple recurring reports from us and others provided
evidence that environmental triggers, including enteric pathogens, may cause IBD pathogenesis.
Specifically, MAP, AIEC strain LF82, and K. pneumoniae have been implicated as causative
agents in CD [5-12].
For instance, MAP was first isolated as the causative agent for Johne’s disease, a CD-like
enteritis in cattle [8,9,13,14]. MAP is an intracellular acid-fast pathogen that infects macrophages
and dendritic cells and inhibits phagosome-lysosome fusion [15,16]. Interestingly, MAP was
detected in the blood, milk and intestinal biopsies from patients with CD and most recently RA
[5,6,8,9]. AIEC strain LF82 is a gram-negative bacillus pathogen that has also been isolated from
intestinal tissue from patients with CD [10,12,17,18]. The LF82 strain of AIEC has been studied
intensely due to its ability to infiltrate intestinal tissue and increase pro-inflammatory cytokines
level in CD patients [10,12,17,18]. Like MAP, AIEC strain LF82 resists phagosome-lysosome
fusion and acidification [10,12,17,18]. K. pneumoniae is a gram-negative, facultative anaerobic
bacillus pathogen that causes pneumonia in immunocompromised patients [11,19]. Recent
studies showed that K. pneumoniae is also associated with IBD pathogenesis [11,19]. K.
pneumoniae colonizes the intestine of IBD patients with an imbalance in gut flora leading to
elevated humoral immune response [11,19].

111
Although there are numerous studies investigating these pathogens individually in association
with IBD, none of them has envisioned or examined the co-occurrence multiple pathogens in
clinical samples obtained from CD or UC patients nor did they have a reliable, time saving
diagnostic tool to attempt such endeavor. This limitation in the current literature prompted our
group to develop a protocol to evaluate clinical samples for the presence of co-infection. We
developed a multi-color FISH protocol, using pathogen-specific nucleotide probes and confocal
scanning laser microscopy (CSLM). Additionally, we also developed a multiplex PCR technique
based on a rapid modified DNAzol® extraction protocol and pathogens-based oligonucleotide
primers. The multiplex PCR assay is coupled with the FISH protocol in order to verify results
obtained from CSLM images. More importantly, multiplex PCR is evaluated for possible use in
rapid testing of clinical samples for the presence of multiple pathogens in same tissue section.
Materials and Methods
Bacterial Cultures
A total of ten MAP strains, five other Mycobacterium species, and four non-Mycobacterium
species were used in this study (Table 8). Mycobacterium species including MAP were cultured
in BD Bactec™ MGIT™ Para-TB medium (Becton, Dickinson and Company©) tubes
supplemented with 800 uL of Bactec™ MGIT™ Para-TB Supplement (Becton, Dickinson and
Company©) at 37°C until optimal growth was achieved. E.coli, Staphylococcus aureus and K.
pneumoniae were cultured in Luria broth (LB broth, Fisher Scientific®) at 37°C. Listeria
monocytogenes was cultured in brain heart infusion broth (BHI broth, Fisher Scientific®) at
37°C.

112
Table 8. Bacteria Cultures Used in Study
Bacteria Species Source
MAP Strain 1 Milk
MAP Strain 3 CD Tissue
MAP Strain 8B CD Blood
MAP Para 18 ATCC 19698
MAP UCF3 CD Tissue
MAP UCF4 CD Tissue
MAP UCF5 CD Tissue
MAP UCF7 CD Tissue
MAP Linda ATCC 43015
MAP MS137 CD Tissue
Mycobacterium smegmatis (M. smegmatis) ATCC 27199
Mycobacterium avium subspecies avium (M. avium) ATCC 25291
M. avium JF7 HIV Blood
Mycobacterium xenopi (M. xenopi) ATCC 19971
Mycobacterium fortuitum subspecies fortuitum (M.
fortuitum)
ATCC 23031
Escherichia coli (E.coli) ATCC 8739
Staphylococcus aureus (S.aureus) ATCC 25932
Klebsiella pneumoniae (K. pneumoniae) ATCC 13883
Listeria monocytogenes (L. monocytogenes) ATCC 19112
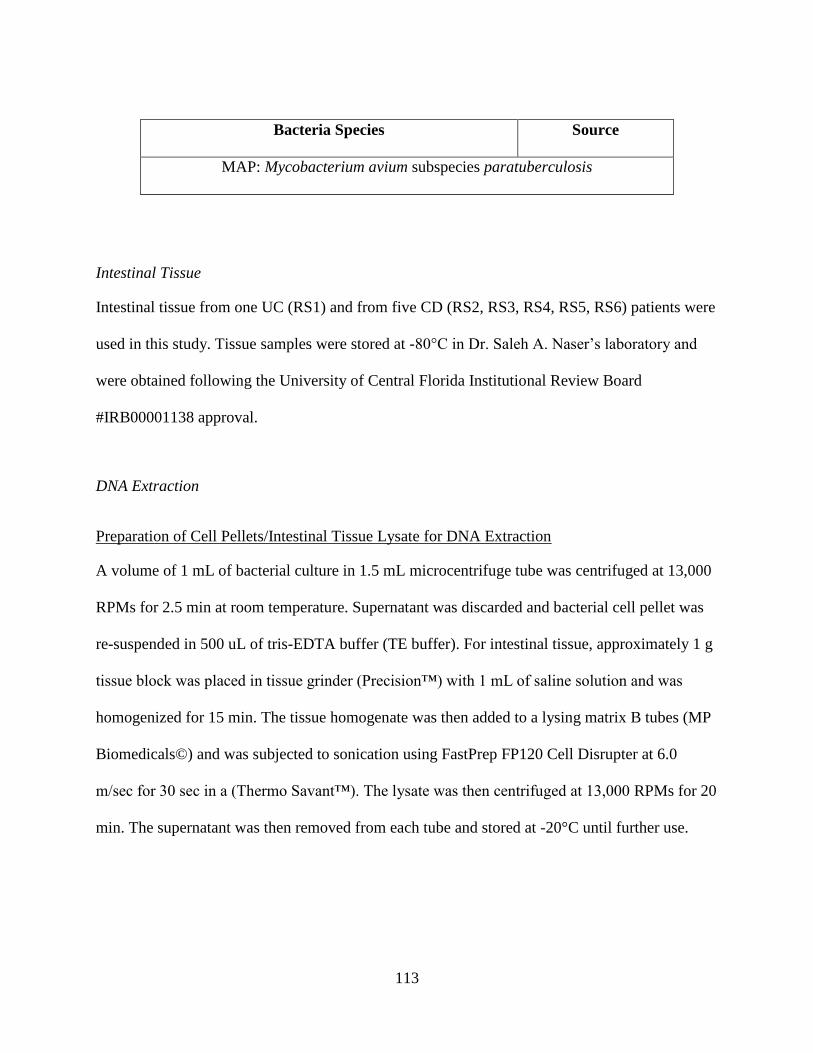
113
Bacteria Species Source
MAP: Mycobacterium avium subspecies paratuberculosis
Intestinal Tissue
Intestinal tissue from one UC (RS1) and from five CD (RS2, RS3, RS4, RS5, RS6) patients were
used in this study. Tissue samples were stored at -80°C in Dr. Saleh A. Naser’s laboratory and
were obtained following the University of Central Florida Institutional Review Board
#IRB00001138 approval.
DNA Extraction
Preparation of Cell Pellets/Intestinal Tissue Lysate for DNA Extraction
A volume of 1 mL of bacterial culture in 1.5 mL microcentrifuge tube was centrifuged at 13,000
RPMs for 2.5 min at room temperature. Supernatant was discarded and bacterial cell pellet was
re-suspended in 500 uL of tris-EDTA buffer (TE buffer). For intestinal tissue, approximately 1 g
tissue block was placed in tissue grinder (Precision™) with 1 mL of saline solution and was
homogenized for 15 min. The tissue homogenate was then added to a lysing matrix B tubes (MP
Biomedicals©) and was subjected to sonication using FastPrep FP120 Cell Disrupter at 6.0
m/sec for 30 sec in a (Thermo Savant™). The lysate was then centrifuged at 13,000 RPMs for 20
min. The supernatant was then removed from each tube and stored at -20°C until further use.

114
DNA extractions of both bacterial cell pellets and intestinal tissue lysate were performed
following our modified DNAzol® (ThermoFisher Scientific®) DNA extraction protocol and our
traditional phenol/chloroform/isoamyl DNA extraction method as described previously [5,6,8].
Modified DNAzol® DNA Extraction Protocol
Each tube containing bacterial culture pellet or intestinal tissue lysate in 500 uL of TE was
subjected to DNA extraction by a protocol that utilizes DNAzol® as previously described [5,6].
Briefly, a total of 1.0 mL of DNAzol® was added to bacterial culture pellets or intestinal tissue
lysates suspended in 500 uL TE. After mixing, a 400 uL of 100% isopropanol was added to each
tube and then incubated for 15 min at room temperature. Following centrifugation at 8,000
RPMs for 6 min, the supernatant was discarded and DNA pellets were then washed with 500 uL
of DNAzol® at 8,000 RPMs for 5 min. DNA pellets were then washed again in 1.0 mL of 75%
ethanol at 8,000 RPMs for 5 min and then dried via a speedvac for 5 min. Dried DNA pellets
were then dissolved in 50 uL of TE buffer and stored at -20°C until further use.
Phenol/Chloroform/Isoamyl DNA Extraction Protocol
Each tube containing bacterial culture pellet or tissue lysate in 500 uL of TE was subjected to
DNA extraction by a protocol that utilizes phenol/chloroform/isoamyl alcohol as previously
described [8]. Briefly, tubes were incubated in a heat block for 30 min at 100°C and then placed
on ice for 15 min. Tubes were then centrifuged at 12,000 RPMs at 4°C for 10 min. Supernatants
were transferred into 2.0 mL Phase Lock Gel™ tubes (Fisher Scientific®) and then mixed with
200 uL of Phenol/Chloroform/Isoamyl-Alcohol (Fisher Scientific®). Tubes were centrifuged at
12,000 RPMs at 4°C for 5 min, where supernatants transferred into new 1.5 mL microcentrifuge

115
tubes containing 100% chilled ethanol and stored at -20°C overnight. Next day, tubes are thawed
and centrifuged at 12,000 RPMs at 4°C for 10 min and the supernatants discarded. DNA pellets
were washed with 80% chilled ethanol, dried in a speedvac for 15 min and re-suspended in 50 uL
TE buffer for storage at -20°C until further use.
Validation of DNAzol® Extraction Method by MAP IS900 nPCR
MAP-specific nPCR based on IS900 derived oligonucleotide primers (Table 9) was used to
evaluate the efficiency of the modified DNAzol® protocol compared to the
phenol/chloroform/isoamyl alcohol protocol. In the first round, the PCR reaction consisted of 25
uL master mix (2x solution containing Taq DNA polymerase, dNTPs, MgCl2 and reaction
buffers, Promega©), 5 uL betaine (Sigma-Aldrich©), 1 ul of P90 and 1 ul of P91 oligonucleotide
primers, 8 uL of millipore H2O, and 10 ul of DNA. The PCR cycling conditions were: 95°C for 5
min; 35 cycles of 95°C for 60 sec, 58°C for 90 sec, and 72°C for 90 sec; and a final extension of
72°C for 10 min. For the second round of PCR, the same reagents were used from the first round
with 5 uL of P90/P91 product and AV1/AV2 oligonucleotide primers. The PCR cycling
conditions were: 95°C for 5 min; 35 cycles of 95°C for 30 sec, 60°C for 30 sec, and 72°C for 60
sec; and a final extension of 72°C for 10 min. Amplified DNA was then analyzed on a 2%
agarose gel, and a 298 bp band was considered positive for MAP. DNA from MAP clinical
strain UCF4 was used a positive control. The negative control consisted of all reagents except
DNA.

116
Table 9. Nucleotide Primers Used in IS900 nPCR, Multiplex PCR and FISH Probes
Bacterial
Gene Target
nPCR Primers Multiplex PCR Primers FISH Probe
Mycobacteriu
m avium
subspecies
paratuberculos
is
(MAP)
IS900
P90: 5’-
GTTCGGGGCCGTCGCTTAGG
-3’
(BLAST E-value: 2e-04)
P91: 5’-
GAGGTCGATCGCCCACGTG
A-3’
(BLAST E-value: 2e-04)
AV1: 5’-
ATGTGGTTGCTGTGTTGGAT
GG-3’
(BLAST E-value: 1e-05)
AV2: 5’-
CCGCCGCAATCAACTCCAG-
3’
(BLAST E-value: 5e-04)
AV1: 5’-
ATGTGGTTGCTGTGTTGGATGG-
3’
(BLAST E-value: 1e-05)
AV2: 5’-
CCGCCGCAATCAACTCCAG-3’
(BLAST E-value: 5e-04)
5’-AF488
ATGTGGTTGCTGTGTTGGAT
GG-3’
(BLAST E-value: 1e-05)

117
Bacterial
Gene Target
nPCR Primers Multiplex PCR Primers FISH Probe
Mycobacteriu
m avium
complex
(MAC)
IS1311
NA
Forward: 5’-
AAACGACCAAGGATCACTACCG
AG-3’
(BLAST E-value: 1e-06)
Reverse: 5’-
GTCGAGGAACACATACGGGAA
GT-3’
(BLAST E-value: 4e-06)
NA
Non-
pathogenic
E.coli
18s
NA
Forward: 5’-
CCGCATAACGTCGCAAGACC-3’
(BLAST E-value: 6e-04)
Reverse: 5’-
CGTAGGAGTCTGGACCGTGTC-
3’
(BLAST E-value: 2e-04)
5’-AF647
GGTCTTGCGACGTTATGCGG
-3’
(BLAST E-value: 6e-04)
AIEC strain
LF82
GipA
NA
Forward: 5’-
GCTGTGTGCGCTTCGTCTAC-3’
(BLAST E-value: 4e-08)
Reverse: 5’-
GATGGTAATTCTCGACTCCAGC
GA-3’
(BLAST E-value: 2e-07)
5’-AF565
GTAGACGAAGCGCACACAG
C-3’
(BLAST E-value: 4e-08)

118
Bacterial
Gene Target
nPCR Primers Multiplex PCR Primers FISH Probe
K.pneumoniae
23s
NA
Forward: 5’-
TGGCAGTCAGAGGCGATGAAG-
3’
(BLAST E-value: 1e-04)
Reverse: 5’-
CTTTCCCTCACGGTACTGGTTCA
-3’
(BLAST E-value: 0.002)
5’-AF546
CTTCATCGCCTCTGACTGCC
A-3’
(BLAST E-value: 0.001)
BLAST E-value: Basic Local Alignment Search Tool Expected Value

119
Development of Multiplex PCR
All oligonucleotide primers were designed and then purchased from Eurofins Genomics© (Table
9). Briefly, 10 uL of DNA containing 17 ng/uL of bacterial DNA or 50 ng/uL tissue DNA were
added into a 200 uL-microcentrifuge tube containing 25 uL of PCR Master Mix (2x solution
containing Taq DNA polymerase, dNTPs, MgCl2 and reaction buffers, Promega©), 5 uL of
betaine (Sigma-Aldrich©), and 1 uL of each oligonucleotide primer (10 uM forward and 10 uM
reverse primer for each bacterial species (MAP, MAC, non-pathogenic E. coli, AIEC strain
LF82, and K. pneumoniae). The PCR cycling conditions were: 95°C for 5 min; 35 cycles of
95°C for 30 sec, 60°C for 30 sec, and 72°C for 60 sec; and a final extension of 72°C for 10 min.
The products of the multiplex PCR were analyzed on a 3% agarose gel, where the following base
pairs bands are considered positive for the bacterial species tested: 171 bp (non-pathogenic
E.coli), 298 bp (MAP), 357 bp (AIEC strain LF82), 493 bp (K. pneumoniae), and 543 bp
(MAC). For the bacterial DNA positive controls, all tested bacterial species were first separated
into individual tubes and underwent DNA extraction/multiplex PCR. Once successful multiplex
PCR was done on the bacterial DNA positive controls individually, all tested bacterial species
were then added into one tube and then underwent DNA extraction/multiplex PCR. The negative
control for the multiplex PCR step that was used had all of the necessary PCR reagents except
for the DNA.

120
Development of Fluorescent in situ Hybridization (FISH) for Imaging for Gut Bacteria
Preparation of Bacterial Slides for FISH
A volume of 1 mL of bacterial culture in 1.5 mL microcentrifuge tube was centrifuged at 13,000
RPMs for 2.5 min at room temperature. The supernatant was removed and the culture pellet was
washed with 500 uL of TE and then centrifuged again at 13,000 RPMs for 2.5 min at room
temperature. After centrifugation, the supernatant was removed and the culture pellet was re-
suspended in 100 uL of TE. Of which, 20 uL suspension was placed on each slide, air dried and
then heat fixed. Slides were then incubated in 4% paraformaldehyde (PFA, Fisher Scientific®)
overnight at 4°C on a shaker at 50 rpm.
Preparation of Intestinal Tissue Slides for FISH
Intestinal tissue sections were obtained using previously established protocols [20,21]. In brief,
PFA fixed tissue specimens (1 g each) were placed in perforated cassettes and immersed in
ascending concentrations of ethanol (70%, 90%, and 100%) on a Leica processing system (TP
1020) for dehydration followed by clearing in (Xylene 50:Ethanol 50), and 100% Xylene
solutions. Next, intestinal tissue was embedded in melted paraffin (60oC) and allowed to solidify
to 4oC. Solidified blocks were then cut using tissue microtome (HM 325 Microm; Medical
Equipment Source) into consistent 5 um thickness serial tissue sections and placed on Colorfrost
Plus microscope slides (Fisher Scientific®). Before histology evaluation, sections were put in
60oC incubator for 30 minutes, and immersed into in xylene solution (Sigma-Aldrich©) for 10
min to remove extra wax and three separate washes with 100% ethanol, 95% ethanol, and 70%
ethanol for 10 min each to rehydrate the tissue section. The tissue slides were air-dried after

121
removal of paraffin, and incubated overnight at 4°C with 4% PFA (Fisher Scientific®) on a
shaker.
Bacterial FISH on Bacterial Slides and IBD Patient’s Biopsy Slides
After fixation with 4% PFA, the slides were then washed three separate times in 1x phosphate
buffer saline (PBS) for 10 min each on a shaker. Next, a solution comprising of 100 uL of 1%
sodium dodecyl sulfate (SDS) with 2 uL of 20 mg/mL of Proteinase K (Thermo Scientific™)
was added directly to the slides in hybridization chambers (Corning®). The slides in the
hybridization chambers were then incubated at 55°C for 30 min. Inactivation of the Proteinase K
was done by adding 200 uL of 0.2% glycine (Sigma-Aldrich©) to each slide and incubated for 3
min on a shaker. After inactivation, the slides were then washed three separate times in 1x PBS
for 5 min each on a shaker. The slides were washed again in the following solutions for 1 min
each on a shaker: 50% ethanol, 80% ethanol, 100% ethanol and then xylene. Next, the slides
were washed once again with the following solutions for 1 min each on a shaker: 100% ethanol,
80% ethanol, and 50% ethanol. After the ethanol/xylene washes, the slides are then incubated in
1x PBS for 60 min on a shaker. The slides were then incubated in a pre-hybridization solution
consisting of 2x saline-sodium citrate (SSC, Sigma-Aldrich©), 20% dextran sulfate (Fisher
Scientific®), 50% formamide (Sigma-Aldrich©), 50 mM NaH2PO4 (Sigma-Aldrich©), and 1
mM EDTA (Fisher Scientific®) for 10 min at 50°C. After incubation in the pre-hybridization
solution, the slides are then placed in hybridization chambers and 20 uL of hybridization solution
(pre-hybridization solution without the 20% dextran sulfate) was added directly to the samples.
The hybridization solution also included 3 uL of the 1 ug/uL oligonucleotide fluorescent probe
per slide for the bacterial species being detected. Oligonucleotide probes used in this study are

122
listed in Table 9 and were purchased from Eurofins Genomics©. All FISH oligonucleotide
probes were prepared by diluting probes to 1 ug/uL in TE buffer. After the hybridization solution
was added to the slides in the hybridization chambers, the slides were then incubated for 60°C
for 60 min and then 37°C overnight. After incubation overnight, the slides were then washed
with the following solutions for 15 min each on a shaker: 2x SSC, 1x SSC, 0.3x SSC in 40°C
water bath, and 0.3x SSC in room temperature in the dark. The slides were then washed three
separate times with H2O for 15 min each on a shaker and then air-dried in the dark. A solution of
DAPI/mounting medium (Vectashield®) was added to the slides and were sealed with a slide
cover. The slides were analyzed using confocal scanning laser microscopy (CSLM). The images
created were analyzed on ImageJ (National Institute of Health).
Results
Specificity and Sensitivity between DNAzol® and Phenol/Chloroform/Isoamyl-Alcohol DNA
Extraction Protocols
Comparison between DNAzol® and phenol/chloroform/isoamyl-alcohol DNA extraction
techniques was done by examining the specificity and sensitivity of IS900 nested PCR (nPCR)
on various bacterial cultures. This was done in order to evaluate the new, modified DNAzol®
DNA extraction protocol. Specificity of the techniques wase done by comparing both DNA
extraction protocols on a variety of different bacterial species and MAP strains after IS900
nPCR. Based on the analysis of the 2% agarose gel and the 298 bp target sequence shown in
Figure 1A and 1B, the IS900 nPCR is confirmed to be specific to the MAP strains and not to the
other bacterial species. When examining the specificity of the IS900 nPCR between the two
DNA extraction protocols, the modified DNAzol® (Figure 14A, Gel II) showed more intense

123
DNA bands than the phenol/chloroform/isoamyl-alcohol DNA protocol did after the nPCR was
done (Figure 14B, Gel I).
Sensitivity of both the IS900 nPCR and the DNA extraction techniques was done by comparing
between the protocols on serial dilutions of MAP UCF4 culture and MAP UCF4 isolated DNA
(Figure 14C and 14D). Based on the analysis of the 2% agarose gel and the 298 bp target
sequence shown in Figure 14C, the IS900 nPCR shows that the technique can detect a minimum
of 2-3 colony forming units (CFU) of MAP culture. In addition, the IS900 nPCR can detect MAP
DNA at a minimum of up to 3.17 fg/uL-317 ag/uL (Figure 14D). When comping the IS900
nPCR sensitivity between the two DNA extraction protocols, the modified DNAzol® protocol
(Figure 14C, Gel II) detected lower amounts of MAP UCF4 CFU culture, while the
phenol/chloroform/isoamyl-alcohol DNA extraction protocol (Figure 14D, Gel 1) detected lower
amounts of pure MAP UCF4 DNA.
Multiplex PCR on Bacterial Species and IBD Patient Biopsy Samples
We engineered an all in one multiplex PCR protocol that facilitates the detection of multiple
bacterial species in one single biopsy sample. For the positive controls, a tube with all of the
tested bacteria species (E.coli, K. pneumonia, and MAP) were mixed and DNA was extracted for
multiplex PCR. All positive controls had successful multiplex PCR reactions with either single
set of bacterial gene primers alone or with all bacterial gene primers together in one tube (Figure
15). Due to laboratory biosafety level restrictions, a positive control bacterial culture for AIEC
strain LF82 could not be obtained. In lieu of this, primers for AIEC strain LF82 that did not bind

124
onto the other bacterial cultures, such as non-pathogenic E.coli, should thus theoretically only
amplify AIEC strain LF82 DNA. Mycobacterium avium complex (MAC) primers were used to
confirm presence of Mycobacterial species in either positive controls or IBD patient samples.
After the establishment of the positive controls, two IBD biopsy tissues (RS1: UC patient and
RS2: CD patient) were used for multiplex PCR (Table 10). As seen in Table 10 and Figure 16,
both non-pathogenic E.coli (171 bp) and K. pneumoniae (493 bp) were detected in both RS1 and
RS2 samples. MAP (298 bp) was only detected in RS2 and not RS1. AIEC strain LF82 (357 bp)
was not detected in either of the samples.

125
Table 10. Multiplex PCR and FISH Results for IBD Patient Samples
Bacterial Species Detected Patient Sample
RS1 RS2
Multiplex PCR
Non-pathogenic E.coli + +
AIEC strain LF82 - -
MAP - +
K. pneumoniae + +
MAC - -
FISH
Non-pathogenic E.coli + +
AIEC strain LF82 - -
MAP - +
K. pneumoniae + +
AIEC: Adherent-invasive Escherichia coli
MAP: Mycobacterium avium subspecies paratuberculosis
MAC: Mycobacterium avium complex
FISH: Fluorescent in situ hybridization

126
FISH Procedure on Bacterial Species and IBD Patient Biopsy Samples
A FISH protocol was created in order to visually identify multiple bacterial species in a single
biopsy sample. Different probes were used for detecting four different bacterial species: non-
pathogenic E.coli (AF647 fluorophore, blue fluorescence), AIEC strain LF82 (AF568
fluorophore, yellow fluorescence), MAP (AF488 fluorophore, green fluorescence), and K.
pneumoniae (AF546 fluorophore, magenta fluorescence) (Figure 17). For positive controls,
bacterial cultures were heat-fixed on microscope slides and were treated with their respected
FISH probes. Since no positive control could be used for the AIEC strain LF82 bacterial
cultures, non-pathogenic E.coli was used to determine negative binding of the probes. Gram
stains (Figure 17, a-d) and acid-fast stains (Figure 17, e-h) were done to confirm bacteria were
heat-fixed on microscope slide. Overall, all FISH probes were successful in binding onto their
respective bacterial species and did not have any cross-reactivity with each other (Figure 17 i-l).
For the IBD patient biopsy samples (RS1 and RS2), individual FISH probes were used along
with DAPI (red fluorescence) to stain both the targeted bacteria and the tissue (Figure 18). As
with the multiplex PCR, FISH for non-pathogenic E.coli and K. pneumoniae showed positive
signaling in RS1 and RS2 tissue biopsies (Table 10, Figure 18A, a and e; Figure 5D, d and h),
while only MAP was found in the RS2 sample (Table 10, Figure 18C, c and g). The AIEC strain
LF82 bacterial species was not detected in either RS1 or RS2 tissue biopsies (Table 10, Figure
18B, b and f).

127
Detection of Both Non-Pathogenic E.coli and MAP Coinfection in CD Patient Biopsy Samples
Using FISH
After optimization of the FISH protocol, we used two set of probes together to attempt to
identify the presence of multiple bacterial species in individual CD patient biopsy samples (RS3,
RS4, RS5, RS6). As seen in Figure 19, the tissues were stained with DAPI (blue fluorescence,
Figure 19, a, e, i, m) and treated with both non-pathogenic E.coli (AF657 fluorophore, red
fluorescence, Figure 19, b, f, j, n) and MAP (AF488 fluorophore, green fluorescence, Figure 19,
c, g, k, o) FISH probes on four different CD patient biopsy slides. For RS3 and RS4, both non-
pathogenic E.coli and MAP bacteria were successfully found together in the patient biopsy slides
(Figure 19A and Figure 19B). Both images (Figure 19A, d and Figure 19B, h) showed positive
signals from both bacterial probes coincide with each other along with DAPI signaling in a
single section of the biopsy samples. For RS5 and RS6, only one bacterial signal was detected in
each of the biopsies. RS5 (Figure 19C, l) had only positive signaling for MAP, while RS6
(Figure 19D, p) had only positive signaling for non-pathogenic E.coli.
Discussion
Recent studies have strongly supported the role of microbial infection in IBD development
[7-12]. It is still unclear which pathogen is found more readily in either UC or CD patients,
where recent studies are more focused on detecting one pathogen at a time [8,10,11,18,19]. In
this study, the investigation of the presence of multiple pathogens including MAP, E. coli strains,
and K. pneumoniae, was done to fully understand IBD pathogenesis.
The development of a multiplex PCR protocol coupled with a FISH detection protocol was done,
which together can detect multiple bacterial pathogens in a single sample. Along with this, a

128
newly modified DNA extraction protocol was used in order to process the samples faster (~1
hour) than previously used techniques (2-3 days) [5,6,8]. Overall, combining all three protocols
has produced a faster, more efficient way into detecting multiple bacterial species in one test
sample.
The effectiveness of the two DNA extractions techniques that were used in this study was
established, where the modified DNAzol® technique showed similar specificity and sensitivity
to the “traditional” phenol/chloroform/isoamyl-alcohol DNA extraction technique (Figure 14).
The modified DNAzol® DNA extraction technique however has the advantage over the
“traditional” DNA extraction due to the simplistic and the less time consuming protocol. This
can lead to more samples being processed and could potentially be used in a clinical setting due
to the cost-effectiveness of the modified protocol.
The multiplex PCR was able to detect multiple bacterial DNA individually and when they were
all mixed in one sample tube (Figure 15 and Figure 16). Overall, the data shows that all the
bacterial culture positive controls did have positive multiplex PCR reactions with both respected
individual bacterial DNA primers in separate tubes or with all bacterial DNA primers in one tube
(Figure 15). This demonstrated that the multiplex PCR protocol that was created was successful
and thus was used on IBD patient samples (Table 10 and Figure 16). The use of the FISH probes
derived from the multiplex PCR primers confirmed the results of the both the positive controls
and the IBD patient biopsy samples’ results (Figure 17 and Figure 18).
129
The IBD patients multiplex PCR and FISH analysis showed that both RS1 (UC patient) and RS2
(CD patient) had both non-pathogenic E. coli and K. pneumoniae, but, RS1 was not positive for
MAP, unlike RS2 (Table 10, Figure 16, Figure 18C). For the MAP multiplex PCR and FISH
results for RS1 and RS2, it has been previously shown that a majority of CD patients do have a
higher association with MAP infections than UC patients, which was confirmed again in this
study [5,6,8,9,13,22]. Astonishing, both multiplex PCR and FISH did not detected the AIEC
strain LF82 in the two IBD patients samples, where previous studies have shown that this
bacteria has been associated with IBD pathogenesis (Table 10, Figure 16 and Figure 18B)
[7,10,12,18]. This could be due to the small sample size in this study, but also could be due to the
possibility that the gipA gene being amplified in the AIEC strain LF82 could be a low copy gene
target [23,24]. The virulent gene gipA was chosen as the target gene for amplification in AIEC
strain LF82 is due to its association with AIEC infection in Peyer’s patches of CD patients
[23,24].
When comparing the multiplex PCR DNA bands and the FISH signaling of non-
pathogenic E.coli with the K.pneumoniae in both patient samples, it is evident that the influx of
commensal E.coli does play a role in K.pneumoniae presence (Figure 16 and Figure 18A and
18D). The data suggests that the more K.pneumoniae is present in a patient sample, the less non-
pathogenic E.coli is present. This could suggest and confirm that K.pneumoniae infections can
occur if there is a dysfunction of the microbiome in IBD patients [11,19,25,26]. With the
increasing influx of K.pneumoniae in the CD patient more so in the UC patient, it could be a
potential pathogen to investigate for CD pathogenesis studies.

130
The FISH assay with the four other CD patients (RS3-RS6) that were examined in this study
showed that it is possible to visualize multiple bacterial species in a single biopsy sample (Figure
19). When FISH probes for both non-pathogenic E.coli and MAP were used together on the
biopsy samples, it was evident that signaling from both bacterial species was shown. Further
testing with different combinations of FISH probes for different bacterial species together on
individual biopsy samples need to be done to finally elucidate which bacterial pathogen is more
predominant in IBD pathogenesis.
This study was done as a pilot study in order to verify and examine these newly developed
protocols, and as such, more IBD patient samples are required for future examination. Overall,
this study shows that the protocols created to detect multiple pathogens was successful and that
the data suggest that bacterial presence is potentially different among UC and CD pathogenesis.

131
Figures
Figure 14. Comparison of Specificity and Sensitivity of IS900 nPCR between DNAzol® and
Phenol/Chloroform/Isoamyl-Alcohol DNA Extraction Protocols
Gel images comparing between the specificity and sensitivity of the Mycobacterium avium
subspecies paratuberculosis (MAP) IS900 nested polymerase chain reaction (nPCR) after DNA
extraction from either phenol/chloroform/isoamyl-alcohol DNA extraction (Gel I.) or modified
DNAzol® DNA extraction (Gel II.). Figure 1A shows specificity of the nPCR: M: DNA marker;
N: Negative control; 1: E.coli; 2: S.aureus; 3: L. monocytogenes; 4: K. pneumoniae; 5: M.
smegmatis; 6: M. avium; 7: M. xenopi; 8: M. fortuitum; 9: M. avium JF7; +: MAP UCF4. Figure
1B shows further specificity of the nPCR: M: DNA marker; N: Negative control; 1: MAP Strain
1; 2: MAP Strain 3; 3: MAP Strain 8B; 4: MAP Para 18; 5: MAP UCF3; 6: MAP UCF5; 7: MAP
UCF7; 8: MAP Linda; 9: MAP MS137; +: MAP UCF4. Figure 1C shows sensitivity of the
nPCR on serial dilutions of MAP UCF4 CFU: M: DNA marker; N: Negative control; 1: 5.42 x

132
106 CFU; 2: 5.42 x 10⁵ CFU; 3: 5.42 x 10⁴ CFU; 4: 5.42 x 10³ CFU; 5: 5.42 x 10² CFU; 6: ~50
CFU; 7: ~5 CFU; 8 & 9: ~2-3 CFU. Figure 1D shows sensitivity of the nPCR on serial dilutions
of MAP UCF4 DNA: M: DNA marker; N: Negative control; 1: 31.7 ng/uL; 3.17 ng/uL; 3: 317
pg/uL; 4: 31.7 pg/uL; 5: 3.17 pg/uL; 6: 317 fg/uL; 7: 31.7 fg/uL; 8: 3.17 fg/uL; 9: 317 ag/uL; 10:
31.7 ag/uL.

133
Figure 15. Multiplex PCR for Bacterial Positive Controls
Multiplex polymerase chain reaction (PCR) was done on a tube of bacterial cultures mixed
together (Escherichia coli (E.coli), Klebsiella pneumoniae (K. pneumoniae), Mycobacterium
avium subspecies paratuberculosis (MAP)). M: DNA Marker; 1: E.coli primers only (171 bp); 2:
MAP primers only (298 bp); 3: K. pneumoniae primers only (493 bp); 4: Mycobacterium avium
complex (MAC) primers only (534 bp); 5: all primers together (171 bp, 298 bp, 493 bp, 534 bp).

134
Figure 16. Multiplex PCR for IBD Patient Biopsy Samples
Multiplex polymerase chain reaction (PCR) was done on two inflammatory bowel disease (IBD)
patients (RS1 and RS2). RS1: ulcerative colitis (UC) patient; RS2: Crohn’s disease (CD) patient;
M: DNA Marker; 1: Escherichia coli (E.coli) primers only (171 bp); 2: Mycobacterium avium
subspecies paratuberculosis (MAP) primers only (298 bp); 3: adherent-invasive Escherichia coli
(AIEC) strain LF82 primers only (357 bp); 4: Klebsiella pneumoniae (K. pneumoniae) primers
only (493 bp); 5: Mycobacterium avium complex (MAC) primers only (534 bp); 6: all primers
together (171 bp, 298 bp, 357 bp, 493 bp, 534 bp).

135
Figure 17. Gram Stain, Acid-Fast Stain and FISH for Bacterial Cultures
Gram stain (a-d), Acid-Fast stain (e-h), and fluorescent in situ hybridization (FISH) (i-l) images
of the following bacterial cultures: A: Escherichia coli (E.coli) with non-pathogenic E.coli FISH
probe; B: E.coli with adherent-invasive Escherichia coli (AIEC) strain LF82 FISH probe; C:

136
Mycobacterium avium subspecies paratuberculosis (MAP) with MAP FISH probe; D: Klebsiella
pneumoniae (K. pneumoniae) with K. pneumoniae FISH probe.

137
Figure 18. Detection of Bacterial Species via FISH in IBD Patient Biopsy Samples
Fluorescent in situ hybridization (FISH) images for two IBD patient biopsy samples (RS1:
ulcerative colitis (UC) patient; RS2: Crohn’s disease (CD) patient) stained with DAPI (red
fluorescence) and treated with FISH bacterial probes. A: Non-pathogenic Escherichia coli
(E.coli) FISH probe (a and e); B: adherent-invasive Escherichia coli (AIEC) strain LF82 FISH

138
probe (b and f); C: Mycobacterium avium subspecies paratuberculosis (MAP) FISH probe (c
and g); D: Klebsiella pneumoniae (K. pneumoniae) FISH probe (d and h).

139
Figure 19. Detection of Multiple Bacterial Species via FISH in CD Patient Biopsy Samples
Fluorescent in situ hybridization (FISH) images for four CD patient biopsy samples: A: RS3, B:
RS4, C: RS5, and D: RS6. DAPI (a, e, i, m), non-pathogenic Escherichia coli (E.coli) FISH
probe (b, f, j, n), and Mycobacterium avium subspecies paratuberculosis (MAP) FISH probe (c,
g, k, o) were used together on single CD patient biopsy samples. Merged images were created (d,

140
h, l, p) that overlapped the DAPI with the E.coli and MAP FISH probes signaling into a single
image for each CD patient biopsy sample.

141
References
[1]. Khor, B, Gardet, A., and Xavier, R.J. (2011). Genetics and pathogenesis of inflammatory
bowel disease. Nature, 474:307-17. doi: 10.1038/nature10209
[2]. Jostins, L., Ripke, S., Weersma, R.K., Duerr, R.H., McGovern, D.P., Hui, K.Y., and et al.
(2012). Host–microbe interactions have shaped the genetic architecture of inflammatory bowel
disease. Nature, 491:119-24. doi: 10.1038/nature11582
[3]. Cho, J.H. (2008). The genetics and immunopathogenesis of inflammatory bowel disease.
Nat. Rev. Immunol., 8:458-66. doi: 10.1038/nri2340
[4]. Farh, K.K., Marson, A., Zhu, J., Kleinewietfeld, M., Housley, W.J., Beik, S., and et al.
(2015). Genetic and epigenetic fine mapping of causal autoimmune disease variants. Nature,
518:337-43. doi: 10.1038/nature13835
[5]. Sharp, R.C., Beg, S.A., and Naser, S.A. (2018). Role of PTPN2/22 polymorphisms in
pathophysiology of Crohn’s disease. World J. Gastroenterol., 24:657-670. doi:
10.3748/wjg.v24.i6.657
[6]. Sharp, R.C., Beg, S.A., and Naser, S.A. (2018). Polymorphisms in protein tyrosine
phosphatase non-receptor type 2 and 22 (PTPN2/22) are linked to hyper-proliferative T-Cells,
and susceptibility to Mycobacteria in rheumatoid arthritis. Front. Cell. Infect. Microbiol., 8:11.
doi: 10.3389/fcimb.2018.00011
[7]. Molodecky, N.A., and Kaplan, G.G. (2010). Environmental risk factors for inflammatory
bowel disease. Gastroenterol. Hepatol., 6:339-46.
[8]. Naser, S.A., Ghobrial, G., Romero, C., and Valentine, J.F. (2004). Culture of Mycobacterium
avium subspecies paratuberculosis from the blood of patients with Crohn's disease. Lancet,
364:1039-44. doi: 10.1016/S0140-6736(04)17058-X

142
[9].Naser, S.A., Schwartz, D., and Shafran, I. (2000). Isolation of Mycobacterium avium subsp
paratuberculosis from breast milk of Crohn's disease patients. Am. J. Gastroenterology,
95:1094-5. doi: 10.1111/j.1572-0241.2000.01954.x
[10]. Martinez-Medina, M., Aldeguer, X., Lopez-Siles, M., González-Huix, F., López-Oliu, C.,
Dahbi, G., and et al. (2009). Molecular diversity of Escherichia coli in the human gut: new
ecological evidence supporting the role of adherent-invasive E. coli (AIEC) in Crohn's disease.
Inflamm. Bowel Dis., 15:872-82. doi: 10.1002/ibd.20860
[11]. Rashid, T., Wilson, C., and Ebringer, A. (2013). The link between ankylosing spondylitis,
Crohn’s disease, Klebsiella, and starch consumption. Clin. Dev. Immunol., 2013:872632. doi:
10.1155/2013/872632
[12]. Nazareth, N., Magro, F., Machado, E., Ribeiro, T.G., Martinho, A., Rodrigues, P., and et al.
(2015). Prevalence of Mycobacterium avium subsp. paratuberculosis and Escherichia coli in
blood samples from patients with inflammatory bowel disease. Med. Microbiol. Immunol.,
204:681-92. doi: 10.1007/s00430-015-0420-3
[13]. Qasem A, Abdel-Aty A, Abu-Suwa H, and Naser SA. (2016). Oxidative stress due to
Mycobacterium avium subspecies paratuberculosis (MAP) infection upregulates selenium-
dependent GPx activity. Gut Patho., 8:12. doi: 10.1186/s13099-016-0090-8
[14]. Qasem, A., Naser, A.E., and Naser, S.A. (2017). The alternate effects of anti-TNFα
therapeutics and their role in mycobacterial granulomatous infection in Crohn’s disease. Expert
Rev. of Anti. Infec. Ther., 15:637-43. doi: 10.1080/14787210.2017.1328276
[15]. Keown, D.A., Collings, D.A., and Keenan, J.I. (2012). Uptake and persistence of
Mycobacterium avium subsp. paratuberculosis in human monocytes. Infect. Immun., 80:3768-
75. doi: 10.1128/IAI.00534-12

143
[16]. Rumsey, J., Valentine, J.F., and Naser, S.A. (2006). Inhibition of phagosome maturation
and survival of Mycobacterium avium subspecies paratuberculosis in polymorphonuclear
leukocytes from Crohn's disease patients. Med. Sci. Monit., 12:BR130-9
[17]. Boudeau, J., Glasser, A.L., Masseret, E., Joly, B., and Darfeuille-Michaud, A. (1999).
Invasive ability of an Escherichia coli strain isolated from the ileal mucosa of a patient with
Crohn's disease. Infect. Immun., 67:4499-509
[18]. Darfeuille-Michaud, A., Boudeau, J., Bulois, P., Neut, C., Glasser, A.L., Barnich, N., and et
al. (2004). High prevalence of adherent-invasive Escherichia coli associated with ileal mucosa in
Crohn's disease. Gastroenterology., 127:412 -21
[19]. Lee, I.A., and Kim, D.H. (2011). Klebsiella pneumoniae increases the risk of inflammation
and colitis in a murine model of intestinal bowel disease. Scand. J. Gastroenterolo., 46:684-93.
doi: 10.3109/00365521.2011.560678
[20]. Singla, D.K., Lyons, G.E., and Kamp, T.J. (2007). Transplanted embryonic stem cells
following mouse myocardial infarction inhibit apoptosis and cardiac remodeling. Am. J. Physiol.
Heart Circ. Physiol., 293: H1308-H1314. doi: 10.1152/ajpheart.01277.2006
[21]. Singla, D.K., Singla, R.D., Abdelli, L.S., Glass, C. (2015). Fibroblast growth factor-9
enhances M2 macrophage differentiation and attenuates adverse cardiac remodeling in the
infarcted diabetic heart. PLoS One., 10: e0120739. doi: 10.1371/journal.pone.0120739
[22]. Naser, S.A., Sagramsingh, S.R., Naser, A.S., and Thanigachalam, S. (2014).
Mycobacterium avium subspecies paratuberculosis causes Crohn’s disease in some
inflammatory bowel disease patients. World J. Gasteroenterol., 20:7403-15. doi:
10.3748/wjg.v20.i23.7403

144
[23]. Vazeille, E., Chassaing, B., Buisson, A., Dubois, A., De Vallée, A., Billard, E., and et al.
(2016). GipA factor supports colonization of Peyer's Patches by Crohn's disease-associated
Escherichia coli. Inflamm. Bowel Dis., 22:68-81. doi: 10.1097/MIB.0000000000000609
[24]. Céspedes, S., Saitz, W., Del Canto, F., De la Fuente, M., Quera, R., Hermoso, M., and et al.
(2017). Genetic Diversity and Virulence Determinants of Escherichia coli Strains Isolated from
Patients with Crohn's Disease in Spain and Chile. Front. Microbiol., 8:639. doi:
10.3389/fmicb.2017.00639
[25]. Saleh, M., and Elson, C.O. (2011). Experimental inflammatory bowel disease: insights into
the host-microbiota dialog. Immunity., 34:293-302. doi: 10.1016/j.immuni.2011.03.008
[26]. Packey, C.D., and Sartor, R.B. (2009). Commensal bacteria, traditional and opportunistic
pathogens, dysbiosis and bacterial killing in inflammatory bowel diseases. Curr. Opin. Infect.
Dis., 22:292-301. doi: 10.1097/QCO.0b013e32832a8a5d
145
CHAPTER FIVE: CONCLUSION/FUTURE DIRECTIONS
Knowledge of the pathophysiology of autoimmune diseases, such as RA and CD, is vital in the
development of new diagnosis techniques and new treatment options for these diseases. In this
study, the examination of SNPs found in the negative immunoregulatory genes PTPN2/22 and
their effects on the immune system when introduced to a mycobacterial infection with MAP was
done in order to investigate future targets for diagnosis/treatment for autoimmune diseases. With
the significant SNPs (PTPN2:rs478582 and PTPN22:rs2476601) that were found more prevalent
in the autoimmune disease patients than the healthy controls, these SNPs could potentially be
used as biomarkers for diagnosis of these diseases. This could also be said about the significance
of MAP infection found in the autoimmune disease patients than the healthy controls.
SNPs in PTPN2/22 and MAP infection could also be used as treatment targets due to both factors
together showing immunoregulatory problems in autoimmune disease patients. Eradication of
MAP with antibiotics, such as RHB-104, could potentially be used in patients that are found to
be MAP positive via the IS900 nPCR [1][2]. With the removal of the MAP infection with these
antibiotics, there will be no environmental trigger that could potentially start the dysregulation of
the immune response in genetically predisposed individuals, thus providing relieve of symptoms
and possible remission in these patients. Also, with the knowledge that PTPN2/22 proteins could
potentially be non-functional or have lower activation in patients with SNPs in the PTPN2/22
genes, the ability to alieve the effects of these SNPs is crucial for treatment.

146
For both treatment for SNPs in PTPN2/22 and MAP infection in autoimmune disease patients, a
new type of treatment needs to found. Potentially, the use of exogenous polyamines or
polyamine derivatives can be used to not only help with removing MAP infection in the body,
but could also be used to alleviate the effects of SNPs in PTPN2/22 [3][4][5][6][7][8].
Polyamines, which consist of mainly putrescine, spermidine, and spermine (Figure 20) are found
in a majority of living tissues, microorganisms, and certain foods [6]. Naturally, polyamines are
produced in a variety of cell types, where they play a role in cell growth and survival [6][7][8].
These polyamines have also been found to increase susceptibility to antibiotics in a variety of
microorganisms when used at a high amount [3][4][5]. More specifically, polyamines have
shown to enhanced susceptibility to antibiotics, such as rifampicin, to Mycobacteria species [5].
For polyamine studies on PTPN2/22, it is shown that these compounds enhance the effect of the
phosphatase activity of PTPN2/22, where there is an increase in anti-inflammatory activity in
tested cell lines [7][8].
With the promise of an anti-microbial effect on mycobacterial infections and the anti-
inflammatory effect on the immune system, polyamine treatment could be a possibility for RA
and CD patients with both SNPs in PTPN2/22 and MAP infection (Figure 21). Future studies on
the effect of polyamines on T-cell activity and tissue apoptosis from patient samples with SNPs
in PTPN2/22 need to be done in order to examine if polyamines can alleviate the effect of these
SNPs. Along with this, examination of the increase of susceptibility to antibiotics like RHB-104
to MAP when paired with polyamines need to be examined as well.

147
Figures
Figure 20. Role of Polyamines in Humans
Polyamines are found in a majority of living tissues, where they have a wide variety of effects on
the body. These effects range from immune modulation, autophagy inducing, and cardio
protection.

148
Figure 21. Potential Use of Polyamines in Autoimmune Disease Patients
Future directions for the use of polyamines on patient samples with SNPs in PTPN2/22 is to
induce T-cells and tissue cells from these patients with putrescine, spermidine, and spermine to
see potential decrease in PTPN2/22 activity. This should lead to decrease activity of the T-cells
and decrease apoptosis occurring in the patient samples. Also, MAP cultures will be treated with
both RHB-104 and the polyamines together to see if there is an increase of antibiotic
susceptibility to MAP than with RHB-104 alone.

149
References
[1]. Qasem, A., Safavikhasraghi, M., and Naser, S.A. (2016). A single capsule formulation of
RHB-104 demonstrates higher anti-microbial growth potency for effective treatment of Crohn’s
disease associated with Mycobacterium avium subspecies paratuberculosis. Gut Pathog., 8:45.
doi: 10.1186/s13099-016-0127-z
[2]. Alcedo, K.P., Thanigachalam, S., and Naser, S.A. (2016). RHB-104 triple antibiotic
combination in culture is bactericidal and should be effective for treatment of Crohn’s disease
associated with Mycobacterium paratuberculosis. Gut Pathog., 8: 32. doi: 10.1186/s13099-016-
0115-3
[3]. Kwon, D.H. and Lu, C.D. (2006). Polyamines increase antibiotic susceptibility in
Pseudomonas aeruginosa. Antimicrob. Agents Chemother., 50: 1623-1627. doi:
10.1128/AAC.50.5.1623-1627.2006
[4]. Kwon, D.H. and Lu, C.D. (2007). Polyamine effects on antibiotic susceptibility in bacteria.
Antimicrob. Agents Chemother., 51: 2070-2077. doi: 10.1128/AAC.01472-06
[5]. Sarathy, J.P., Lee, E., and Dartois, V. (2013). Polyamines inhibit porin-mediated
fluoroquinolone uptake in Mycobacteria. PLoS One, 8:e65806. doi:
10.1371/journal.pone.0065806
[6]. Madeo, F., Eisenberg, T., Pietrocola, F., and Kroemer, G. (2018). Spermidine in health and
disease. Science, 359: eaan2788. doi: 10.1126/science.aan2788.
[7]. Moron, B., Spalinger, M., Kasper, S., Atrott, K., Frey-Wagner, I., Fried, M., McCole, D.F.,
Rogler, G., and Scharl, M. (2013). Activation of protein tyrosine phosphatase non-receptor type
2 by spermidine exerts anti-inflammatory effects in human THP-1 monocytes and in a mouse
model of acute colitis. PLoS One, 8: e73703. doi: 10.1371/journal.pone.0073703

150
[8]. Penrose, H.M., Marchelletta, R.R., Krishnan, M., and McCole, D.F. (2013). Spermidine
stimulates T cell protein-tyrosine phosphatase-mediated protection of intestinal epithelial barrier
function. J. Biol. Chem., 288: 32651-32662. doi: 10.1074/jbc.M113.475962

151
APPENDIX: CONSENTS FOR PUBLICATIONS

152
We, the authors, give our permission to include data and materials described in Sharp et. al. 2015
(below) in the dissertation contents of Mr. Robert C. Sharp for Doctor of Philosophy in
Biomedical Sciences at the University of Central Florida.
Article Title: Genetic variations of PTPN2 and PTPN22: role in the pathogenesis of type 1
diabetes and Crohn's disease
Authors: Robert C. Sharp, Muna Abdulrahim, Ebraheem S. Naser and Saleh A. Naser
Journal: Frontiers in Cellular and Infection Microbiology
DOI: https://doi.org/10.3389/fcimb.2015.00095
Published: 24 December 2015
© Sharp 2015

153
We, the authors, give our permission to include data and materials described in Sharp et. al. 2018
(below) in the dissertation contents of Mr. Robert C. Sharp for Doctor of Philosophy in
Biomedical Sciences at the University of Central Florida.
Article Title: Polymorphisms in protein tyrosine phosphatase non-receptor type 2 and 22
(PTPN2/22) are linked to hyper-proliferative T-cells and susceptibility to Mycobacteria in
rheumatoid arthritis
Authors: Robert C. Sharp, Shazia A. Beg and Saleh A. Naser
Journal: Frontiers in Cellular and Infection Microbiology
DOI: https://doi.org/10.3389/fcimb.2018.00011
Published: 25 January 2018
© Sharp 2018

154
We, the authors, give our permission to include data and materials described in Sharp et. al. 2018
(below) in the dissertation contents of Mr. Robert C. Sharp for Doctor of Philosophy in
Biomedical Sciences at the University of Central Florida.
Article Title: Role of PTPN2/22 polymorphisms in pathophysiology of Crohn’s disease
Authors: Robert C. Sharp, Shazia A. Beg and Saleh A. Naser
Journal: World Journal of Gasteroenterology
DOI: 10.3748/wjg.v24.i6.657
Published: 14 February 2018
© Sharp 2018


![National Cancer Institute Slide Show on Single Nucleotide Polymorphisms [SNPS] ancer/geneticvariation](https://img.dokumen.tips/doc/110x75/56649cad5503460f9496f442/national-cancer-institute-slide-show-on-single-nucleotide-polymorphisms-snps.jpg)


![Beyond the SNP threshold: identifying outbreak clusters ... · ing pathogen transmission [1]. Very often the number of single nucleotide polymorphisms (SNPs) separating isolates collected](https://img.dokumen.tips/doc/110x75/5f3430cc2c7b3e4fdd040806/beyond-the-snp-threshold-identifying-outbreak-clusters-ing-pathogen-transmission.jpg)


![Accurate ZygoteSpecific Discrimination of SingleNucleotide ... · ingle-nucleotide polymorphisms (SNPs) are important diagnostic indicators for identifying inheritable diseases[1,2]](https://img.dokumen.tips/doc/110x75/5f3430cc2c7b3e4fdd040807/accurate-zygotespecific-discrimination-of-singlenucleotide-ingle-nucleotide.jpg)