Embed Size (px)
Citation preview
1
Role of Plasminogen Activator Inhibitor-1 in Glucocorticoid-Induced Diabetes and
Osteopenia in Mice
Yukinori Tamura,1 Naoyuki Kawao,
1 Masato Yano,
1 Kiyotaka Okada,
1 Katsumi
Okumoto,2 Yasutaka Chiba,
3 Osamu Matsuo,
4 and Hiroshi Kaji
1*
1. Department of Physiology and Regenerative Medicine, Kinki University Faculty of
Medicine, Osakasayama, Japan
2. Life Science Research Institute, Kinki University, Osaka, Japan
3. Clinical Research Center, Kinki University Hospital, Osakasayama, Japan
4. Kinki University Faculty of Medicine, Osakasayama, Japan
*To whom correspondence should be addressed:
Hiroshi Kaji, M.D., Ph.D., Department of Physiology and Regenerative Medicine,
Kinki University Faculty of Medicine, 377-2 Ohnohigashi, Osakasayama, Osaka
589-8511, Japan
Tel.: +81 72-366-0221 (ext. 3165) Fax: +81 72-366-2853
Page 1 of 50 Diabetes
Diabetes Publish Ahead of Print, published online December 31, 2014

2
Short Running Title: PAI-1 AND GLUCOCORTICOID-INDUCED ADVERSE
EFFECT
Words count: 3993 words
Page 2 of 50Diabetes

3
ABSTRACT
Long-term use of glucocorticoids (GCs) causes numerous adverse effects, including
glucose/lipid abnormalities, osteoporosis, and muscle wasting. The pathogenic
mechanism, however, is not completely understood. In this study, we used
PAI-1-deficient mice to explore the role of plasminogen activator inhibitor 1 (PAI-1) in
GC-induced glucose/lipid abnormalities, osteoporosis, and muscle wasting.
Corticosterone markedly increased the levels of circulating PAI-1 and the PAI-1 mRNA
level in the white adipose tissue of wild-type mice. PAI-1 deficiency significantly
reduced insulin resistance and glucose intolerance but not hyperlipidemia induced by
GC. An in vitro experiment revealed that active PAI-1 treatment inhibits insulin-induced
phosphorylation of Akt and glucose uptake in HepG2 hepatocytes. However, this was
not observed in 3T3-L1 adipocytes and C2C12 myotubes, indicating that PAI-1
suppressed insulin signaling in hepatocytes. PAI-1 deficiency attenuated the
GC-induced bone loss presumably via inhibition of apoptosis of osteoblasts. Moreover,
the PAI-1 deficiency also protected from GC-induced muscle loss. In conclusion, the
present study indicated that PAI-1 is involved in GC-induced glucose metabolism
abnormality, osteopenia, and muscle wasting in mice. PAI-1 may be a novel therapeutic
target to mitigate the adverse effects of GC.
Page 3 of 50 Diabetes

4
KEY WORDS: Glucocorticoid, Insulin Resistance, Osteoporosis, PAI-1, Muscle
Weakness
Page 4 of 50Diabetes

5
INTRODUCTION
Glucocorticoids (GCs) have strong anti-inflammatory properties and are highly
effective in the treatment of allergies, inflammatory and autoimmune conditions, such as
rheumatoid arthritis, asthma, inflammatory bowel disease, and collagen diseases (1; 2).
Despite the high efficacy of GC treatment, its clinical use is limited due to adverse
effects, such as diabetes, hyperlipidemia, osteoporosis, muscle wasting, and
immunosuppression, which are depend on the administered dose and duration of GC
treatment (3-5).
GC-induced diabetes and osteoporosis are manifestations of adverse metabolic effects
because of the high incidence. A clinical study showed that more than 11% of GC users
develop diabetes mellitus within 3 years of GC therapy (6), and a larger number of
patients transition into a prediabetic state, such as insulin resistance and impaired
glucose tolerance. In muscles, GCs have been shown to suppress a number of steps in
the insulin signaling network (3; 7). GCs directly promote hepatic gluconeogenesis,
leading to hyperglycemia (7). Moreover, GCs promote proteolysis, lipolysis, free fatty
acid production, and fat accumulation in the liver that contributes to insulin resistance.
GC treatment is the most common cause of secondary osteoporosis (8). GCs affect
osteoblasts, osteoclasts, and osteocytes. Osteoblasts are generally considered the main
Page 5 of 50 Diabetes

6
skeletal target (4; 9). Several studies suggest that GCs suppress bone formation by
inhibiting differentiation, proliferation, and apoptosis of osteoblasts, leading to
osteoporosis (4; 9); however, the mechanism is not well understood. In addition, the
patients treated with GC frequently suffer from muscle wasting (10). GCs are also
important mediators of muscle wasting in many pathological conditions, such as sepsis,
cachexia, starvation, and metabolic acidosis (11).
Experimental evidence suggests that the above-mentioned effects of GCs are induced
in the cytoplasm by the direct action of GC binding to glucocorticoid receptors (GR) (4).
Nonetheless, the precise mechanisms are not fully understood, and the evidence of
systemic mediators, in the adverse effects of GCs, is lacking.
Plasminogen activator inhibitor-1 (PAI-1) is a serine protease inhibitor that primarily
inhibits tissue-type and urokinase-type plasminogen activators; hence, it is an inhibitor
of fibrinolysis. PAI-1 is a well-known adipocytokine, being upregulated along with fat
accumulation (12). It has been suggested that elevated levels of circulating PAI-1 is a
risk factor in cardiovascular diseases (atherosclerosis), obesity, and diabetes (13-15).
Moreover, we recently demonstrated in female mice with streptozotocin-induced type 1
diabetes that PAI-1 is involved in bone loss (16). PAI-1 is upregulated in atrophic
skeletal muscle (17), and this change is associated with impaired muscle regeneration
Page 6 of 50Diabetes

7
(18; 19). Several clinical studies showed that circulating PAI-1 concentration is elevated
in patients with Cushing syndrome or during corticosteroid treatment (20; 21).
Nonetheless, the role of PAI-1 in GC-induced glucose/lipid abnormalities, osteoporosis,
and muscle wasting is unknown. Therefore, we examined the effects of PAI-1
deficiency on GC-induced glucose/lipid and bone metabolism abnormalities as well as
muscle wasting in mice.
RESEARCH DESIGN AND METHODS
Animal experiments
Forty-four female and 24 male mice with a mixed C57BL/6J (81.25%) and 129/SvJ
(18.75%) genetic background were analyzed as described in Figure Legends. We
included 22 female and 12 male mice with PAI-1 gene deficiency (PAI-1 knockout
[KO]) and the corresponding wild-type (WT) control mice (22). These mice were kindly
provided by Professor D. Collen (University of Leuven, Leuven, Belgium).
Nine-week-old female WT and PAI-1 KO mice received a subcutaneous implant with
slow-release pellets containing either 1.5 mg of corticosterone or placebo (Innovative
Research of America, Sarasota, FL). These pellets were implanted on days 0, 7, 14, and
21 (23; 24). The numbers of female and male mice in each group were 11 and 6,
Page 7 of 50 Diabetes

8
respectively. The animals were maintained in metabolic cages in the 12-h light/12-h
dark cycle; they received food and water ad libitum. Four weeks after the first implant
of corticosterone or placebo pellets, insulin and glucose tolerance tests were performed.
Quantitative computed tomography (qCT) was used to measure bone mineral density
(BMD) in the tibia. Mice (placebo- and corticosterone-treated groups) were starved for
6 h before euthanization; blood and tissue samples were collected from the dead mice.
All experiments were performed according to the guidelines of the National Institute of
Health and as per the institutional rules put forth for the use and care of laboratory
animals at Kinki University.
Metabolic parameters
The plasma concentrations of insulin, total PAI-1, triglyceride (TG), total cholesterol
(T-Chol), osteocalcin (OCN), cross-linked C-telopeptide of type I collagen (CTX), and
TG content in liver and muscle were measured (25; 26). The plasma concentration of
uncarboxylated OCN (ucOCN) was measured using Mouse Undercarboxylated
Osteocalcin ELISA Kit (MyBiosource, San Diego, CA). Glucose and insulin tolerance
tests were performed as previously described (25).
Page 8 of 50Diabetes
9
The qCT analysis
For the qCT analysis of body fat composition, BMD and muscle volume, the mice were
scanned using a LaTheta (LCT-200) experimental animal CT system (Hitachi-Aloka
Medical, Tokyo, Japan).
Histological analysis
The tibia, muscle, and liver tissues were fixed in 4% paraformaldehyde for 16 h at 4°C,
and the tibia was further fixed for 7 days in 80% ethanol. Muscle and liver tissues were
embedded in paraffin right away, and the tibia was embedded in paraffin after
dehydration with formic acid. A paraffin block was sliced into 4-µm sections. For
visualization of osteoclasts, the slices were stained using a tartrate-resistant acid
phosphatase (TRAP)/alkaline phosphatase (ALP) Staining Kit (Wako Pure Industries,
Osaka, Japan). Immunostaining with ALP was performed (27). Another type of staining,
terminal deoxynucleotidyl transferase-mediated dUTP nick end labeling (TUNEL), was
performed to identify apoptotic cells, using an in situ Cell Death Detection Kit,
Fluorescein (Roche Diagnostics, Tokyo, Japan). The numbers of osteoclasts,
TUNEL-positive and ALP-positive cells were counted in selected visual fields under a
microscope in a blinded evaluation (16; 27).
Page 9 of 50 Diabetes

10
Quantitative real-time PCR
Total RNA was extracted from the homogenized tissue samples and the cultured cells
using the RNeasy Mini Kit (Qiagen, Tokyo, Japan). Real-time PCR was performed
using StepOne Plus and the Fast SYBR green PCR Master Mix (Life Technologies,
Tokyo, Japan) as previously described (25). The primer sets are shown in
Supplementary Table 1. The mRNA levels in tissues of the mice and in the cultured
cells were normalized to β-actin and glyceraldehyde 3-phosphate dehydrogenase
(GAPDH) mRNA, respectively.
Cell culture
3T3-L1 cells and C2C12 myoblasts were induced to differentiate into adipocytes and
myotubes, respectively (28; 29). The differentiated C2C12, 3T3-L1 and HepG2 cells
were preincubated with human active PAI-1 (Molecular Innovations, Novi, MI) and
dexamethasone (Sigma Aldrich Japan, Tokyo, Japan) in the serum-free Dulbecco’s
modified Eagle’s medium (DMEM) for 24 h. The cells were incubated with 100 nM
insulin for 15 min. Protein levels of phosphorylated Akt (Ser473
) and total Akt were
measured by western blotting (30). The expressions of gluconeogenesis-related genes in
Page 10 of 50Diabetes

11
hepatocytes were measured; HepG2 cells were incubated with 20 nM human active
PAI-1 and 100 nM dexamethasone for 24 h in the presence of as well as without 1 nM
insulin. Insulin-stimulated 2-deoxyglucose (2DG) uptake in HepG2, C2C12, and
3T3-L1 cells was assessed using 2-Deoxyglucose (2DG) Uptake Measurement Kit
(Cosmo Bio, Tokyo, Japan).
Cell proliferation and apoptosis in primary osteoblasts and MC3T3E1 cells
Primary osteoblastic cells were obtained from female WT and PAI-1 KO mouse calvaria
(27). Cell proliferation, apoptosis, and cell death rates of primary osteoblasts and
MC3T3E1 cells were analyzed using the bromodeoxyuridine (BrdU) Cell Proliferation
Assay Kit (Exalpha Biologicals, Shirley, MA), in situ Cell Death Detection Kit,
Fluorescein, and trypan blue staining, respectively.
Statistical analysis
All data were expressed as mean ± SEM. Two-way ANOVA was used to compare the
effects of the placebo (“Cont”) and corticosterone pellet (“CS”) on both the mice
genotypes (PAI-1 WT and PAI-1 KO). Specifically, 2-way repeated-measures of
ANOVA was used for repeated measured. When significant differences were observed,
Page 11 of 50 Diabetes
12
individual means were compared using Tukey’s post hoc test. For the other simple
comparisons between 2 groups, the unpaired t test was used. Statistical values at p <
0.05 were considered significant. All calculations were performed in the StatView
software, version 5.0 (SAS Institute).
RESULTS
Effects of GC on adiposity and levels of circulating PAI-1
Corticosterone treatment increased body weight in female and male WT mice,
compared to placebo-treated WT mice (Figures 1A, B). The qCT analysis showed that
the percentage (%) of fat mass, visceral fat, and subcutaneous fat mass were markedly
increased by corticosterone in both sexes of WT mice, compared to the corresponding
control WT mice (Figures 1C–F). The PAI-1 deficiency did not affect the body weight
gain, % of fat mass, visceral fat, and subcutaneous fat mass either in placebo- or
corticosterone-treated female and male mice (Figures 1A–F). The levels of plasma
PAI-1 were markedly higher in both sexes of corticosterone-treated WT mice, compared
to the corresponding control WT mice (Figures 1G, H). The levels of PAI-1 mRNA
were markedly and significantly elevated in adipose and muscle tissues but significantly
decreased in the liver and spleen of corticosterone-treated WT mice compared to
Page 12 of 50Diabetes

13
placebo-treated WT mice. There were no differences in the levels of PAI-1 mRNA in
tibia, heart, lung, and kidney between the placebo- and corticosterone-treated WT mice
(Figure 1I).
Effects of the PAI-1 deficiency in GC-induced abnormal glucose and lipid
metabolism
The PAI-1 deficiency significantly suppressed the fasting levels of blood glucose and
the fasting plasma levels of insulin that were elevated by corticosterone in both sexes of
mice (Figures 2A–D).
The decrease in blood glucose levels after i.p. insulin injection was attenuated in
corticosterone-treated WT mice; the PAI-1 deficiency significantly reversed the insulin
intolerance of corticosterone-treated WT mice (Figures 2E, F), although the reversion of
blood glucose levels by the PAI-1 deficiency was not significant 90 and 120 minutes
after the insulin injection in male mice. The levels of blood glucose after i.p. glucose
injection were markedly elevated in corticosterone-treated WT mice compared to
placebo-treated WT mice (Figures 2G, H). The PAI-1 deficiency significantly
suppressed the elevation of blood glucose levels in corticosterone-treated mice 60, 90,
and 120 minutes after the glucose injection (Figures 2G, H). Moreover, the PAI-1
Page 13 of 50 Diabetes

14
deficiency significantly suppressed the levels of plasma insulin in the mice 30 min after
the glucose injection (Figures 2I, J).
Active PAI-1 significantly suppressed Akt phosphorylation and glucose uptake
induced by insulin in HepG2 cells (hepatocytes), although active PAI-1 did not affect
them in differentiated C2C12 cells (myotubes) and differentiated 3T3-L1 cells
(adipocytes; Figures 3A–F). On the other hand, dexamethasone suppressed Akt
phosphorylation and glucose uptake induced by insulin in HepG2, differentiated C2C12,
and differentiated 3T3-L1 cells (Figures 3A–F), whereas the effects of both
dexamethasone and PAI-1 treatment were not additive in HepG2 cells (Figures 3A, D).
Moreover, active PAI-1 and dexamethasone did not affect the mRNA levels of key
enzymes of gluconeogenesis such as glucose-6-phosphatase (G6Pase) and PEPCK in
the presence of insulin in HepG2 cells, although insulin suppressed them in the absence
of PAI-1 and dexamethasone (Figures 3G, H).
Corticosterone markedly increased the levels of plasma TG and T-Chol in female
and male WT mice compared to placebo-treated WT mice, whereas the PAI-1
deficiency did not affect the levels of these plasma lipids in corticosterone-treated mice
(Figures 4A–D). The PAI-1 deficiency did not seem to affect corticosterone-induced
lipid accumulation in the adipose tissue and liver of the mice in histological analysis
Page 14 of 50Diabetes

15
(Supplementary Figures 1A, B). The PAI-1 deficiency did not affect hepatic and
muscular TG contents that were elevated by corticosterone (Supplementary Figures 1D,
E).
Effects of the PAI-1 deficiency on GC-induced bone loss
The qCT analysis revealed that corticosterone treatment significantly reduced BMD,
bone volume fraction (BV/TV) and trabecular area of the tibia in female and male WT
mice, compared to placebo-treated WT mice (Figures 5A–H, O, and P), although it did
not affect cortical thickness, cortical area, and total cross-sectional area in the tibia of
WT mice (Figures 5I–N). In contrast, the PAI-1 deficiency blunted the
corticosterone-induced decrease in BMD, BV/TV, and trabecular area in both sexes of
mice (Figures 5A–H, O, and P).
Effects of the PAI-1 deficiency in GC-induced abnormal bone metabolism
Corticosterone treatment markedly suppressed the expression levels of osteogenic genes,
such as Runx2, Osterix, Alp, Ocn, and type 1 collagen (Col1) in tibia, the levels of
plasma OCN and ucOCN in WT mice, compared to the placebo-treated WT mice
(Figures 6A-C). The PAI-1 deficiency did not affect these osteogenic markers, when
Page 15 of 50 Diabetes

16
they were downregulated by corticosterone in mice (Figures 6A–C). In contrast,
immunohistochemical analysis revealed that the PAI-1 deficiency attenuated the
corticosterone-induced decrease in the number of ALP-positive osteoblastic cells on the
bone surface of tibia in mice (Figure 6D). When compared to the tibia of
placebo-treated WT mice, corticosterone suppressed the levels of receptor activator of
nuclear factor-кB ligand (RANKL) mRNA, osteoprotegerin (OPG) mRNA, the
RANKL/OPG ratio, and the number of TRAP-positive osteoclasts in the tibia of WT
mice (Figure 6E). In contrast, corticosterone did not affect the levels of plasma CTX, a
marker for bone resorption, in WT mice (Figure 6E). The PAI-1 deficiency did not
affect these bone resorption markers in either placebo- or corticosterone-treated mice
(Figure 6E).
The role of PAI-1 in the apoptosis and proliferation of osteoblasts
Corticosterone treatment increased the number of TUNEL-positive cells on the bone
surface of tibia of WT mice, compared to placebo-treated mice (Figure 7A). The PAI-1
deficiency significantly blunted the corticosterone-induced increase in the number of
TUNEL-positive cells on the bone surface of the tibia of the mice (Figure 7A).
Moreover, an in vitro experiment showed that active PAI-1 significantly increased the
Page 16 of 50Diabetes

17
number of trypan blue-stained and TUNEL-positive MC3T3E1 cells and primary
osteoblasts obtained from mouse calvaria (Figures 7B–E). In contrast, active PAI-1 did
not affect BrdU incorporation into MC3T3E1 cells and into primary osteoblasts
obtained from mouse calvaria (Figures 7F, G), indicating that exogenous PAI-1 did not
affect the proliferation of osteoblasts in vitro. Moreover, the PAI-1 deficiency did not
affect the proliferation impaired by dexamethasone in primary osteoblasts obtained from
mouse calvaria (Figure 7H).
Effects of the GC-induced PAI-1 deficiency on muscle wasting
The qCT analysis revealed that corticosterone treatment significantly reduced muscle
mass in the whole body of WT mice compared to placebo-treated mice (Figures 8A, B).
Corticosterone significantly decreased the tissue weight of the gastrocnemius muscle
but not of the soleus muscle in WT mice (Figures 8C, D). This result was suggestive of
the predominant involvement of type II muscle fibers in the GC-induced muscle
wasting. The PAI-1 deficiency attenuated the corticosterone-induced decrease in tissue
weight of the gastrocnemius muscle in both sexes of mice (Figures 8C, D). Moreover,
the PAI-1 deficiency attenuated the corticosterone-induced decrease in the
cross-sectional area of myofibers in the gastrocnemius muscles in female mice (Figure
Page 17 of 50 Diabetes

18
8E and Supplementary Figure 1C). Corticosterone significantly decreased the
expression levels of muscle differentiation-related genes, such as MyoD in the
gastrocnemius muscle tissues of WT female mice. In contrast, corticosterone did not
affect the mRNA levels of myogenin and myosin heavy chain (MHC) in the
gastrocnemius muscle tissue of female mice (Figure 8F). The PAI-1 deficiency
significantly attenuated the corticosterone-induced decrease in the levels of MyoD
mRNA in mice (Figure 8F), suggesting that PAI-1 was involved in muscle
differentiation suppressed by GCs at an early differentiation stage.
DISCUSSION
GC treatment simultaneously induces multiple metabolic disorders in an individual (4).
Therefore, it is important to identify a common therapeutic target for GC-induced
adverse effects. We found that PAI-1 levels are associated with major GC-induced
adverse metabolic effects in mice, for example, insulin resistance, osteoporosis, and
muscle wasting.
Studies suggest that PAI-1 is linked to insulin resistance as well as metabolic
abnormalties (15; 31). We recently reported that PAI-1 deficiency ameliorates insulin
resistance and hyperlipidemia in obese female mice (25). For the first time, we
Page 18 of 50Diabetes
19
demonstrate that PAI-1 deficiency reduces insulin resistance and glucose intolerance but
not hyperlipidemia in GC-treated mice.
GCs impair glucose metabolism by affecting insulin-sensitive organs (the liver,
muscle, and adipose tissue) (3). Several studies revealed that GCs inhibit insulin
signaling in 3T3-L1 adipocytes, L6 myotubes, and HepG2 hepatocytes (30; 32; 33). In
this study, dexamethasone inhibited the phosphorylation of Akt and the glucose uptake,
induced by insulin in 3T3-L1 adipocytes, HepG2 hepatocytes, and C2C12 myotubes in
vitro. Nevertheless, incubation with exogenous PAI-1 suppressed insulin signaling in
HepG2 hepatocytes, but not in 3T3-L1 adipocytes and C2C12 myotubes. Moreover,
active PAI-1 seemed to blunt the levels of key enzymes of gluconeogenesis suppressed
by insulin in HepG2 cells. Thus, PAI-1 participates in GC-induced insulin resistance by
influencing hepatocytes.
Seki et al. reported that dexamethasone increases PAI-1 production in 3T3-L1
adipocytes (34). Our study shows that corticosterone treatment elevates the levels of
PAI-1 mRNA in adipose and muscle tissues of mice. The extent of PAI-1 upregulation is
much higher in adipose tissues than in the muscle tissues. This suggests that circulating
GC-induced PAI-1 produced in adipose and muscle tissues might cause GC-induced
whole-body insulin resistance by impairing insulin signaling in the liver via the
Page 19 of 50 Diabetes

20
bloodstream but not in adipose and muscle tissues. The target organs for inhibition of
insulin signaling by GC and PAI-1 seem to be different. PAI-1 circulates in plasma as a
complex with vitronectin, an extracellular matrix glycoprotein (35), stabilizing active
conformation of PAI-1. Lopez-Alemany et al. showed in vitro that PAI-1 inhibits insulin
signaling by competing with integrin αvβ3 for vitronectin binding (36). Possibly PAI-1
deficiency ameliorated GC-induced insulin resistance via enhancement of the
interaction with vitronectin and αvβ3 integrin in the liver. PAI-1 suppression of insulin
signaling in hepatocytes, but not in myotubes and adipocytes, is still unknown. Further
studies are needed to clarify the molecular mechanism underlying PAI-1 effects on
hepatocytes and different PAI-1 tissue sensitivities.
Recent studies suggest that osteoblast-derived osteocalcin, a bone matrix protein, is a
potent regulator of glucose metabolism; acts by modulating the insulin release and
peripheral insulin sensitivity (37; 38). Brennan-Speranza et al. showed that
bone-derived osteocalcin release, which is impaired by GC, is involved in GC-induced
abnormalities in glucose/lipid metabolism (23). Our study demonstrated that the PAI-1
deficiency does not affect levels of carboxylated and uncarboxylated plasma osteocalcin
when suppressed by GC in mice; this deficiency significantly reduces GC-induced
insulin resistance. This suggests that the involvement of PAI-1 in GC-induced insulin
Page 20 of 50Diabetes
21
resistance is independent of osteocalcin in mice.
This study is the first to report that PAI-1 deficiency ameliorates GC-induced bone
loss and decrease in osteoblast numbers in mice. Long-term GC treatment causes bone
loss mainly due to the impaired osteoblastic bone formation (4). GCs decrease the
number of osteoblasts because of the impaired osteoblast differentiation and
proliferation as well as enhanced apoptosis of osteoblasts, resulting in impairment of
bone formation (4). According to our data, corticosterone markedly suppressed levels of
osteogenic genes in the tibia of mice, indicating that GCs impair osteoblast
differentiation. The PAI-1 deficiency did not affect the osteoblast differentiation
suppressed by GC. This suggests that PAI-1 is not linked to the impaired GC-induced
osteoblast differentiation. Also, either endogenous or exogenous PAI-1 does not affect
the proliferation of osteoblasts in vitro. In contrast, the PAI-1 deficiency suppressed
corticosterone-induced apoptosis in the tibia of mice. Moreover, active PAI-1 induced
apoptosis in primary osteoblasts and MC3T3E1 cells. Overall, this indicates that GCs
induce osteopenia through PAI-1 presumably via the enhancement of apoptosis in
osteoblasts.
The enhancement of osteoclastic bone resorption that is induced by excess GC is also
associated with GC-induced bone loss (4). During the initial stage of high-dose GC
Page 21 of 50 Diabetes

22
therapy, a rapid but transient increase in bone resorption caused by increase in osteoclast
number and activity can be observed in humans and in animal models (39; 40).
Nonetheless, corticosterone decreased the number of osteoclasts, the levels of RANKL
mRNA, and the RANKL/OPG ratio in the tibia of mice. It is suggested that excess GC
for prolonged period can downregulate osteoclast numbers and function (41).
Furthermore, GC suppresses the formation of osteoclast precursors (41; 42). Therefore,
we can speculate that the suppression of osteoclast formation by GC in this study might
partly be due to the dose and/or duration of GC administration. The PAI-1 deficiency
did not affect either osteoclast numbers or the levels of tibia RANKL and OPG mRNA
(suppressed by the GC), suggesting that PAI-1 is not involved in the changes of
GC-induced bone resorption.
Clinical evidence suggests that GCs negatively affect both muscle and the bone; this
phenomenon may lead to muscle wasting as well as osteoporosis (43-45). Our data
suggest that PAI-1 deficiency blunts decrease in muscle mass and the GC-induced
changes in muscle phenotypes in mice, indicating that PAI-1 is also involved in
GC-induced muscle wasting in mice. Because GCs significantly enhanced endogenous
PAI-1 levels in muscle tissues, GCs might induce muscle wasting in mice through both
muscle’s endogenous PAI-1 and circulating PAI-1.
Page 22 of 50Diabetes

23
GCs directly enhance transactivation of PAI-1 through binding of GR to a
glucocorticoid response element (GRE) in PAI-1’s promoter (46). Several studies
showed that GCs enhance PAI-1 expression in various cell types (35; 47). However, the
source tissue of the PAI-1 production enhanced by GC in vivo has not been identified.
In the present study, GC significantly decreased the levels of PAI-1 mRNA in the liver
and spleen, although the GC elevated PAI-1 mRNA levels in adipose and muscle tissues
in mice. Oishi et al. reported that serum GC concentrations are correlated with PAI-1
expression in adipose tissues but not in the liver of mice (48). In the same study, it was
shown that GC-induced adipose tissue-derived PAI-1 possibly had negative effects on
the GC-induced liver-derived PAI-1 production. Additionally, our previous study
showed that the diabetic state increases PAI-1 expression in the liver of female mice
(16). Thus, we can speculate that there are tissue-specific differences in the PAI-1
induction by GC. The response of different tissue-specific factors related to GC may
negatively affect the PAI-1 induction by GC, depending on an organ. Alternatively, the
change in the metabolic state may modulate the PAI-1 expression in response to GC in
different ways, depending on a tissue.
The reversion of blood glucose levels by the PAI-1 deficiency was not significant at
90 and 120 minutes after insulin injection in male mice (Figure 2F). The blood glucose
Page 23 of 50 Diabetes

24
levels after insulin injection seemed to be higher (not significant) in PAI-1-deficient
mice than in the wild-type mice, suggesting that slight sex difference might exist in
PAI-1 involvement in the pathogenesis of GC-induced insulin resistance in mice. We
previously reported that PAI-1 is involved in the pathogenesis of type 1 diabetic
osteoporosis in female mice but not in male mice (16). Studies have suggested that a
protein linked to the sex chromosomes is associated with the sex differences in the
prevalence of metabolic abnormality and osteoporosis (49; 50). This suggests that a
protein linked to a sex chromosome might be responsible for the sex differences
observed in the present study. Further studies are needed to clarify the above issues.
PAI-1 is considered as a humoral factor that affects systemic metabolism. Our
previous study suggested that a type 1 diabetic state increases PAI-1 expression in the
liver, resulting in increased circulating PAI-1 levels in female mice (16). Upregulation
of circulating PAI-1 impairs osteoblast differentiation and mineralization, and promotes
adipogenesis in bone tissues; the latter effect leads to diabetic osteoporosis. Moreover,
PAI-1 is involved in obesity-induced insulin resistance and hyperlipidemia but not bone
loss in female mice, although the role of PAI-1 in bone metabolism in the type 2
diabetic state remains completely unknown at present (25). However, GC increases
PAI-1 production mainly in adipose tissues, thereby leading to increased blood PAI-1
Page 24 of 50Diabetes
25
levels. The upregulation of circulating PAI-1 may lead to osteoporosis as well as insulin
resistance and muscle wasting induced by GC (Figure 8G). Thus, PAI-1 possibly plays
an important role as a humoral factor to regulate various metabolic states in presence of
excess GC as well as in diabetes.
In conclusion, for the first time, we demonstrated that PAI-1 is involved in the
metabolic adverse effects of GC treatment, for example, in insulin resistance, bone loss,
and muscle wasting in mice. PAI-1 may be a novel therapeutic target that can help to
decrease the risk of GC-induced adverse outcomes. PAI-1 may serve as a diagnostic
marker of GC-induced diabetes, osteoporosis, and muscle wasting.
ACKNOWLEDGMENTS
This study was supported by grants-in-aid 26860152 and 24590289 from the Ministry
of Science, Education, and Culture of Japan (to Y.T. and H.K., respectively), a grant
from Japan Osteoporosis Foundation, a grant from Takeda Science Foundation, and a
grant from Kinki University.
There are no potential conflicts of interest relevant to this article.
Page 25 of 50 Diabetes

26
Y.T. researched data, contributed to the discussion, wrote the manuscript, reviewed, and
edited the manuscript. N.K., K.Oka., M.Y., K.Oku., Y.C. and O.M. contributed to the
discussion, reviewed, and edited the manuscript. H.K. contributed to the discussion,
wrote the manuscript, reviewed, and edited the manuscript. H.K. is the guarantor of this
work and, as such, had full access to all the data in the study and takes responsibility for
the integrity of the data and the accuracy of the data analysis.
REFERENCES
1. Rhen T, Cidlowski JA: Antiinflammatory action of glucocorticoids--new mechanisms
for old drugs. N Engl J Med 353:1711-1723, 2005
2. Strehl C, Buttgereit F: Optimized glucocorticoid therapy: teaching old drugs new
tricks. Mol Cell Endocrinol 380:32-40, 2013
3. van Raalte DH, Ouwens DM, Diamant M: Novel insights into
glucocorticoid-mediated diabetogenic effects: towards expansion of therapeutic
options? Eur J Clin Invest 39:81-93, 2009
4. Henneicke H, Gasparini SJ, Brennan-Speranza TC, Zhou H, Seibel MJ:
Glucocorticoids and bone: local effects and systemic implications. Trends Endocrinol
Metab 25:197-211, 2014
5. Kuo T, Harris CA, Wang JC: Metabolic functions of glucocorticoid receptor in
skeletal muscle. Mol Cell Endocrinol 380:79-88, 2013
6. Blackburn D, Hux J, Mamdani M: Quantification of the Risk of
Corticosteroid-induced Diabetes Mellitus Among the Elderly. J Gen Intern Med
17:717-720, 2002
7. Yuen KC, Chong LE, Riddle MC: Influence of glucocorticoids and growth hormone
on insulin sensitivity in humans. Diabet Med 30:651-663, 2013
8. Weinstein RS: Clinical practice. Glucocorticoid-induced bone disease. N Engl J Med
365:62-70, 2011
9. Moutsatsou P, Kassi E, Papavassiliou AG: Glucocorticoid receptor signaling in bone
Page 26 of 50Diabetes

27
cells. Trends Mol Med 18:348-359, 2012
10. Hasselgren PO, Alamdari N, Aversa Z, Gonnella P, Smith IJ, Tizio S:
Corticosteroids and muscle wasting: role of transcription factors, nuclear cofactors,
and hyperacetylation. Curr Opin Clin Nutr Metab Care 13:423-428, 2010
11. Schakman O, Gilson H, Kalista S, Thissen JP: Mechanisms of muscle atrophy
induced by glucocorticoids. Horm Res 72 Suppl 1:36-41, 2009
12. Conde J, Scotece M, Gomez R, Lopez V, Gomez-Reino JJ, Lago F, Gualillo O:
Adipokines: biofactors from white adipose tissue. A complex hub among
inflammation, metabolism, and immunity. Biofactors 37:413-420, 2011
13. Mathieu P, Lemieux I, Despres JP: Obesity, inflammation, and cardiovascular risk.
Clin Pharmacol Ther 87:407-416, 2010
14. Hoekstra T, Geleijnse JM, Schouten EG, Kluft C: Plasminogen activator
inhibitor-type 1: its plasma determinants and relation with cardiovascular risk.
Thromb Haemost 91:861-872, 2004
15. Ma LJ, Mao SL, Taylor KL, Kanjanabuch T, Guan Y, Zhang Y, Brown NJ, Swift LL,
McGuinness OP, Wasserman DH, Vaughan DE, Fogo AB: Prevention of obesity and
insulin resistance in mice lacking plasminogen activator inhibitor 1. Diabetes
53:336-346, 2004
16. Tamura Y, Kawao N, Okada K, Yano M, Okumoto K, Matsuo O, Kaji H:
Plasminogen activator inhibitor-1 is involved in streptozotocin-induced bone loss in
female mice. Diabetes 62:3170-3179, 2013
17. Naderi J, Bernreuther C, Grabinski N, Putman CT, Henkel B, Bell G, Glatzel M,
Sultan KR: Plasminogen activator inhibitor type 1 up-regulation is associated with
skeletal muscle atrophy and associated fibrosis. Am J Pathol 175:763-771, 2009
18. Koh TJ, Bryer SC, Pucci AM, Sisson TH: Mice deficient in plasminogen activator
inhibitor-1 have improved skeletal muscle regeneration. Am J Physiol Cell Physiol
289:C217-223, 2005
19. Krause MP, Moradi J, Nissar AA, Riddell MC, Hawke TJ: Inhibition of plasminogen
activator inhibitor-1 restores skeletal muscle regeneration in untreated type 1 diabetic
mice. Diabetes 60:1964-1972, 2011
20. Erem C, Nuhoglu I, Yilmaz M, Kocak M, Demirel A, Ucuncu O, Onder Ersoz H:
Blood coagulation and fibrinolysis in patients with Cushing's syndrome: increased
plasminogen activator inhibitor-1, decreased tissue factor pathway inhibitor, and
unchanged thrombin-activatable fibrinolysis inhibitor levels. J Endocrinol Invest
32:169-174, 2009
21. Darmon P, Dadoun F, Boullu-Ciocca S, Grino M, Alessi MC, Dutour A: Insulin
Page 27 of 50 Diabetes

28
resistance induced by hydrocortisone is increased in patients with abdominal obesity.
Am J Physiol Endocrinol Metab 291:E995-E1002, 2006
22. Carmeliet P, Moons L, Lijnen R, Janssens S, Lupu F, Collen D, Gerard RD:
Inhibitory role of plasminogen activator inhibitor-1 in arterial wound healing and
neointima formation: a gene targeting and gene transfer study in mice. Circulation
96:3180-3191, 1997
23. Brennan-Speranza TC, Henneicke H, Gasparini SJ, Blankenstein KI, Heinevetter U,
Cogger VC, Svistounov D, Zhang Y, Cooney GJ, Buttgereit F, Dunstan CR,
Gundberg C, Zhou H, Seibel MJ: Osteoblasts mediate the adverse effects of
glucocorticoids on fuel metabolism. J Clin Invest 122:4172-4189, 2012
24. Herrmann M, Henneicke H, Street J, Modzelewski J, Kalak R, Buttgereit F, Dunstan
CR, Zhou H, Seibel MJ: The challenge of continuous exogenous glucocorticoid
administration in mice. Steroids 74:245-249, 2009
25. Tamura Y, Kawao N, Yano M, Okada K, Matsuo O, Kaji H: Plasminogen activator
inhibitor-1 deficiency ameliorates insulin resistance and hyperlipidemia but not bone
loss in obese female mice. Endocrinology 155:1708-1717, 2014
26. Tamura Y, Sugimoto M, Murayama T, Ueda Y, Kanamori H, Ono K, Ariyasu H,
Akamizu T, Kita T, Yokode M, Arai H: Inhibition of CCR2 ameliorates insulin
resistance and hepatic steatosis in db/db mice. Arterioscler Thromb Vasc Biol
28:2195-2201, 2008
27. Kawao N, Tamura Y, Okumoto K, Yano M, Okada K, Matsuo O, Kaji H:
Plasminogen plays a crucial role in bone repair. J Bone Miner Res 28:1561-1574,
2013
28. Miki H, Yamauchi T, Suzuki R, Komeda K, Tsuchida A, Kubota N, Terauchi Y,
Kamon J, Kaburagi Y, Matsui J, Akanuma Y, Nagai R, Kimura S, Tobe K, Kadowaki
T: Essential role of insulin receptor substrate 1 (IRS-1) and IRS-2 in adipocyte
differentiation. Mol Cell Biol 21:2521-2532, 2001
29. Tanaka K, Matsumoto E, Higashimaki Y, Katagiri T, Sugimoto T, Seino S, Kaji H:
Role of osteoglycin in the linkage between muscle and bone. J Biol Chem
287:11616-11628, 2012
30. Pan Y, Shu JL, Gu HF, Zhou DC, Liu XL, Qiao QY, Fu SK, Gao FH, Jin HM:
Erythropoietin improves insulin resistance via the regulation of its receptor-mediated
signaling pathways in 3T3L1 adipocytes. Mol Cell Endocrinol 367:116-123, 2013
31. Morange PE, Lijnen HR, Alessi MC, Kopp F, Collen D, Juhan-Vague I: Influence of
PAI-1 on adipose tissue growth and metabolic parameters in a murine model of
diet-induced obesity. Arterioscler Thromb Vasc Biol 20:1150-1154, 2000
Page 28 of 50Diabetes

29
32. Miao H, Zhang Y, Lu Z, Liu Q, Gan L: FOXO1 involvement in insulin
resistance-related pro-inflammatory cytokine production in hepatocytes. Inflamm Res
61:349-358, 2012
33. Zhang ZF, Li Q, Liang J, Dai XQ, Ding Y, Wang JB, Li Y:
Epigallocatechin-3-O-gallate (EGCG) protects the insulin sensitivity in rat L6 muscle
cells exposed to dexamethasone condition. Phytomedicine 17:14-18, 2010
34. Seki T, Miyasu T, Noguchi T, Hamasaki A, Sasaki R, Ozawa Y, Okukita K, Declerck
PJ, Ariga T: Reciprocal regulation of tissue-type and urokinase-type plasminogen
activators in the differentiation of murine preadipocyte line 3T3-L1 and the hormonal
regulation of fibrinolytic factors in the mature adipocytes. J Cell Physiol 189:72-78,
2001
35. Czekay RP, Aertgeerts K, Curriden SA, Loskutoff DJ: Plasminogen activator
inhibitor-1 detaches cells from extracellular matrices by inactivating integrins. J Cell
Biol 160:781-791, 2003
36. Lopez-Alemany R, Redondo JM, Nagamine Y, Munoz-Canoves P: Plasminogen
activator inhibitor type-1 inhibits insulin signaling by competing with alphavbeta3
integrin for vitronectin binding. Eur J Biochem 270:814-821, 2003
37. Lee NK, Sowa H, Hinoi E, Ferron M, Ahn JD, Confavreux C, Dacquin R, Mee PJ,
McKee MD, Jung DY, Zhang Z, Kim JK, Mauvais-Jarvis F, Ducy P, Karsenty G:
Endocrine regulation of energy metabolism by the skeleton. Cell 130:456-469, 2007
38. Ferron M, Hinoi E, Karsenty G, Ducy P: Osteocalcin differentially regulates beta
cell and adipocyte gene expression and affects the development of metabolic diseases
in wild-type mice. Proc Natl Acad Sci U S A 105:5266-5270, 2008
39. Jia D, O'Brien CA, Stewart SA, Manolagas SC, Weinstein RS: Glucocorticoids act
directly on osteoclasts to increase their life span and reduce bone density.
Endocrinology 147:5592-5599, 2006
40. Dovio A, Perazzolo L, Osella G, Ventura M, Termine A, Milano E, Bertolotto A,
Angeli A: Immediate fall of bone formation and transient increase of bone resorption
in the course of high-dose, short-term glucocorticoid therapy in young patients with
multiple sclerosis. J Clin Endocrinol Metab 89:4923-4928, 2004
41. Kim HJ, Zhao H, Kitaura H, Bhattacharyya S, Brewer JA, Muglia LJ, Patrick Ross F,
Teitelbaum SL: Glucocorticoids and the osteoclast. Ann N Y Acad Sci 1116:335-339,
2007
42. Kim HJ, Zhao H, Kitaura H, Bhattacharyya S, Brewer JA, Muglia LJ, Ross FP,
Teitelbaum SL: Glucocorticoids suppress bone formation via the osteoclast. J Clin
Invest 116:2152-2160, 2006
Page 29 of 50 Diabetes

30
43. Kaji H: Interaction between Muscle and Bone. J Bone Metab 21:29-40, 2014
44. Kaji H: Linkage between muscle and bone: common catabolic signals resulting in
osteoporosis and sarcopenia. Curr Opin Clin Nutr Metab Care 16:272-277, 2013
45. Schacke H, Docke WD, Asadullah K: Mechanisms involved in the side effects of
glucocorticoids. Pharmacol Ther 96:23-43, 2002
46. Dimova EY, Kietzmann T: Metabolic, hormonal and environmental regulation of
plasminogen activator inhibitor-1 (PAI-1) expression: lessons from the liver. Thromb
Haemost 100:992-1006, 2008
47. Konkle BA, Schuster SJ, Kelly MD, Harjes K, Hassett DE, Bohrer M, Tavassoli M:
Plasminogen activator inhibitor-1 messenger RNA expression is induced in rat
hepatocytes in vivo by dexamethasone. Blood 79:2636-2642, 1992
48. Oishi K, Ohkura N, Matsuda J, Ishida N: Food deprivation induces adipose
plasminogen activator inhibitor-1 (PAI-1) expression without accumulation of
plasma PAI-1 in genetically obese and diabetic db/db mice. Thromb Haemost
98:864-870, 2007
49. Siegel C, Turtzo C, McCullough LD: Sex differences in cerebral ischemia: possible
molecular mechanisms. J Neurosci Res 88:2765-2774, 2010
50. Karasik D, Ferrari SL: Contribution of gender-specific genetic factors to
osteoporosis risk. Ann Hum Genet 72:696-714, 2008
Page 30 of 50Diabetes

31
FIGURE LEGENDS
FIG. 1. Effects of glucocorticoid (GC) on the levels of circulating PAI-1 and on
PAI-1 expression in mice
The growth curve during experiments (A, B), the percentage of fat mass (C, D), and
visceral and subcutaneous fat mass (E, F) in placebo-treated (Cont) WT,
corticosterone-treated (CS) WT, Cont PAI-1 knockout (KO), and CS PAI-1 KO female
and male mice. ##
P < 0.01 versus Cont WT mice, **P < 0.01 versus Cont KO mice (n =
11 and 6 in each group of female and male mice, respectively). The levels of plasma
PAI-1 (G, H) in both sexes of Cont and CS WT mice. **P < 0.01 (n = 11 and 6 in each
group of female and male mice, respectively). The levels of PAI-1 mRNA in white
adipose tissues (WAT), liver, muscle, tibia, heart, lung, kidney, and spleen (I) in Cont
and CS WT female mice. **P < 0.01 (n = 5 in each group). The results are shown
relative to β-actin mRNA values (mean ± SEM). Two-way repeated-measures ANOVA
and 2-way ANOVA (2WA) were used for growth curve (A, B) and for fat mass (C-F),
respectively, to compare the drug effects of (d) placebo and the corticosterone pellets
(Cont and CS) on both the genotypes of mice (g) (PAI-1 WT and PAI-1 KO). When
significant differences were observed among individual means, post hoc analysis was
carried out using Tukey’s test. For assessment of body fat composition using a
Page 31 of 50 Diabetes
32
quantitative computed tomography (qCT) scan, contiguous 2-mm slice images between
L1 and L5 were used for quantitative assessment in the LaTheta software (version 3.40).
Visceral fat and subcutaneous fat were identified, and the total fat content, visceral-fat
weight, and subcutaneous-fat weight were calculated from all slice images and were
evaluated quantitatively. The percentage of fat mass was calculated by dividing total fat
mass by total body mass.
FIG. 2. Effects of the PAI-1 deficiency on glucocorticoid (GC)-induced abnormal
glucose metabolism in female mice
The fasting levels of blood glucose (A, B) and plasma insulin (C, D) in placebo-treated
(Cont) WT, corticosterone-treated (CS) WT, Cont PAI-1 knockout (KO), and CS PAI-1
KO female and male mice. The results are presented as mean ± SEM. **P < 0.01 (n =
11 and 6 in each group of female and male mice, respectively). Responses of blood
glucose to a single intraperitoneal (i.p.) injection of insulin (E, F) in Cont WT (open
circles), CS WT (open squares), Cont PAI-1 KO (closed circles), and CS PAI-1 KO
(closed squares) female mice (n = 5 and 6 in each group of female and male mice,
respectively). Responses of blood glucose levels (G, H) to a single i.p. injection of
glucose in Cont WT (open circles), CS WT (open squares), Cont PAI-1 KO (closed
Page 32 of 50Diabetes

33
circles), and CS PAI-1 KO (closed squares) female and male mice (n = 11 and 6 in each
group of female and male mice, respectively). Responses of plasma insulin (I, J) to a
single i.p. injection of glucose in Cont WT (open circles), CS WT (open squares), Cont
PAI-1 KO (closed circles), and CS PAI-1 KO (closed squares) female and male mice; (n
= 6 and 6 in each group of female and male mice, respectively). The results are
presented as mean ± SEM. *P < 0.05, **P < 0.01 versus CS WT mice. Two-way
ANOVA (2WA) and 2-way repeated-measures ANOVA were used for A-D and for E-J,
respectively, to compare the drug effects (d) of a placebo and a corticosterone pellet
(Cont and CS) on the mice of 2 genotypes (g) (PAI-1 WT and PAI-1 KO). When
significant differences were observed, individual means of the bars were compared
using Tukey’s post hoc test.
FIG. 3. The influence of PAI-1 and dexamethasone on insulin signaling in
hepatocytes, myocytes, and adipocytes in vitro
Phosphorylation of Akt, stimulated by insulin treatment (100 nM) for 15 min with or
without active PAI-1 (20 nM) and dexamethasone (Dex, 100 nM) treatment for 24 h in
HepG2 cells (A), differentiated C2C12 cells (B), and differentiated 3T3-L1 cells (C).
2-Deoxyglucose uptake [the concentration of 2-deoxyglucose-6-phosphate (2DG6P)]
Page 33 of 50 Diabetes
34
stimulated by insulin treatment (1 µM) for 20 min with or without active PAI-1 (20 nM)
and Dex (1 µM) treatment for 24 h in HepG2 cells (D), differentiated C2C12 cells (E),
and differentiated 3T3-L1 cells (F). The results are presented as mean ± SEM of 3
experiments; *P < 0.05, **P < 0.01. Tukey’s post hoc test was used. The mRNA levels
of G6Pase (G) and PEPCK (H) in HepG2 cells incubated with or without active PAI-1
(20 nM) and dexamethasone (Dex, 100 nM) in the presence of as well as without insulin
(1 nM) for 24 h. The results are presented as mean ± SEM of 6 experiments; *P < 0.05,
**P < 0.01. Tukey’s post hoc test was used
FIG. 4. Effects of the PAI-1 deficiency on hyperlipidemia induced by
glucocorticoid (GC) in mice
The levels of plasma triglycerides (TG) (A, B) and total cholesterol (T-Chol) (C, D) in
placebo-treated (Cont) WT, corticosterone-treated (CS) WT, Cont PAI-1 knockout (KO),
and CS PAI-1 KO female and male mice. The results are shown as mean ± SEM (n = 11
and 6 in each group of female and male mice, respectively). Two-way ANOVA (2WA)
was used to compare the drug effects (d) of the placebo and corticosterone pellet (Cont
and CS) on the mice of 2 genotypes (g) (PAI-1 WT and PAI-1 KO). When significant
differences were observed, individual means of the bars were compared using Tukey’s
Page 34 of 50Diabetes

35
post hoc test.
FIG. 5. Effects of the PAI-1 deficiency on bone loss induced by glucocorticoid (GC)
treatment in mice
BMD values in total (A, B), trabecular (C, D), and cortical bones (E, F), bone volume
fraction (BV/TV) (G, H), cortical thickness (I, J), cortical area (K, L), total
cross-sectional area (M, N), and trabecular area (O, P) of the tibia in placebo-treated
(Cont) WT, corticosterone-treated (CS) WT, Cont PAI-1 knockout (KO), and CS PAI-1
KO female and male mice. The results are presented as mean ± SEM; *P < 0.05, **P <
0.01 (n = 11 and 6 in each group of female and male mice, respectively). Two-way
ANOVA (2WA) was used to compare the drug effects (d) of the placebo and
corticosterone pellet (Cont and CS) on the mice of 2 genotypes (g) (PAI-1 WT and
PAI-1 KO). When significant differences were observed, individual means of the bars
were compared using Tukey’s post hoc test. For assessment of trabecular BMD, total
bone volume, trabecular bone volume, and bone trabecular area, trabecular regions of
interest (ROIs) extended from 96 um distal to the end of the proximal growth plate over
1.5 mm toward the diaphysis. For assessment of cortical BMD, thickness and area,
ROIs were defined as 2.0-mm segments of the mid-diaphysis tibia. For assessment of
Page 35 of 50 Diabetes

36
total BMD and total cross-sectional area, ROIs were defined as 9,600-µm segments
(100 slices) from the distal end of the proximal growth plate of the tibia. The bone
volume fraction was calculated as the ratio of trabecular bone volume (BV [mm3]) to
the total bone volume (TV [mm3]). Parameters used for the CT scans were as follows:
tube voltage, 50 kVp; tube current, 500 µA; integration time, 3.6 ms; axial field of view,
48 mm; and voxel size of 48 × 96 µm with a slice thickness of 96 µm. Bone parameters
were analyzed using the LaTheta software (version 3.40).
FIG. 6. Effects of the PAI-1 deficiency on abnormal bone metabolism induced by
GC treatment in female mice
The levels of expression of Runx2, Osterix, Alp, Ocn, and Col1 mRNA in the tibia (A),
plasma osteocalcin (OCN) (B), and plasma uncarboxylated OCN (ucOCN) (C) in
placebo-treated (Cont) WT (n = 5), corticosterone-treated (CS) WT (n = 5), Cont PAI-1
knockout (KO; n = 5), and CS PAI-1 KO (n = 5) female mice. The number of
ALP-positive cells on the bone surface of tibia in Cont WT (n = 5), CS WT (n = 5),
Cont PAI-1 KO (n = 5), and CS PAI-1 KO (n = 5) female mice (D). The levels of
RANKL and OPG mRNA in tibia, and RANKL/OPG ratio, plasma cross-linked
C-telopeptide of type I collagen (CTX), and the number of tartrate-resistant acid
Page 36 of 50Diabetes

37
phosphatase (TRAP)-positive multinucleated cells in the tibia of Cont WT (n = 5), CS
WT (n = 5), Cont PAI-1 KO (n = 5), and CS PAI-1 KO (n = 5) female mice (E). The
results are shown as mean ± SEM; **P < 0.01. The results of mRNA expression are
shown relative to β-actin mRNA values. Two-way ANOVA (2WA) was used to compare
the drug effects (d) of the placebo and corticosterone pellet (Cont and CS) on the mice
of 2 genotypes (g) (PAI-1 WT and PAI-1 KO). When significant differences were
observed, individual means of the bars were compared by means of Tukey’s post hoc
test.
FIG. 7. The influence of PAI-1 on apoptosis and proliferation of osteoblasts
The number of terminal deoxynucleotidyl transferase-mediated dUTP nick end labeling
(TUNEL)-positive cells on the bone surface in the tibia of placebo-treated (Cont) WT (n
= 5), corticosterone-treated (CS) WT (n = 5), Cont PAI-1 knockout (KO; n = 5), and CS
PAI-1 KO (n = 5) female mice (A). Two-way ANOVA (2WA) was used to compare the
drug effects (d) of the placebo and corticosterone pellet (Cont and CS) on the mice of 2
genotypes (g) (PAI-1 WT and PAI-1 KO). When significant differences were observed,
individual means of the bars were compared using Tukey’s post hoc test. The cell death
rate in primary osteoblasts (OB) from female mouse calvaria (B) and MC3T3E1 cells
Page 37 of 50 Diabetes

38
(C) incubated with or without active PAI-1 (20 nM) for 24 h. Cell death was identified
by trypan blue staining. The number of apoptotic primary OBs from female mouse
calvaria (D) and MC3T3E1 (E) cells incubated with or without active PAI-1 (20 nM) for
24 h. Apoptotic cells were identified by TUNEL staining. The results are shown as mean
± SEM of 3 experiments; **P < 0.01. Unpaired t-test was used. Proliferation of primary
OBs from WT female-mouse calvaria (F) and MC3T3E1 cells (G) incubated with or
without active PAI-1 (20 nM) for 24 h. Proliferation of primary OBs from female WT
and PAI-1 KO mouse calvaria incubated with or without dexamethasone (Dex; 100 nM)
(H). Cell proliferation was assessed using a bromodeoxyuridine (BrdU) incorporation
assay. The results are shown as mean ± SEM of 3 experiments. Two-way ANOVA
(2WA) was used to compare the drug effects (d) of vehicle and Dex (Cont and Dex) on
the mice of 2 genotypes (g) (PAI-1 WT and PAI-1 KO). When significant differences
were observed, individual means of the bars were compared using Tukey’s post hoc test.
FIG. 8. Effects of the PAI-1 deficiency on muscle wasting induced by glucocorticoid
(GC) treatment in mice
Total muscle mass (A, B) in placebo-treated (Cont) WT, corticosterone-treated (CS) WT,
Cont PAI-1 knockout (KO), and CS PAI-1 KO female and male mice. The results are
Page 38 of 50Diabetes

39
shown as mean ± SEM; *P < 0.05, **P < 0.01 (n = 11 and 6 in each group of female and
male mice, respectively). Tissue weight of the gastrocnemius muscle (GAS) and soleus
muscle (C, D) in Cont WT, CS WT, Cont PAI-1 KO, and CS PAI-1 KO female and male
mice. Cross-sectional area (CSA) of a myofiber (E), and the mRNA levels of MyoD,
myogenin, and myosin heavy chain (MHC) (F) in the gastrocnemius muscle in Cont WT,
CS WT, Cont PAI-1 KO, and CS PAI-1 KO female mice. For assessment of the
cross-sectional area of a myofiber, a minimum of 1000 myofibers per muscle were
analyzed on a hematoxylin and eosin-stained gastrocnemius muscle slice. The results
are presented as mean ± SEM; *P < 0.05, **P < 0.01 (n = 6 in each group of female and
male mice, respectively). Two-way ANOVA (2WA) was used to compare the drug
effects (d) of the placebo and corticosterone pellet (Cont and CS) on the mice of 2
genotypes (g) (PAI-1 WT and PAI-1 KO). When significant differences were observed,
individual means of the bars were compared using Tukey’s post hoc test. For assessment
of total muscle mass using a qCT scan, contiguous 2-mm slice images between L1 and
the toe were used for quantitative assessment in the LaTheta software (version 3.40).
The proposed hypothesis for the role of PAI-1 in the pathogenesis of insulin resistance,
bone loss, and muscle wasting induced by GC in mice (G): GC increases PAI-1
expression in adipose tissue, resulting in elevation of circulating PAI-1 levels in mice.
Page 39 of 50 Diabetes

40
An elevated level of circulating PAI-1 induces insulin resistance in the liver, bone loss
due to the increased apoptosis of osteoblasts, and muscle wasting in mice.
Page 40 of 50Diabetes
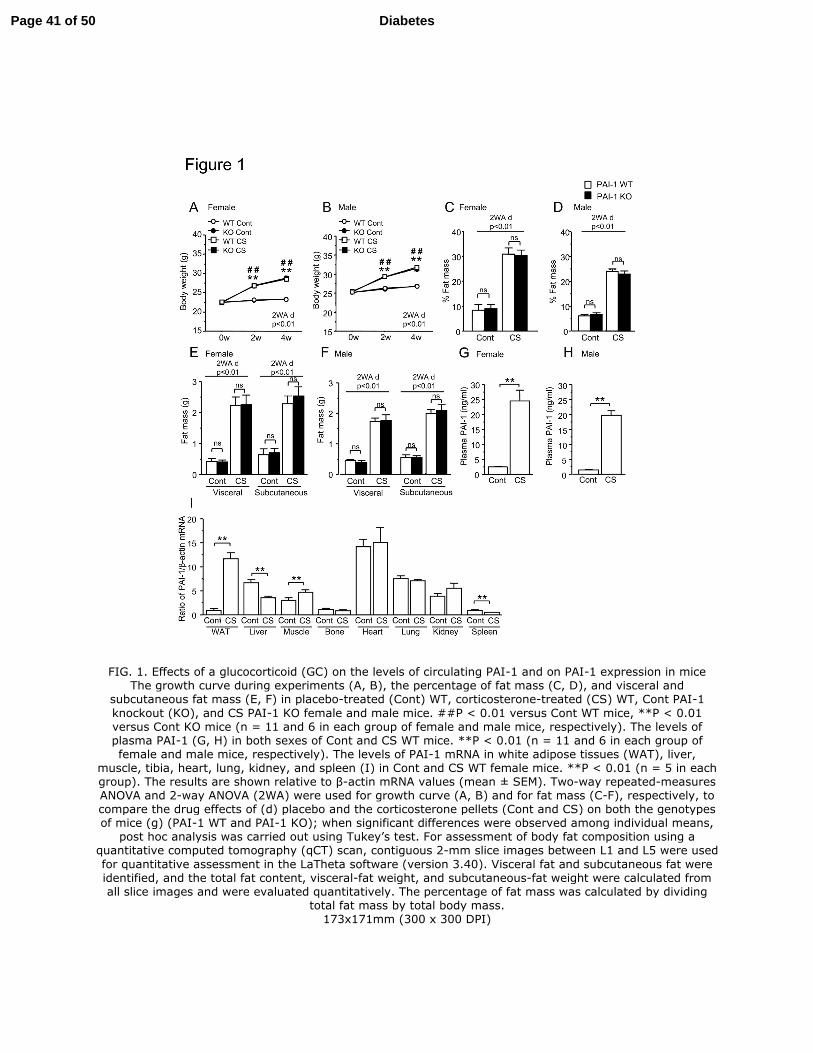
FIG. 1. Effects of a glucocorticoid (GC) on the levels of circulating PAI-1 and on PAI-1 expression in mice The growth curve during experiments (A, B), the percentage of fat mass (C, D), and visceral and
subcutaneous fat mass (E, F) in placebo-treated (Cont) WT, corticosterone-treated (CS) WT, Cont PAI-1
knockout (KO), and CS PAI-1 KO female and male mice. ##P < 0.01 versus Cont WT mice, **P < 0.01 versus Cont KO mice (n = 11 and 6 in each group of female and male mice, respectively). The levels of plasma PAI-1 (G, H) in both sexes of Cont and CS WT mice. **P < 0.01 (n = 11 and 6 in each group of female and male mice, respectively). The levels of PAI-1 mRNA in white adipose tissues (WAT), liver,
muscle, tibia, heart, lung, kidney, and spleen (I) in Cont and CS WT female mice. **P < 0.01 (n = 5 in each group). The results are shown relative to β-actin mRNA values (mean ± SEM). Two-way repeated-measures ANOVA and 2-way ANOVA (2WA) were used for growth curve (A, B) and for fat mass (C-F), respectively, to compare the drug effects of (d) placebo and the corticosterone pellets (Cont and CS) on both the genotypes of mice (g) (PAI-1 WT and PAI-1 KO); when significant differences were observed among individual means,
post hoc analysis was carried out using Tukey’s test. For assessment of body fat composition using a quantitative computed tomography (qCT) scan, contiguous 2-mm slice images between L1 and L5 were used
for quantitative assessment in the LaTheta software (version 3.40). Visceral fat and subcutaneous fat were identified, and the total fat content, visceral-fat weight, and subcutaneous-fat weight were calculated from all slice images and were evaluated quantitatively. The percentage of fat mass was calculated by dividing
total fat mass by total body mass. 173x171mm (300 x 300 DPI)
Page 41 of 50 Diabetes

Page 42 of 50Diabetes

FIG. 2. Effects of the PAI-1 deficiency on glucocorticoid (GC)-induced abnormal glucose metabolism in female mice
The fasting levels of blood glucose (A, B) and plasma insulin (C, D) in placebo-treated (Cont) WT,
corticosterone-treated (CS) WT, Cont PAI-1 knockout (KO), and CS PAI-1 KO female and male mice. The results are presented as mean ± SEM. **P < 0.01 (n = 11 and 6 in each group of female and male mice, respectively). Responses of blood glucose to a single intraperitoneal (i.p.) injection of insulin (E, F) in Cont WT (open circles), CS WT (open squares), Cont PAI-1 KO (closed circles), and CS PAI-1 KO (closed squares) female mice (n = 5 and 6 in each group of female and male mice, respectively). Responses of blood glucose levels (G, H) to a single i.p. injection of glucose in Cont WT (open circles), CS WT (open squares), Cont PAI-1 KO (closed circles), and CS PAI-1 KO (closed squares) female and male mice (n = 11 and 6 in each group of female and male mice, respectively). Responses of plasma insulin (I, J) to a single i.p. injection of glucose in Cont WT (open circles), CS WT (open squares), Cont PAI-1 KO (closed circles), and CS PAI-1 KO (closed squares) female and male mice; (n = 6 and 6 in each group of female and male mice, respectively). The results are presented as mean ± SEM. *P < 0.05, **P < 0.01 versus CS WT mice. Two-way ANOVA (2WA)
and 2-way repeated-measures ANOVA were used for A-D and for E-J, respectively, to compare the drug effects (d) of a placebo and a corticosterone pellet (Cont and CS) on the mice of 2 genotypes (g) (PAI-1 WT and PAI-1 KO). When significant differences were observed, individual means of the bars were compared
using Tukey’s post hoc test.
Page 43 of 50 Diabetes

188x203mm (300 x 300 DPI)
Page 44 of 50Diabetes

FIG. 3. The influence of PAI-1 and dexamethasone on insulin signaling in hepatocytes, myocytes, and adipocytes in vitro
Phosphorylation of Akt, stimulated by insulin treatment (100 nM) for 15 min with or without active PAI-1 (20 nM) and dexamethasone (Dex, 100 nM) treatment for 24 h in HepG2 cells (A), differentiated C2C12 cells (B), and differentiated 3T3-L1 cells (C). 2-Deoxyglucose uptake (the concentration of 2-deoxyglucose-6-
phosphate (2DG6P)) stimulated by insulin treatment (1 µM) for 20 min with or without active PAI-1 (20 nM) and Dex (1 µM) treatment for 24 h in HepG2 cells (D), differentiated C2C12 cells (E), and differentiated 3T3-
L1 cells (F). The results are presented as mean ± SEM of 3 experiments; *P < 0.05, **P < 0.01. Tukey’s
post hoc test was used. The mRNA levels of G6Pase (G) and PEPCK (H) in HepG2 cells incubated with or without active PAI-1 (20 nM) and dexamethasone (Dex, 100 nM) in the presence of as well as without
insulin (1 nM) for 24 h. The results are presented as mean ± SEM of 6 experiments; *P < 0.05, **P < 0.01. Tukey’s post hoc test was used. 179x184mm (300 x 300 DPI)
Page 45 of 50 Diabetes

FIG. 4. Effects of the PAI-1 deficiency on hyperlipidemia induced by glucocorticoid (GC) in mice The levels of plasma triglycerides (TG) (A, B) and total cholesterol (T-chol) (C, D) in placebo-treated (Cont) WT, corticosterone-treated (CS) WT, Cont PAI-1 knockout (KO), and CS PAI-1 KO female and male mice. The results are shown as mean ± SEM; **P < 0.01 (n = 11 and 6 in each group of female and male mice,
respectively). Two-way ANOVA (2WA) was used to compare the drug effects (d) of the placebo and corticosterone pellet (Cont and CS) on the mice of 2 genotypes (g) (PAI-1 WT and PAI-1 KO). When
significant differences were observed, individual means of the bars were compared using Tukey’s post hoc test.
83x39mm (300 x 300 DPI)
Page 46 of 50Diabetes

FIG. 5. Effects of the PAI-1 deficiency on bone loss induced by glucocorticoid (GC) treatment in mice BMD values in total (A, B), trabecular (C, D), and cortical bones (E, F), bone volume fraction (BV/TV) (G, H), cortical thickness (I, J), cortical area (K, L), total cross-sectional area (M, N), and trabecular area (O, P) of the tibia in placebo-treated (Cont) WT, corticosterone-treated (CS) WT, Cont PAI-1 knockout (KO), and CS PAI-1 KO female and male mice. The results are presented as mean ± SEM; *P < 0.05, **P < 0.01 (n = 11 and 6 in each group of female and male mice, respectively). Two-way ANOVA (2WA) was used to compare the drug effects (d) of the placebo and corticosterone pellet (Cont and CS) on the mice of 2 genotypes (g) (PAI-1 WT and PAI-1 KO). When significant differences were observed, individual means of the bars were
compared using Tukey’s post hoc test. For assessment of trabecular BMD, total bone volume, trabecular bone volume, and bone trabecular area, trabecular regions of interest (ROIs) extended from 96 um distal to the end of the proximal growth plate over 1.5 mm toward the diaphysis. For assessment of cortical BMD, thickness and area, ROIs were defined as 2.0-mm segments of the mid-diaphysis tibia. For assessment of total BMD and total cross-sectional area, ROIs were defined as 9,600-µm segments (100 slices) from the
Page 47 of 50 Diabetes

distal end of the proximal growth plate of the tibia. The bone volume fraction was calculated as the ratio of trabecular bone volume (BV [mm3]) to the total bone volume (TV [mm3]). Parameters used for the CT scans were as follows: tube voltage, 50 kVp; tube current, 500 µA; integration time, 3.6 ms; axial field of view, 48 mm; and voxel size of 48 × 96 µm with a slice thickness of 96 µm. Bone parameters were analyzed
using the LaTheta software (version 3.40).
208x249mm (300 x 300 DPI)
Page 48 of 50Diabetes

FIG. 6. Effects of the PAI-1 deficiency on abnormal bone metabolism induced by GC treatment in female mice
The levels of expression of Runx2, Osterix, Alp, Ocn, and Col1 mRNA in the tibia (A), plasma osteocalcin
(OCN) (B), and plasma uncarboxylated OCN (ucOCN) (C) in placebo-treated (Cont) WT (n = 5), corticosterone-treated (CS) WT (n = 5), Cont PAI-1 knockout (KO; n = 5), and CS PAI-1 KO (n = 5) female mice. The number of ALP-positive cells on the bone surface of tibia in Cont WT (n = 5), CS WT (n = 5), Cont PAI-1 KO (n = 5), and CS PAI-1 KO (n = 5) female mice (D). The levels of RANKL and OPG mRNA in tibia,
and RANKL/OPG ratio, plasma cross-linked C-telopeptide of type I collagen (CTX), and the number of tartrate-resistant acid phosphatase (TRAP)-positive multinucleated cells in the tibia of Cont WT (n = 5), CS WT (n = 5), Cont PAI-1 KO (n = 5), and CS PAI-1 KO (n = 5) female mice (E). The results are shown as
mean ± SEM; **P < 0.01. The results of mRNA expression are shown relative to β-actin mRNA values. Two-way ANOVA (2WA) was used to compare the drug effects (d) of the placebo and corticosterone pellet (Cont
and CS) on the mice of 2 genotypes (g) (PAI-1 WT and PAI-1 KO). When significant differences were observed, individual means of the bars were compared by means of Tukey’s post hoc test.
170x166mm (300 x 300 DPI)
Page 49 of 50 Diabetes

FIG. 7. The influence of PAI-1 on apoptosis and proliferation of osteoblasts The number of terminal deoxynucleotidyl transferase-mediated dUTP nick end labeling (TUNEL)-positive cells on the bone surface in the tibia of placebo-treated (Cont) WT (n = 5), corticosterone-treated (CS) WT (n = 5), Cont PAI-1 knockout (KO; n = 5), and CS PAI-1 KO (n = 5) female mice (A). Two-way ANOVA (2WA)
was used to compare the drug effects (d) of the placebo and corticosterone pellet (Cont and CS) on the mice of 2 genotypes (g) (PAI-1 WT and PAI-1 KO). When significant differences were observed, individual means of the bars were compared using Tukey’s post hoc test. The cell death rate in primary osteoblasts (OB) from female mouse calvaria (B) and MC3T3E1 cells (C) incubated with or without active PAI-1 (20 nM) for 24 h.
Cell death was identified by trypan blue staining. The number of apoptotic primary OBs from female mouse calvaria (D) and MC3T3E1 (E) cells incubated with or without active PAI-1 (20 nM) for 24 h. Apoptotic cells were identified by TUNEL staining. The results are shown as mean ± SEM of 3 experiments; **P < 0.01. Unpaired t-test was used. Proliferation of primary OBs from WT female-mouse calvaria (F) and MC3T3E1 cells (G) incubated with or without active PAI-1 (20 nM) for 24 h. Proliferation of primary OBs from female
WT and PAI-1 KO mouse calvaria incubated with or without dexamethasone (Dex; 100 nM) (H). Cell proliferation was assessed using a bromodeoxyuridine (BrdU) incorporation assay. The results are shown as mean ± SEM of 3 experiments. Two-way ANOVA (2WA) was used to compare the drug effects (d) of vehicle
and Dex (Cont and Dex) on the mice of 2 genotypes (g) (PAI-1 WT and PAI-1 KO). When significant differences were observed, individual means of the bars were compared using Tukey’s post hoc test.
133x101mm (300 x 300 DPI)
Page 50 of 50Diabetes
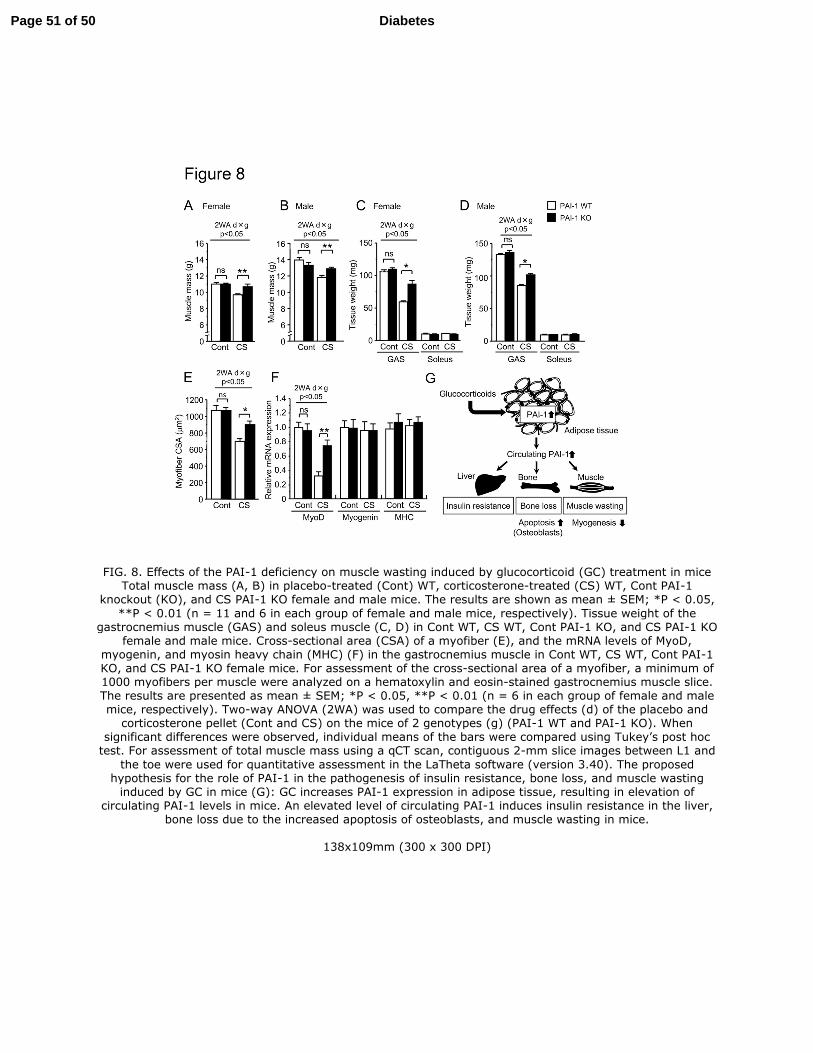
FIG. 8. Effects of the PAI-1 deficiency on muscle wasting induced by glucocorticoid (GC) treatment in mice Total muscle mass (A, B) in placebo-treated (Cont) WT, corticosterone-treated (CS) WT, Cont PAI-1
knockout (KO), and CS PAI-1 KO female and male mice. The results are shown as mean ± SEM; *P < 0.05,
**P < 0.01 (n = 11 and 6 in each group of female and male mice, respectively). Tissue weight of the gastrocnemius muscle (GAS) and soleus muscle (C, D) in Cont WT, CS WT, Cont PAI-1 KO, and CS PAI-1 KO
female and male mice. Cross-sectional area (CSA) of a myofiber (E), and the mRNA levels of MyoD, myogenin, and myosin heavy chain (MHC) (F) in the gastrocnemius muscle in Cont WT, CS WT, Cont PAI-1 KO, and CS PAI-1 KO female mice. For assessment of the cross-sectional area of a myofiber, a minimum of 1000 myofibers per muscle were analyzed on a hematoxylin and eosin-stained gastrocnemius muscle slice. The results are presented as mean ± SEM; *P < 0.05, **P < 0.01 (n = 6 in each group of female and male mice, respectively). Two-way ANOVA (2WA) was used to compare the drug effects (d) of the placebo and corticosterone pellet (Cont and CS) on the mice of 2 genotypes (g) (PAI-1 WT and PAI-1 KO). When
significant differences were observed, individual means of the bars were compared using Tukey’s post hoc test. For assessment of total muscle mass using a qCT scan, contiguous 2-mm slice images between L1 and
the toe were used for quantitative assessment in the LaTheta software (version 3.40). The proposed hypothesis for the role of PAI-1 in the pathogenesis of insulin resistance, bone loss, and muscle wasting induced by GC in mice (G): GC increases PAI-1 expression in adipose tissue, resulting in elevation of
circulating PAI-1 levels in mice. An elevated level of circulating PAI-1 induces insulin resistance in the liver, bone loss due to the increased apoptosis of osteoblasts, and muscle wasting in mice.
138x109mm (300 x 300 DPI)
Page 51 of 50 Diabetes

SUPPLEMENTARY DATA
Supplementary Figure 1. The influence of glucocorticoid (GC) treatment and the
PAI-1 deficiency on lipid accumulation in adipose, liver, and muscle tissues of
female mice.
A representative picture of the adipose tissue (A), liver (B), and muscle tissue (C) of
placebo-treated (Cont) WT, corticosterone-treated (CS) WT, Cont PAI-1 knockout (KO),
and CS PAI-1 KO female mice (bar: 50 µm). Triglyceride content in the liver (D) and
gastrocnemius muscle tissue (E) of Cont WT, CS WT, Cont PAI-1 KO, and CS PAI-1
KO female mice. The results are presented as mean ± SEM; *P < 0.05, **P < 0.01 (n =
6 in each group of female mice). Two-way ANOVA (2WA) was used to compare the
drug effects (d) of the placebo and corticosterone pellet (Cont and CS) on the mice of 2
genotypes (g) (PAI-1 WT and PAI-1 KO). When significant differences were observed,
individual means of the bars were compared using Tukey’s post hoc test.
Page 52 of 50Diabetes

PAI-1: plasminogen activator inhibitor 1, RANKL: receptor activator of nuclear
factor-кB ligand, MHC: myosin heavy chain, GAPDH: glyceraldehyde 3-phosphate
dehydrogenase.
Supplementary Table 1. Primer used for real-time PCR
Primer Sequence
Mouse
PAI-1 Forward 5’-TTCAGCCCTTGCTTGCCTC-3’
PAI-1 Reverse 5’-ACACTTTTACTCCGAAGTCGGT-3'
Runx2 Forward 5'-AAATGCCTCCGCTGTTATGAA-3'
Runx2 Reverse 5'-GCTCCGGCCCACAAATCT-3'
Osterix Forward 5’-AGCGACCACTTGAGCAAACAT-3’
Osterix Reverse 5’-GCGGCTGATTGGCTTCTT-3’
Alkaline phosphatase Forward 5’-ATCTTTGGTCTGGCTCCCATG-3’
Alkaline phosphatase Reverse 5’-TTTCCCGTTCACCGTCCAC-3’
Osteocalcin Forward 5’-CCTGAGTCTGACAAAGCCTTCA-3’
Osteocalcin Reverse 5’-GCCGGAGTCTGTTCACTACCTT-3’
Type 1 collagen Forward 5’-AACCCTGCCCGCACATG-3’
Type 1 collagen Reverse 5’-CAGACGGCTGAGTAGGGAACA’-3
RANKL Forward 5'-CACAGCGCTTCTCAGGAGCT-3'
RANKL Reverse 5'-CATCCA ACCATGAGCCTTCC-3'
Osteoprotegerin Forward 5’-CTTGGGTCTGTTGCTTGGTGA-3’
Osteoprotegerin Reverse 5’-GCCGCTTCCTTACACACCAG-3’
MyoD Forward 5’-AGCACTACAGTGGCGACTCAG-3’
MyoD Reverse 5’-AGGCGGTGTCGTAGCCATTC-3’
Myogenin Forward 5’-GCTGCCTAAAGTGGAGATCCT-3’
Myogenin Reverse 5’-GCGCTGTGGGAGTTGCAT-3’
MHC Forward 5’-CTCTTCCCGCTTTGGTAAGTT-3’
MHC Reverse 5’-CAGGAGCATTTCGATTAGATCCG-3’
β-actin Forward 5’-TACCACAGGCATTGTGATGG-3’
β-actin Reverse 5’-TTTGATGTCACGCACGATTT-3’
Human
Glucose-6-phosphatase Forward 5’-TCATCTTGGTGTCCGTGATCG-3’
Glucose-6-phosphatase Reverse 5’-TTTATCAGGGGCACGGAAGTG-3’
PEPCK Forward 5’-GAAAAAACCTGGGGCACAT-3’
PEPCK Reverse 5’-TTGCTTCAAGGCAAGGATCTCT-3’
GAPDH Forward 5’-ACCACAGTCCATGCCATCAC-3’
GAPDH Reverse 5’-TCCACCACCCTGTTGCTGTA-3’
Page 53 of 50 Diabetes


![Glucocorticoid-induced Cell Death Requires …...[CANCER RESEARCH 59, 1378–1385, March 15, 1999] Glucocorticoid-induced Cell Death Requires Autoinduction of Glucocorticoid Receptor](https://img.dokumen.tips/doc/110x75/5e5646d0314f24389e233453/glucocorticoid-induced-cell-death-requires-cancer-research-59-1378a1385.jpg)