Embed Size (px)
Citation preview

Rock.AR - A Point Counting application for Petrographic Thin Sections
Martın L. Larrea∗
Universidad Nacional del Sur,Depto. de Cs e Ing. de la Computacion,
Consejo Nacional de InvestigacionesCientıficas y Tecnicas (CONICET)
Sergio R. Martig†
Universidad Nacional del Sur,Depto. de Cs e Ing. de la Computacion
Silvia M. Castro‡
Universidad Nacional del Sur,Depto. de Cs e Ing. de la Computacion
Paola A. Aliani§
Universidad Nacional del Sur,Depto. de Geologıa
Ernesto A. Bjerg¶
Universidad Nacional del Sur,Depto. de Geologıa,
Consejo Nacional de InvestigacionesCientıficas y Tecnicas (CONICET)
Abstract
Point counting is a technique used to determinate the componentsof a sample and the percentages that represent in it. This techniqueis applied in biological, medical, geological and materials sciencedomains. Point counting is normally conducted through mechan-ical or electromechanical devices attached to a microscope, suchdevices are very expensive and offer limited functionality. In thispaper we introduce an interactive visualization application calledRock.AR that reduces the amount of time required to apply thistechnique and simplify its work flow. Rock.AR provides visualtools, like distortion techniques, overview+detail and some statis-tics to assist the technique.
CR Categories: J.7 [Computer Applications]: Computers in OtherSystems—; H.5.2 [Information Systems]: Information Systems andPresentation—User Interfaces
Keywords: User Interfaces, Graphical user interfaces, PointCounting Technique
1 Introduction
Mineral content, chemical composition and texture are, togetherwith shape and size of mineral constituents, the main rock proper-ties measured by petrologists. Point counting of petrographic thinsections is the standard method for mineral analysis and classifica-tion of coarse grained igneous, metamorphic and sedimentary rocksamples.
Petrographic thin sections are made from slabs of rock samplesglued to a glass slide ( 1 by 2 inches) and then ground to a thicknessof 0.03 mm (30 microns). At this thickness most minerals becomemore or less transparent, allowing their study with a transmittedlight microscope. Modal analysis of petrographic thin sections is
∗e-mail:[email protected]†e-mail:[email protected]‡e-mail:[email protected]§e-mail:[email protected]¶e-mail:[email protected]
one of the most common methods and it provides two types of dataseries: a) Relative quantity of rock forming minerals, and b) Micro-scopic grain size distribution of the rocks. The relative proportionsof minerals in a rock sample are of utmost importance for the properclassification of a rock.
Performing point counting on a petrographic thin section, the do-main expert will find out the percentage of each mineral presenton it (Figure 1).This requires observations to be made at regularpositions on the sample, namely grid intersections. At each po-sition, the domain expert decides to which mineral the respectivegrid point and its local neighborhood belong. By counting the num-ber of points found for each mineral it is possible to calculate thepercentages that these values represent overall the counted points.These percentages represent the relative proportions of the mineralsin the sample. Concerning the statically correct number of countsrequired for quantitative examinations, the image to be manipulatedmust contain between 1500 and 5000 points. This value is estab-lished by the domain expert before starting the counting procedure,based on the size (area) of each mineral phase present in the sample.
The determination of the relative abundances of rock sample’s com-ponents, i.e. the modal composition, has research, educational andengineering interest. Modal composition is essential for the petro-graphic classification of rocks, and important for petrologists whenestablishing evolutionary trends. On the other hand, the ratio porevolume/total volume of rocks, soils, concrete, etc., known as poros-ity, has direct influence in the mechanical and hydraulic behaviorof the studied material.
Although there are automated image processing techniques forcounting features on microscope slides in other fields, particularlyin biology, these techniques are not easily adapted to petrographicthin sections. Because of the characteristics of the petrographicslide, the color of each conceptual unit is not homogeneous enoughto be interpreted as a single component by an automated image pro-cessing technique, based on color or grey scale images. Precisely,images obtained from rock thin sections show inhomogeneous col-ors for each mineral species due to subtle tone changes which arerelated to inhomogeneous chemical composition and/or deforma-tion due to stress affecting the rock, just to mention two of the mostcommon causes.
In petrographic thin sections, point counting is normally conductedthrough an electromechanical or electronic device attached to thepetrographic or reflected-light microscope that is capable of movingthe sample at regular steps. Due to the complexities involved inpoint counting methods executed with mechanical devices, whichare also highly time consuming, the use of images obtained fromthe samples offers several benefits, among others: Possibility ofchecking counted points in a short time, no mechanical or electronicdevices required to perform the job, the possibility of getting results
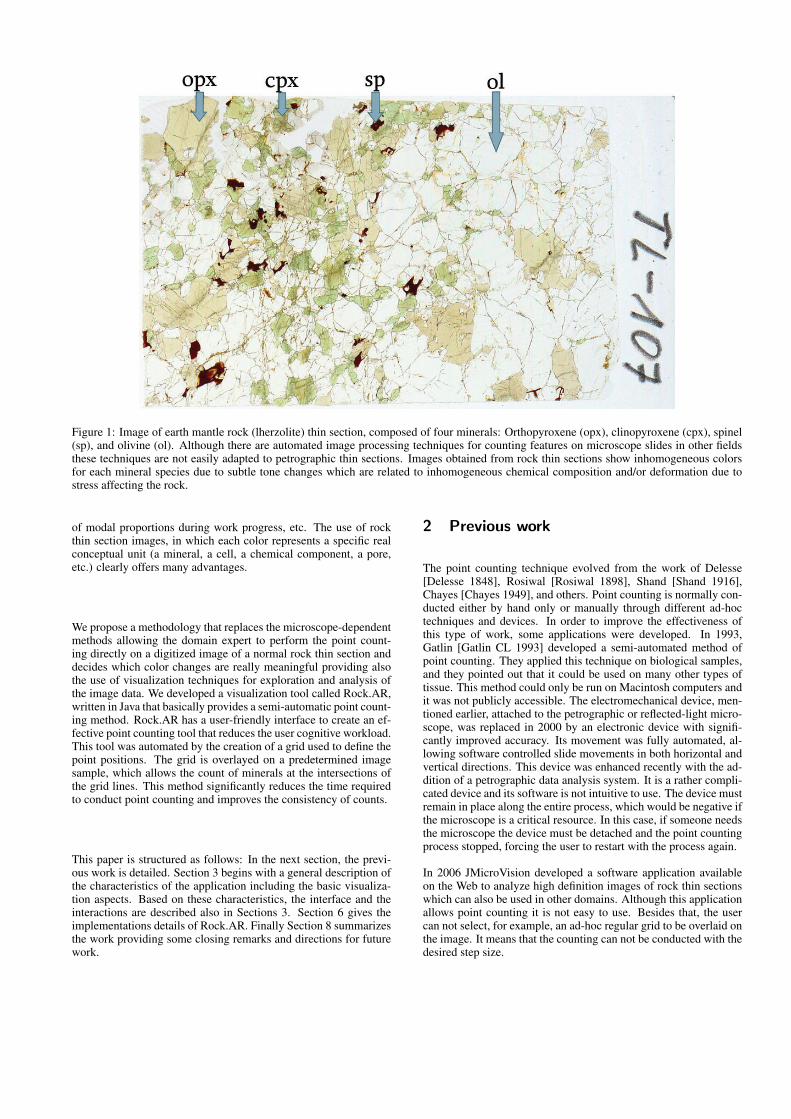
Figure 1: Image of earth mantle rock (lherzolite) thin section, composed of four minerals: Orthopyroxene (opx), clinopyroxene (cpx), spinel(sp), and olivine (ol). Although there are automated image processing techniques for counting features on microscope slides in other fieldsthese techniques are not easily adapted to petrographic thin sections. Images obtained from rock thin sections show inhomogeneous colorsfor each mineral species due to subtle tone changes which are related to inhomogeneous chemical composition and/or deformation due tostress affecting the rock.
of modal proportions during work progress, etc. The use of rockthin section images, in which each color represents a specific realconceptual unit (a mineral, a cell, a chemical component, a pore,etc.) clearly offers many advantages.
We propose a methodology that replaces the microscope-dependentmethods allowing the domain expert to perform the point count-ing directly on a digitized image of a normal rock thin section anddecides which color changes are really meaningful providing alsothe use of visualization techniques for exploration and analysis ofthe image data. We developed a visualization tool called Rock.AR,written in Java that basically provides a semi-automatic point count-ing method. Rock.AR has a user-friendly interface to create an ef-fective point counting tool that reduces the user cognitive workload.This tool was automated by the creation of a grid used to define thepoint positions. The grid is overlayed on a predetermined imagesample, which allows the count of minerals at the intersections ofthe grid lines. This method significantly reduces the time requiredto conduct point counting and improves the consistency of counts.
This paper is structured as follows: In the next section, the previ-ous work is detailed. Section 3 begins with a general description ofthe characteristics of the application including the basic visualiza-tion aspects. Based on these characteristics, the interface and theinteractions are described also in Sections 3. Section 6 gives theimplementations details of Rock.AR. Finally Section 8 summarizesthe work providing some closing remarks and directions for futurework.
2 Previous work
The point counting technique evolved from the work of Delesse[Delesse 1848], Rosiwal [Rosiwal 1898], Shand [Shand 1916],Chayes [Chayes 1949], and others. Point counting is normally con-ducted either by hand only or manually through different ad-hoctechniques and devices. In order to improve the effectiveness ofthis type of work, some applications were developed. In 1993,Gatlin [Gatlin CL 1993] developed a semi-automated method ofpoint counting. They applied this technique on biological samples,and they pointed out that it could be used on many other types oftissue. This method could only be run on Macintosh computers andit was not publicly accessible. The electromechanical device, men-tioned earlier, attached to the petrographic or reflected-light micro-scope, was replaced in 2000 by an electronic device with signifi-cantly improved accuracy. Its movement was fully automated, al-lowing software controlled slide movements in both horizontal andvertical directions. This device was enhanced recently with the ad-dition of a petrographic data analysis system. It is a rather compli-cated device and its software is not intuitive to use. The device mustremain in place along the entire process, which would be negative ifthe microscope is a critical resource. In this case, if someone needsthe microscope the device must be detached and the point countingprocess stopped, forcing the user to restart with the process again.
In 2006 JMicroVision developed a software application availableon the Web to analyze high definition images of rock thin sectionswhich can also be used in other domains. Although this applicationallows point counting it is not easy to use. Besides that, the usercan not select, for example, an ad-hoc regular grid to be overlaid onthe image. It means that the counting can not be conducted with thedesired step size.
The work presented in this paper addresses the aforementionedproblems. The goal of the application is to alleviate the identifiedproblems when performing this point counting, to increase its ef-fectiveness, its navigability and the interaction among the differentrepresentations of the data. There are very few published papers onpoint counting, much less about the use of computer science relatedtopics to improve this technique. We believe that our contributionto this area is significant and will help geologists in their work.
3 Our approach
Traditionally, the term visualization has been used to describe theprocess of graphically conveying or presenting end results [Cardet al. 1999]. This concept has evolved and revolutionized the wayresearchers do science. At present it is required to support the an-alytical reasoning with highly interactive interfaces in order to de-rive insight from the collected data. Based on these concepts wedeveloped a point counting visualization application that leads to anatural user-computer interaction and enhances the user’s ability tocount. Our primary goal was to achieve the highest level of autom-atization of the point counting technique as possible.
Using our application, a typical counting session consists of thesample setup, the counting process and the exploration session. Forthe sample setup, an image of a petrographic thin section must beloaded. The user is subsequently informed of its dimensions in pix-els. Then he has the possibility to input its dimensions in mm andalso to adjust the brightness and contrast. At this step, the user isalso asked to create the regular grid for optimum point density, toselect the color of the grid and the color of the grid at the selectedpoint. Then, the grid is superimposed onto the image. After theuser has imposed an adjustable grid on the image, the counting pro-cess can start. Points can be classified and the percentages valuesof each mineral are calculated and graphically displayed.
During the exploration session, intermediate information relatedwith the counted points can be saved and replayed for further analy-sis. We promote a friendly user-computer interaction, the interfaceand the interactions are kept simple and intuitive. Our applicationallows to create the grid, overlay it on a selected image and classifythe minerals at the grid points. The information is organized in mul-tiple tightly coupled views and guides the interactive manipulationof the data (see Section 4).
In order to do a meaningful classification, the image to be manipu-lated must contain between 1500 and 5000 points. When interact-ing with large images on the computer display, two goals must beachieved. First, it is important to convey a general overview of alldata. Second, it should be possible to view the data at the point indetail. At the classification moment, it is necessary to have a focuson the point and a local context that helps to classify the mineral.At the same time it is important to have an overview of the thin sec-tion, without distortion. To meet all these requirements we chooseto have a focus + local context + overview display. It must also bepointed out that the local context heavily relies on zoom-in + zoom-out interactions performed by the users. The following sectionsdescribe the application in detail, going deeply into the interfaceand the interactions available to the user.
4 The interface
Kwan Liu Ma introduced the concept “the user interface of a visual-ization system is the visualization displayed”1. Users are then ableto concentrate on data exploration and interpretation rather than onuser interface artifacts. Our interface presents four views (Figure2) providing different contents to improve the point counting pro-cess. The interface offers the user the image of the petrographic thinsection in the sample view and complementary information viewsorganized in a mosaic fashion. In the following subsections wedescribe the goal of each view, its interactions and the interfacecomponents.
4.1 The views
During the data exploration process, the dynamically linked viewsshow quantitative and qualitative information.
4.1.1 Sample view
This is the main view in the application hence the largest one.Through this, the user count, watch, and manipulate the petro-graphic thin section. The user will see the sample and a grid over-layed. The grid intersections represent the points to count.
4.1.2 Table of minerals
This view represents the list of the minerals the user is looking forin the sample. Each mineral has a key color reference, allowing toeasily identify it in the four views.
4.1.3 Chart view
The most important output of this process is the percentages valuesof each mineral. These values represent the relative area occupiedby each of them. This view shows a graphical representation ofthose percentages values using the color key references created inthe table of minerals.
4.1.4 Overview
Additionally to the sample image, its pixel map is also shown. Thismap represents each counted point in the thin section with the corre-sponding mineral color. Pixels are arranged according to the imagebeing counted, offering an intuitive context overview.
4.2 Interface Components
4.2.1 The Grid
The grid is displayed as an overlay on top of the sample imageand the user can adjust the distance between vertical and horizontallines before the count begins, to control the precision of the pointcounting. The circles in the grid intersections represent the pointsto count. When the user selects any point, a square is drawn aroundit, the color of the circle and the grid lines that intersect it is changedto emphasis the selected point.
1http://www.cs.ucdavis.edu/∼ma/research.html

Figure 2: A screenshot of the Rock.AR application. This application was written in Java and it is computer platform-independent. Rock.ARprovides a semi-automatic point counting method for petrographic thin sections. The interface offers the user the image of the petrographicthin section in the sample view and complementary information views organized in a mosaic fashion.
4.2.2 Table of minerals
This scrollable table represents the minerals identified in the sam-ple. Different types of minerals correspond to different colors. Eachrow of the table represents one mineral data: A key value to be ref-erenced, its name, the associated color, the total counted points ofthat mineral and the percentage they represent considering the totalnumber of counted points on the sample.
5 The interactions
In this section we discuss various aspects of interacting with theapplication. User interfaces should become simple and intuitive, sothat they can be operated by people with different levels of knowl-edge and skills. Users should be able to freely choose and inter-change their ways of interaction, depending on their skills and theparticular situations. That is the reason why applications will es-pecially benefit from simplified and powerful human-computer in-terfaces that allow users to choose the type of interaction depend-ing on their background and their preferences [Medyckyj-Scott andHearnshaw 1993].
All interactions in Rock.AR can be done with the mouse or withthe keyboard. We consider mouse interactions to be more suitablefor novice users, especially those who are learning the technique.Keyboard interaction is better for expert users, because they providea quick access to the application functionality. The user is free toconfigure which key will trigger each action.
We identified three interaction tasks: The configuration to beginthe procedure, the way the petrographic thin section image will benavigated to do the point counting and the removal and modificationof any counted point when necessary. Let us describe each of thethree interactions in more detail:
1. The configuration to begin the procedure. When the user se-lect an image to apply the technique, the user can choose to:
(a) Adjust the brightness and contrast of the image.
(b) Set the grid size in order to determine the number ofpoints to count and the step between them.
(c) Set the the colors of the grid elements.
2. Navigation of the petrographic thin section image to do thepoint counting. We propose a strategy that supports people inthis initial stage of interaction with the applicationgatlin anda different one for expert users. Users should be able to freelychoose and interchange their ways of interaction, dependingon their abilities and the situations at hand. The user can selectand navigate the points by mouse movement, for novice users,or keyboard input for expert users. The user then proceeds toclassify them by selecting the key mineral value, this can alsobe done by mouse or keyboard interaction. Ones the mineralis selected, if the user press Enter the selected point becomesthe next one. Starting from the top left corner, a predefinedmovement is set: When pressing Enter on the first row, thenext selected point will be the next at the right. At the endof the row, the next selected point will be the one below thecurrent one, and then the movement will be from right to left.This pattern continues until the last point is reached. When amineral is associated with a point, the statistics are updated.
3. Addition, removal and modification of the different countedpoints in the sample. To modify a counted point the user mustselect the point, press the Backspace key and enter the newvalue. If no new value is entered, the associated mineral withthe point is undefined and the statistics are updated.
Outside these three tasks, we describe now an additional set of ac-tions categorized according to the view they affect:

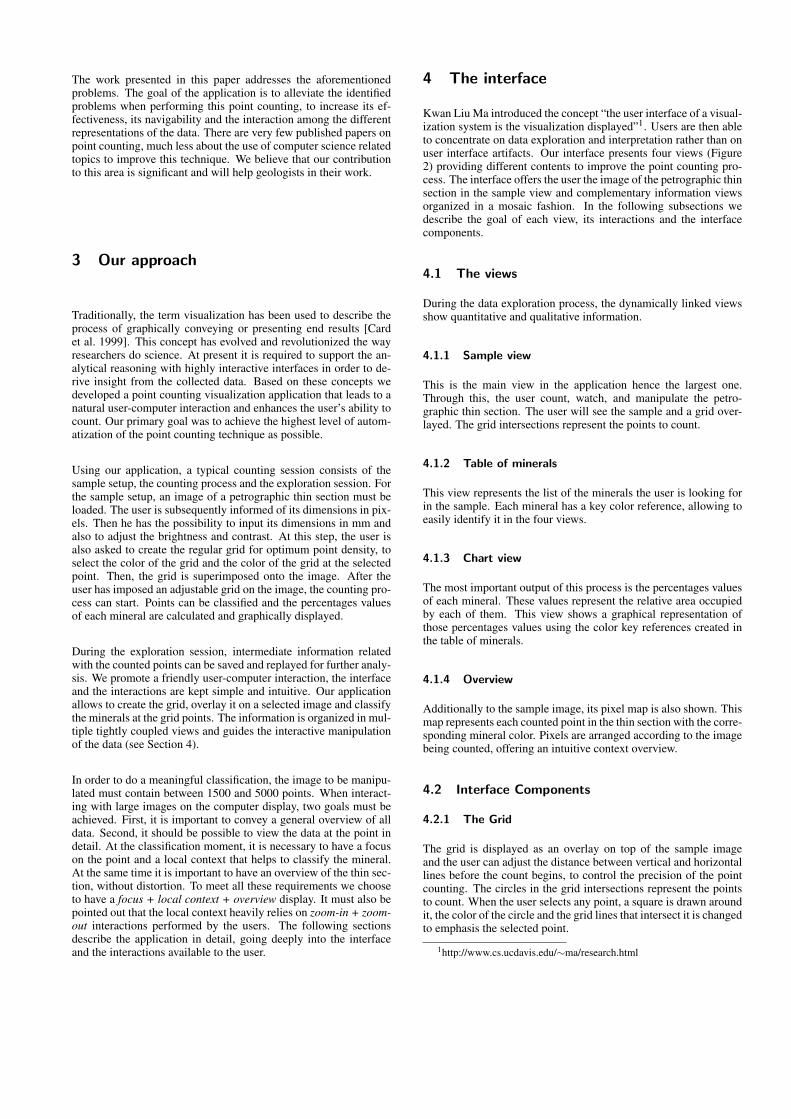
Figure 3: All graphics elements inside the main panel can madeinvisible by user request.
Figure 4: Local zoom applied to the selected point, highlighted inblue, on the right.
5.1 Interactions on the sample view
• Walk through the points. The user can move through thepoints by mouse click or by pressing the arrows keys. Whenthe user types a mineral key into the mineral key textbox andpresses enter, an automatic movement takes place and the nextpoint is selected.
• Import/Export counted information. The user can save thecounted point in a file. This file can be used later to resumethe work.
• Zoom in/out. The zoom can be applied to the whole image orjust locally to a point in the grid (Figure 4). In the last case,the zoom in allows to view smaller sections inside the squaredrawn when the point is selected.
• Remove grid components. The visibility of the following gridelements can be toggled by the user at any moment (Figure3):
– The entire grid
– The circles in the grid intersections
– The square and the lines inside it, when a point is se-lected.
– The circle in the selected point
• Overview overlap. It is possible to combine the overview in-formation with the sample view (Figure 5) with transparencyor full opacity. This will allow the user to see which pointshave been counted and how they were counted.
5.2 Interactions on the table of minerals
• Open/Save table of minerals. Each list created by the user canbe saved as a file to be used later.
• Add new mineral. A new mineral can be added to the list,its key value will be automatically assigned, the user will beasked to enter its name and color references.
• Edit mineral. For each mineral, the user can change its nameand color references.
5.3 Interactions on the pie chart
• Quantitative values. By default only the pie chart is visible inthe respective view, if she/he moves the mouse pointer overthe graphic, the quantitative values will appear. If the userwants to keep these values visible, she/he must click on thegraphic. A second click will make the values invisible again.
• Export data. When the user clicks on the Excel button, aspreadsheet file will be created containing the table of min-erals with the number of counted points, its percentages andcolor references.
6 Implementation
Rock.AR was implemented using Java 1.5 and Eclipse 3.2. For themoment, Rock.AR is not publicly available because it’s in a betaversion. Once a stable version is reached, Rock.AR will be madeavailable as open source. Additionally to the Java libraries, threespecial purpose libraries were used in Rock.AR.
• JIU - The Java Imaging Utilities, for image processing, scal-ing, copying and cutting images.
• JFreeChart, to create the pie chart.
• Java Excel API, to create and write an Excel file.
The two main components of the Rock.AR application are the Sam-pleCell and VisualSampleCell classes. SampleCell is an abstractrepresentation of a grid cell, for each SampleCell there is an associ-ated mineral type. This value can be undefined (null value) if thereis no mineral assigned to sample point.
The VisualSampleCell is the graphical representation of the Sam-pleCell. Each SampleCell has an associated VisualSampleCell, it isused to graphically show the content of the SampleCell and to cap-ture all the user events, such us mouse click or keyboard press. Theapplication’s main interactions are solved by capturing the eventson the VisualSampleCell.
After the user configures the grid, the application calculates the totalnumbers of cells and their size. Using the JIU library the applicationcreates the SampleCells and the VisualSampleCells.
7 User experience
We conducted a controlled lab study to measure how our applica-tion could improve the point counting technique as compared toother methods. Our general hypothesis was that, with Rock.AR,the users would be able to count faster, more accurately and withgreater user satisfaction. Later on this section we will describe howwe measured time, accuracy and user satisfaction.
7.1 Participants
Twelve participants were involved in this evaluation, all of themfrom the Geology Department of our University. We screened par-ticipants so that all of them have had some experience with pointcounting through the use of a microscope but none with any point
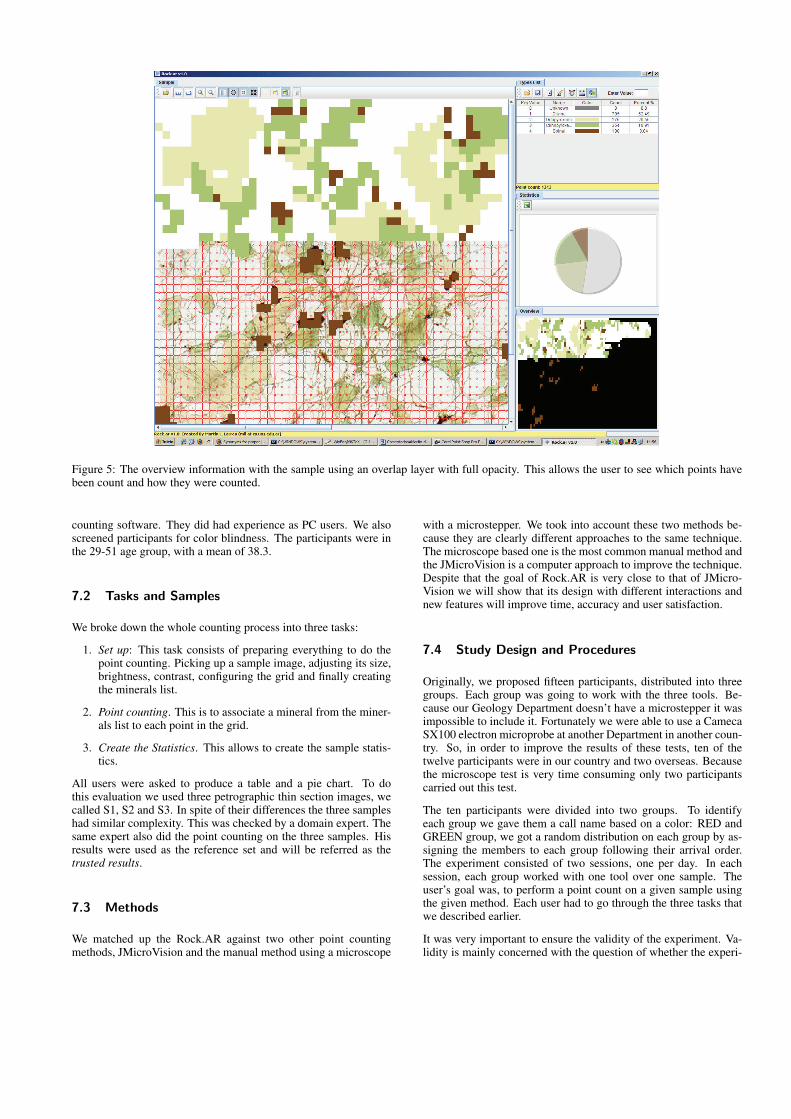
Figure 5: The overview information with the sample using an overlap layer with full opacity. This allows the user to see which points havebeen count and how they were counted.
counting software. They did had experience as PC users. We alsoscreened participants for color blindness. The participants were inthe 29-51 age group, with a mean of 38.3.
7.2 Tasks and Samples
We broke down the whole counting process into three tasks:
1. Set up: This task consists of preparing everything to do thepoint counting. Picking up a sample image, adjusting its size,brightness, contrast, configuring the grid and finally creatingthe minerals list.
2. Point counting. This is to associate a mineral from the miner-als list to each point in the grid.
3. Create the Statistics. This allows to create the sample statis-tics.
All users were asked to produce a table and a pie chart. To dothis evaluation we used three petrographic thin section images, wecalled S1, S2 and S3. In spite of their differences the three sampleshad similar complexity. This was checked by a domain expert. Thesame expert also did the point counting on the three samples. Hisresults were used as the reference set and will be referred as thetrusted results.
7.3 Methods
We matched up the Rock.AR against two other point countingmethods, JMicroVision and the manual method using a microscope
with a microstepper. We took into account these two methods be-cause they are clearly different approaches to the same technique.The microscope based one is the most common manual method andthe JMicroVision is a computer approach to improve the technique.Despite that the goal of Rock.AR is very close to that of JMicro-Vision we will show that its design with different interactions andnew features will improve time, accuracy and user satisfaction.
7.4 Study Design and Procedures
Originally, we proposed fifteen participants, distributed into threegroups. Each group was going to work with the three tools. Be-cause our Geology Department doesn’t have a microstepper it wasimpossible to include it. Fortunately we were able to use a CamecaSX100 electron microprobe at another Department in another coun-try. So, in order to improve the results of these tests, ten of thetwelve participants were in our country and two overseas. Becausethe microscope test is very time consuming only two participantscarried out this test.
The ten participants were divided into two groups. To identifyeach group we gave them a call name based on a color: RED andGREEN group, we got a random distribution on each group by as-signing the members to each group following their arrival order.The experiment consisted of two sessions, one per day. In eachsession, each group worked with one tool over one sample. Theuser’s goal was, to perform a point count on a given sample usingthe given method. Each user had to go through the three tasks thatwe described earlier.
It was very important to ensure the validity of the experiment. Va-lidity is mainly concerned with the question of whether the experi-

ment measure what it is supposed to measure. We considered twotypes of validity: Internal validity and external validity. Internalvalidity is the extent to which the differences in values of the de-pendent variables, i.e. the outcome variables, are currently causedby the independent variable, i.e. the variable that is manipulatedby the experiment, and not by any other source of variation. Theexternal validity of an experiment is concerned with the followingquestion: how well do the results of the experiment generalize be-yond the sample of subjects in the experiment? We ensured internalvalidity by assigning subjects to the test groups randomly. Also, toavoid the effects of external variables on the final results we use awithin-subject design for the experiment. In this design all subjectsare used two times, once with Rock.AR and another with JMicro-Vision, not necessarily in this order. By doing this we are cancelingany possible carryover effect.
7.5 Results
The times the users took to complete the three tasks on each methodare summarized in tables 1, 2 and 3. It is important to remark thatthe second task is the most important one as it is the most timeconsuming one. At the end of each task, for both the JMicroVisionand Rock.AR, participants had to answer the following questionsproviding a number between 1 and 5, we based these questions onthe work done by [Shneiderman and Plaisant 2004].
For the set up, task one, the question was:
• How do you rate the interface? Give a number between 1 and5, where 1 is intuitive and 5 is artificial. For JMicroVision theaverage answer was 4, and for Rock.AR it was 2.
For the counting process, task two, the questions were:
• How do you rate the interface? Give a number between 1 and5, where 1 is intuitive and 5 is artificial. For JMicroVision theaverage answer was 5, and for Rock.AR it was 2.
• How do you rate the interactions? Give a number between1 and 5, where 1 is intuitive and 5 is artificial. For JMi-croVision the average answer was 4, and for Rock.AR it was1.
For the statistics, task three, the questions were:
• Which is your overall reaction to this method? Give a numberbetween 1 and 5, where 1 is frustrating and 5 is satisfying. ForJMicroVision the average answer was 2, and for Rock.AR itwas 4.
• How do you rate the amount of information on screen? Givea number between 1 and 5, where 1 is indequate and 5 isadequate. For JMicroVision the average answer was 4, andfor Rock.AR it was 4.
In this set of questions Rock.AR got better results than JMicroVi-sion. An important aspect against JMicroVision was its complexinterface. For Rock.AR the users commented that sometimes theapplication freezes for no apparent reason and then continues work-ing normally. Another comment related to Rock.AR from the userwas that the language used in the menus was not appropriate for thegeology domain. After the sessions were concluded, we comparedthe counted points from the users with our trusted results, in orderto calculate the errors made by the users. Using Rock.AR fewerthan 3% of the counted points were wrong for all the users, whilefor JMicroVision the wrongly counted points were above 9%. Ina discussion after the sessions, all users agreed that been able tolocally zoom in a point while keeping the context help them. Webelieve that the low number of wrongly counted points is because
Task 1. The set up.Group User Rock.AR JMicroVision Microscope
Red
U1 0◦ 00’ 54” 0◦ 03’ 20” noneU2 0◦ 01’ 12” 0◦ 02’ 54” noneU3 0◦ 01’ 16” 0◦ 03’ 40” noneU4 0◦ 01’ 04” 0◦ 02’ 37” noneU5 0◦ 01’ 07” 0◦ 03’ 21” none
Green
U6 0◦ 00’ 50” 0◦ 04’ 12” noneU7 0◦ 01’ 20” 0◦ 03’ 43” noneU8 0◦ 00’ 46” 0◦ 03’ 48” noneU9 0◦ 01’ 10” 0◦ 03’ 54” noneU10 0◦ 00’ 58” 0◦ 03’ 26” none
Overseas U11 none none 0◦ 03’ 13”U12 none none 0◦ 02’ 49”Averg. 0◦ 01’ 04” 0◦ 03’ 30” 0◦ 03’ 01”S. Dev. 0◦ 00’ 09” 0◦ 00’ 22” 0◦ 00’ 12”
Table 1: Time results from the first task. The set up is faster withRock.AR.
Task 2. The counting process.Group User Rock.AR JMicroVision Microscope
Red
U1 1◦ 02’ 23” 1◦ 45’ 31” noneU2 1◦ 04’ 10” 1◦ 32’ 58” noneU3 0◦ 59’ 36” 2◦ 33’ 10” noneU4 0◦ 57’ 02” 1◦ 42’ 34” noneU5 1◦ 05’ 48” 1◦ 43’ 49” none
Green
U6 0◦ 46’ 10” 1◦ 41’ 45” noneU7 0◦ 51’ 32” 1◦ 53’ 32” noneU8 1◦ 02’ 09” 1◦ 31’ 16” noneU9 0◦ 58’ 01” 2◦ 03’ 08” noneU10 0◦ 59’ 31” 1◦ 57’ 13” none
Overseas U11 none none 0◦ 05’ 17”U12 none none 0◦ 05’ 38”Averg. 0◦ 58’ 38” 1◦ 50’ 30” 5◦ 27’ 48”S. Dev. 0◦ 04’ 22” 0◦ 13’ 01” 0◦ 10’ 25”
Table 2: Time results from the second task. The second task isthe most important one as it is the most time consuming one. Aswith task one, users working with Rock.AR completed this task ina shorter time and with higher accuracy.
of this feature and an easy and intuitive set of interactions. All par-ticipants were able to finish all the tasks. With JMicroVision andRock.AR users were able to complete the task two in less time thanusing the microscope. With regard to user satisfaction, participantsconsistently rated the Rock.AR software higher than JMicroVision.
8 Conclusion and Future Work
Rock.AR is a visualization application mainly designed to do pointcounting on images obtained from petrographic thin sections. It isimplemented in the Java programming language, has a user-friendlygraphical interface, uses information visualization techniques andis computer platform-independent. These attributes qualify it tobe used as a research, and educational tool for various users andespecially to provide geologists with a valuable educational, andresearch tool. The software will be freely available for download.
Because of the point counting task is a very tedious and time con-suming task, we are exploring alternate methods to provide a moreautomatic way to do it. Our goal is to provide the application withan automatic count of the points. We assume that on the basis of a
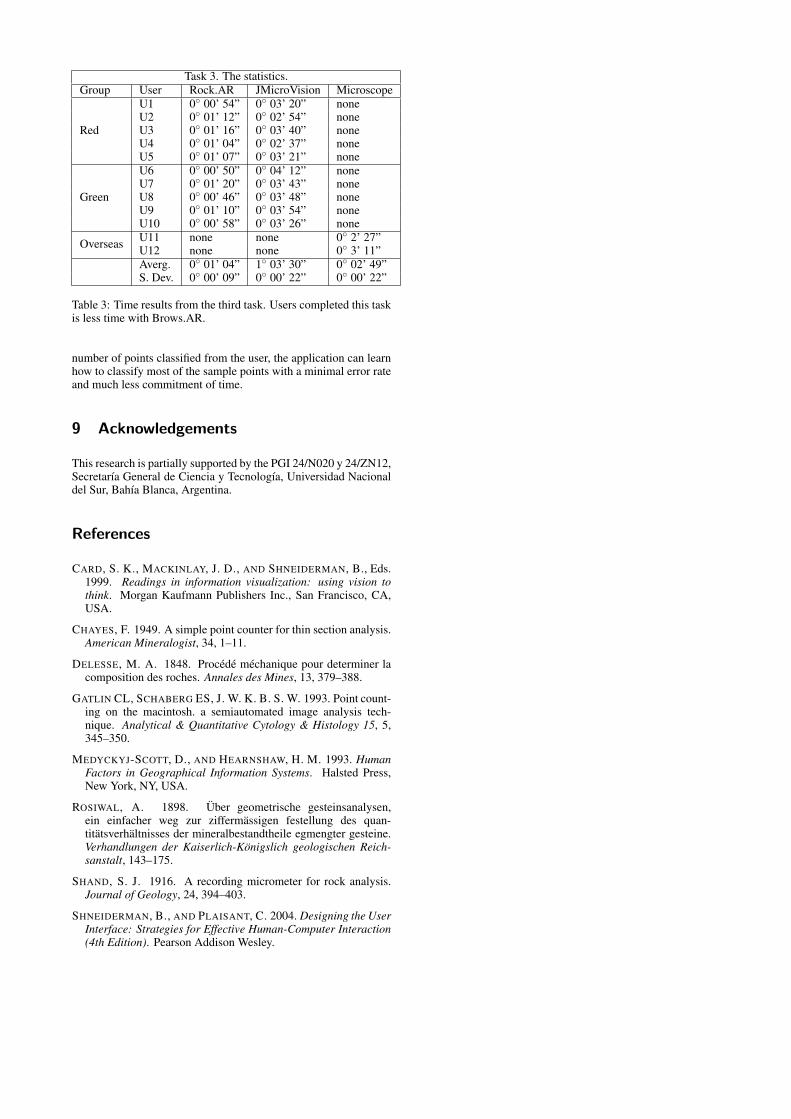
Task 3. The statistics.Group User Rock.AR JMicroVision Microscope
Red
U1 0◦ 00’ 54” 0◦ 03’ 20” noneU2 0◦ 01’ 12” 0◦ 02’ 54” noneU3 0◦ 01’ 16” 0◦ 03’ 40” noneU4 0◦ 01’ 04” 0◦ 02’ 37” noneU5 0◦ 01’ 07” 0◦ 03’ 21” none
Green
U6 0◦ 00’ 50” 0◦ 04’ 12” noneU7 0◦ 01’ 20” 0◦ 03’ 43” noneU8 0◦ 00’ 46” 0◦ 03’ 48” noneU9 0◦ 01’ 10” 0◦ 03’ 54” noneU10 0◦ 00’ 58” 0◦ 03’ 26” none
Overseas U11 none none 0◦ 2’ 27”U12 none none 0◦ 3’ 11”Averg. 0◦ 01’ 04” 1◦ 03’ 30” 0◦ 02’ 49”S. Dev. 0◦ 00’ 09” 0◦ 00’ 22” 0◦ 00’ 22”
Table 3: Time results from the third task. Users completed this taskis less time with Brows.AR.
number of points classified from the user, the application can learnhow to classify most of the sample points with a minimal error rateand much less commitment of time.
9 Acknowledgements
This research is partially supported by the PGI 24/N020 y 24/ZN12,Secretarıa General de Ciencia y Tecnologıa, Universidad Nacionaldel Sur, Bahıa Blanca, Argentina.
References
CARD, S. K., MACKINLAY, J. D., AND SHNEIDERMAN, B., Eds.1999. Readings in information visualization: using vision tothink. Morgan Kaufmann Publishers Inc., San Francisco, CA,USA.
CHAYES, F. 1949. A simple point counter for thin section analysis.American Mineralogist, 34, 1–11.
DELESSE, M. A. 1848. Procede mechanique pour determiner lacomposition des roches. Annales des Mines, 13, 379–388.
GATLIN CL, SCHABERG ES, J. W. K. B. S. W. 1993. Point count-ing on the macintosh. a semiautomated image analysis tech-nique. Analytical & Quantitative Cytology & Histology 15, 5,345–350.
MEDYCKYJ-SCOTT, D., AND HEARNSHAW, H. M. 1993. HumanFactors in Geographical Information Systems. Halsted Press,New York, NY, USA.
ROSIWAL, A. 1898. Uber geometrische gesteinsanalysen,ein einfacher weg zur ziffermassigen festellung des quan-titatsverhaltnisses der mineralbestandtheile egmengter gesteine.Verhandlungen der Kaiserlich-Konigslich geologischen Reich-sanstalt, 143–175.
SHAND, S. J. 1916. A recording micrometer for rock analysis.Journal of Geology, 24, 394–403.
SHNEIDERMAN, B., AND PLAISANT, C. 2004. Designing the UserInterface: Strategies for Effective Human-Computer Interaction(4th Edition). Pearson Addison Wesley.