Embed Size (px)
Citation preview

© Catchments & Creeks Pty Ltd Version 2 – November 2014 Page 1
Rock Sizing for Small Dam Spillways STORMWATER MANAGEMENT PRACTICES
Photo 1 – Rock-lined spillway on a
construction site sediment basin Photo 2 – Rock-lined spillway on a small
farm dam 1. Introduction A ‘chute’ is a steep drainage channel, typically of uniform cross-section, that passing down the face of a slope. A ‘spillway’ is a drainage chute used to carry overflows or bypass flows around or over a dam embankment.
The stability of the rocks used on such structures is critical due to the safety and financial costs associated with any type of structural failure. 2. Key design and operation issues The critical design components of a spillway chute are (1) the flow entry into the spillway, (2) the maximum allowable flow velocity down the face of the spillway, and (3) the dissipation of energy at the base of the spillway.
The critical operational issues are (1) ensuring unrestricted flow entry into the spillway, (2) ensuring flows do not undermine or spill/splash out of the spillway, and (3) ensuring soil erosion is controlled at the base of the spillway.
Most spillway chutes fail as a result of rock displacement; therefore, it is critical to size the rocks using appropriate rock properties such as rock density and shape characteristics (i.e. round or angular rock). 3. Design of small dam spillways Spillway chutes are hydraulic structures that need to be designed for a specified design storm using standard hydrologic and hydraulic equations. The design process can be broken down into three components:
• Inlet design: Flow conditions may be determined using an appropriate weir equation. It is important to ensure that the water level upstream of the spillway’s inlet will be fully contained by the dam embankment.
• Chute face: Determination of an appropriate rock size is governed by either the unit flow rate (q) or the estimated flow velocity (V) down the spillway.
• Outlet design: A suitable energy dissipater or outlet structure is required at the base of the spillway. The design of these structures must be assessed on a case-by-case basis. It may not always be appropriate to use standard design charts.

© Catchments & Creeks Pty Ltd Version 2 – November 2014 Page 2
4. Sizing of rock for use down the face of spillways Table 1 provides the recommended design equations for sizing rock placed on the face of spillway chutes (not the energy dissipater).
Tables 3 and 4 provide design, mean rock size (rounded up to the next 0.1 m unit) for a safety factor of 1.2 and 1.5, based on Equation 1 and using the unit flow rate (q) as the primary variable. These tables are best used in the design of wide shallow spillways. Use of the unit flow rate as the primary design variable is preferred to the use of flow velocity because it avoids errors associated with the selection of Manning’s roughness.
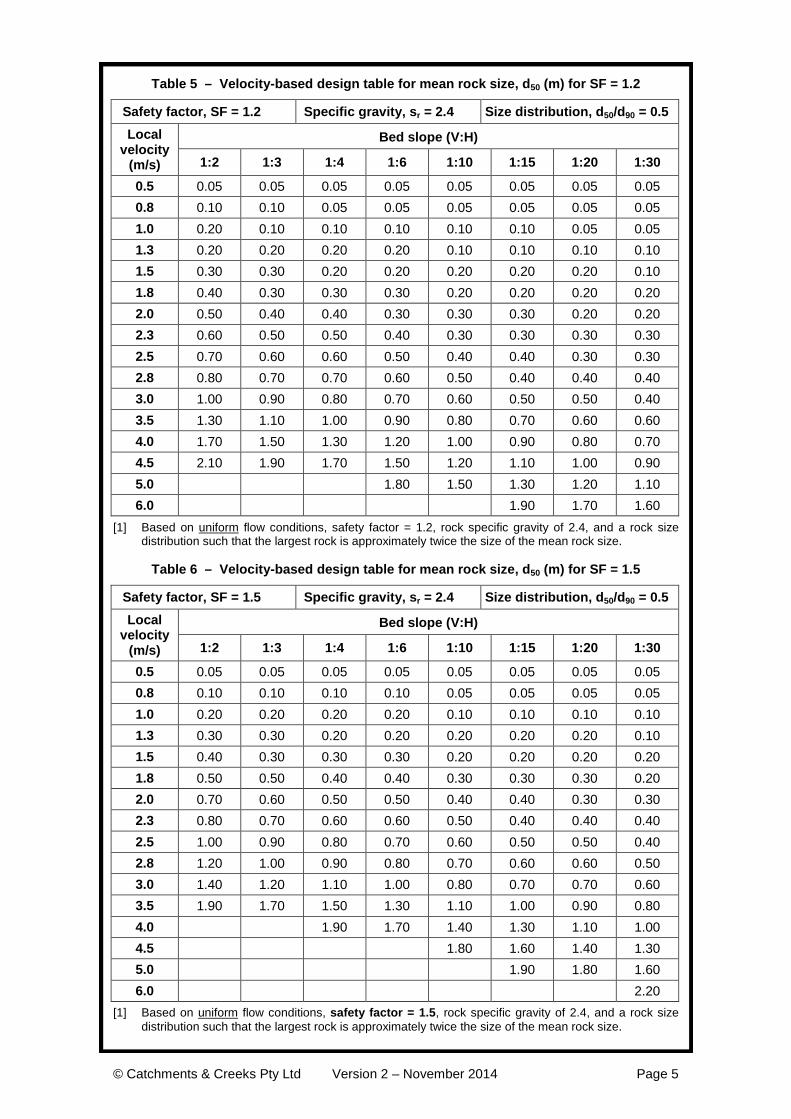
Alternatively, Tables 5 and 6 provide design, mean rock size for a safety factor of 1.2 and 1.5, based on Equation 1 with flow velocity (V) as the primary variable and Manning’s roughness as per Equation 5. These tables are best used in the design of small narrow spillways that have a cross-section similar to a batter chute rather than a traditional wide shallow spillway.
Table 1 – Recommended rock sizing equations for small dam spillways [1]
Bed slope (%) Design equations Preferred equation:
So < 50%
Uniform flow conditions only, Se = So
d SF K K S q ys
o
r50
1 20 5 0 5 0 25127
1=
−. . . . . . .
( )
. . . (1)
A simplified equation independent of flow depth:
So < 50%
Uniform flow conditions only, Se = So
d SF K K S qs
o
r50
1 20 47 0 64
1=
−. . . .
( )
. . (2)
A simplified, velocity-based equation:
So < 33%
Uniform flow conditions only, Se = So
d SF K K VA B S so r
501 2
2
1=
− −. . .
( .ln( )).( ) (3)
For SF = 1.2: A = 3.95, B = 4.97 For SF = 1.5: A = 2.44, B = 4.60
Partially drowned spillway chutes:
So < 50%
Steep gradient, non-uniform flow conditions, Se ≠ So
d SF K K S V yV s
o
o r50
1 20 5 2 5 0 75
2 0127
1=
−. . . . . . .
( )
. . .
. (4)
[1] The above equations, with the exception of Equation 2, are based on the Manning’s ‘n’ roughness for rock-lined surfaced determined from Equation 5.
The Manning’s roughness of rock-lined surfaces used in the development of Equations 1, 3 & 4 was based on Equation 5, which was specifically developed for application in both shallow-water and deep-water flow conditions. Rock roughness values are also presented in Table 7.
n dX
=−
901 6
26 1 0 35930 7
/
( )( . ). (5)
where: X = (R/d90)(d50/d90) R = hydraulic radius of flow over rocks [m] d50 = mean rock size for which 50% of rocks are smaller [m] d90 = rock size for which 90% of rocks are smaller [m] For ‘natural’ rock extracted from streambeds the relative roughness value (d50/d90) is typically in the range 0.2 to 0.5. For quarried rock the ratio is more likely to be in the range 0.5 to 0.8.

© Catchments & Creeks Pty Ltd Version 2 – November 2014 Page 3
where:
dX = nominal rock size (diameter) of which X% of the rocks are smaller [m]
A & B = equation constants
K = 0.86 for highly turbulent flow
K1 = correction factor for rock shape
= 1.0 for angular (fractured) rock, 1.36 for rounded rock (i.e. smooth, spherical rock)
K2 = correction factor for rock grading
= 0.95 for poorly graded rock (Cu = d60/d10 < 1.5), 1.05 for well graded rock (Cu > 2.5), otherwise K2 = 1.0 (1.5 < Cu < 2.5)
q = flow per unit width down the embankment [m3/s/m]
sr = specific gravity of rock (e.g. sandstone 2.1–2.4; granite 2.5–3.1, typically 2.6; limestone 2.6; basalt 2.7–3.2)
Se = slope of energy line [m/m]
So = spillway bed slope = tan(θ) [m/m]
SF = factor of safety (refer to Table 2)
V = depth-average flow velocity over the rock [m/s]
Vo = depth-average flow velocity based on uniform flow down a slope, So [m/s]
y = depth of flow at a given location [m]
θ = slope of channel bed [degrees]
Table 2 – Recommended safety factor for use in determining rock size
Safety factor (SF) Recommended usage Example site conditions
1.2 • Low risk structures. • Failure of structure is most
unlikely to cause loss of life or irreversible property damage.
• Permanent rock chutes with all voids filled with soil and pocket planted.
• Dam spillways where failure of the structure is likely to result in easily repairable soil erosion.
• Dam spillways that are likely to experience significant sedimentation and vegetation growth before experiencing the high flows.
• Temporary (< 2 yrs) spillways with a design storm of 1 in 10 years of greater.
1.5 • High risk structures. • Failure of structure may cause
loss of life or irreversible property damage.
• Temporary structures that have a high risk of experiencing the design discharge while the voids remain open (i.e. prior to sediment settling within and stabilising the voids between individual rocks).
• Dam spillways where failure of the structure may cause severe gully erosion.
• Dam spillways located up-slope of a residential area or busy roadway where an embankment failure could cause property flooding or loss of life.
• Spillways designed for a storm frequency less than 1 in 10 years.

© Catchments & Creeks Pty Ltd Version 2 – November 2014 Page 4
Table 3 – Flow depth [1], y (m) and mean rock size, d50 (m) for SF = 1.2
Safety factor, SF = 1.2 Specific gravity, sr = 2.4 Size distribution, d50/d90 = 0.5 Unit flow
rate (m3/s/m)
Bed slope = 1:2 Bed slope = 1:3 Bed slope = 1:4 Bed slope = 1:6
y (m) d50 y (m) d50 y (m) d50 y (m) d50
0.1 0.09 0.20 0.09 0.20 0.09 0.10 0.09 0.10 0.2 0.14 0.30 0.14 0.20 0.14 0.20 0.15 0.20 0.3 0.18 0.30 0.19 0.30 0.19 0.20 0.20 0.20 0.4 0.22 0.40 0.23 0.30 0.23 0.30 0.24 0.20 0.5 0.26 0.40 0.26 0.40 0.27 0.30 0.27 0.30 0.6 0.29 0.50 0.30 0.40 0.30 0.40 0.31 0.30 0.8 0.35 0.60 0.36 0.50 0.37 0.40 0.37 0.40 1.0 0.41 0.70 0.42 0.60 0.42 0.50 0.44 0.40 1.2 0.46 0.70 0.47 0.60 0.48 0.50 0.49 0.50 1.4 0.51 0.80 0.52 0.70 0.53 0.60 0.54 0.50 1.6 0.56 0.90 0.57 0.70 0.58 0.70 0.60 0.50 1.8 0.60 1.00 0.62 0.80 0.63 0.70 0.64 0.60 2.0 0.65 1.00 0.66 0.90 0.67 0.70 0.69 0.60 3.0 0.85 1.30 0.87 1.10 0.88 1.00 0.90 0.80 4.0 1.02 1.60 1.05 1.30 1.07 1.20 1.10 1.00 5.0 1.19 1.80 1.22 1.50 1.24 1.30 1.27 1.10
[1] Flow depth is expected to be highly variable due to whitewater (turbulent) flow conditions.
Table 4 – Flow depth [1], y (m) and mean rock size, d50 (m) for SF = 1.5
Safety factor, SF = 1.5 Specific gravity, sr = 2.4 Size distribution, d50/d90 = 0.5 Unit flow
rate (m3/s/m)
Bed slope = 1:1 Bed slope = 1:3 Bed slope = 1:4 Bed slope = 1:6
y (m) d50 y (m) d50 y (m) d50 y (m) d50
0.1 0.10 0.20 0.10 0.20 0.10 0.20 0.10 0.10 0.2 0.15 0.30 0.15 0.30 0.16 0.20 0.16 0.20 0.3 0.20 0.40 0.20 0.30 0.21 0.30 0.21 0.30 0.4 0.24 0.50 0.25 0.40 0.25 0.40 0.26 0.30 0.5 0.28 0.50 0.28 0.50 0.29 0.40 0.30 0.30 0.6 0.31 0.60 0.32 0.50 0.33 0.40 0.34 0.40 0.8 0.38 0.70 0.39 0.60 0.40 0.50 0.41 0.40 1.0 0.44 0.80 0.45 0.70 0.46 0.60 0.47 0.50 1.2 0.50 0.90 0.51 0.80 0.52 0.70 0.53 0.60 1.4 0.55 1.00 0.57 0.90 0.58 0.80 0.59 0.60 1.6 0.60 1.10 0.62 0.90 0.63 0.80 0.64 0.70 1.8 0.65 1.20 0.67 1.00 0.68 0.90 0.70 0.70 2.0 0.70 1.30 0.72 1.10 0.73 0.90 0.75 0.80 3.0 0.92 1.70 0.94 1.40 0.96 1.20 0.98 1.00 4.0 1.11 2.00 1.14 1.70 1.16 1.50 1.19 1.20 5.0 1.29 2.30 1.32 1.90 1.34 1.70 1.38 1.40
[1] Flow depth is expected to be highly variable due to whitewater (turbulent) flow conditions.
© Catchments & Creeks Pty Ltd Version 2 – November 2014 Page 5
Table 5 – Velocity-based design table for mean rock size, d50 (m) for SF = 1.2
Safety factor, SF = 1.2 Specific gravity, sr = 2.4 Size distribution, d50/d90 = 0.5 Local
velocity (m/s)
Bed slope (V:H)
1:2 1:3 1:4 1:6 1:10 1:15 1:20 1:30
0.5 0.05 0.05 0.05 0.05 0.05 0.05 0.05 0.05 0.8 0.10 0.10 0.05 0.05 0.05 0.05 0.05 0.05 1.0 0.20 0.10 0.10 0.10 0.10 0.10 0.05 0.05 1.3 0.20 0.20 0.20 0.20 0.10 0.10 0.10 0.10 1.5 0.30 0.30 0.20 0.20 0.20 0.20 0.20 0.10 1.8 0.40 0.30 0.30 0.30 0.20 0.20 0.20 0.20 2.0 0.50 0.40 0.40 0.30 0.30 0.30 0.20 0.20 2.3 0.60 0.50 0.50 0.40 0.30 0.30 0.30 0.30 2.5 0.70 0.60 0.60 0.50 0.40 0.40 0.30 0.30 2.8 0.80 0.70 0.70 0.60 0.50 0.40 0.40 0.40 3.0 1.00 0.90 0.80 0.70 0.60 0.50 0.50 0.40 3.5 1.30 1.10 1.00 0.90 0.80 0.70 0.60 0.60 4.0 1.70 1.50 1.30 1.20 1.00 0.90 0.80 0.70 4.5 2.10 1.90 1.70 1.50 1.20 1.10 1.00 0.90 5.0 1.80 1.50 1.30 1.20 1.10 6.0 1.90 1.70 1.60
[1] Based on uniform flow conditions, safety factor = 1.2, rock specific gravity of 2.4, and a rock size distribution such that the largest rock is approximately twice the size of the mean rock size.
Table 6 – Velocity-based design table for mean rock size, d50 (m) for SF = 1.5
Safety factor, SF = 1.5 Specific gravity, sr = 2.4 Size distribution, d50/d90 = 0.5 Local
velocity (m/s)
Bed slope (V:H)
1:2 1:3 1:4 1:6 1:10 1:15 1:20 1:30
0.5 0.05 0.05 0.05 0.05 0.05 0.05 0.05 0.05 0.8 0.10 0.10 0.10 0.10 0.05 0.05 0.05 0.05 1.0 0.20 0.20 0.20 0.20 0.10 0.10 0.10 0.10 1.3 0.30 0.30 0.20 0.20 0.20 0.20 0.20 0.10 1.5 0.40 0.30 0.30 0.30 0.20 0.20 0.20 0.20 1.8 0.50 0.50 0.40 0.40 0.30 0.30 0.30 0.20 2.0 0.70 0.60 0.50 0.50 0.40 0.40 0.30 0.30 2.3 0.80 0.70 0.60 0.60 0.50 0.40 0.40 0.40 2.5 1.00 0.90 0.80 0.70 0.60 0.50 0.50 0.40 2.8 1.20 1.00 0.90 0.80 0.70 0.60 0.60 0.50 3.0 1.40 1.20 1.10 1.00 0.80 0.70 0.70 0.60 3.5 1.90 1.70 1.50 1.30 1.10 1.00 0.90 0.80 4.0 1.90 1.70 1.40 1.30 1.10 1.00 4.5 1.80 1.60 1.40 1.30 5.0 1.90 1.80 1.60 6.0 2.20
[1] Based on uniform flow conditions, safety factor = 1.5, rock specific gravity of 2.4, and a rock size distribution such that the largest rock is approximately twice the size of the mean rock size.
© Catchments & Creeks Pty Ltd Version 2 – November 2014 Page 6
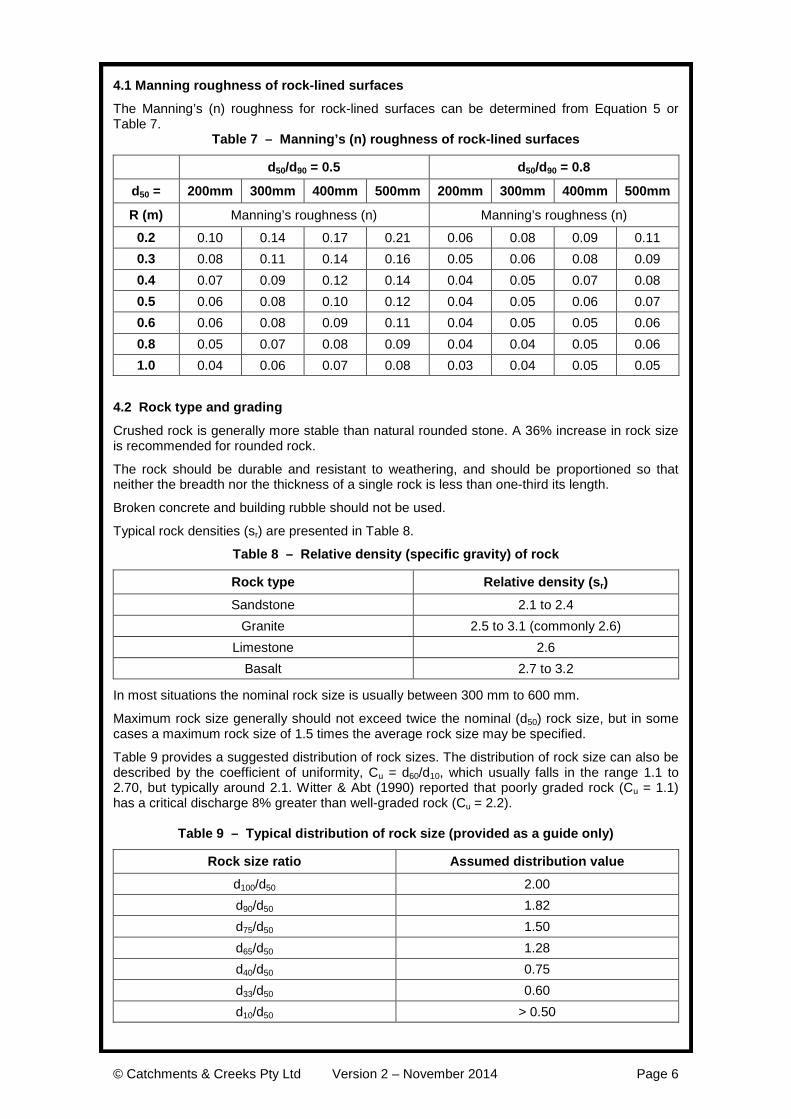
4.1 Manning roughness of rock-lined surfaces
The Manning’s (n) roughness for rock-lined surfaces can be determined from Equation 5 or Table 7.
Table 7 – Manning’s (n) roughness of rock-lined surfaces
d50/d90 = 0.5 d50/d90 = 0.8
d50 = 200mm 300mm 400mm 500mm 200mm 300mm 400mm 500mm
R (m) Manning’s roughness (n) Manning’s roughness (n)
0.2 0.10 0.14 0.17 0.21 0.06 0.08 0.09 0.11 0.3 0.08 0.11 0.14 0.16 0.05 0.06 0.08 0.09 0.4 0.07 0.09 0.12 0.14 0.04 0.05 0.07 0.08 0.5 0.06 0.08 0.10 0.12 0.04 0.05 0.06 0.07 0.6 0.06 0.08 0.09 0.11 0.04 0.05 0.05 0.06 0.8 0.05 0.07 0.08 0.09 0.04 0.04 0.05 0.06 1.0 0.04 0.06 0.07 0.08 0.03 0.04 0.05 0.05
4.2 Rock type and grading
Crushed rock is generally more stable than natural rounded stone. A 36% increase in rock size is recommended for rounded rock.
The rock should be durable and resistant to weathering, and should be proportioned so that neither the breadth nor the thickness of a single rock is less than one-third its length.
Broken concrete and building rubble should not be used.
Typical rock densities (sr) are presented in Table 8.
Table 8 – Relative density (specific gravity) of rock
Rock type Relative density (sr) Sandstone 2.1 to 2.4
Granite 2.5 to 3.1 (commonly 2.6) Limestone 2.6
Basalt 2.7 to 3.2
In most situations the nominal rock size is usually between 300 mm to 600 mm.
Maximum rock size generally should not exceed twice the nominal (d50) rock size, but in some cases a maximum rock size of 1.5 times the average rock size may be specified.
Table 9 provides a suggested distribution of rock sizes. The distribution of rock size can also be described by the coefficient of uniformity, Cu = d60/d10, which usually falls in the range 1.1 to 2.70, but typically around 2.1. Witter & Abt (1990) reported that poorly graded rock (Cu = 1.1) has a critical discharge 8% greater than well-graded rock (Cu = 2.2).
Table 9 – Typical distribution of rock size (provided as a guide only)
Rock size ratio Assumed distribution value d100/d50 2.00 d90/d50 1.82 d75/d50 1.50 d65/d50 1.28 d40/d50 0.75 d33/d50 0.60 d10/d50 > 0.50

© Catchments & Creeks Pty Ltd Version 2 – November 2014 Page 7
4.3 Thickness of rock layer
The thickness of the armour layer should be sufficient to allow at least two overlapping layers of the nominal rock size. The thickness of rock protection must also be sufficient to accommodate the largest rock size.
It is noted that additional thickness will not compensate for undersized rock.
In order to allow at least two layers of rock, the minimum thickness of rock protection (T) can be approximated by the values presented in Table 10.
Table 10 – Minimum thickness (T) of rock lining
Min. Thickness (T) Size distribution (d50/d90) Description 1.4 d50 1.0 Highly uniform rock size 1.6 d50 0.8 Typical upper limit of quarry rock 1.8 d50 0.67 Recommended lower limit of distribution 2.1 d50 0.5 Typical lower limit of quarry rock
4.4 Backing material or filter layer
The rock must be placed over a layer of suitably graded filter rock or geotextile filter cloth (minimum ‘bidim A24’ or the equivalent). The geotextile filter cloth must have sufficient strength and must be suitably overlapped to withstand the placement of the rock.
If the rock is placed on a dispersive (e.g. sodic) soil (a condition not recommended), then prior to placing the filter cloth, the exposed bank must first be covered with a layer of non-dispersive soil, typically minimum 200 mm thickness, but preferably 300 mm (Figure 2). 4.5 Maximum bank gradient
The recommended maximum spillway gradient is 1:2 (V:H); however, slopes as steep as 1:1.5 can be stable under minor flows if the rocks are individually placed rather than bumped. Typical angles of repose for dumped rock are provided in Table 11.
Table 11 – Typical angle of repose for rock
Rock shape Angle of repose (degrees)
Rock size >100 mm Rock size >500 mm Very angular rock 41o 42o
Slightly angular rock 40o 41o
Moderately rounded rock 39o 40o
4.6 Placement of rock Minimum recommended spillway depth of 300 mm. An embankment freeboard of 150 mm should exist. A greater freeboard may be required if it is necessary to contain any splash. The spillway chute must be straight from inlet to outlet (i.e. no bends or curves). 4.7 Placement of vegetation over the rock cover
Vegetating rock-lined spillways can significantly increase the spillway’s long-term stability. Flexible, mat-forming grasses (non-woody plants) must be used. Stiff grasses, such as Lomandra or Vetiveria zizanioides, are not recommended for dam spillways. 4.8 Common failure modes
Most failures of rock-lined hydraulic structures are believed to occur as a result of inappropriate placement of the rock, either due to inadequate design detailing, or poorly supervised construction practices. Rock-lined spillways are usually most vulnerable to damage in the first year or two after rock placement while the voids remain open and free of sedimentation.

© Catchments & Creeks Pty Ltd Version 2 – November 2014 Page 8
Photo 3 – Dam spillways must have a
well-defined cross-sectional profile Photo 4 – A poorly defined crest profile
will result in flow bypassing
Photo 5 – Ideally, the spillway should be
formed to the side of the embankment Photo 6 – Rock protection should extend beyond the toe to form a suitable energy
dissipater
Photo 7 – Rounded rock can be
significantly less stable than angular, fractured rock, especially when placed on
steep slopes
Photo 8 – Placement of a few large, anchor rocks down a steep slope will not help stabilise under-sized rocks and will
likely cause flow concentration 5. Reference Witter, R.J. & Abt, S.R. 1990, The influence of uniformity on riprap stability. Proceedings of the 1990 National Conference – Hydraulic Engineering, San Diego, California, July-Aug 1990. Hydraulics Division of the American Society of Civil Engineers, New York, USA.