Embed Size (px)
Citation preview

Investor Update
F. Hoffmann-La Roche Ltd 4070 Basel Switzerland
Investor Relations email: [email protected]
Tel. +41 61 68-88880 Fax +41 61 69-10014 www.roche.com
1/23
Basel, 15 April 2014
Roche with good start in 2014 Continued growth due to recently launched medicines
• Group sales up 5% at constant exchange rates, -1% in Swiss francs
• Pharma sales up 4%1 with continued growth of Avastin, MabThera/Rituxan,
Actemra/RoActemra and Herceptin compensating for expected decline in Xeloda sales
• Strong uptake of recently launched products Perjeta and Kadcyla for HER2 positive breast cancer
• Diagnostics Division sales up 7%; Professional Diagnostics continues to outperform market
• Subcutaneous formulation of MabThera approved in Europe
• Acquisition of IQuum strengthens Molecular Diagnostics portfolio with point of care testing
• Full-year outlook confirmed
Three months’ sales
Jan–March 2014
In millions of CHF As % of sales % change
2014 2013 2014 2013 At CER1 In CHF
Group
Pharmaceuticals Division
US
Europe
Japan
International*
Diagnostics Division
11,496
9,040
3,873
2,425
845
1,897
2,456
11,589
9,170
3,912
2,314
826
2,118
2,419
100
79
34
21
7
17
21
100
79
34
20
7
18
21
+5
+4
+3
+5
+19
+1
+7
-1
-1
-1
+5
+2
-10
+2
* Asia–Pacific, EEMEA (Eastern Europe, Middle East, Africa), Latin America, Canada, Others 1Unless otherwise stated, all growth rates are in constant exchange rates (CER)
Commenting on the Group’s first quarter performance, Roche CEO Severin Schwan said: “Both the Pharma
and Diagnostics Divisions posted solid growth in the first quarter. I am particularly pleased with the strong
uptake of our recently launched medicines Perjeta and Kadcyla for HER2-positive breast cancer. With the

2/23
acquisition of IQuum, we will further strengthen our leading molecular diagnostics portfolio with tests for
the point of care segment. Based on the first quarter results, I am confident we will meet our full year
targets.”
Strong demand for cancer medicines and clinical lab sales
Group sales rose 5% in the first quarter, driven by demand for cancer medicines (in particular the HER2
breast cancer franchise, Avastin and MabThera/Rituxan), as well as Actemra/RoActemra for rheumatoid
arthritis. Sales of Xeloda, a chemotherapy drug, were lower as the product is now off patent and faces generic
competition in the United States and Europe. In the Diagnostics Division, strong sales growth was driven
mainly by Professional Diagnostics with demand for immunoassays in clinical laboratories.
Compared with the first quarter of 2013, many currencies weakened significantly against the Swiss franc;
notably the US dollar and the Japanese yen, as well as all Latin American currencies. This impacted the
reported Swiss franc sales growth by 6 percentage points.
Acquisition of IQuum strengthens Molecular Diagnostics portfolio
On 7 April 2014, Roche announced the acquisition of IQuum Inc., a privately held US company focused on
developing point of care tests for the molecular diagnostics market. Roche will pay IQuum shareholders
275 million US dollars up front and up to 175 million US dollars in contingent product related milestones.
The transaction is subject to customary closing conditions.
Full-year outlook confirmed
In 2014, Roche expects low-to mid-single digit growth in Group sales at constant exchange rates. Core EPS is
targeted to grow ahead of sales. Roche expects to further increase its dividend.
Pharmaceuticals Division
United States, Europe and Japan driving sales growth
Pharmaceuticals sales growth in the United States (+3%) was driven by very strong growth in the HER2
breast cancer franchise (+27%), as well as by Avastin, in particular for colorectal cancer, and by the eye
medicine, Lucentis.
The HER2 franchise and Tamiflu drove growth in Europe (+5%), along with Avastin in ovarian cancer.
In Japan, sales grew 19%, with some temporary stockpiling in advance of an increase in local consumption
tax. Growth was driven by the HER2 franchise, as well as increased demand for Avastin in breast and lung
cancer. Good growth was also seen for Actemra/RoActemra, with its new subcutaneous form launched in
3/23
2013, as well as Edirol and Mircera.
Sales in International markets were up 1%. In Latin America, Brazil showed good growth with increased sales
of Herceptin to the public health system; Venezuela also showed significant increases in public sector sales.
In Saudi Arabia, sales were negatively impacted by the timing of tenders, whilst political turmoil impacted
sales in Iraq and Libya. In China, underlying sales growth remains good, however the first quarter was
impacted by wholesaler buying patterns, as well as lower demand for Tamiflu, compared with the first
quarter of 2013.
Oncology products performing well
The HER2 franchise (Herceptin, Perjeta and Kadcyla) grew 17%, with particularly strong demand for Perjeta
and good uptake of Kadcyla. Avastin (+9%) showed strong growth across all regions, with increased use in
colorectal and ovarian cancers. MabThera/Rituxan (+3%) grew strongly in International markets and in
Europe.
Gazyva, a medicine for chronic lymphocytic leukemia was approved in the United States in late 2013 and has
strengthened Roche’s hematology franchise. A regulatory decision on Gazyva in Europe is expected later in
2014 and three Phase III trials are well underway for testing this medicine in aggressive and indolent non-
Hodgkin’s lymphoma.
Immunology and ophthalmology showing strong growth
Actemra/RoActemra, a medicine for rheumatoid arthritis which is now available in a subcutaneous
formulation in a number of markets, grew strongly in all regions, up 23% overall. Sales of the eye medicine
Lucentis, which is only sold in the United States by Roche, rose 8% as a result of growth in the RVO (retinal
vein occlusion) and DME (diabetic macular edema) indications and for the treatment of wAMD (wet age-
related macular degeneration).
Pipeline continues to deliver
During the first quarter, the subcutaneous formulation of MabThera was approved in Europe, and the FDA
approved a new indication for Xolair. Xolair can now be used to treat chronic idiopathic urticaria, a form of
chronic skin hives, in addition to its current use in allergic asthma. Phase II data for lebrikizumab, an
experimental medicine for severe asthma showed good results for a sub-group of patients who can be
identified using a companion diagnostic test.
Three phase III studies for bitopertin, an investigational medicine, did not meet their primary endpoints in
schizophrenia and were discontinued in the first quarter. Two of these studies investigated bitopertin for its
effect on negative symptoms, and the third focused on its effect on sub-optimally controlled symptoms.

4/23
Following these results, futility analyses were conducted on the three remaining Phase III bitopertin studies
and Roche has decided to discontinue two of those studies and continue one study in sub-optimally
controlled symptoms (NightLyte).
A phase III study of onartuzumab in people with a specific kind of lung cancer was also stopped in the
quarter due to a lack of clinically meaningful efficacy. Roche remains committed to developing new
medicines for lung cancer, as it is a disease with high unmet medical need. An investigational
immunotherapy medicine for lung cancer, anti-PDL1 (RG7446), moved into phase III in the quarter with the
OAK trial. Anti-PDL1 is designed to help the immune system restore its ability to fight cancer cells. It is also
being tested on a number of other cancers, both alone and in combination with other Roche medicines.
Another potential lung cancer medicine in the pipeline is alectinib for patients with the ALK-positive
mutation. Alectinib is planned to start a phase III trial later in 2014.
Key products
* At constant exchange rates (CER)
** Asia–Pacific, EEMEA (Eastern Europe, Middle East, Africa), Latin America, Canada, Others
*** >500%
Top-selling
pharmaceuticals
and recent launches
Jan–March 2014
Total US Europe Japan International**
CHF m %* CHF m %* CHF m %* CHF m %* CHF m %*
MabThera/Rituxan 1,667 3 799 -2 503 6 56 20 309 12
Avastin 1,565 9 670 6 499 8 175 27 221 7
Herceptin 1,526 3 473 4 568 2 70 23 415 0
Lucentis 407 8 407 8 --- --- --- --- --- ---
Tamiflu 344 9 178 -9 71 *** 60 -17 35 -8
Tarceva 304 -5 141 -6 76 -12 25 42 62 -6
Xeloda 293 -19 130 -15 34 -57 24 8 105 -3
Pegasys 287 -19 63 -40 77 -19 13 16 134 -7
Actemra/RoActemra 273 23 86 22 99 20 53 49 35 3
CellCept 215 -1 48 -7 55 -10 14 5 98 6
Recent launches
Perjeta 178 274 110 161 41 *** 18 --- 9 ***
Kadcyla 102 474 73 315 25 --- --- --- 4 ---
Zelboraf 79 -2 19 -40 52 12 --- --- 8 98
Erivedge 24 96 14 16 9 *** --- --- 1 ---
Gazyva 8 --- 8 --- --- --- --- --- --- ---

5/23
• MabThera/Rituxan (+3%), for blood cancers, specifically non-Hodgkin’s lymphoma (NHL), chronic
lymphocytic leukemia (CLL), and for rheumatoid arthritis. It is also used to treat granulomatosis
with polyangiitis (GPA) and microscopic polyangiitis (MPA), which are two types of ANCA (anti-
neutrophil cytoplasmic antibody) associated vasculitis. Sales were 3% higher, with strong growth in
International markets (+12%) and in Europe (+6%). Sales in the highly penetrated US market were
2% lower. In International markets, sales were driven by strong public sector sales in Venezuela and
Brazil. The subcutaneous formulation of MabThera in non-Hodgkin’s lymphoma was approved in
Europe in March.
• Avastin (+9%), for advanced colorectal, breast, lung, kidney and ovarian cancer, and glioblastoma (a
type of brain tumour). Sales growth in the United States (+6%) was driven by expanded use in
colorectal cancer, while in Europe sales grew by 8%, primarily as a result of increased demand in
ovarian cancer. In Japan (+27%) strong demand was seen in lung and breast cancer. International
markets were 7% higher, with sales in China showing increased uptake in its patient access
programme for colorectal cancer treatment.
• HER2 franchise (Herceptin, Perjeta, Kadcyla) (+17%) for HER2-positive breast cancer and HER2-
positive metastatic (advanced) gastric cancer. Herceptin sales rose 3% overall, with 4% growth in the
United States, 2% in Europe and 23% in Japan. International markets were stable, impacted by some
phasing of sales in Mexico and political instability in Iraq, however growth remained strong in China
from patient access programmes; and in Brazil with sales to the public healthcare system. Uptake for
the subcutaneous formulation of Herceptin has been very positive since its approval in Europe in
2013 and it is now available in many markets, including Germany and the UK. Demand for recently
launched medicines Perjeta and Kadcyla was very strong in the first quarter. Perjeta (178 million
Swiss francs), a medicine which is combined with Herceptin, grew significantly in the United States
in both metastatic and pre-surgical breast cancer. Uptake in Europe was also very strong, especially
in Germany and the UK. Kadcyla (102 million Swiss francs) is a targeted cancer medicine that can
attach to HER2-positive cancer cells and deliver chemotherapy directly to them, resulting in a highly
potent treatment with fewer adverse side effects. There was good initial uptake in Europe for Kadcyla
(primarily Germany), as well as continued growth in the United States. Following approvals in Japan
and the EU in late 2013, reimbursement discussions are well underway in these markets.
• Lucentis (+8%, United States only), for eye conditions specifically wet age-related macular
degeneration (wAMD), macular edema following retinal vein occlusion (RVO) and diabetic macular
edema (DME). Sales rose as a result of growth in the RVO and DME indications and for the
treatment of wAMD.

6/23
• Actemra/RoActemra (+23%), for rheumatoid arthritis (RA), systemic juvenile idiopathic arthritis
and polyarticular juvenile idiopathic arthritis. As a result of continued strong market uptake as
monotherapy in RA, Actemra/RoActemra sales continued to grow strongly in Japan (+49%), Europe
(+20%) and the United States (+22%). Sales of the subcutaneous formulation in the United States,
which was launched in late 2013, are also growing well. This formulation received a positive
recommendation from Europe’s regulatory agency in February and is expected to launch in the
second quarter of 2014.
• Zelboraf (-2%), for BRAF V600 mutation-positive metastatic melanoma, launched in 2011. Zelboraf
has been the standard of care for BRAF mutation-positive metastatic melanoma in the United States
and Europe and is approved in over 80 countries, however currently is facing some competition.
Data from coBRIM, a pivotal Phase III trial comparing the combination of cobimetinib (a MEK
inhibitor)with Zelboraf, against Zelboraf alone is expected later in 2014.
• Gazyva (8 million Swiss francs), for front line chronic lymphocytic leukemia (CLL). Gazyva was
approved in the United States in November 2013 with an FDA Breakthrough Therapy Designation.
Gazyva is included in the CLL treatment guidelines of the National Comprehensive Cancer Network.
Roche has submitted marketing applications to other regulatory authorities, including the European
Medicines Agency (EMA). Phase III trials are well underway for Gazyva in non-Hodgkin’s
lymphoma and read-outs are expected from 2015 onwards.
Major clinical and regulatory news flow to 15 April 2014
Compound Indication Milestone
MabThera
subcutaneous
NHL (follicular lymphoma and diffuse
large B-cell lymphoma)
EU approval Q1
Xolair chronic idiopathic urticaria FDA approval Q1
Bitopertin schizophrenia Phase III studies (FlashLyte
and DayLyte for negative
sypmtoms, TwiLyte for
sub-optimally controlled
symptoms) did not meet
primary end points
SunLyte and MoonLyte
discontinued after futility
analyses
Q1
Lebrikizumab severe uncontrolled asthma Phase IIb study results
(LUTE, VERSE)
Q1

7/23
Onartuzumab and
Tarceva
non-small cell lung cancer Phase III study results
(MetLung)
Q1
Upcoming clinical news flow and pending regulatory decisions
Compound Indication Milestone
Gazyva chronic lymphocytic leukemia EU approval
Kadcyla and Perjeta metastatic HER2-positive breast cancer
(first line)
Phase III study results
(MARIANNE)
RoActemra
subcutaneous
rheumatoid arthritis EU approval
Cobimetinib and
Zelboraf
BRAF V600 mutation-positive
metastatic melanoma
Phase III study results
(co-BRIM)
Oral octreotide Acromegaly Phase III study results
Diagnostics Division
Clinical labs business grows in all regions
Diagnostics sales grew 7% overall, with all business areas contributing to growth. There was strong demand
for tests and instruments used in clinical laboratories, especially in Professional and Molecular Diagnostics
(+9% and +4% respectively). Diabetes Care sales increased 5% despite a continued challenging and volatile
market environment. Tissue Diagnostics grew 4%.
Sales growth was driven by North America (+9%), Asia–Pacific (+13%) and the EMEA region (Europe,
Middle East and Africa +4%); Latin America (+13%) and Japan (+7%) also showed good growth. In the first
quarter Roche Diagnostics launched five key products.
On 7 April 2014, Roche acquired IQuum Inc., a privately-held US company specialising in point of care tests
for the molecular diagnostics market. This new technology allows on-the-spot molecular diagnostic testing
close to the patient, rather than in a central laboratory. The LiatTM Analyzer and LiatTM Influenza A/B Assay is
the first test available for use on the system and produces reliable and accurate lab-like results. It is also CE
marked and FDA cleared.
An FDA advisory committee recommended that Roche’s HPV test become the primary screening tool for
cervical cancer, which will significantly improve early diagnosis of this disease. A new test was also launched
in the quarter to identify syphilis in routine samples and donated blood.

8/23
Diagnostics Division:
Sales Jan–March 2014
In millions of
CHF
% change at
CER*
% change in
CHF
As %
of sales
Sales - Diagnostics Division 2,456 +7 +2 100
Business
Areas
Professional Diagnostics 1,392 +9 +3 57
Diabetes Care 538 +5 0 22
Molecular Diagnostics 370 +4 -2 15
Tissue Diagnostics 156 +4 -1 6
Regions Europe, Middle East, Africa 1,191 +4 +2 48
North America 612 +9 +3 25
Asia–Pacific 390 +13 +5 16
Latin America 152 +13 -7 6
Japan 111 +7 -8 5
* Constant exchange rates
Professional Diagnostics (+9%). The business area further extended its position as market leader with
strong growth in the immunoassay (+12%), clinical chemistry (+10%) and the coagulation patient self-
monitoring (+6%) businesses. All regions contributed to the above market growth. The immunoassay
business, which accounts for a quarter of total sales of the Division, includes tests for tumours, thyroid
function, cardiac and women’s health and infectious disease markers. The new cobas 8100 pre- and post-
analytics automated workflow series, which is available in all markets except the United States, has received
very positive customer feedback and saw continued good uptake since its launch in September 2013.
A new Elecsys Syphilis immunoassay was launched to identify infections with the syphilis causing bacterium
Treponema pallidum in routine clinical practice and in donated blood. Worldwide approximately 12 million
people are infected annually with syphilis, which can be treated more effectively if detected at an early stage.
Diabetes Care (+5%). Sales of the business unit increased, despite continued challenging and volatile market
conditions for blood glucose monitoring supplies. Growth was seen in all regions: North America (+13%),
Asia–Pacific (+10%), the EMEA region (+1%), Latin America (+12%) and Japan (+9%). The sales growth
reported for the first quarter in 2014 is also influenced by a relatively weak first quarter in 2013, especially in
North America.
Sales of blood glucose monitoring devices grew 4% as newer and more technologically advanced products are
replacing those at the late stage of their life-cycle. Growth was mainly driven by the Accu-Chek Aviva /
Performa (+12%) and the Accu-Chek Mobile (+24%). Sales of insulin delivery systems increased 9%. The
Accu-Chek Insight system, Roche’s next generation insulin pump system and pump remote control was
launched in Europe.
9/23
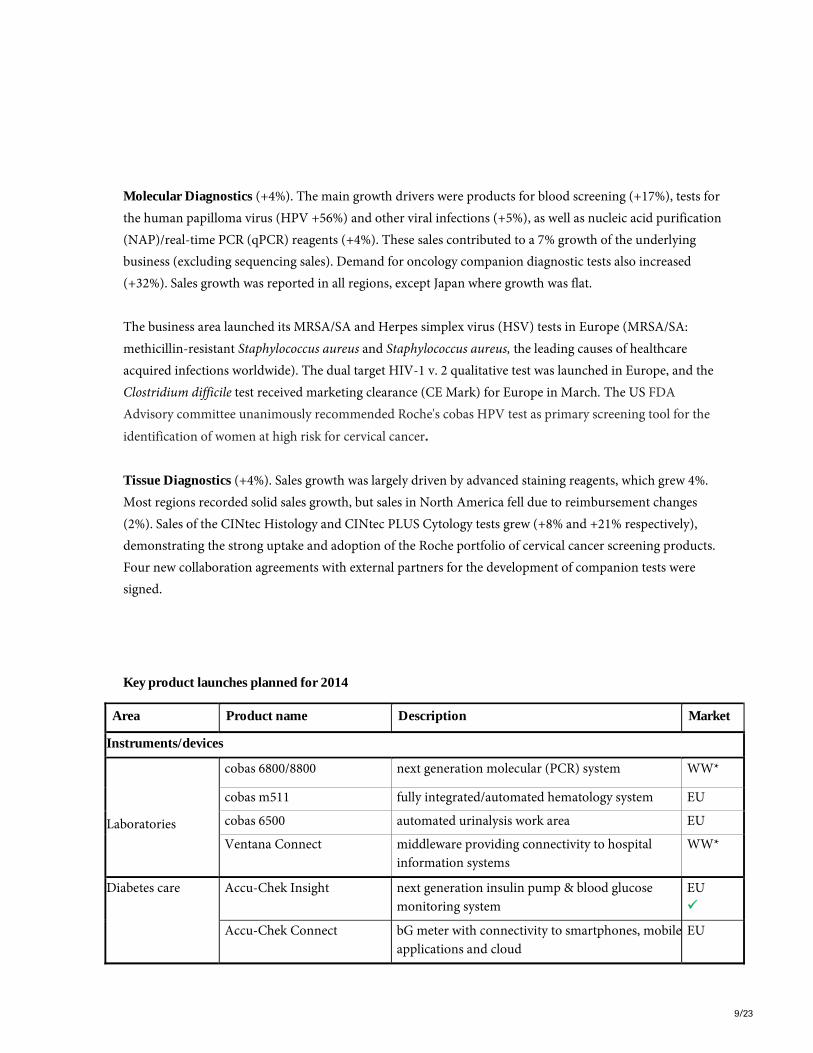
Molecular Diagnostics (+4%). The main growth drivers were products for blood screening (+17%), tests for
the human papilloma virus (HPV +56%) and other viral infections (+5%), as well as nucleic acid purification
(NAP)/real-time PCR (qPCR) reagents (+4%). These sales contributed to a 7% growth of the underlying
business (excluding sequencing sales). Demand for oncology companion diagnostic tests also increased
(+32%). Sales growth was reported in all regions, except Japan where growth was flat.
The business area launched its MRSA/SA and Herpes simplex virus (HSV) tests in Europe (MRSA/SA:
methicillin-resistant Staphylococcus aureus and Staphylococcus aureus, the leading causes of healthcare
acquired infections worldwide). The dual target HIV-1 v. 2 qualitative test was launched in Europe, and the
Clostridium difficile test received marketing clearance (CE Mark) for Europe in March. The US FDA
Advisory committee unanimously recommended Roche's cobas HPV test as primary screening tool for the
identification of women at high risk for cervical cancer.
Tissue Diagnostics (+4%). Sales growth was largely driven by advanced staining reagents, which grew 4%.
Most regions recorded solid sales growth, but sales in North America fell due to reimbursement changes
(2%). Sales of the CINtec Histology and CINtec PLUS Cytology tests grew (+8% and +21% respectively),
demonstrating the strong uptake and adoption of the Roche portfolio of cervical cancer screening products.
Four new collaboration agreements with external partners for the development of companion tests were
signed.
Key product launches planned for 2014
Area Product name Description Market
Instruments/devices
Laboratories
cobas 6800/8800 next generation molecular (PCR) system WW*
cobas m511 fully integrated/automated hematology system EU
cobas 6500 automated urinalysis work area EU
Ventana Connect middleware providing connectivity to hospital
information systems
WW*
Diabetes care Accu-Chek Insight next generation insulin pump & blood glucose
monitoring system
EU
Accu-Chek Connect bG meter with connectivity to smartphones, mobile
applications and cloud
EU

10/23
Tests/ assays
Blood screening /
infectious diseases
MPX 2.0 next generation blood screening multiplex test US
MPX (HIV, HCV, HBV),
HEV, DPX1, WNV2
full NAT blood screening menu for cobas
6800/8800
WW*
HIV, HCV, HBV virology tests for cobas 6800/8800 WW*
HSV herpes simplex virus detection on cobas 4800 EU
Syphilis Treponema pallidum detection (immunoassay) EU
Microbiology
MRSA/SA next generation assay on cobas 4800 EU
C-difficile diagnosis of infections and associated diarrhea EU
Women’s health
AMH assessment of ovarian reserve for fertility EU
PE Prognosis short-term prediction of pre-eclampsia in
pregnancy (claim extension)
EU
*Except the United States 1 Parvovirus B19 und Hepatitis-A-Virus 2 West-Nil-Virus
11/23
About Roche
Headquartered in Basel, Switzerland, Roche is a leader in research-focused healthcare with combined strengths in
pharmaceuticals and diagnostics. Roche is the world’s largest biotech company, with truly differentiated medicines
in oncology, immunology, infectious diseases, ophthalmology and neuroscience. Roche is also the world leader in in
vitro diagnostics and tissue-based cancer diagnostics, and a frontrunner in diabetes management. Roche’s
personalised healthcare strategy aims at providing medicines and diagnostics that enable tangible improvements in
the health, quality of life and survival of patients. Founded in 1896, Roche has been making important contributions
to global health for more than a century. Twenty-four medicines developed by Roche are included in the World
Health Organisation Model Lists of Essential Medicines, among them life-saving antibiotics, antimalarials and
chemotherapy.
In 2013 the Roche Group employed over 85,000 people worldwide, invested 8.7 billion Swiss francs in R&D and
posted sales of 46.8 billion Swiss francs. Genentech, in the United States, is a wholly owned member of the Roche
Group. Roche is the majority shareholder in Chugai Pharmaceutical, Japan. For more information, please visit
www.roche.com.
All trademarks used or mentioned in this release are protected by law.
Additional information
• Investor Update including full set of tables: http://www.roche.com/inv-update-2014-04-15.htm
• First Quarter 2014 Sales Presentation: http://www.roche.com/irp1q14e-a.pdf
• First Quarter 2014 Sales Presentation with appendix: http://www.roche.com/irp1q14e.pdf
• Sustainable Development at Roche: www.roche.com/corporate_responsibility
• Roche Annual Report 2013 (includes Corporate Responsibility Report): www.roche.com/annual_reports
• Dow Jones Sustainability Indexes: www.sustainability-indexes.com
• SAM: www.sam-group.com
Roche’s First Quarter Sales 2014 Conference Call
Tuesday, April 15th 2014
14:00 – 15:15 CEST / 13:00 – 14:15 BST
08:00 – 09:15 AM EDT / 05:00 – 06:15 AM PDT
12/23
Dial-in details:
+41 (0) 58 310 5000 (Europe and ROW)
+44 (0) 203 059 5862 (UK)
+1 (1) 631 570 5613 (USA)
more
Roche Investor Relations
Dr. Karl Mahler Dr. Sabine Borngräber
Phone: +41 61 68-78503 Phone: +41 61 68-88027
e-mail: [email protected] e-mail: [email protected]
Luís Correia Ph.D. Tamer Farhan Ph.D.
Phone: +41 61 68-75284 Phone: +41 61 68-82552
e-mail: [email protected] e-mail: [email protected]
Dr. Birgit Masjost Dr. Nina Mojas
Phone: +41 61 68-84814 Phone: +41 61 68-71300
e-mail: [email protected] e-mail: [email protected]
Elhan Webb, CFA
Phone: +41 61 68-89630
e-mail: [email protected]
Investor Relations North America
Thomas Kudsk Larsen Nina Goworek
Phone: +1 650 467 2016 Phone: +1 650 467 8737
e-mail: [email protected] e-mail: [email protected]
Ekaterine Kortkhonjia Ph.D.
Phone: +1 650 467 5873
e-mail: [email protected]
Disclaimer: Cautionary statement regarding forward-looking statements
This document contains certain forward-looking statements. These forward-looking statements may be identified
by words such as ‘believes’, ‘expects’, ‘anticipates’, ‘projects’, ‘intends’, ‘should’, ‘seeks’, ‘estimates’, ‘future’ or similar
expressions or by discussion of, among other things, strategy, goals, plans or intentions. Various factors may cause
actual results to differ materially in the future from those reflected in forward-looking statements contained in this
document, among others: (1) pricing and product initiatives of competitors; (2) legislative and regulatory
developments and economic conditions; (3) delay or inability in obtaining regulatory approvals or bringing

13/23
products to market; (4) fluctuations in currency exchange rates and general financial market conditions; (5)
uncertainties in the discovery, development or marketing of new products or new uses of existing products,
including without limitation negative results of clinical trials or research projects, unexpected side effects of pipeline
or marketed products; (6) increased government pricing pressures; (7) interruptions in production; (8) loss of or
inability to obtain adequate protection for intellectual property rights; (9) litigation; (10) loss of key executives or
other employees; and (11) adverse publicity and news coverage. The statement regarding earnings per share growth
is not a profit forecast and should not be interpreted to mean that Roche’s earnings or earnings per share for any
current or future period will necessarily match or exceed the historical published earnings or earnings per share of
Roche.

14/23
Appendix: Tables
1. Sales January to March 2014 and 2013 ........................................................................................................................................................................................................... 15
2. Quarterly sales and constant exchange rate sales growth by Division in 2014 and 2013 ...................................................................................................................... 16
3. Pharmaceuticals Division ................................................................................................................................................................................................................................. 17
4. Top 20 Pharmaceuticals Division product sales and constant exchange rate growth Q1 2014 vs. Q1 2013: US, Europe, Japan and
International* ..................................................................................................................................................................................................................................................... 18
5. Top 20 Pharmaceuticals Division quarterly product sales and quarterly constant exchange rate sales growth ............................................................................... 19
6. Top 20 Pharmaceuticals Division quarterly product sales and quarterly constant exchange rate sales growth United States ...................................................... 20
7. Top 20 Pharmaceuticals Division quarterly product sales and quarterly constant exchange rate sales growth Europe ................................................................. 21
8. Top 20 Pharmaceuticals Division quarterly product sales and quarterly constant exchange rate sales growth Japan .................................................................... 22
9. Top 20 Pharmaceuticals Division quarterly product sales and quarterly constant exchange rate sales growth International* .................................................... 23

15/23
1. Sales January to March 2014 and 2013
CHF millions
Three months ended
31 March % change
2014 2013 At CER* In CHF In USD
Pharmaceuticals Division 9,040 9,170 4 -1 3
United States 3,873 3,912 3 -1 3
Europe 2,425 2,314 5 5 9
Japan 845 826 19 2 7
International** 1,897 2,118 1 -10 -7
Diagnostics Division 2,456 2,419 7 2 6
Roche Group 11,496 11,589 5 -1 3
* At constant exchange rates versus January to March 2013;
**Asia–Pacific, EEMEA (Eastern Europe, Middle East and Africa), Latin America, Canada, Others

16/23
2. Quarterly sales and constant exchange rate sales growth by Division in 2014 and 2013
CHF millions Q1 2013
Q1 2013
vs.
Q1 2012
Q2 2013
Q2 2013
vs.
Q2 2012
Q3 2013
Q3 2013
vs.
Q3 2012
Q4 2013
Q4 2013
vs.
Q4 2012
Q1 2014
Q1 2014
vs.
Q1 2013
Pharmaceuticals Division 9,170 7 8,992 4 9,028 9 9,114 7 9,040 4
United States 3,912 13 3,641 7 3,876 16 3,668 5 3,873 3
Europe 2,314 1 2,338 2 2,300 3 2,302 2 2,425 5
Japan 826 2 846 2 820 4 913 2 845 19
International* 2,118 8 2,167 2 2,032 5 2,231 18 1,897 1
Diagnostics Division 2,419 1 2,714 4 2,544 7 2,799 5 2,456 7
Roche Group 11,589 6 11,706 4 11,572 8 11,913 7 11,496 5
*Asia–Pacific, EEMEA (Eastern Europe, Middle East and Africa), Latin America, Canada, Others

17/23
3. Pharmaceuticals Division
Top-selling pharmaceuticals
and recent new launches
January to March 2014
Total United States Europe Japan International**
CHF m %* CHF m %* CHF m %* CHF m %* CHF m %*
MabThera/Rituxan 1,667 3% 799 -2% 503 6% 56 20% 309 12%
Avastin 1,565 9% 670 6% 499 8% 175 27% 221 7%
Herceptin 1,526 3% 473 4% 568 2% 70 23% 415 0%
Lucentis 407 8% 407 8% - - - - - -
Tamiflu 344 9% 178 -9% 71 *** 60 -17% 35 -8%
Tarceva 304 -5% 141 -6% 76 -12% 25 42% 62 -6%
Xeloda 293 -19% 130 -15% 34 -57% 24 8% 105 -3%
Pegasys 287 -19% 63 -40% 77 -19% 13 16% 134 -7%
Actemra/RoActemra 273 23% 86 22% 99 20% 53 49% 35 3%
CellCept 215 -1% 48 -7% 55 -10% 14 5% 98 6%
Perjeta 178 274% 110 161% 41 *** 18 - 9 ***
Kadcyla 102 474% 73 315% 25 - - - 4 -
Zelboraf 79 -2% 19 -40% 52 12% - - 8 98%
Erivedge 24 96% 14 16% 9 *** - - 1 -
Gazyva 8 - 8 - 0 - - - - -
* At constant exchange rates versus January to March 2013;
**Asia–Pacific, EEMEA (Eastern Europe, Middle East and Africa), Latin America, Canada, Others
*** Over +500%
18/23
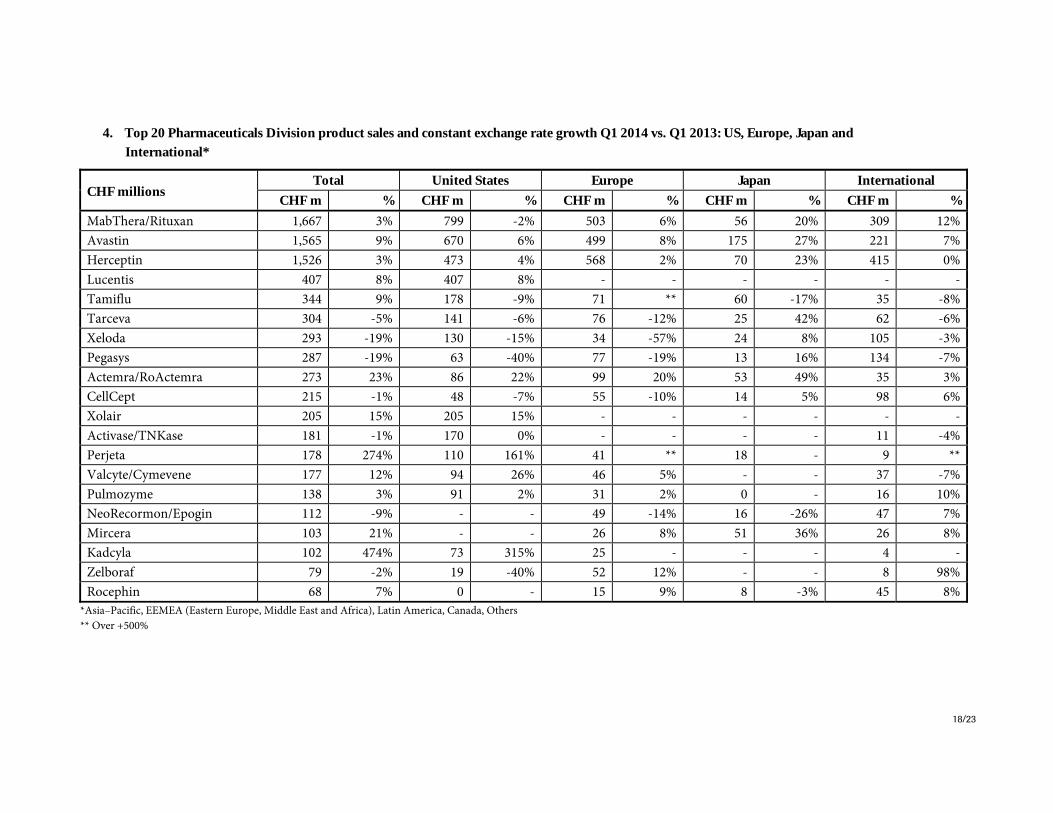
4. Top 20 Pharmaceuticals Division product sales and constant exchange rate growth Q1 2014 vs. Q1 2013: US, Europe, Japan and
International*
CHF millions Total United States Europe Japan International
CHF m % CHF m % CHF m % CHF m % CHF m %
MabThera/Rituxan 1,667 3% 799 -2% 503 6% 56 20% 309 12%
Avastin 1,565 9% 670 6% 499 8% 175 27% 221 7%
Herceptin 1,526 3% 473 4% 568 2% 70 23% 415 0%
Lucentis 407 8% 407 8% - - - - - -
Tamiflu 344 9% 178 -9% 71 ** 60 -17% 35 -8%
Tarceva 304 -5% 141 -6% 76 -12% 25 42% 62 -6%
Xeloda 293 -19% 130 -15% 34 -57% 24 8% 105 -3%
Pegasys 287 -19% 63 -40% 77 -19% 13 16% 134 -7%
Actemra/RoActemra 273 23% 86 22% 99 20% 53 49% 35 3%
CellCept 215 -1% 48 -7% 55 -10% 14 5% 98 6%
Xolair 205 15% 205 15% - - - - - -
Activase/TNKase 181 -1% 170 0% - - - - 11 -4%
Perjeta 178 274% 110 161% 41 ** 18 - 9 **
Valcyte/Cymevene 177 12% 94 26% 46 5% - - 37 -7%
Pulmozyme 138 3% 91 2% 31 2% 0 - 16 10%
NeoRecormon/Epogin 112 -9% - - 49 -14% 16 -26% 47 7%
Mircera 103 21% - - 26 8% 51 36% 26 8%
Kadcyla 102 474% 73 315% 25 - - - 4 -
Zelboraf 79 -2% 19 -40% 52 12% - - 8 98%
Rocephin 68 7% 0 - 15 9% 8 -3% 45 8%
*Asia–Pacific, EEMEA (Eastern Europe, Middle East and Africa), Latin America, Canada, Others
** Over +500%

19/23
5. Top 20 Pharmaceuticals Division quarterly product sales and quarterly constant exchange rate sales growth
CHF millions
Q1 2013 Q1 2013
vs.
Q1 2012
Q2 2013Q2 2013
vs.
Q2 2012
Q3 2013Q3 2013
vs.
Q3 2012
Q4 2013Q4 2013
vs.
Q4 2012
Q1 2014Q1 2014
vs.
Q1 2013
MabThera/Rituxan 1,696 6% 1,705 0% 1,805 12% 1,745 7% 1,667 3%
Avastin 1,527 11% 1,566 13% 1,617 14% 1,544 13% 1,565 9%
Herceptin 1,572 11% 1,510 0% 1,512 7% 1,485 7% 1,526 3%
Lucentis 393 1% 427 18% 431 21% 438 22% 407 8%
Tamiflu 335 84% 45 44% 34 115% 221 -27% 344 9%
Tarceva 336 0% 355 9% 327 5% 321 4% 304 -5%
Xeloda 383 1% 388 3% 393 6% 345 -3% 293 -19%
Pegasys 375 -15% 349 -24% 303 -16% 285 -20% 287 -19%
Actemra/RoActemra 238 32% 258 33% 267 33% 274 23% 273 23%
CellCept 229 4% 236 1% 216 -2% 193 -10% 215 -1%
Xolair 185 12% 201 10% 204 14% 200 17% 205 15%
Activase/TNKase 190 35% 151 3% 173 18% 169 19% 181 -1%
Perjeta 50 - 58 * 78 262% 140 394% 178 274%
Valcyte/Cymevene 166 8% 167 8% 166 0% 194 26% 177 12%
Pulmozyme 140 9% 138 7% 134 0% 160 18% 138 3%
NeoRecormon/Epogin 131 -22% 138 -20% 131 -16% 120 -14% 112 -9%
Mircera 94 12% 106 35% 107 29% 118 23% 103 21%
Kadcyla 18 - 65 - 73 - 78 - 102 474%
Zelboraf 84 154% 87 46% 89 38% 94 26% 79 -2%
Rocephin 68 -6% 70 19% 63 4% 67 5% 68 7%
* Over +500%
20/23
6. Top 20 Pharmaceuticals Division quarterly product sales and quarterly constant exchange rate sales growth United States
CHF millions
Q1 2013 Q1 2013
vs.
Q1 2012
Q2 2013Q2 2013
vs.
Q2 2012
Q3 2013Q3 2013
vs.
Q3 2012
Q4 2013Q4 2013
vs.
Q4 2012
Q1 2014Q1 2014
vs.
Q1 2013
MabThera/Rituxan 850 12% 807 -1% 917 20% 755 2% 799 -2%
Avastin 661 3% 629 3% 694 10% 591 4% 670 6%
Herceptin 476 17% 420 1% 479 14% 412 3% 473 4%
Lucentis 393 1% 427 18% 431 21% 438 22% 407 8%
Tamiflu 203 171% 10 -41% 26 * 189 -24% 178 -9%
Tarceva 156 14% 169 18% 148 5% 131 -8% 141 -6%
Xeloda 160 0% 155 -3% 165 8% 136 -8% 130 -15%
Pegasys 109 -30% 92 -40% 62 -51% 44 -55% 63 -40%
Actemra/RoActemra 73 45% 77 33% 83 33% 81 20% 86 22%
CellCept 54 60% 53 17% 51 13% 46 5% 48 -7%
Xolair 185 12% 201 10% 204 14% 200 17% 205 15%
Activase/TNKase 178 36% 137 3% 162 19% 158 22% 170 0%
Perjeta 44 - 44 * 48 129% 83 201% 110 161%
Valcyte/Cymevene 78 4% 92 14% 91 10% 97 19% 94 26%
Pulmozyme 93 17% 86 8% 85 6% 91 16% 91 2%
NeoRecormon/Epogin - - - - - - - - - -
Mircera - - - - - - - - - -
Kadcyla 18 - 64 - 70 - 70 - 73 315%
Zelboraf 32 19% 35 15% 28 12% 28 -1% 19 -40%
Rocephin 0 - 0 - 0 - 0 - 0 -
* Over +500%
21/23
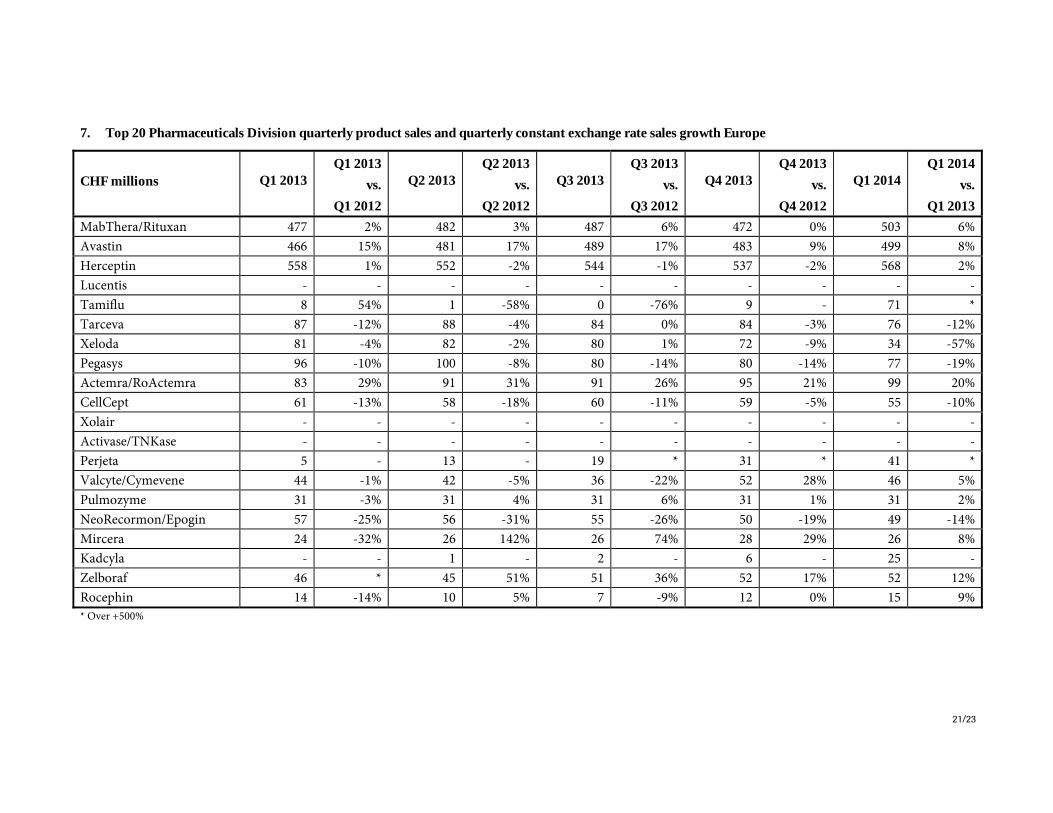
7. Top 20 Pharmaceuticals Division quarterly product sales and quarterly constant exchange rate sales growth Europe
CHF millions
Q1 2013 Q1 2013
vs.
Q1 2012
Q2 2013Q2 2013
vs.
Q2 2012
Q3 2013Q3 2013
vs.
Q3 2012
Q4 2013Q4 2013
vs.
Q4 2012
Q1 2014Q1 2014
vs.
Q1 2013
MabThera/Rituxan 477 2% 482 3% 487 6% 472 0% 503 6%
Avastin 466 15% 481 17% 489 17% 483 9% 499 8%
Herceptin 558 1% 552 -2% 544 -1% 537 -2% 568 2%
Lucentis - - - - - - - - - -
Tamiflu 8 54% 1 -58% 0 -76% 9 - 71 *
Tarceva 87 -12% 88 -4% 84 0% 84 -3% 76 -12%
Xeloda 81 -4% 82 -2% 80 1% 72 -9% 34 -57%
Pegasys 96 -10% 100 -8% 80 -14% 80 -14% 77 -19%
Actemra/RoActemra 83 29% 91 31% 91 26% 95 21% 99 20%
CellCept 61 -13% 58 -18% 60 -11% 59 -5% 55 -10%
Xolair - - - - - - - - - -
Activase/TNKase - - - - - - - - - -
Perjeta 5 - 13 - 19 * 31 * 41 *
Valcyte/Cymevene 44 -1% 42 -5% 36 -22% 52 28% 46 5%
Pulmozyme 31 -3% 31 4% 31 6% 31 1% 31 2%
NeoRecormon/Epogin 57 -25% 56 -31% 55 -26% 50 -19% 49 -14%
Mircera 24 -32% 26 142% 26 74% 28 29% 26 8%
Kadcyla - - 1 - 2 - 6 - 25 -
Zelboraf 46 * 45 51% 51 36% 52 17% 52 12%
Rocephin 14 -14% 10 5% 7 -9% 12 0% 15 9%
* Over +500%

22/23
8. Top 20 Pharmaceuticals Division quarterly product sales and quarterly constant exchange rate sales growth Japan
CHF millions
Q1 2013 Q1 2013
vs.
Q1 2012
Q2 2013Q2 2013
vs.
Q2 2012
Q3 2013Q3 2013
vs.
Q3 2012
Q4 2013Q4 2013
vs.
Q4 2012
Q1 2014Q1 2014
vs.
Q1 2013
MabThera/Rituxan 54 0% 64 6% 62 8% 69 8% 56 20%
Avastin 159 18% 183 18% 177 15% 198 12% 175 27%
Herceptin 66 6% 75 7% 71 7% 82 11% 70 23%
Lucentis - - - - - - - - - -
Tamiflu 84 6% 4 121% -1 -73% 18 -47% 60 -17%
Tarceva 21 8% 24 -2% 25 8% 29 25% 25 42%
Xeloda 26 8% 28 5% 26 3% 27 0% 24 8%
Pegasys 13 -16% 14 -18% 13 -22% 12 -28% 13 16%
Actemra/RoActemra 41 8% 49 23% 50 26% 57 24% 53 49%
CellCept 15 8% 18 13% 17 13% 18 8% 14 5%
Xolair - - - - - - - - - -
Activase/TNKase - - - - - - - - - -
Perjeta - - - - 5 - 18 - 18 -
Valcyte/Cymevene - - - - - - - - - -
Pulmozyme 0 - 0 - 0 - 0 - 0 -
NeoRecormon/Epogin 25 -37% 26 -29% 25 -22% 24 -22% 16 -26%
Mircera 44 46% 53 21% 55 26% 62 21% 51 36%
Kadcyla - - - - - - - - - -
Zelboraf - - - - - - - - - -
Rocephin 10 -8% 11 2% 11 2% 10 -5% 8 -3%

23/23
9. Top 20 Pharmaceuticals Division quarterly product sales and quarterly constant exchange rate sales growth International*
CHF millions
Q1 2013 Q1 2013
vs.
Q1 2012
Q2 2013Q2 2013
vs.
Q2 2012
Q3 2013Q3 2013
vs.
Q3 2012
Q4 2013Q4 2013
vs.
Q4 2012
Q1 2014Q1 2014
vs.
Q1 2013
MabThera/Rituxan 315 -2% 352 -3% 339 3% 449 26% 309 12%
Avastin 241 26% 273 29% 257 19% 272 49% 221 7%
Herceptin 472 19% 463 -1% 418 8% 454 21% 415 0%
Lucentis - - - - - - - - - -
Tamiflu 40 132% 30 161% 9 -17% 5 -72% 35 -8%
Tarceva 72 -12% 74 12% 70 13% 77 27% 62 -6%
Xeloda 116 3% 123 13% 122 10% 110 9% 105 -3%
Pegasys 157 -4% 143 -21% 148 18% 149 1% 134 -7%
Actemra/RoActemra 41 53% 41 57% 43 59% 41 31% 35 3%
CellCept 99 -4% 107 6% 88 -5% 70 -24% 98 6%
Xolair - - - - - - - - - -
Activase/TNKase 12 27% 14 -5% 11 -1% 11 -13% 11 -4%
Perjeta 1 - 1 - 6 - 8 ** 9 **
Valcyte/Cymevene 44 27% 33 9% 39 3% 45 38% 37 -7%
Pulmozyme 16 -6% 21 5% 18 -25% 38 41% 16 10%
NeoRecormon/Epogin 49 -3% 56 2% 51 3% 46 -2% 47 7%
Mircera 26 28% 27 19% 26 11% 28 20% 26 8%
Kadcyla - - 0 - 1 - 2 - 4 -
Zelboraf 6 ** 7 ** 10 489% 14 425% 8 98%
Rocephin 44 -3% 49 30% 45 7% 45 9% 45 8%
*Asia–Pacific, EEMEA (Eastern Europe, Middle East and Africa), Latin America, Canada, Others
** Over +500%