Embed Size (px)
Citation preview

Dynamic Article LinksC<AnalyticalMethods
Cite this: Anal. Methods, 2011, 3, 2003
www.rsc.org/methods PAPER
Publ
ishe
d on
01
Aug
ust 2
011.
Dow
nloa
ded
by I
mpe
rial
Col
lege
Lon
don
Lib
rary
on
21/0
5/20
13 0
4:54
:31.
View Article Online / Journal Homepage / Table of Contents for this issue
Robust TiO2/BDD heterojunction photoanodes for determination of chemicaloxygen demand in wastewaters†
Yanhe Han,a Jingxia Qiu,ab YuqingMiao,b Jisheng Han,c Shanqing Zhang,*a Haimin Zhanga and Huijun Zhaoa
Received 31st March 2011, Accepted 26th June 2011
DOI: 10.1039/c1ay05193h
A TiO2/BDD heterojunction photoanode, utilizing the inherent properties of nanostructured titanium
dioxide (TiO2) and boron-doped diamond (BDD), was prepared and used to determine chemical
oxygen demand (COD) in wastewaters. The TiO2 nanoparticles were dip-coated on a BDD substrate
and subject to calcination processes. A uniform, continuous and robust mixed-phase (anatase and
rutile) TiO2/BDD heterojunction electrode was obtained. The TiO2/BDD heterojunction electrode was
evaluated using a series of materials characterisation, electrical and electrochemical techniques. The
preliminary results suggest the elevated photoelectrocatalytic activity over the oxidation of organic
compounds stemmed from the formation of the p–n junction of the TiO2/BDD electrode. The TiO2/
BDD electrode has an excellent resistance towards strong acid due to the use of BDD substrate, which
is an added advantage for practical application. Under the optimized experimental conditions, the
TiO2/BDD electrode is capable of indiscriminately oxidizing a wide spectrum of organic compounds in
a photoelectrochemical thin-layer cell. This bestows the photoelectrochemical system with the ability to
measure the COD of synthetic and real samples in a fast, sensitive, reproducible and accurate fashion.
In particular, a typical analysis time of 5 minutes, a practical detection limit of 0.12 mg L�1 COD,
a RSD% value of 1.5% and a linear range of 0–300 mg L�1 were achieved. The TiO2/BDD electrode can
be an ideal sensor for online and in situ monitoring of organic pollutants in wastewaters.
1. Introduction
TiO2 has been widely used in the fields of water purification/
sterilisation,1 wastewater treatment2 and water quality moni-
toring,3 owing to its outstanding photocatalytic activity, excel-
lent chemical and photochemical stability, superior oxidation
ability, low cost, and environmentally friendly performance.
However, the quantum efficiency was still very low during the
photocatalytic processes mainly due to the fast recombination of
photoholes and photoelectrons generated under the illumination
of UV light. In order to enhance the oxidation efficiency of
photocatalysis at the TiO2 surface, TiO2 was immobilised or
grown on various conducting substrates, such as ITO4 and tita-
nium metals,5 to allow the application of potential, which was an
effective way to significantly diminish the recombination rates.
aEnvironmental Futures Centre and Griffith School of Environment, GoldCoast Campus, Griffith University, QLD, 4222, Australia. E-mail:[email protected]; Fax: +61-7-5552 8067; Tel: +61-7-5552 8155bInstitute of Physical Chemistry, Zhejiang Normal University, Jinhua,Zhejiang Province, 321004, P.R. ChinacQLD Micro- and Nanotechnology Centre, Nathan Campus, GriffithUniversity, QLD, 4111, Australia
† Electronic supplementary information (ESI) available: supportingimages. See DOI: 10.1039/c1ay05193h
This journal is ª The Royal Society of Chemistry 2011
It is well recognised that boron-doped diamond (BDD) is one
of the most promising electrode materials for this century.6–9 Due
to the characteristics of small background current, low noise
signals, wide potential window, high mechanical strength and
resilient corrosion resistance (even being anodic polarised in
acidic solutions),10–13 and a durable resistance to surface fouling
by impurities and long term response stability, BDD is widely
used as an electrode or electrode substrate combining with other
functional materials. Moreover, because BDD exhibits p-type
semiconductor characteristics,14 numerous attempts to prepare
TiO2/BDD heterojunction photoanode systems with n-type TiO2
have been successful.15–17 It was demonstrated that these heter-
ojunction electrodes possessed improved oxidation power to
organic compounds in wastewater.
Chemical oxygen demand (COD) is one of the most important
parameters and has been widely employed for water quality
assessment. The standard method (potassium dichromate
method) for COD determination involves a 2 hour hydrothermal
digestion process under high pressure and temperature. It also
requires the use of expensive (Ag2SO4), highly corrosive (H2SO4)
and toxic (Cr2O7� and HgSO4) reagents.18 Consequently, the
secondary pollution is unavoidable when the standard method is
employed.
Numerous electrochemical sensors such as copper electrode,19
Cu/CuO electrode,20 nano-PbO2 modified electrode,21 F-doped
Anal. Methods, 2011, 3, 2003–2009 | 2003

Publ
ishe
d on
01
Aug
ust 2
011.
Dow
nloa
ded
by I
mpe
rial
Col
lege
Lon
don
Lib
rary
on
21/0
5/20
13 0
4:54
:31.
View Article Online
PbO2 modified electrode,22 RhO3/Ti electrode,23 boron-doped
diamond electrode,24 and rotating Pt ring-Pt/PbO2 disc elec-
trode25 have been applied for the determination of COD. The
main advantages of electrochemical methods for COD analysis
were simplicity, short response time, wide linear range, low cost,
and the ease to be automated. However, insufficient oxidation
capability, instable background current of the electrodes and the
existence of persistent organic pollutants in wastewater lead to
problems of poor accuracy and reproducibility.
Recently, a very simple COD analytical method using TiO2
electrodes for the photoelectrocatalytic process, namely PeCOD,
was developed by our group.4,26,27 The PeCOD method can
effectively tackle the above problems of the standard method,
and in fact, it was also achieved by using other TiO2 electrodes,
such as TiO2/Ti electrodes.28 However, these electrodes still need
to be improved in terms of photocatalytic activity and stabilities
in acidic environments.16,29 The TiO2/BDD heterojunction pho-
toanode is a promising candidate to be used for this PeCOD
technology for online and in situ applications, where the
robustness of the sensor is an essential criterion.
In this work, TiO2/BDD electrodes were fabricated by dip-
coating a TiO2 layer onto BDD electrode surfaces and subsequent
calcination processes. The as prepared TiO2/BDD electrodes were
characterized using a series of materials characterisation, elec-
trical and electrochemical techniques. The photoelectrocatalytic
activity over the oxidation of various organic compounds was
measured and optimized in a photoelectrochemical thin-layer cell.
Under the optimized experimental conditions, the TiO2/BDD
electrodes were used to detect the COD concentration of
numerous synthetic and real samples to validate the suitability in
PeCOD application.
2. Experimental
2.1. Materials and chemicals
BDD electrodes with a resistivity of 0.1 U cm were purchased
from CSEM (Switzerland). Indium tin oxide (ITO) conducting
glass slides (8 U per square) were supplied by Delta Technologies
Limited. Titanium butoxide (97%, Aldrich), potassium hydrogen
phthalate (AR, Aldrich), D-glucose (99%, BDH), and sodium
nitrate (AR, Aldrich) were used as received. All other chemicals
used in this work were of analytical reagent and used as received
without further purification. All solutions were prepared using
high purity deionized water (>18 MU cm; Millipore Corp.).
2.2. Preparation of the TiO2/BDD electrodes
Aqueous TiO2 colloid was prepared by hydrolysis of titanium
butoxide according to the method described in our previous
work.30 Briefly, a mixture of 25 mL titanium butoxide and 8 mL
propan-2-ol was added, dropwise and at room temperature, to
300 mL of a 0.1 M nitric acid solution under vigorous stirring,
resulting in a slurry. The slurry was heated to 80 �C and stirred
vigorously for 10 h to achieve peptization. The resulting colloid
was then hydrothermally treated in an autoclave at 200 �C for 12
h. The colloidal suspension was then introduced into a rotary
evaporator and evaporated to a final solid concentration of ca.
6% w/v with particle sizes ranging from 8 to 10 nm. Carbowax
(30 wt% with respect to the mass of TiO2 solids) was added to
2004 | Anal. Methods, 2011, 3, 2003–2009
increase the porosity and reinforce the mechanical strength of the
TiO2 thin-film. The BDD electrode was pre-treated with aqua
regia and H2O2 solution at 70 �C, each for 30 min, and then
rinsed with distilled water to remove the surface oxides formed
during the acid pretreatment.31 After the pretreatment, the BDD
slides were dip-coated in the TiO2 colloidal solution with
a withdrawing speed of 2 mm s�1. The coated electrodes were
calcined at 450 �C in air for 0.5 h and 700 �C in Ar protective
atmosphere. For comparison, TiO2/ITO electrodes were fabri-
cated as a control using the same procedures except different
substrates.
2.3. Apparatus and measurements
2.3.1. Materials characterisation. The surface morphology of
the TiO2 samples was observed using SEM on the JEOL JSM-
6300 field emission scanning electron microscopy (FESEM,
Tokyo, Japan). X-Ray diffraction (XRD) spectra were performed
with a Philips PW1050 diffractometer using CuKa radiation.
2.3.2. Direct electrical measurement. The current density (J)
–voltage relationships of the TiO2/BDD electrodes were obtained
by using a Keithley 4200 Semiconductor Characterization System
and amicromanipulator station in air at room temperature (23 �C).
2.3.3. Photoelectrochemical characterization. Electro-
chemical experiments, i.e., linear scanning voltammetry (LSV),
cyclic voltammetry (CV) and chronoamperometry at
a controlled potential (+0.4 V vs. Ag/AgCl electrode), were
performed under UV illumination (6.6 mW cm�2 at 365 nm) at
the room temperature in a three-electrode photoelectrochemical
bulk cell with a quartz window for UV illumination (see
Fig. S1†).32 The working electrode surface area exposed to
solution was a circle with a diameter of 6 mm, which was the
photoelectrochemical reaction area. A Ag/AgCl reference elec-
trode and platinummesh were used as the reference and auxiliary
electrodes, respectively. Illumination was achieved with a 150 W
xenon arc lamp light source with quartz focusing lenses (HF-200
w-95). To minimize sample heating from the infrared fraction of
the light source, the beam was passed through an UV-band pass
filter (UG-5, Schott) prior to illuminating the electrode surface.
The light intensity was measured with a UV-irradiance meter
(UVA, Instruments of Beijing Normal University). A voltam-
mograph (CV-27, BAS) was used as a potentiostat for the elec-
trochemical measurements.
2.3.4. PeCOD measurement. The PeCOD measurements
were carried out in a photoelectrochemical thin-layer cell reactor
using a stopped-flow technique (see Fig. S2†).4 The volume of the
thin-layer reactor in this work was 2.4 mL, the applied potential
was +0.40 V and the intensity of the illumination was 6.6 mW
cm�2. In order to ensure sufficient conductivity in the thin-layer
electrochemical system, a certain amount of solid NaNO3
equivalent to 2 M was added to the tested samples.
2.4. Calculation of PeCOD values
The general equation for mineralization on a TiO2 electrode in
the thin-layer cell can be summarised as follows:4
This journal is ª The Royal Society of Chemistry 2011

Publ
ishe
d on
01
Aug
ust 2
011.
Dow
nloa
ded
by I
mpe
rial
Col
lege
Lon
don
Lib
rary
on
21/0
5/20
13 0
4:54
:31.
View Article Online
CyHmOjNkXq + (2y � j)H2O/ yCO2 + qX� + kNH3 + (4y � 2j
+ m � 3k)H+ + (4y � 2j + m � 3k � q)e� (1)
Where the elements are represented by their atomic symbols and
X represents a halogen atom, respectively. The stoichiometric
ratio of elements in the organic compound is represented by the
coefficients y, m, j, k and q. The oxidation number (n) in the
complete oxidation process is equal to 4y � 2j + m � 3k � q.
In a typical PeCOD analysis, typical photocurrent responses
of a blank solution containing 2.0 M NaNO3 (iblank, solid line)
and a sample solution containing 2.0 M NaNO3 and organic
compounds were recorded (as shown in Fig. S3†). Accordingly,
Qblank and Qtotal can be obtained by integration of photocur-
rents, iblank and itotal, with time, respectively. i.e.,
Qtotal ¼ðitotaldt (2)
Qblank ¼ðiblankdt (3)
The net charge, Qnet, originated from the oxidation of organic
compounds can be obtained by subtracting Qblank from Qtotal
(see the shaded area in Fig. S3†):
Qnet ¼ Qtotal � Qblank (4)
The net charge (Qnet) can be used to quantify the COD value of
sample according to the following equation:4
COD�mg L�1;O2
� ¼ Qnet
FV� 8000 (5)
where Qnet is the charge of oxidation of organics; F is the
Faraday constant; and V is the volume of solution, a constant for
a given thin-layer reactor.
Fig. 1 (a) SEM image and (b) cross-sectional SEM image of the TiO2/
BDD electrode; (c) XRD patterns of the TiO2/BDD electrode (curve 1),
TiO2/ITO electrode (curve 2) and the pure BDD electrode (curve 3); (d)
J–V plot of the BDD (curve 1) and TiO2/BDD (curve 2) electrodes in the
direct electric measurement.
3. Results and discussion
3.1. Structural characterisation
Anatase and rutile mixed-phase TiO2 electrodes illustrated
higher photocatalytic activities over the oxidation of organic
compounds than pure anatase TiO2 electrodes.33,34 The mixed-
phase TiO2 can be obtained by a calcination process at 700 �C in
air for 2 h. In order to prepare mixed-phase TiO2 on the BDD
substrate, the stability of the BDD electrode was firstly tested at
high temperatures (i.e., 450 �C and 700 �C) in air. The original
BDD has a distinguished crack-free and continuous surface
under SEM (see Fig. S4a†). The BDD surface remained intact
and did not have notable changes in surface morphology and
electrical conductivity after a calcination process at 450 �C in air
for 2 h. However, an incontinuous and corroded BDD surface
was observed under SEM (see Fig S4b†) and the electrical
conductivity was completely lost after the calcination treatment
at 700 �C in air for 0.5 h. These suggest that the BDD could be
damaged by the air at 700 �C. In order to protect the BDD
substrate, Ar atmosphere must be used to replace the oxidative
air. In practice, the dip-coated TiO2/BDD electrodes were cal-
cinated at 450 �C for 0.5 h in air to remove all the carbowax in the
thin film and achieve initial binding among TiO2 particles, and
subsequently sintered at 700 �C for 2 h in the Ar atmosphere.
This journal is ª The Royal Society of Chemistry 2011
Fig. 1a and b show the FESEM images of surface morphology
and cross-section of a typical as-prepared TiO2/BDD electrode,
respectively. Fig. 1a indicates that the TiO2 film was continuous
and uniform. The sizes of the TiO2 nanoparticles were in the
range of 10–20 nm. Fig. 1b suggests that the typical morphology
and nanostructure of BDD (in Fig. S4a†) were well maintained.
In other words, the BDD was not damaged by the above sin-
tering treatments and the aqua regia washing process. The rough
and uneven nanoscale structures are beneficial for the immobi-
lization of the TiO2 film.
XRD patterns were used to analyze the crystalline phase
composition of the TiO2/BDD and TiO2/ITO electrodes. Fig. 1c
shows the XRD patterns of the TiO2/BDD electrode (Curve 1),
the TiO2/ITO electrode (Curve 2) and the pure BDD electrode
(Curve 3) after the 700 �C calcination in Ar. The well-defined
diamond peak at 2q degree of ca. 44� for Curve 1 is almost
identical to that for Curve 3 in Fig. 1c, which further demon-
strates that the physicochemical properties of the BDD were
maintained through the above radical treatments. Another two
distinctive diffraction peaks at 2q degree of ca. 25.4� and 27.6�
for Curve 1 in Fig. 1c could be indexed to anatase-phase (JCPDS
No. 21-1272) and rutile-phase (JCPDS No. 21-1276), respec-
tively. The TiO2/BDD film contained 93% of anatase and 7% of
rutile, while the TiO2/ITO film had a similar ratio (92% of
anatase and 8% of rutile) according to the empirical relationship
used by Depero et al.35 It suggests that the difference of
substrates had no significant effect on the crystalline phase of
TiO2.
Electrical characterization can provide supporting evidence to
demonstrate the formation of the p–n heterojunction.36
Fig. 1d shows electrical current densities, J, recorded upon the
applied potentials after the BDD and the TiO2/BDD electrode
was tested on a micromanipulator manual probe station in the
dark individually. As shown in Fig. 1d, the excellent symmetric
Anal. Methods, 2011, 3, 2003–2009 | 2005

Publ
ishe
d on
01
Aug
ust 2
011.
Dow
nloa
ded
by I
mpe
rial
Col
lege
Lon
don
Lib
rary
on
21/0
5/20
13 0
4:54
:31.
View Article Online
J–V behaviour passing through the zero point indicated that the
contact between the silicon substrate and BDD was simply
ohmic-like contact.17 In strong contrast, a very small current was
observed in the reverse potential region (negative potential
region) while the current increased exponentially in the forward
potential region (positive potential region). In particular, the
reverse current density at �5 V is only 0.03 mA cm�2, while the
forward current density is 0.25 mA cm�2 at +5 V. This asym-
metric characteristic is dramatically different from the symmetric
ohmic-like behaviour of a common resistance mentioned above.
In fact, the asymmetric characteristic of the J–V curve in Fig. 1d
has a rectification ratio of ca. 10 which represents the distinct
diode-like behaviour of a typical p–n heterojunction.17 In this
heterojunction, the forward turn-on and reverse breakdown
voltages were ca. 0.5 and ca.�4 V, respectively. It is worth noting
that the substrate of the BDD is p-type monocrystalline silicon.
Hence, the p–n junction cannot form between the p-type silicon
substrate and p-type BDD. This suggests that the p–n hetero-
junction was established between the TiO2 and the BDD. It is
expected that this can effectively separate the photoelectron/hole
pairs generated under UV light illumination, and enhance the
quantum yield of TiO2 as a photocatalyst.17
3.2. Photoelectrochemical characterization
In order to achieve a maximum photocatalytic efficiency, the
photoelectrons need to be separated from the photoholes.
Application of a positive potential on the semiconductor was
proven to be an effective way to remove the electrons to the
external circuit and achieve this goal.30 However, a too positive
potential may lead to direct electrochemical reactions which will
distort the analytical signals and may even lead to false
measurement. In order to determine the optimal applied poten-
tial during the detection of COD, the effect of applied potential
on the photocurrent signals was first investigated by LSV. Fig. 2
shows the LSVs obtained at the TiO2/BDD electrode and TiO2/
ITO electrode in 0.1 M NaNO3 electrolyte solution containing
10.0 mM of glucose. A high concentration of glucose (10 mM)
was selected as a photohole scavenger to eliminate the influence
of mass transport.30 At both the electrodes, the dark current is
Fig. 2 Linear scanning voltammograms of the TiO2/BDD and TiO2/
ITO electrodes in 0.1 M NaNO3 solution containing 10.0 mM glucose at
a scanning rate of 5 mV s�1.
2006 | Anal. Methods, 2011, 3, 2003–2009
negligible, which suggests water and glucose cannot be directly
decomposed in the applied potential range (�0.5 to +0.65 V).
Under a given UV intensity, the photocurrent increased with the
increased potential before levelling off to a saturated photocur-
rent. Each voltammogram consists of two parts: the increasing
part (i.e. �0.5 to 0 V) and the saturation part (i.e. 0 to +0.65 V).
The increasing part suggests that electron transport in the TiO2/
BDD heterojunction electrodes was the reaction rate-limiting
process, which is similar to the response of a resistor under
varying potentials. The slopes of linear part for the TiO2/BDD
electrode obtained under the experimental conditions are higher
than that of the TiO2/ITO electrode. Therefore, though the
electrochemical resistance of BDD electrode is commonly higher
than that of ITO, the photoelectrochemical resistance of the
TiO2/BDD electrode is lower that that of TiO2/ITO, demon-
strating the high resistance of BDD did not affect the photo-
electrocatalytic activity. The saturated part implies that the
potential applied on the TiO2/BDD electrode was capable of
removing all the electrons generated in the photocatalytic process
at the TiO2 surface.
Typical saturated photocurrents at different electrodes could
be observed when the sweeping potential was greater than 0.0 V,
suggesting that the applied potential should be controlled over
0.0 V to maximize the photoelectrocatalytic efficiency of both
electrodes. Furthermore, the saturation photocurrent of the
TiO2/BDD heterojunction electrode was also higher than that of
TiO2/ITO, suggesting that the photoelectrocatalytic activities of
the TiO2/BDD electrode exceeded that of the TiO2/ITO elec-
trode. Therefore, to ensure a sufficient potential under various
conditions and, at the same time, to minimize the direct elec-
trochemical reaction, a potential of +0.40 V was selected for the
determination of COD.
3.3. Acidoresistance
The acidoresistance of a sensor could be a very important
property for water quality monitoring, especially for the indus-
trial wastewaters containing corrosive substance, such as acidic
pollutants or acidic matrix.37 Sensors based on ITO and Ti metal
substrate have a low acidoresistance due to their chemical nature
of oxide and metal, respectively. This limits their practical
application range and diminishes their reliabilities in online and/
or real time water quality monitoring. In contrast, BDD has an
excellent acid resistance29 evidenced by the fact the distinct BDD
surface was maintained after the aqua regia washing. Therefore,
BDD could be an ideal material to tackle this problem. The
endurability of the TiO2/BDD electrode in the acidic environ-
ment was investigated against the TiO2/ITO electrode.
Herein, both electrodes were polarized at a cyclic sweeping rate
of 5 mV s�1 from �0.5 to +0.65 V in a solution of pH ¼ 1 for 60
cycles. Two series of cyclic voltammograms were obtained and
the saturation photocurrents attained at +0.4 V after various
cycles were used to represent the stability of the electrodes as
shown in Fig. 3. It can be seen that the saturated photocurrent of
TiO2/ITO electrode sharply dropped with the increase of
potential scanning cycles, and reached nearly zero after 40
scanning cycles, indicating the complete loss in conductivity.
This could be visually confirmed by observing the peel-off of
TiO2 film away from the ITO substrate due to the dissolution of
This journal is ª The Royal Society of Chemistry 2011
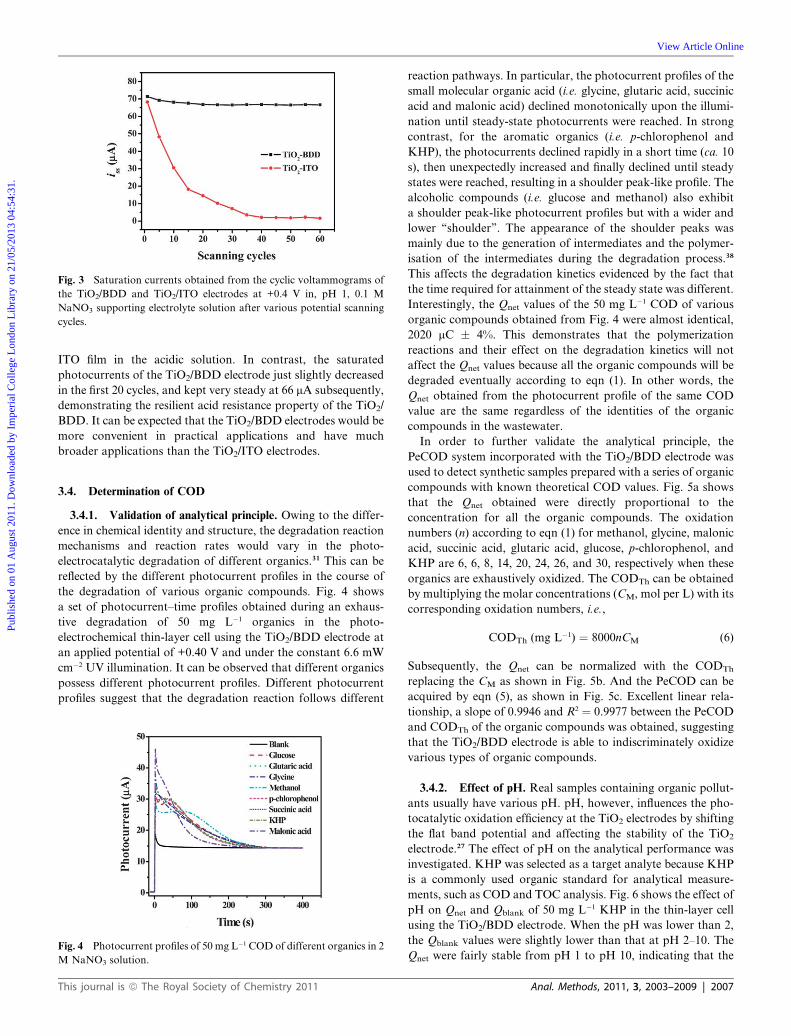
Fig. 3 Saturation currents obtained from the cyclic voltammograms of
the TiO2/BDD and TiO2/ITO electrodes at +0.4 V in, pH 1, 0.1 M
NaNO3 supporting electrolyte solution after various potential scanning
cycles.
Publ
ishe
d on
01
Aug
ust 2
011.
Dow
nloa
ded
by I
mpe
rial
Col
lege
Lon
don
Lib
rary
on
21/0
5/20
13 0
4:54
:31.
View Article Online
ITO film in the acidic solution. In contrast, the saturated
photocurrents of the TiO2/BDD electrode just slightly decreased
in the first 20 cycles, and kept very steady at 66 mA subsequently,
demonstrating the resilient acid resistance property of the TiO2/
BDD. It can be expected that the TiO2/BDD electrodes would be
more convenient in practical applications and have much
broader applications than the TiO2/ITO electrodes.
3.4. Determination of COD
3.4.1. Validation of analytical principle. Owing to the differ-
ence in chemical identity and structure, the degradation reaction
mechanisms and reaction rates would vary in the photo-
electrocatalytic degradation of different organics.31 This can be
reflected by the different photocurrent profiles in the course of
the degradation of various organic compounds. Fig. 4 shows
a set of photocurrent–time profiles obtained during an exhaus-
tive degradation of 50 mg L�1 organics in the photo-
electrochemical thin-layer cell using the TiO2/BDD electrode at
an applied potential of +0.40 V and under the constant 6.6 mW
cm�2 UV illumination. It can be observed that different organics
possess different photocurrent profiles. Different photocurrent
profiles suggest that the degradation reaction follows different
Fig. 4 Photocurrent profiles of 50 mg L�1 COD of different organics in 2
M NaNO3 solution.
This journal is ª The Royal Society of Chemistry 2011
reaction pathways. In particular, the photocurrent profiles of the
small molecular organic acid (i.e. glycine, glutaric acid, succinic
acid and malonic acid) declined monotonically upon the illumi-
nation until steady-state photocurrents were reached. In strong
contrast, for the aromatic organics (i.e. p-chlorophenol and
KHP), the photocurrents declined rapidly in a short time (ca. 10
s), then unexpectedly increased and finally declined until steady
states were reached, resulting in a shoulder peak-like profile. The
alcoholic compounds (i.e. glucose and methanol) also exhibit
a shoulder peak-like photocurrent profiles but with a wider and
lower ‘‘shoulder’’. The appearance of the shoulder peaks was
mainly due to the generation of intermediates and the polymer-
isation of the intermediates during the degradation process.38
This affects the degradation kinetics evidenced by the fact that
the time required for attainment of the steady state was different.
Interestingly, the Qnet values of the 50 mg L�1 COD of various
organic compounds obtained from Fig. 4 were almost identical,
2020 mC � 4%. This demonstrates that the polymerization
reactions and their effect on the degradation kinetics will not
affect the Qnet values because all the organic compounds will be
degraded eventually according to eqn (1). In other words, the
Qnet obtained from the photocurrent profile of the same COD
value are the same regardless of the identities of the organic
compounds in the wastewater.
In order to further validate the analytical principle, the
PeCOD system incorporated with the TiO2/BDD electrode was
used to detect synthetic samples prepared with a series of organic
compounds with known theoretical COD values. Fig. 5a shows
that the Qnet obtained were directly proportional to the
concentration for all the organic compounds. The oxidation
numbers (n) according to eqn (1) for methanol, glycine, malonic
acid, succinic acid, glutaric acid, glucose, p-chlorophenol, and
KHP are 6, 6, 8, 14, 20, 24, 26, and 30, respectively when these
organics are exhaustively oxidized. The CODTh can be obtained
by multiplying the molar concentrations (CM, mol per L) with its
corresponding oxidation numbers, i.e.,
CODTh (mg L�1) ¼ 8000nCM (6)
Subsequently, the Qnet can be normalized with the CODTh
replacing the CM as shown in Fig. 5b. And the PeCOD can be
acquired by eqn (5), as shown in Fig. 5c. Excellent linear rela-
tionship, a slope of 0.9946 and R2 ¼ 0.9977 between the PeCOD
and CODTh of the organic compounds was obtained, suggesting
that the TiO2/BDD electrode is able to indiscriminately oxidize
various types of organic compounds.
3.4.2. Effect of pH. Real samples containing organic pollut-
ants usually have various pH. pH, however, influences the pho-
tocatalytic oxidation efficiency at the TiO2 electrodes by shifting
the flat band potential and affecting the stability of the TiO2
electrode.27 The effect of pH on the analytical performance was
investigated. KHP was selected as a target analyte because KHP
is a commonly used organic standard for analytical measure-
ments, such as COD and TOC analysis. Fig. 6 shows the effect of
pH on Qnet and Qblank of 50 mg L�1 KHP in the thin-layer cell
using the TiO2/BDD electrode. When the pH was lower than 2,
the Qblank values were slightly lower than that at pH 2–10. The
Qnet were fairly stable from pH 1 to pH 10, indicating that the
Anal. Methods, 2011, 3, 2003–2009 | 2007
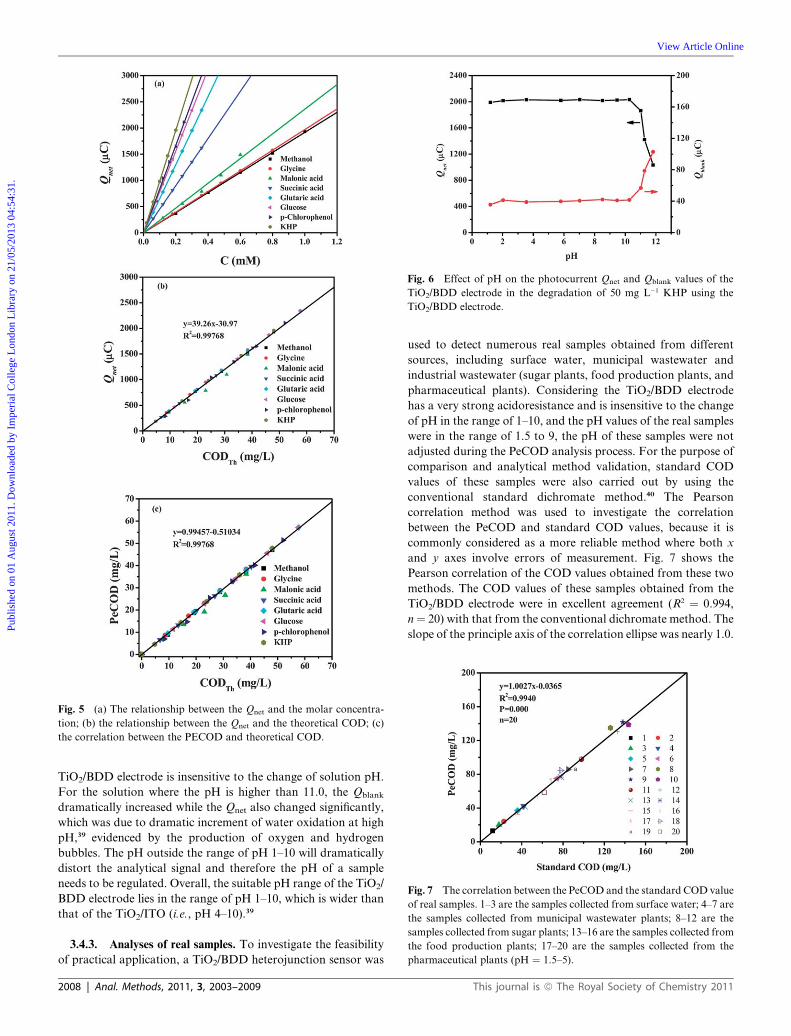
Fig. 5 (a) The relationship between the Qnet and the molar concentra-
tion; (b) the relationship between the Qnet and the theoretical COD; (c)
the correlation between the PECOD and theoretical COD.
Fig. 6 Effect of pH on the photocurrent Qnet and Qblank values of the
TiO2/BDD electrode in the degradation of 50 mg L�1 KHP using the
TiO2/BDD electrode.
Fig. 7 The correlation between the PeCOD and the standard COD value
of real samples. 1–3 are the samples collected from surface water; 4–7 are
the samples collected from municipal wastewater plants; 8–12 are the
samples collected from sugar plants; 13–16 are the samples collected from
the food production plants; 17–20 are the samples collected from the
pharmaceutical plants (pH ¼ 1.5–5).
Publ
ishe
d on
01
Aug
ust 2
011.
Dow
nloa
ded
by I
mpe
rial
Col
lege
Lon
don
Lib
rary
on
21/0
5/20
13 0
4:54
:31.
View Article Online
TiO2/BDD electrode is insensitive to the change of solution pH.
For the solution where the pH is higher than 11.0, the Qblank
dramatically increased while the Qnet also changed significantly,
which was due to dramatic increment of water oxidation at high
pH,39 evidenced by the production of oxygen and hydrogen
bubbles. The pH outside the range of pH 1–10 will dramatically
distort the analytical signal and therefore the pH of a sample
needs to be regulated. Overall, the suitable pH range of the TiO2/
BDD electrode lies in the range of pH 1–10, which is wider than
that of the TiO2/ITO (i.e., pH 4–10).39
3.4.3. Analyses of real samples. To investigate the feasibility
of practical application, a TiO2/BDD heterojunction sensor was
2008 | Anal. Methods, 2011, 3, 2003–2009
used to detect numerous real samples obtained from different
sources, including surface water, municipal wastewater and
industrial wastewater (sugar plants, food production plants, and
pharmaceutical plants). Considering the TiO2/BDD electrode
has a very strong acidoresistance and is insensitive to the change
of pH in the range of 1–10, and the pH values of the real samples
were in the range of 1.5 to 9, the pH of these samples were not
adjusted during the PeCOD analysis process. For the purpose of
comparison and analytical method validation, standard COD
values of these samples were also carried out by using the
conventional standard dichromate method.40 The Pearson
correlation method was used to investigate the correlation
between the PeCOD and standard COD values, because it is
commonly considered as a more reliable method where both x
and y axes involve errors of measurement. Fig. 7 shows the
Pearson correlation of the COD values obtained from these two
methods. The COD values of these samples obtained from the
TiO2/BDD electrode were in excellent agreement (R2 ¼ 0.994,
n¼ 20) with that from the conventional dichromate method. The
slope of the principle axis of the correlation ellipse was nearly 1.0.
This journal is ª The Royal Society of Chemistry 2011

Publ
ishe
d on
01
Aug
ust 2
011.
Dow
nloa
ded
by I
mpe
rial
Col
lege
Lon
don
Lib
rary
on
21/0
5/20
13 0
4:54
:31.
View Article Online
This confirms that the pH has an insignificant effect on the COD
value in the PeCOD measurement for these samples using the
TiO2/BDD electrode.
During the real sample analysis, it was observed that the
colour of the samples had insignificant effect on the accuracy of
the PeCOD measurement, this is probably because the change of
UV absorption is trivial due to the use of a thin-layer cell, and the
fact that the variation of UV absorption might affect the pho-
toelectrocatalytic oxidation rate but will not affect the overall
charge for the mineralization reaction.
The practical detection limit of 0.12 mg L�1 COD with a linear
range up to 300 mg L�1 COD can be achieved under the exper-
imental conditions employed using the TiO2/BDD hetero-
junction electrode. The TiO2/BDD electrode is very robust under
normal conditions. Stability experiments suggest that 95–105%
of the net charge for 50 mg L�1 COD glucose was maintained
after the electrode had been used continuously for 500
measurements in 2 months. The analytical results are highly
reproducible with a RSD% value of 1.5% for 11 measurements of
50 mg L�1 COD glucose.
Conclusions
The TiO2/BDD electrodes were prepared by dip-coating the TiO2
nanoparticles onto the BDD substrate and the subsequent
thermal treatments. The PeCOD system with TiO2/BDD elec-
trode has similar analytical performance (in terms of detection
limit, linear range, sensitivity and accuracy and precision) as the
previous works with TiO2/ITO electrodes. As a sensor, the TiO2/
BDD electrode has numerous advantages such as significantly
longer life time, wider application range (i.e., low pH samples),
low background current, strong acidoresistance and improved
photocatalytic activity in comparison with ITO and Ti electrode
substrates. The preliminary results in this work validate appli-
cability of the TiO2/BDD electrode to the PeCOD system using
synthetic and real samples, and demonstrated that the TiO2/
BDD electrode is an ideal sensor for determination of COD
values in wastewater in a rapid, sensitive and accurate fashion.
Acknowledgements
The authors acknowledge the financial support of the ARC
discovery and ARC Future fellowship from Australian Research
Council. And Yanhe Han thanks the financial support from the
Open Funds for Key Laboratory of Industrial Ecology and
Environmental Engineering, China Ministry of Education
(Dalian University of technology).
Notes and references
1 M. R. Hoffmann, S. T. Martin, W. Choi and D. W. Bahnemann,Chem. Rev., 1995, 95, 69–96.
2 N. Watanabe, S. Horikoshi, A. Kawasaki, H. Hidaka andN. Serpone, Environ. Sci. Technol., 2005, 39, 2320–2326.
3 Y. Li, X. Liu, H. Yuan and D. Xiao, Biosens. Bioelectron., 2009, 24,3706–3710.
This journal is ª The Royal Society of Chemistry 2011
4 H. Zhao, D. Jiang, S. Zhang, K. Catterall and R. John, Anal. Chem.,2004, 76, 155–160.
5 Y. Yang, X. Wang and L. Li, J. Am. Ceram. Soc., 2008, 91, 3086–3089.
6 X. Chen, G. Chen, F. Gao and L. Yue Po, Environ. Sci. Technol.,2003, 37, 5021–5026.
7 Y.-h. Cui, X.-y. Li and G. Chen, Water Res., 2009, 43, 1968–1976.8 L. Guo and G. Chen, J. Electrochem. Soc., 2007, 154, D657–D661.9 C. Batchelor-McAuley, C. E. Banks, A. O. Simm, T. G. J. Jones andR. G. Compton, Analyst, 2006, 131, 106–110.
10 K. B. Holt, A. J. Bard, Y. Show and G. M. Swain, J. Phys. Chem. B,2004, 108, 15117–15127.
11 N. Mitani and Y. Einaga, J. Electroanal. Chem., 2009, 626, 156–160.12 W. C. Poh, K. P. Loh, W. D. Zhang, S. Triparthy, J.-S. Ye and
F.-S. Sheu, Langmuir, 2004, 20, 5484–5492.13 I. Sir�es, E. Brillas, G. Cerisola and M. Panizza, J. Electroanal. Chem.,
2008, 613, 151–159.14 R. Kalish, Carbon, 1999, 37, 781–785.15 A. Manivannan, N. Spataru, K. Arihara and A. Fujishima,
Electrochem. Solid-State Lett., 2005, 8, C138–C140.16 J. Qu and X. Zhao, Environ. Sci. Technol., 2008, 42, 4934–4939.17 H. Yu, S. Chen, X. Quan, H. Zhao and Y. Zhang, Environ. Sci.
Technol., 2008, 42, 3791–3796.18 A. P. H. Association, A. W. W. Association and W. E. Federation,
Apha-Awwa-Wef, Washington, D.C., 19th edn, 1995.19 K.-H. Lee, T. Ishikawa, S. J. McNiven, Y. Nomura, A. Hiratsuka,
S. Sasaki, Y. Arikawa and I. Karube, Anal. Chim. Acta, 1999, 398,161–171.
20 C. Silva, C. D. C. Conceicao, V. Bonifacio, O. Fatibello andM. Teixeira, J. Solid State Electrochem., 2009, 13, 665–669.
21 S. Ai, M. Gao, Y. Yang, J. Li and L. Jin, Electroanalysis, 2004, 16,404–409.
22 J. Li, L. Li, L. Zheng, Y. Xian, S. Ai and L. Jin, Anal. Chim. Acta,2005, 548, 199–204.
23 J. Q. Li, L. P. Li, L. Zheng, Y. Z. Xian and L. T. Jin, Meas. Sci.Technol., 2006, 17, 1995–2000.
24 H. Yu, H. Wang, X. Quan, S. Chen and Y. Zhang, Electrochem.Commun., 2007, 9, 2280–2285.
25 P. Westbroek and E. Temmerman, Anal. Chim. Acta, 2001, 437, 95–105.
26 S. Zhang, D. Jiang and H. Zhao, Environ. Sci. Technol., 2006, 40,2363–2368.
27 S. Zhang, H. Zhao, D. Jiang and R. John, Anal. Chim. Acta, 2004,514, 89–97.
28 J. Zhang, B. Zhou, Q. Zheng, J. Li, J. Bai, Y. Liu and W. Cai, WaterRes., 2009, 43, 1986–1992.
29 J. Stotter, Y. Show, S. Wang and G. Swain, Chem. Mater., 2005, 17,4880–4888.
30 D. Jiang, H. Zhao, S. Zhang and R. John, J. Phys. Chem. B, 2003,107, 12774–12780.
31 Y. Han, S. Zhang, H. Zhao, W. Wen, H. Zhang, H. Wang andF. Peng, Langmuir, 2010, 26, 6033–6040.
32 W. Wen, H. Zhao and S. Zhang, J. Phys. Chem. C, 2009, 113, 10830–10832.
33 D. Jiang, S. Zhang andH. Zhao,Environ. Sci. Technol., 2007, 41, 303–308.
34 Y. Zhang, J. Chen and X. Li, Catal. Lett., 2010, 139, 129–133.35 L. E. Depero, L. Sangaletti, B. Allieri, E. Bontempi, R. Salari,
M. Zocchi, C. Casale and M. Notaro, J. Mater. Res., 1998, 13,1644–1649.
36 J. Yuan, H. Li, S. Gao, Y. Lin and H. Li, Chem. Commun., 2010, 46,3119–3121.
37 G. Capar, L. Yilmaz andU. Yetis, J.Membr. Sci., 2006, 281, 560–569.38 D. S. Muggli, J. T. McCue and J. L. Falconer, J. Catal., 1998, 173,
470–483.39 S. Zhang, L. Li, H. Zhao and G. Li, Sens. Actuators, B, 2009, 141,
634–640.40 Q. Zheng, B. Zhou, J. Bai, L. Li, Z. Jin, J. Zhang, J. Li, Y. Liu, W. Cai
and X. Zhu, Adv. Mater. (Weinheim, Ger.), 2008, 20, 1044–1049.
Anal. Methods, 2011, 3, 2003–2009 | 2009