Embed Size (px)
Citation preview
1
Supplementary Information for Chemical Communications
Robust scalable synthesis of a bis-urea derivative forming thixotropic
and cytocompatible supramolecular hydrogels
Laurens A. J. Rutgeerts,a‡ Al Halifa Soultan,a,b,c,1‡ Ramesh Subramani,d,2 Burak Toprakhisar,b,e
Herman Ramon,d Monissa C. Paderes,a,3 Wim M. De Borggraevea* and Jennifer Pattersonb,c,f*
a. Department of Chemistry, KU Leuven, 3001 Leuven, Belgium
b. Department of Materials Engineering, KU Leuven, 3001 Leuven, Belgium
c. Prometheus, KU Leuven, 3000 Leuven, Belgium
d. Department of Biosystems, KU Leuven, 3001 Leuven, Belgium
e. Stem Cell Institute, KU Leuven, 3000 Leuven, Belgium
f. Department of Imaging & Pathology, KU Leuven, 3000 Leuven, Belgium ‡These authors contributed equally to this work. *Corresponding authors. E-mail addresses: [email protected] (Jennifer
Patterson); [email protected] (Wim De Borggraeve)
Present Affiliations: 1 Department of Chemistry, Université du Québec à Montréal, Montreal, Canada 2 Department of Food Processing Technology and Management, PSGR Krishnammal College for
Women, Peelamedu, India 3 Institute of Chemistry, University of the Philippines, Diliman, Philippines
Electronic Supplementary Material (ESI) for ChemComm.This journal is © The Royal Society of Chemistry 2019

2
Supplementary Methods
Materials. 1,3-bis(isocyanatomethyl)benzene, > 98.0 % (B), was purchased from TCI. 3-
(aminomethyl)pyridine, 99+ % (A1); 2-(aminomethyl)pyridine, 99 % (A0); 4-
(aminomethyl)pyridine, 98 % (A2); and dichloromethane (DCM), 99.8 %, Extra Dry stored over
Molecular Sieves, Stabilized, AcroSeal™ were purchased from ACROS Organics. Deuterium
oxide (D2O) and dimethyl sulfoxide-d6 (DMSO-d6) were purchased from Sigma Aldrich.
Instrumentation for synthesis and chemical characterization. Ball milling experiments were
performed using a Planetary Micro Mill, PULVERISETTE 7 premium line (Fritsch), equipped
with a set of zirconium oxide grinding bowls (80 mL) filled with zirconium oxide grinding balls
(10 mm). 1H NMR and 13C NMR spectra were recorded on a Bruker Avance 400 spectrometer
operating at 400 MHz and 100 MHz for the respective nuclei or on a Bruker Avance 600
spectrometer operating at 600 MHz and 150 MHz for the respective nuclei. Chemical shifts are
given in ppm (δ) values relative to tetramethylsilane (TMS) or the residual solvent peak. The
spectra were analyzed using ACD/Spectrus Processor 2016.1.1 (Advanced Chemistry
Development, Inc.). Fourier transform infrared (FTIR) spectra were recorded on a Bruker alpha-P
FTIR spectrometer using OPUS 7.5: Build 7,5,18 (20140810) software (Bruker Optik GmbH).
The spectra were analyzed using ACD/Spectrus Processor 2016.1.1 (Advanced Chemistry
Development, Inc.). Differential Scanning Calorimetry (DSC) measurements were recorded using
a Mettler-Toledo DSC 822e under helium atmosphere from 25 °C to 250 °C with a heating rate of
10 °C/min. Mass spectrometry (MS) was performed using a Thermo Electron LCQ Advantage
apparatus (Thermo Scientific) equipped with an Agilent 1100 pump and injection system (Agilent
Technologies). Spectra were acquired using a quadrupole orthogonal acceleration time-of-flight
mass spectrometer Synapt G2 HDMS (Waters). Samples were infused at 3 µL/min, and spectra

3
were obtained in positive ionization mode with a resolution of 15000 (FWHM) using leucine
encephalin as lock mass. Data were analyzed using Xcalibur software (Thermo Fisher Scientific
Inc.).
Synthesis of bis-urea compound meta-C (1,1'-(1,3-phenylenebis(methylene))bis(3-(pyridin-3-
ylmethyl)urea)) in solution. A flame dried two-neck flask was charged with dry dichloromethane
(DCM) and 1,3-bis(isocyanatomethyl)benzene (m-xylylene diisocyanate, B in text) (1 g; 5.31
mmol) under nitrogen atmosphere. Pyridin-3-ylmethanamine (3-picolylamine, A1 in text) (1.149
g; 10.63 mmol) was added dropwise while stirring. The mixture was allowed to stir for 1 h at room
temperature. The product was filtered off as a white precipitate, washed with DCM, and dried
under vacuum. 1,1'-(1,3-phenylenebis(methylene))bis(3-(pyridin-3-ylmethyl)urea) (meta-C in
text) was obtained in quantitative yield. The compound was characterized with 1H NMR (Fig.
S1a), 13C NMR (Fig. S1b), FTIR (Fig. S1c), DSC (melting point, Tm), and MS (ESI).
1H NMR (400 MHz, DMSO-d6) δ = 4.20 (d, J = 6.02 Hz, 4H), 4.25 (d, J = 6.02 Hz, 4H), 6.45 -
6.58 (m, 4 H), 7.08 - 7.14 (m, 3 H), 7.21 - 7.27 (m, 1 H), 7.34 (dd, J = 7.63, 4.88 Hz, 2 H), 7.65
(br d, J = 7.78 Hz, 2 H), 8.41 - 8.49 (m, 4 H)
13C NMR (100 MHz, DMSO-d6) δ = 40.7, 43.0, 123.4, 125.3, 125.7, 128.2, 134.8, 136.4, 140.8,
147.9, 148.6, 158.1
FTIR (cm-1): ν = 3319 (N-H stretch); 1609 (C=O stretch); 1565 (N-H bend)
Tm: 198 °C
MS (ESI) m/z: Calculated mass for C22H24N6O2: 404.20; Found mass: 405.1 [M+H]+
4
Solvent-free synthesis of meta-C using a planetary ball mill. Two grinding bowls (volume: 80
mL, zirconium oxide) were each charged with 25 balls (diameter: 10 mm, zirconium oxide) to
obtain a 32 % filling ratio. 1,3-bis(isocyanatomethyl)benzene (m-xylylene diisocyanate, B in text)
(0.500 g; 2.66 mmol) and pyridin-3-ylmethanamine (3-picolylamine, A1 in text) (0.575 g; 5.31
mmol) were added to each bowl. Both bowls were closed and inserted in the planetary ball mill,
which was operated at a rotational speed of 600 revolutions per minute (rpm) for the main disk
(1200 rpm as the relative rotational speed for each grinding bowl) for 2 min. The product (1,1'-
(1,3-phenylenebis(methylene))bis(3-(pyridin-3-ylmethyl)urea) (meta-C in text) was recovered
from the grinding bowls as a solid. Quantitative conversion was confirmed via FTIR (Fig. S2).
Synthesis of bis-urea compound para-C (1,1'-(1,3-phenylenebis(methylene))bis(3-(pyridin-4-
ylmethyl)urea)). A flame dried two-neck flask was charged with dry DCM and 1,3-
bis(isocyanatomethyl)benzene (m-xylylene diisocyanate, B in text) (1 g; 5.31 mmol) under
nitrogen atmosphere. Pyridin-4-ylmethanamine (4-picolylamine, A2 in text) (1.149 g; 10.63 mmol)
was added dropwise while stirring. The mixture was allowed to stir for 1 h at room temperature.
The product was filtered off as a precipitate, washed with DCM, and dried under vacuum. 1,1'-
(1,3-phenylenebis(methylene))bis(3-(pyridin-4-ylmethyl)urea) (para-C in text) was obtained at
quantitative yield. The compound was characterized with 1H NMR (Fig. S3a), 13C NMR (Fig.
S3b), FTIR (Fig. S3c), DSC (Tm), and MS (ESI).
1H NMR (400 MHz, DMSO-d6) δ = 4.22 (d, J = 6.02 Hz, 4H), 4.25 (d, J = 6.02 Hz), 6.51 - 6.64
(m, 4 H), 7.09 - 7.18 (m, 3 H), 7.18 - 7.30 (m, 5 H), 8.48 (d, J = 5.80 Hz, 4 H)
13C NMR (100 MHz, DMSO-d6) δ = 42.2, 43.2, 122.1, 125.5, 125.9, 128.4, 141.0, 149.6, 150.3,
158.2

5
FTIR (cm-1): ν = 3315 (s, N-H stretch); 1623 (C=O stretch); 1577 (N-H bend)
Tm: 191 °C
MS (ESI) m/z: Calculated mass for C22H24N6O2: 404.20; Found mass: 405.1 [M+H]+
Synthesis of bis-urea compound ortho-C (1,1'-(1,3-phenylenebis(methylene))bis(3-(pyridin-
2-ylmethyl)urea)). A flame dried two-neck flask was charged with dry DCM and 1,3-
bis(isocyanatomethyl)benzene (m-xylylene diisocyanate, B in text) (1 g; 5.31 mmol) under
nitrogen atmosphere. Pyridin-2-ylmethanamine (2-picolylamine, A0 in text) (1.149 g; 10.63 mmol)
was added dropwise while stirring. The mixture was allowed to stir for 1 h at room temperature.
The product was filtered off as a precipitate, washed with DCM, and dried under vacuum. 1,1'-
(1,3-phenylenebis(methylene))bis(3-(pyridin-2-ylmethyl)urea) (ortho-C in text) was obtained at
quantitative yield. The compound was characterized with 1H NMR (Fig. S4a), 13C NMR (Fig.
S4b), FTIR (Fig. S4c), DSC (Tm), and MS (ESI).
1H NMR (600 MHz, DMSO-d6) δ = 4.23 (d, J=6.05 Hz, 4 H), 4.33 (d, J=5.87 Hz, 4 H), 6.43 (br t,
J=5.50 Hz, 2 H), 6.48 (br t, J=5.59 Hz, 2 H), 7.13 (d, J=7.52 Hz, 3 H), 7.13 - 7.26 (m, 5 H), 7.72
(td, J=7.61, 1.65 Hz, 2 H), 8.48 (br d, J=4.59 Hz, 2 H)
13C NMR (150 MHz, DMSO-d6) δ = 42.9, 44.8, 120.7, 121.5, 125.1, 125.6, 127.8, 136.2, 140.5,
148.4, 157.8, 159.4
FTIR (cm-1): ν = 3308 (N-H stretch); 1621 (C=O stretch); 1568 (N-H bend)
Tm: 117 °C
MS (ESI) m/z: Calculated mass for C22H24N6O2: 404.20; Found mass: 405.0 [M+H]+

6
Gelation procedures. To form 0.8 wt.% or 1 wt.% hydrogels, a screw capped vial was filled with
meta-C (8 mg or 10 mg, respectively) and 1 mL of deionized water, phosphate buffered saline
(PBS), Dulbecco’s Modified Eagle’s Medium (DMEM), or growth medium. The solid was
dispersed by sonicating the vial in a CPX2800H-E ultrasonic bath (Branson) and then heated in a
copper block at 100 °C until complete dissolution. The solution was sonicated using a UP50H
Ultrasonic processor with MS1 tip (Hielscher) operating at 30 KHz (P = 0.075 W) while cooling
down to room temperature to form the hydrogels (Supplementary Movie 1, ESI†).
Scanning Electron Microscopy (SEM) measurements. A screw capped vial was charged with 8
mg of compound and 1 mL of H2O (MilliQ). The solid was dispersed by sonicating the vial in a
CPX2800H-E ultrasonic bath, and the vial was heated to 100 °C until the compound dissolved.
Next, the solution was allowed to cool to room temperature under sonication using a Hielscher
UP50H Ultrasonic processor with MS1 tip operating at P = 0.075 W. When at room temperature,
the vial was submerged into liquid nitrogen to freeze the sample completely. The frozen sample
was lyophilized to obtain either a xerogel from meta-C or a dried precipitate from ortho-C and
para-C. This solid was placed on carbon tape attached to a SEM sample holder and coated with
Pd/Pt or Pt using a high-resolution Quorum Sputter coater (Q150T S). The coated sample was
placed under high vacuum overnight prior to imaging. The SEM images were acquired using a
SEM XL 30 FEG (Philips) with the following imaging parameters: Acc.V = 10.0kV; Spot = 3.0;
Magn. = 5000x/20000x/5000x (for Fig. 3a, b, c, respectively); Det. = SE; WD = 7.2/7.3/7.2 (for
Fig. 3a, b, c, respectively); Exp. = 1.
Atomic Force Microscopy (AFM) measurements. Hydrogels of meta-C were prepared at 0.8
wt.% in deionized water or growth medium as described above. 100 µL of the hydrogels were
further diluted in 1 mL of deionized water, and the suspension was sonicated using a Hielscher

7
UP50H Ultrasonic processor with MS1 tip to disperse the hydrogel in the water. The samples (20
µL) were deposited on freshly cleaved mica plates, dried, and imaged using a JPK Nanowizard®
III Bioscope in contact mode (Probe: NSC35/Al BS; spring constant = 16 N/m; tip radius ~ 8 nm;
rectangular geometry with a length of 90 µm, width of 35 µm, and thickness of 2 µm). All of the
recorded AFM images consisted of either 512 x 512 or 1024 x 1024 pixels with XY scan size
varying from 1 x 1 µm2 to 10 x 10 µm2. AFM images were obtained at multiple locations across
the surface of 3 sample preparations to ensure the reproducibility of the results. Bundled or
crossing nanofibrils as well as nanofibrils that appeared fragmented were excluded from the width
and height analysis. Line profile analysis was performed on the nanofibrils/nanofibers randomly,
and the height and width values were calculated as shown in Fig. S5. Width determination of the
individual nanofibrils might not reflect the actual width of the nanofibrils because the width
measurement is dependent on the size and shape of the AFM tip,1 and therefore the reported width
values of the nanofibrils should only be compared relative to each other. For the height and width
correlation, nanofibrils/nanofibers were binned based on height measurements, in increments of 2
nm. Nanofibrils with 0 - 1.9 nm height were the first group, nanofibrils with 2 - 3.9 nm height were
the second group, nanofibrils with 4 - 5.9 nm were the third group, and so on. A linear fit through
the measured data was made.
Variable-Temperature (VT) NMR measurements. A screw capped vial was charged with 8 mg
of meta-C, 0.9 mL of H2O, and 0.1 mL of D2O, and the solid was dispersed by sonicating the vial
in an ultrasound bath. The vial was heated in a copper block at 100 °C until a clear solution was
obtained. The solution was pipetted from the vial using a preheated Pasteur pipet and transferred
to a preheated NMR tube. 3-(Trimethylsilyl)propionic-2,2,3,3-d4 acid sodium salt dissolved in
D2O (3 mM), as an external standard, was placed in an insert tube inside the NMR tube, after

8
which the tubes were sonicated in an ultrasonic bath while cooling to induce gelation. VT 1H NMR
spectra were recorded on a Bruker Avance 600 spectrometer operating at 600 MHz. Spectra were
acquired at 30 °C, 40 °C, 50 °C, 60 °C, 70 °C, 80 °C, and 90 °C.
Rheology measurements. Cylindrical hydrogels were prepared using a plastic syringe and
measured on a MCR 501 Rheometer (Anton-Paar). Samples were prepared via the following
procedure. A screw capped vial was charged with 8 mg of meta-C and 1 mL of growth medium.
The vial was sonicated until the gelator was dispersed over the liquid and subsequently heated at
100 °C until the gelator dissolved. The supersaturated solution was poured into a syringe with a
cut off tip (Fig. S6). The solution was allowed to cool to room temperature under sonication using
a Hielscher UP50H Ultrasonic processor with MS1 tip operating at P = 0.075 W. The hydrogels
were stored overnight at 6.7 °C. A slice of the hydrogel was placed on the rheometer surface. The
rheometer probe (8 mm diameter) was lowered to 1.5 mm, and the excess hydrogel was trimmed.
The final sample volume was 75 mm3.
Strain sweep measurements were performed by varying the applied strain between 0.01 and 10 %
at a constant angular frequency of 6.28 rad/s and a constant temperature of 37 °C. Frequency sweep
measurements were performed by varying the angular frequency between 10 and 0.1 rad/s at a
constant strain of 0.08 % and a constant temperature of 37 °C. A first dynamic strain amplitude
test was performed by systematically applying a strain of 10 % on the sample for 30 s followed by
a strain of 0.08 % for period of 5 min, to let the hydrogel recover. During the measurement, the
temperature was kept constant at 37 °C, and the angular frequency was kept constant at 6.28 rad/s.
A second dynamic strain amplitude test was performed by systematically applying a strain of 100
% on the sample for 60 s followed by a strain of 0.08 % for period of 100 s, to let the hydrogel
recover. During the measurement, the temperature was kept constant at 37 °C, and the angular

9
frequency was kept constant at 6.28 rad/s. Data processing of the rheological measurements was
performed using GraphPad Prism 7.05 to obtain the average and standard deviation of three sets
of data.
Cell culture. L929 fibroblasts (mouse C3H/AN connective tissue, Sigma Aldrich) at passage 7
were cultured in standard tissue culture flasks at 37 °C in humidified air mixed with 5 % CO2 in a
growth medium consisting of DMEM (Invitrogen) mixed with 10 % fetal bovine serum (FBS;
Invitrogen) and 1 % antibiotics (Invitrogen). Cells were subcultured when they reached about 75
% confluence, and the medium was changed every 3 d.
Cell encapsulation. Since the gelation procedure requires heating the sample to 100 °C to dissolve
meta-C followed by sonicating the solution while cooling, hydrogels were prepared first and then
mixed with a cell suspension to encapsulate the cells for culture in 3D in the hydrogels. This was
possible because of the shear thinning and self-healing properties of the hydrogel. In this case,
meta-C was first introduced into a glass vial and sterilized under UV light for 20 min. Then, sterile
growth medium (DMEM with 10 % FBS and antibiotics) was added, and hydrogels at 1 wt.% were
prepared as previously described. L929 fibroblasts at passage 8 were trypsinized using trypsin-
EDTA (0.25 % with phenol red, Thermo Fisher Scientific) and resuspended in growth medium.
Cells were stained with trypan blue, and the viable cell concentration was determined using a
hemocytometer (Bruker). A concentrated cell suspension (200 µL), to achieve a final seeding
density of 1.2 x 10⁶ cells/mL, was then mixed with the hydrogels (800 µL), to achieve a final
concentration of 0.8 wt.% meta-C, using a syringe. The hydrogels containing cells, each 1 mL in
volume, were transferred to standard tissue culture-treated well plates for the proliferation and
viability assays or to glass bottom well plates for imaging of cell morphology. The well plates
were then incubated for 48 h in an incubator at 37 °C with humidified air mixed with 5 % CO2.

10
Evaluation of cell morphology. At selected time points (2 h, 24 h, and 48 h), the hydrogels (in
duplicate) were washed with PBS, and the cells were fixed and permeabilized with a
paraformaldehyde (PFA)/Triton X-100 solution (4 % PFA + 0.2 % Triton X-100 in PBS) for 40
min at room temperature. The PFA solution was then removed, and glycine (0.1 M) was added for
15 min at room temperature. The glycine solution was removed, and the hydrogels containing cells
were washed 2 times with PBS and stained with AlexaFluor 488 phalloidin (2 U/mL in PBS) and
DAPI (2.5 µg/mL) for 2 h. The hydrogels were then washed 2 times with PBS. Z-stacked confocal
images of the stained cells were acquired using a Zeiss LSM 780 confocal microscope with 488
nm and 405 nm laser lines for AlexaFluor 488 phalloidin and DAPI excitation, respectively. For
the widefield images, a 25× water immersion lens (0.8 N.A.) was used for scanning a depth of 100
µm with a 5 µm step size. The magnified inset images were acquired using a 63× water immersion
lens (1.15 N.A.) and step size of ~ 0.8 µm. Images were analyzed using ImageJ (NIH), and the
circularity was calculated as the ratio between minor and major axes within the perimeter of the
F-actin (or nuclear) signal for each cell, with 1 indicating a perfect circle.
Cell proliferation and viability assays. At each time point (2 h, 24 h, and 48 h), 1 mL of
additional growth medium was added into the wells (4 replicates) and gently mixed with the
hydrogels to disrupt the hydrogel and disperse the cells. The harvested cells were then stained with
trypan blue and counted using a hemocytometer. The number of live and dead cells was recorded,
and the data were processed using GraphPad Prism 5 software.
Statistical analysis. Data for cell proliferation, viability, and circularity were analyzed by
calculating the mean and standard deviation of n = 4 or 5, as indicated in the figure captions. A
one-way ANOVA with Bonferroni's multiple comparisons test was used to assess the effect of
time with p < 0.05 considered to indicate statistical significance (GraphPad Prism 5).

11
Supplementary Movies
Supplementary Movie 1: Gel preparation procedure. First, 1 mL of growth medium is added
to a vial containing 8 mg of meta-C. Second, the vial is heated in a copper block at 100 °C until
the gelator is fully dissolved. Next, the vial is opened, and the solution is sonicated using a UP50H
Ultrasonic processor with MS1 tip operating at 30 KHz (P = 0.075 W). While cooling down to
room temperature, the gel forms. Finally, the vial is capped and inverted to confirm gelation.
Supplementary Movie 2: Illustration of the injectability of the hydrogel. A 0.8 wt.% hydrogel
made with growth medium is pushed through a syringe equipped with a needle (0.90 mm in
diameter). The gel flows when stress is applied and restores at the surface of the container, after
which the container is inverted to demonstrate the gel state.
12
Supplementary Figures
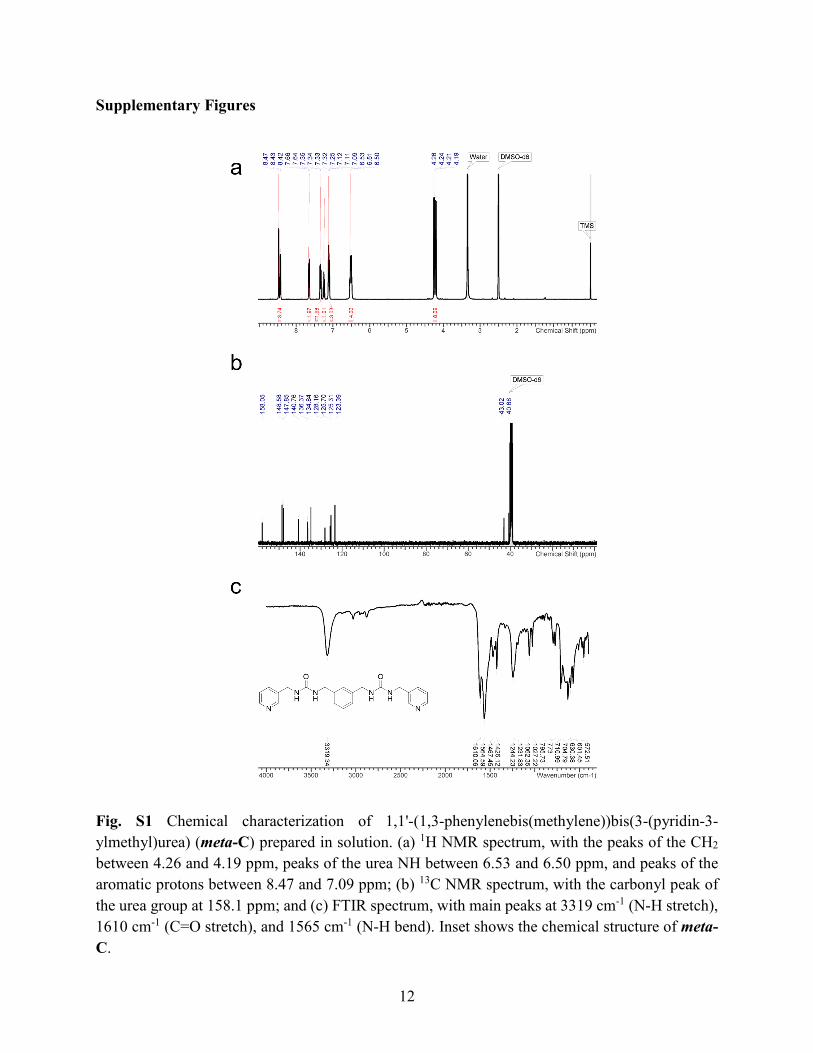
Fig. S1 Chemical characterization of 1,1'-(1,3-phenylenebis(methylene))bis(3-(pyridin-3-ylmethyl)urea) (meta-C) prepared in solution. (a) 1H NMR spectrum, with the peaks of the CH2
between 4.26 and 4.19 ppm, peaks of the urea NH between 6.53 and 6.50 ppm, and peaks of the aromatic protons between 8.47 and 7.09 ppm; (b) 13C NMR spectrum, with the carbonyl peak of the urea group at 158.1 ppm; and (c) FTIR spectrum, with main peaks at 3319 cm-1 (N-H stretch), 1610 cm-1 (C=O stretch), and 1565 cm-1 (N-H bend). Inset shows the chemical structure of meta-C.

13
Fig. S2 FTIR spectra showing the conversion of the starting material into meta-C via the ball milling method. (a) FTIR spectrum of 1,3-bis(isocyanatomethyl)benzene (m-xylylene diisocyanate, B in text) with a peak at 2242 cm-1, indicating the presence of an isocyanate functional group. (b) FTIR spectrum of 1,1'-(1,3-phenylenebis(methylene))bis(3-(pyridin-3-ylmethyl)urea) (meta-C) where the peak at 2242 cm-1 has disappeared, indicating full conversion of the starting material.

14
Fig. S3 Chemical characterization of 1,1'-(1,3-phenylenebis(methylene))bis(3-(pyridin-4-ylmethyl)urea) (para-C). (a) 1H NMR spectrum, with the peaks of the CH2 between 4.26 and 4.21 ppm, peaks of the urea NH between 6.59 and 6.55 ppm, and peaks of the aromatic protons between 8.49 and 7.11 ppm; (b) 13C NMR spectrum, with the carbonyl peak of the urea group at 158.3 ppm; and (c) FTIR spectrum, with main peaks at 3319 cm-1 (N-H stretch), 1622 cm-1 (C=O stretch), and 1579 cm-1 (N-H bend). Inset shows the chemical structure of para-C.

15
Fig. S4 Chemical characterization of 1,1'-(1,3-phenylenebis(methylene))bis(3-(pyridin-2-ylmethyl)urea) (ortho-C). (a) 1H NMR spectrum, with the peaks of the CH2 between 4.34 and 4.22 ppm, peaks of the urea NH between 6.49 and 6.42 ppm, and peaks of the aromatic protons between 8.48 and 7.12 ppm; (b) 13C NMR spectrum, with the carbonyl peak of the urea group at 159.4 ppm; and (c) FTIR spectrum, with main peaks at 3313 cm-1 (N-H stretch), 1620 cm-1 (C=O stretch), and 1567 cm-1 (N-H bend). Inset shows the chemical structure of ortho-C.

16
Fig. S5 Detailed AFM structural analysis. (a) Height and width correlation of measured individual nanofibrils of meta-C (n = 169). Nanofibrils were grouped based on height measurements with a bin size of 2 nm. Average height and width of the corresponding groups are shown (whiskers indicate standard deviation). The dotted line indicates a linear fit through the measured data, R2 > 0.7. (b) An example AFM image of meta-C showing nanofibril stacking/thinning on top of other nanofibrils (indicated by white arrow mark). Scale bar is 500 nm, and Z-scale bar is 0-10 nm. (c) An example AFM image of meta-C showing nanofibril splitting (indicated by white arrow marks). Scale bar is 500 nm, and Z-scale bar is 0-10 nm. (d) Line profile measurement of AFM width and height analysis of the nanofibril of meta-C shown in (e) (measured location indicated by red line with yellow arrow marks to indicate the measured width). Scale bar is 100 nm, and Z-scale bar is 0-10 nm. (f) AFM image showing the formation of nanofibrils/nanofibers of meta-C in growth medium. Scale bar is 2 µm, and Z-scale bar is 0-60 nm.

17
Fig. S6 Sample preparation for rheology, rheology graphs with error bars, and additional rheology graphs. (a) The hydrogel (0.8 wt.% meta-C in growth medium) was prepared in a syringe with the tip cut off; (b) the cylindrical hydrogel was pushed out of the syringe; and (c) a disk-shaped part of the hydrogel was cut off using a spatula and placed on the rheometer. (d-g) Graphs of rheology data shown in main text including error bars (average and standard deviation of three independent measurements) with (d) strain sweep (at an angular frequency of 6.28 rad/s); (e) frequency sweep (at a strain of 0.08 %); and (f, g) dynamic strain amplitude test (alternating between 0.08 % and 10 % strain at an angular frequency of 6.28 rad/s). (h, i) Dynamic strain amplitude test performed on 0.8 wt.% hydrogels of meta-C made with growth medium. Rheology was performed at an angular frequency of 6.28 rad/s and temperature of 37 °C. The strain was alternated between 0.08 % (100 s) and 100 % (60 s). When the strain changes from 0.08 % to 100 %, the values of the storage modulus (G’) fall below the values of the loss modulus (G”), indicating the disruption of the gel network. When the strain changes back to 0.08 %, the values of the storage modulus increase again to their original value, indicating the recovery of the gel properties. (h) average of three independent measurements and (i) average and standard deviation of the same three independent measurements.

18
References for Supplementary Information
1. Y.-C. Lin, H. Komatsu, J. Ma, P. H. Axelsen and Z. Fakhraai, RSC Adv., 2016, 6, 114286.