Embed Size (px)
Citation preview

Robust Design
ME 470Systems Design
Fall 2010
Why Bother?
Customers will pay for increased quality!
Customers will be loyal for increased quality!

Taguchi Case Study• In 1980s, Ford outsourced the construction of a
subassembly to several of its own plants and to a Japanese manufacturer.
• Both US and Japan plants produced parts that conformed to specification (zero defects)
• Warranty claims on US built products was far greater!!!
• The difference? Variation• Japanese product was far more consistent!

Results from Less Variation
• Better performance• Lower costs due to less scrap, less rework and
less inventory!• Lower warranty costs
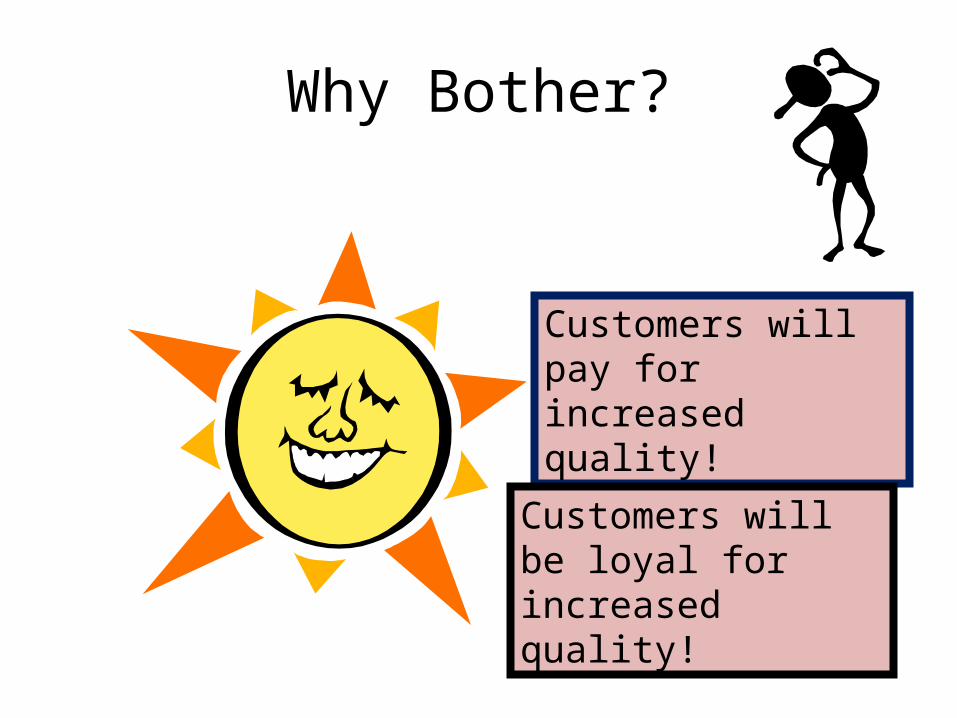
Taguichi Loss FunctionL
oss
TargetTarget
Traditional Approach Taguichi Definition
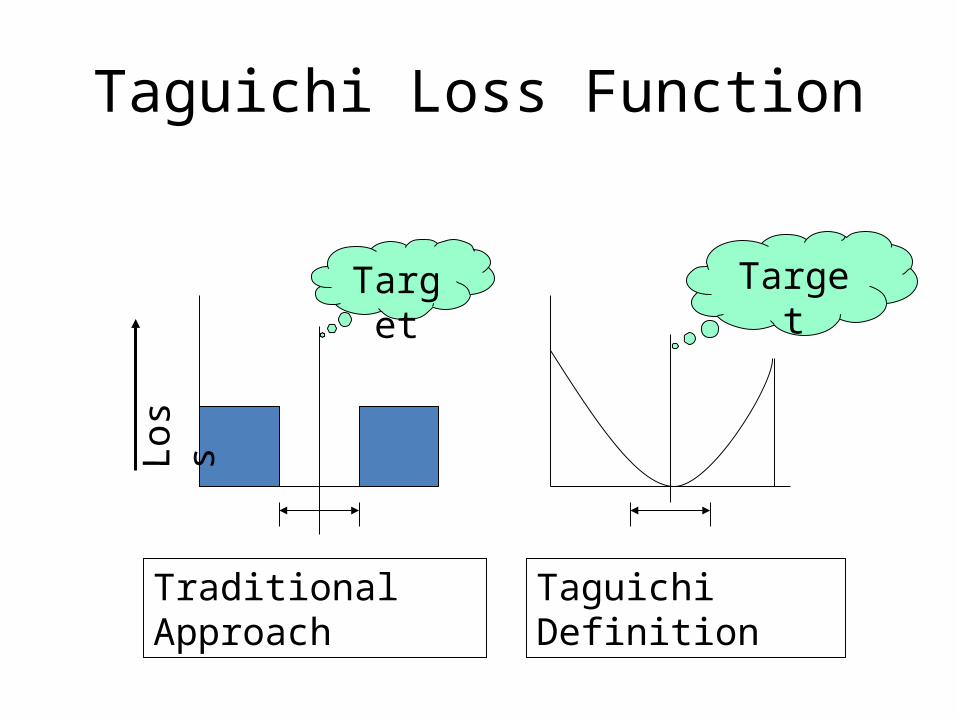
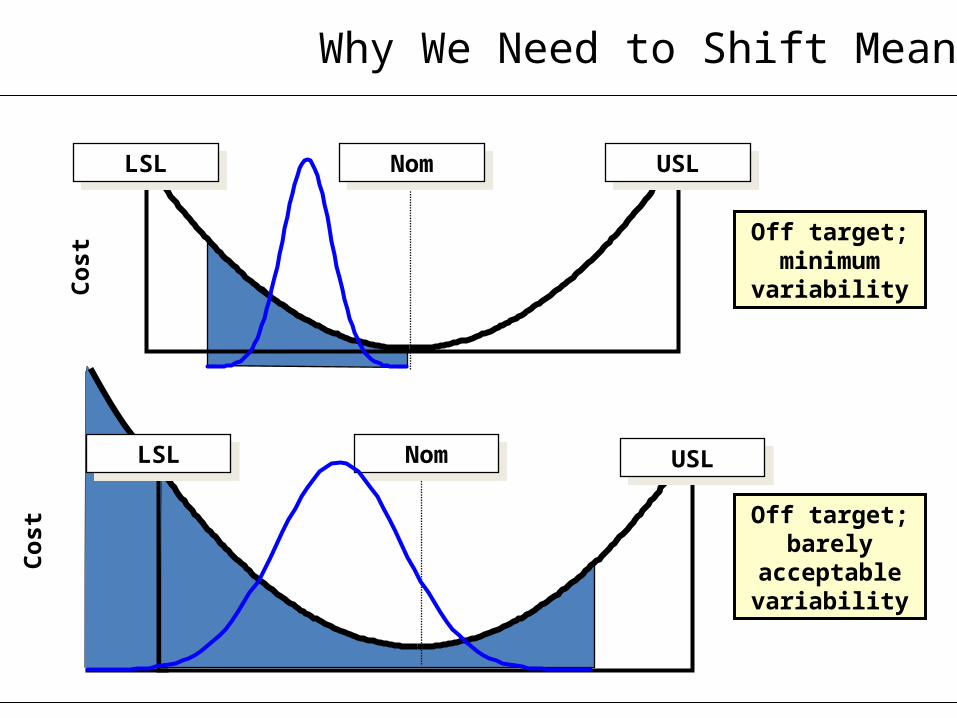
Why We Need to Reduce VariationC
ost
Low Variation;Minimum Cost
LSLLSL USLUSLNomNom
Cos
t
High Variation;High Cost
LSLLSL USLUSLNomNom
Cos
t
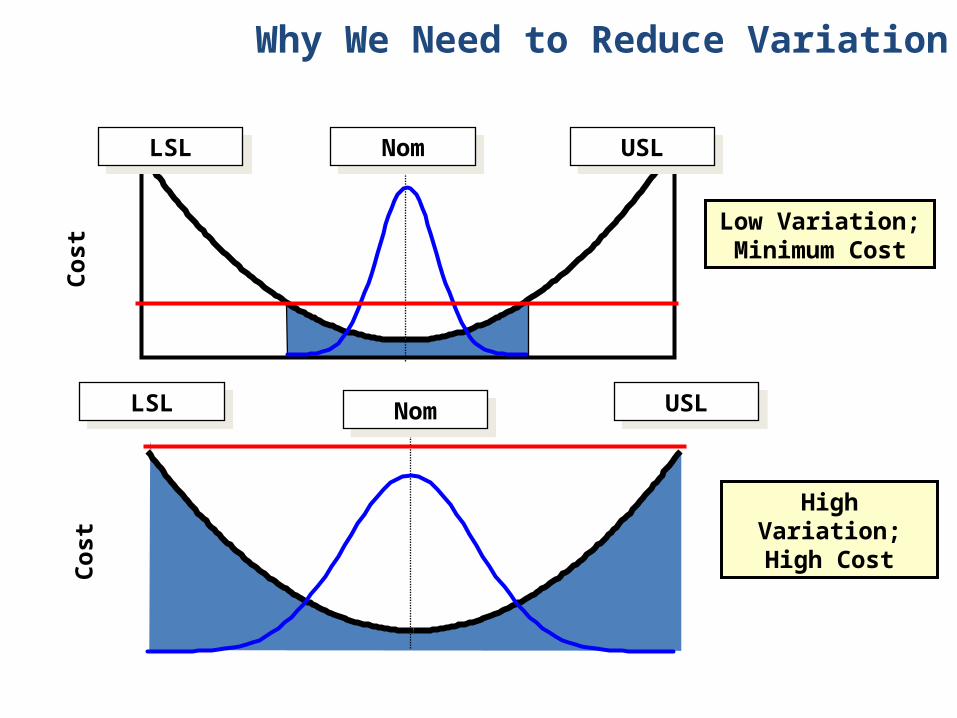
NomNom
Off target; minimum variability
USLUSLLSLLSL
Off target; barely
acceptable variability
Cos
t
NomNomLSLLSL USLUSL
Why We Need to Shift Means

Definition of Robust DesignRobustness is defined as a condition in which the product or
process will be minimally affected by sources of variation.A product can be robust against:
– variation in raw materials– variation in manufacturing conditions– variation in manufacturing personnel– variation in the end use environment– variation in end-users– wear-out or deterioration

646362616059585756
Target USLLSL
Process Capability Analysis for Desired
% Total
% > USL
% < LSL
% Total
% > USL
% < LSL
Cpm
Ppk
PPL
PPU
Pp
StDev (Overall)
Sample N
Mean
LSL
Target
USL
0.00
0.00
0.00
0.00
0.00
0.00
2.00
2.00
2.00
2.00
2.00
0.666600
100
60
56
60
64
Expected PerformanceObserved Performance
Overall Capability
Process Data
If your predicted design capability looks like this, you do not have a functional performance need to apply Robust Parameter Design methods. Cost, however, may still be an issue if the input (materials or process) requirements are tight!
6462605856545250
Target USLLSL
Process Capability Analysis for Y1
% Total
% > USL
% < LSL
% Total
% > USL
% < LSL
Cpm
Ppk
PPL
PPU
Pp
StDev (Overall)
Sample N
Mean
LSL
Target
USL
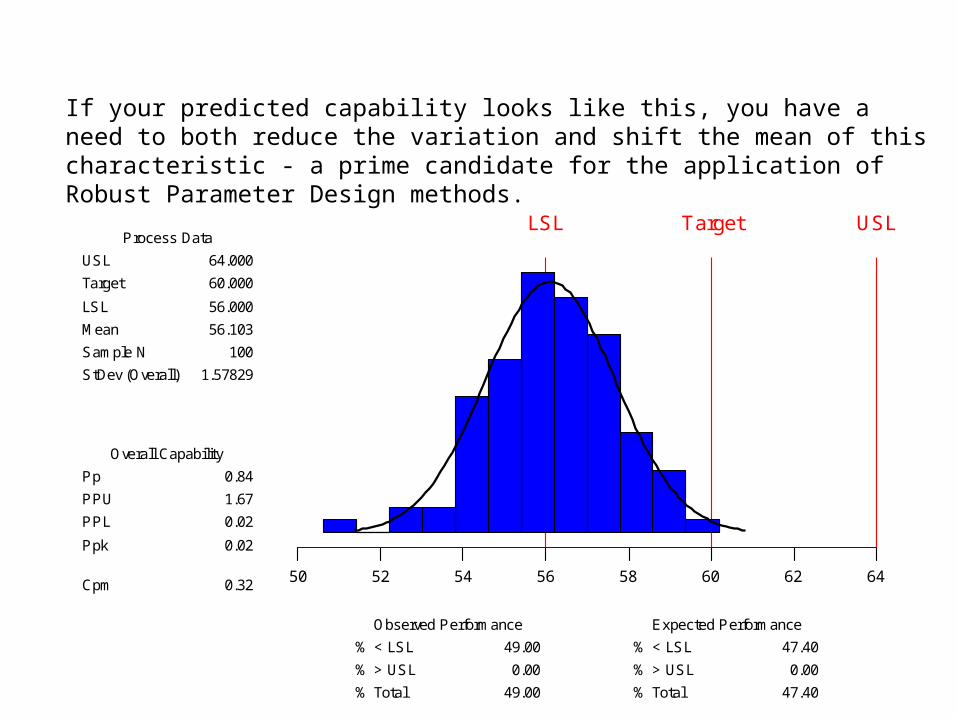
47.40
0.00
47.40
49.00
0.00
49.00
0.32
0.02
0.02
1.67
0.84
1.57829
100
56.103
56.000
60.000
64.000
Expected PerformanceObserved Performance
Overall Capability
Process Data
If your predicted capability looks like this, you have a need to both reduce the variation and shift the mean of this characteristic - a prime candidate for the application of Robust Parameter Design methods.
Variables or parameters which– affect system performance– are uncontrollable or not economical to control
Examples include– climate– part tolerances– corrosion
Noise Factors
Classes of Noise Factors
Noise factors can be classified into:– Customer usage noise
Maintenance practice Geographic, climactic, cultural, and other issues Duty cycle
– Manufacturing noise Processes Equipment Materials and part tolerances
– Aging or life cycle noise Component wear Corrosion or chemical degradation Calibration drift
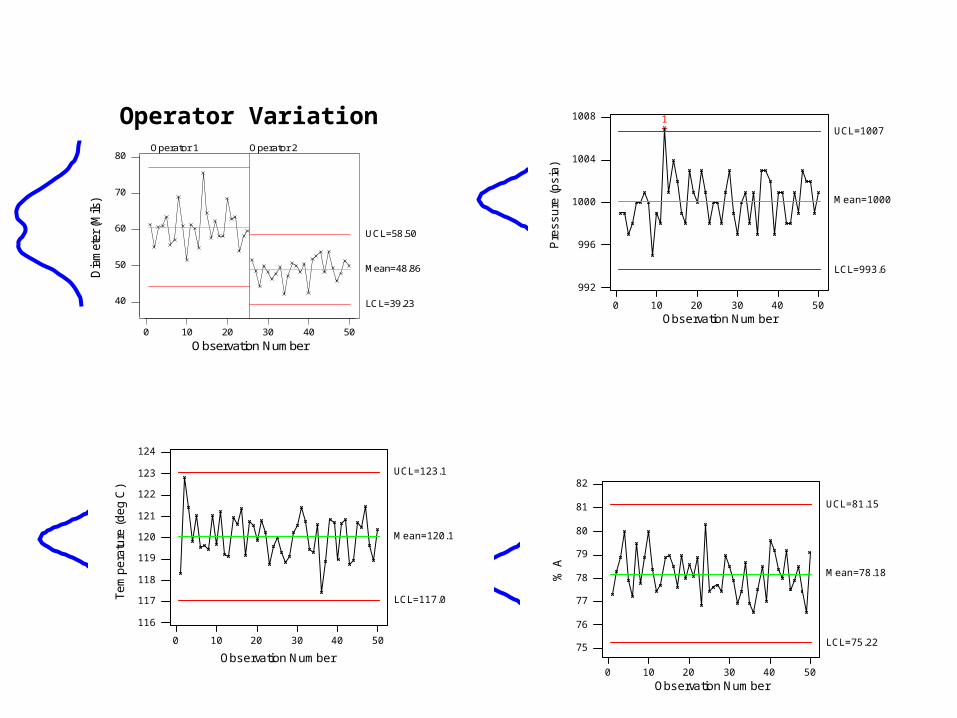
50403020100
124
123
122
121
120
119
118
117
116
Observation Number
Te
mp
era
ture
(d
eg
C)
Mean=120.1
UCL=123.1
LCL=117.0
Operating Temperature
50403020100
1008
1004
1000
996
992
Observation Number
Pre
ss
ure
(p
sia
)
1
Mean=1000
UCL=1007
LCL=993.6
Pressure Variation
50403020100
82
81
80
79
78
77
76
75
Observation Number
% A
Mean=78.18
UCL=81.15
LCL=75.22
Fluid Viscosity
Operator Variation
50403020100
80
70
60
50
40
Observation Number
Dia
met
er (M
ils)
I Chart for Diameter by Operator
Mean=48.86
UCL=58.50
LCL=39.23
Operator 1 Operator 2
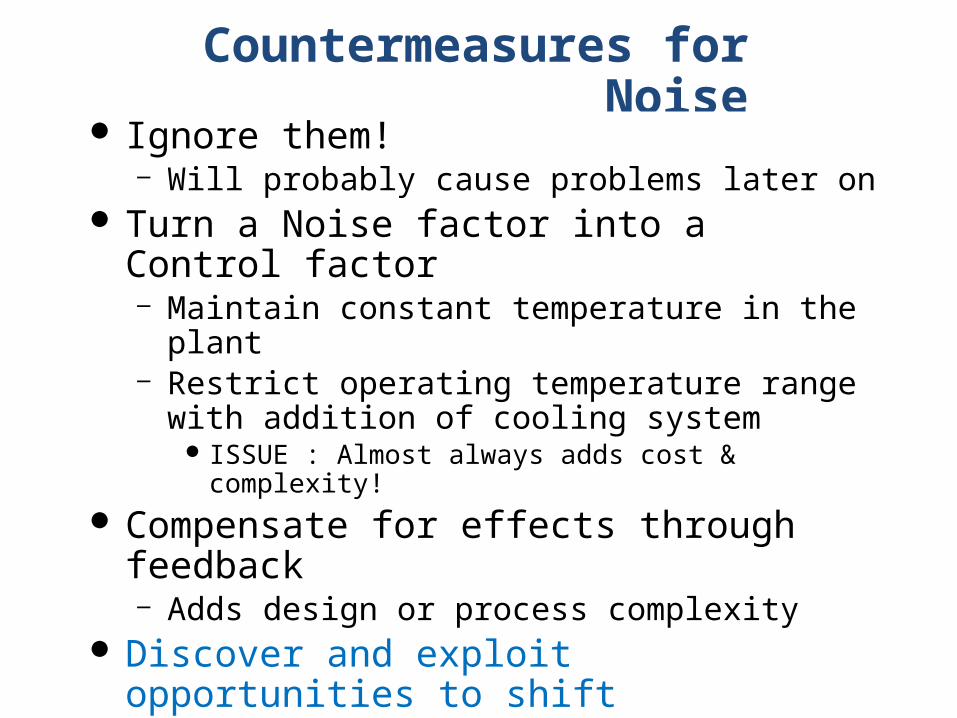
Countermeasures for Noise
Ignore them!– Will probably cause problems later on
Turn a Noise factor into a Control factor– Maintain constant temperature in the plant– Restrict operating temperature range with addition of
cooling system ISSUE : Almost always adds cost & complexity!
Compensate for effects through feedback– Adds design or process complexity
Discover and exploit opportunities to shift sensitivity– Interactions– Nonlinear relationships

How to describe the Engineering System?
Z1
Z2...
Zn
Y1
Y2...
Yn
X1
X2...
Xn
ControlFactors
NoiseFactors
InputsOutputs
System
The Parameter Diagram
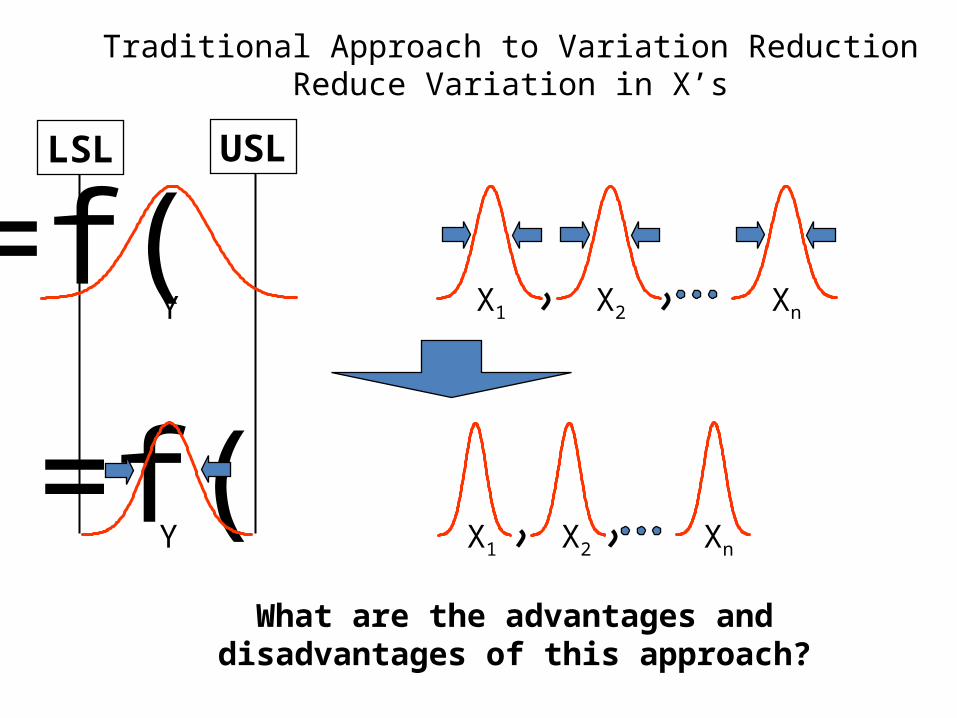
Traditional Approach to Variation ReductionReduce Variation in X’s
What are the advantages and disadvantages of this approach?
=f( )
Y=f( )
X1 X2 Xn
Y X1 X2 Xn
LSL USL
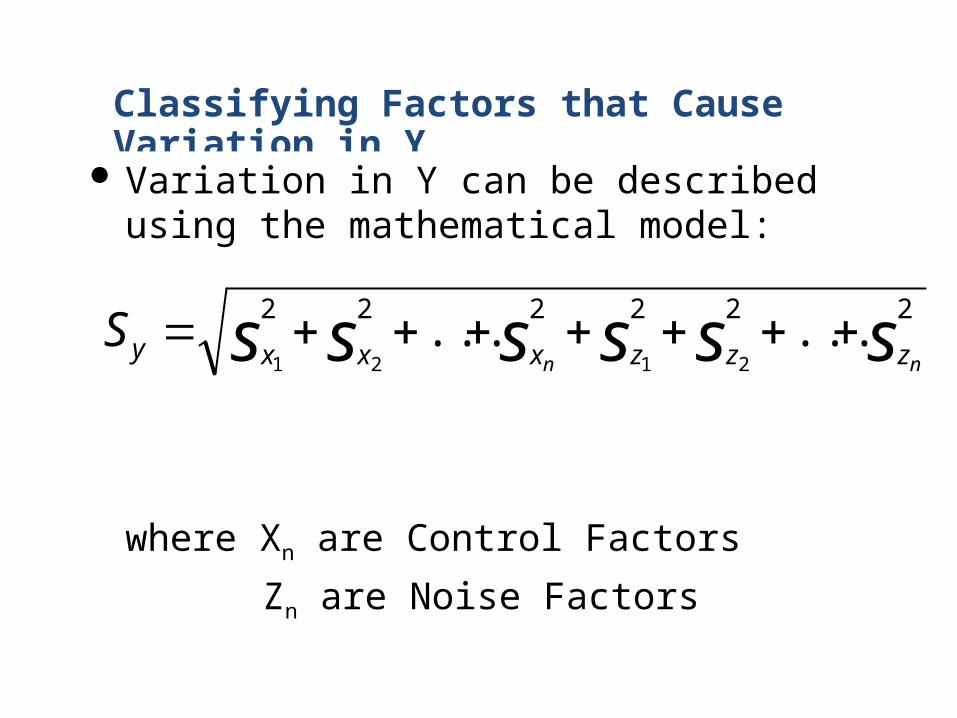
Classifying Factors that Cause Variation in Y
Variation in Y can be described using the mathematical model:
where Xn are Control Factors
Zn are Noise Factors
ssssss nn zzzxxxyS222222
......2121


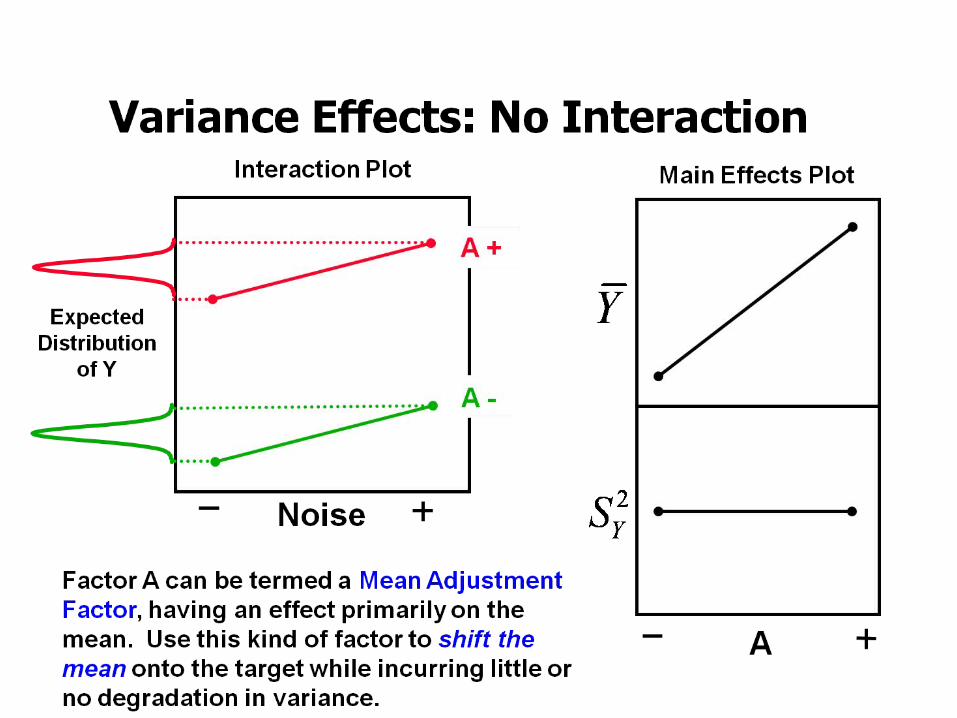

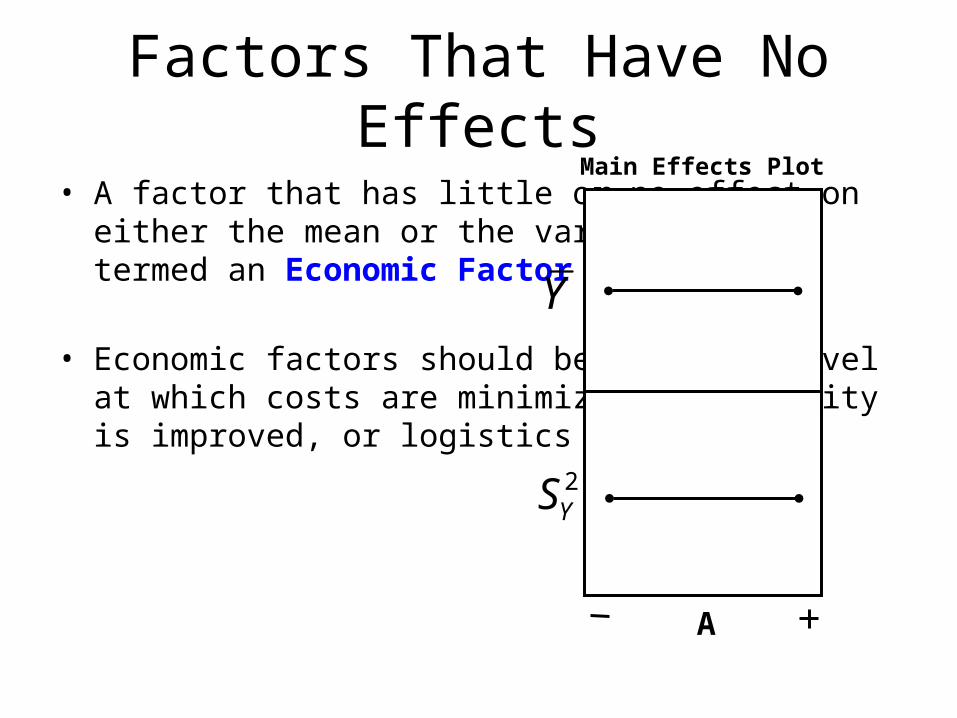
Factors That Have No Effects
• A factor that has little or no effect on either the mean or the variance can be termed an Economic Factor
• Economic factors should be set at a level at which costs are minimized, reliability is improved, or logistics are improved
A
2YS
Y
Main Effects Plot
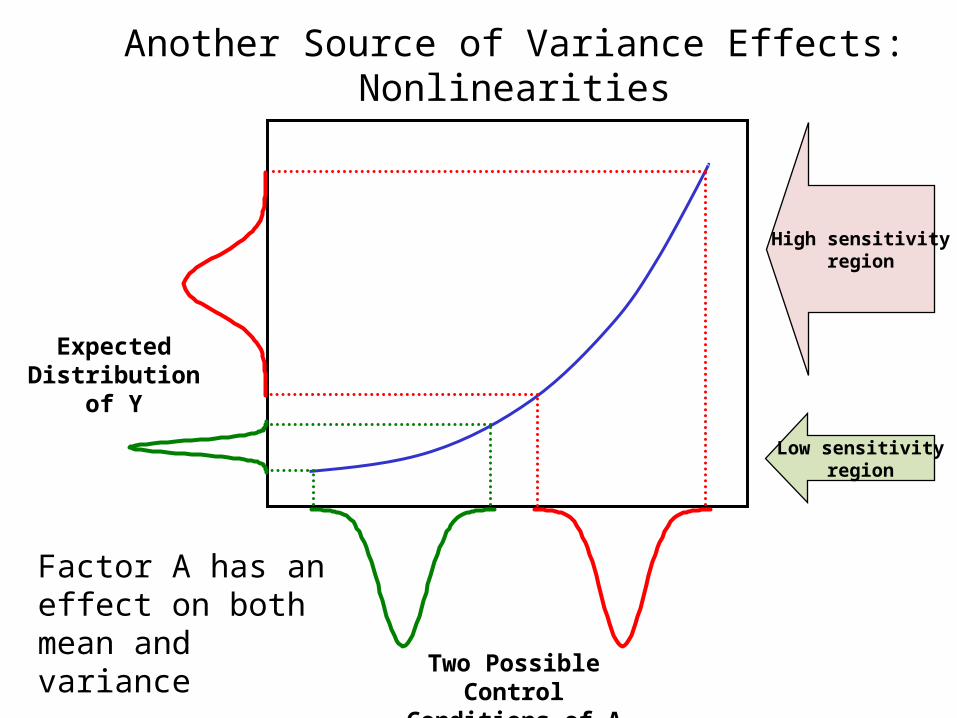
Another Source of Variance Effects: Nonlinearities
ExpectedDistribution
of Y
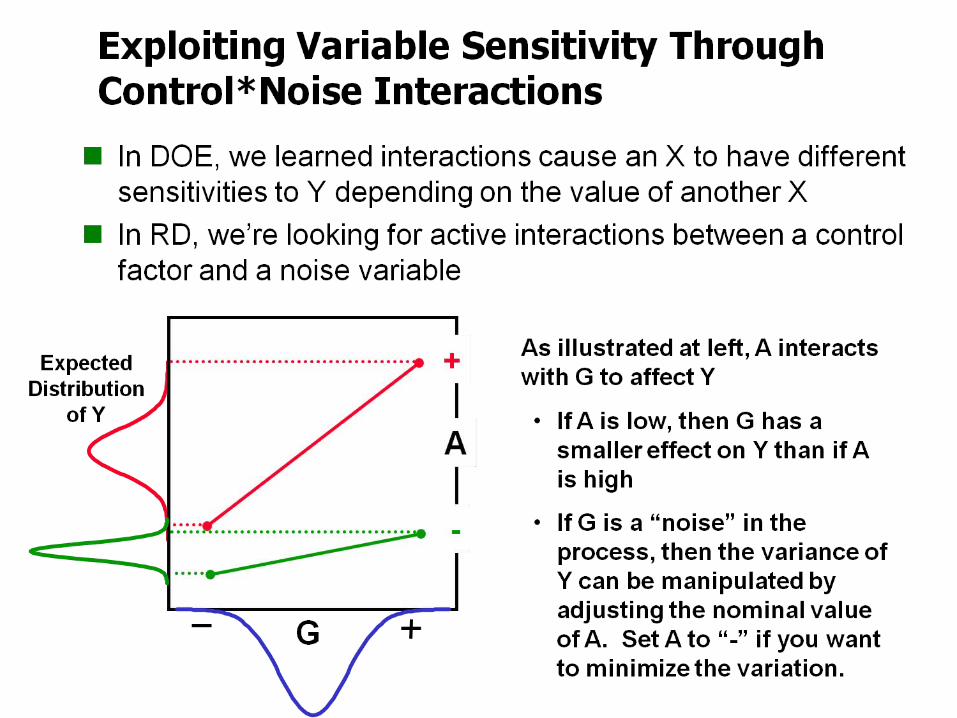
Two Possible ControlConditions of A
Factor A has an effect on both mean and variance
Low sensitivityregion
High sensitivityregion
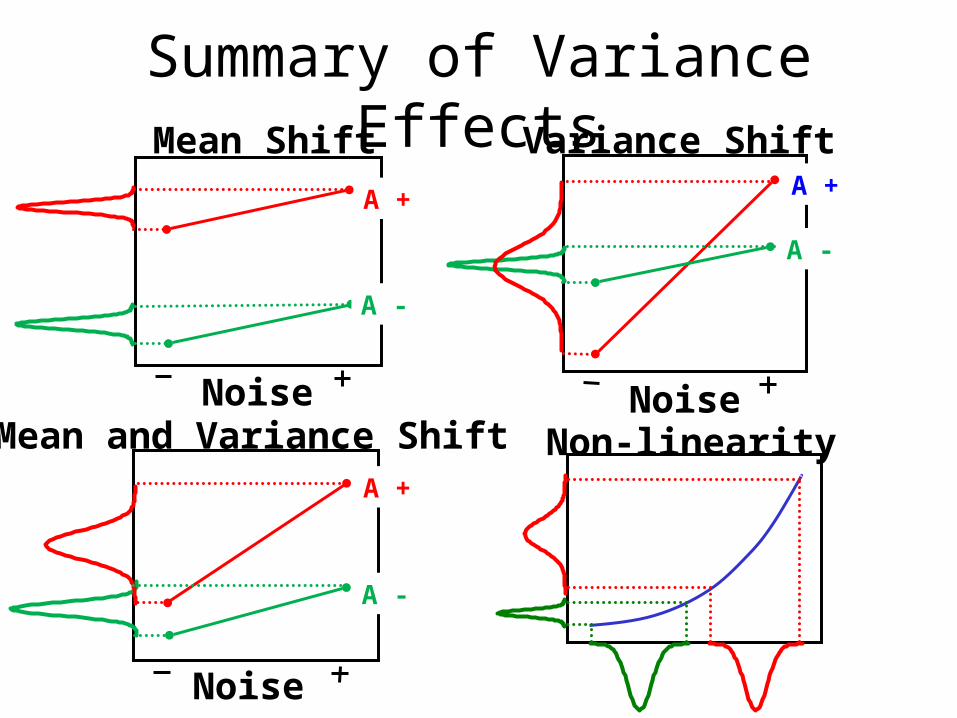
Summary of Variance EffectsMean Shift
Noise
A -
A +
Variance Shift
Noise
A -
A +
Mean and Variance ShiftA +
A -
Noise
Non-linearity
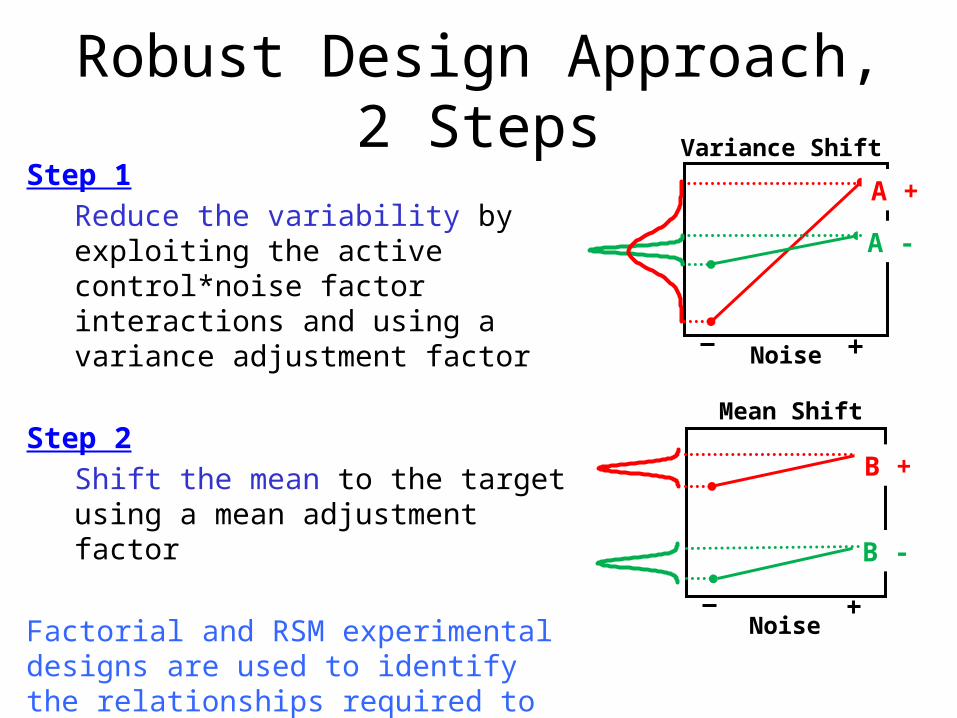
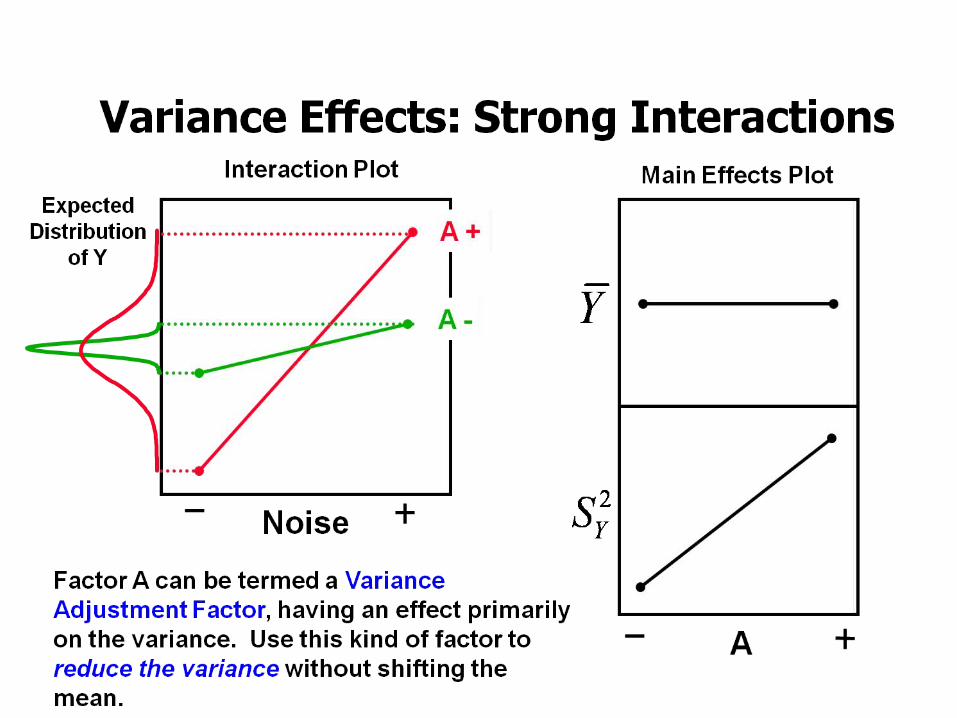
Robust Design Approach, 2 StepsStep 1
Reduce the variability by exploiting the active control*noise factor interactions and using a variance adjustment factor
Step 2Shift the mean to the target using a mean adjustment factor
Factorial and RSM experimental designs are used to identify the relationships required to perform these activities
Variance Shift
Noise
A -
A +
Mean Shift
Noise
B -
B +

Design Resolution
• Full factorial vs. fractional factorial• In our DOE experiment, we used a full factorial. This can
become costly as the number of variables or levels increases.• As a result, statisticians use fractional factorials. As you might
suspect, you do not get as much information from a fractional factorial.
• For the screening run in lab this week, we used a half-fractional factorial. (Say that fast 5 times!)
Fractional Factorials
A Fractional Factorial Design is a factorial design in which all possible treatment combinations of the factors are NOT run. The runs are just a FRACTION of the full factorial matrix. The resulting design matrix will not be able to estimate some of the effects, often the interaction effects. Minitab and your statistics textbook will tell you the form necessary for fractional factorials.
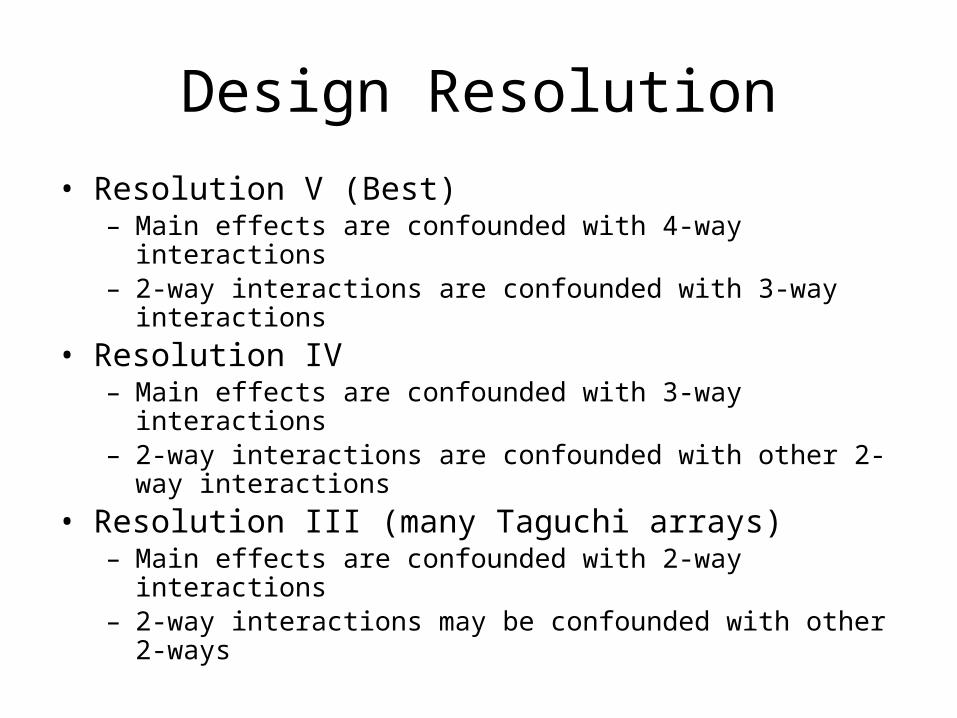
Design Resolution• Resolution V (Best)
– Main effects are confounded with 4-way interactions– 2-way interactions are confounded with 3-way interactions
• Resolution IV– Main effects are confounded with 3-way interactions– 2-way interactions are confounded with other 2-way interactions
• Resolution III (many Taguchi arrays)– Main effects are confounded with 2-way interactions– 2-way interactions may be confounded with other 2-ways
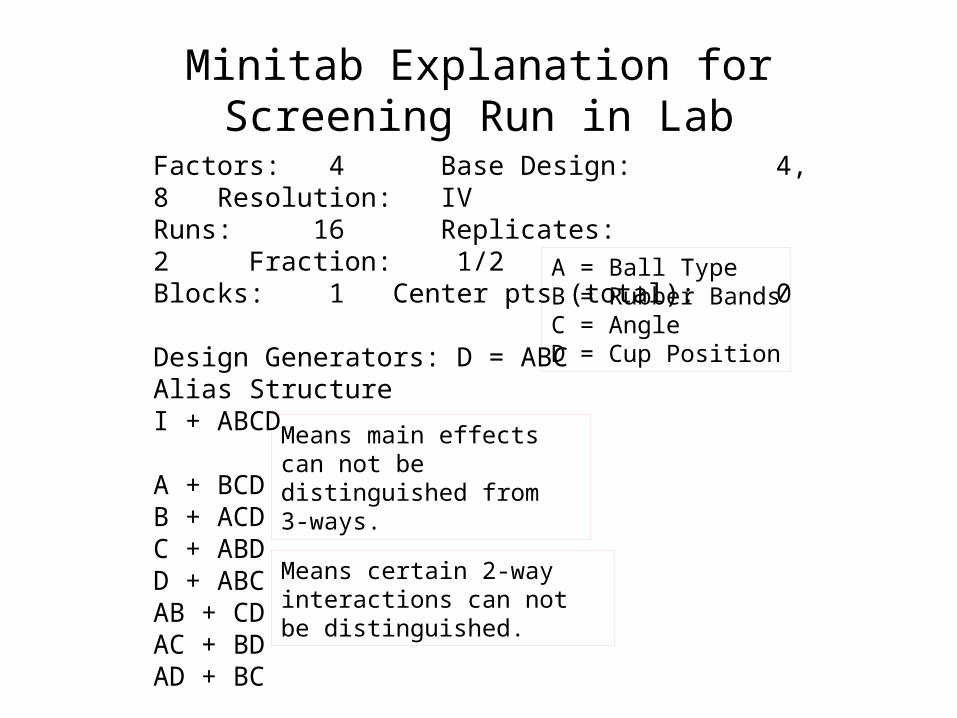
Factors: 4 Base Design: 4, 8 Resolution: IVRuns: 16 Replicates: 2 Fraction: 1/2Blocks: 1 Center pts (total): 0
Design Generators: D = ABCAlias StructureI + ABCD
A + BCDB + ACDC + ABDD + ABCAB + CDAC + BDAD + BC
Minitab Explanation for Screening Run in Lab
Means main effects can not be distinguished from 3-ways.
Means certain 2-way interactions can not be distinguished.
A = Ball TypeB = Rubber BandsC = AngleD = Cup Position
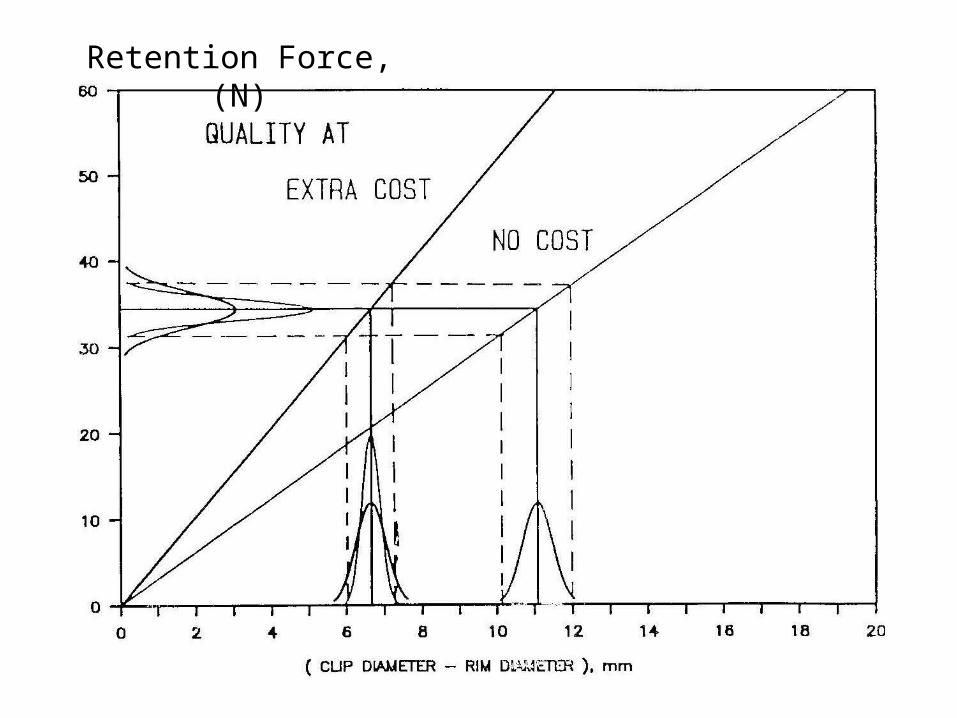
Hubcap Example of Propagation of Errors
The example is taken from a paper presented at the Conference on Uncertainty in Engineering Design held in Gaithersburg, Maryland May10-11, 1988.
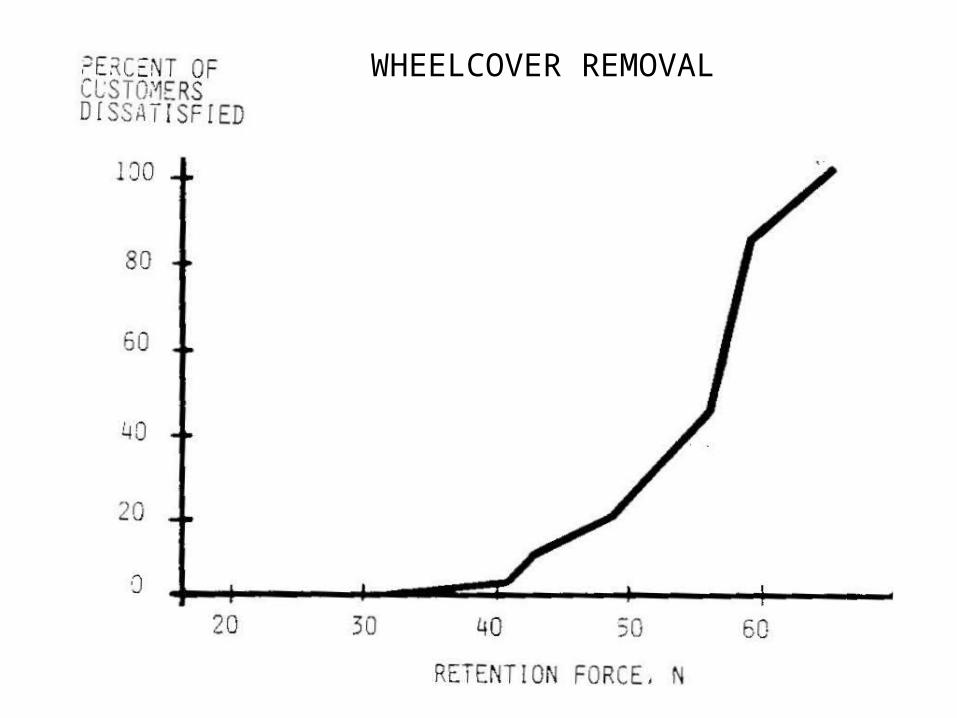
WHEELCOVER REMOVAL
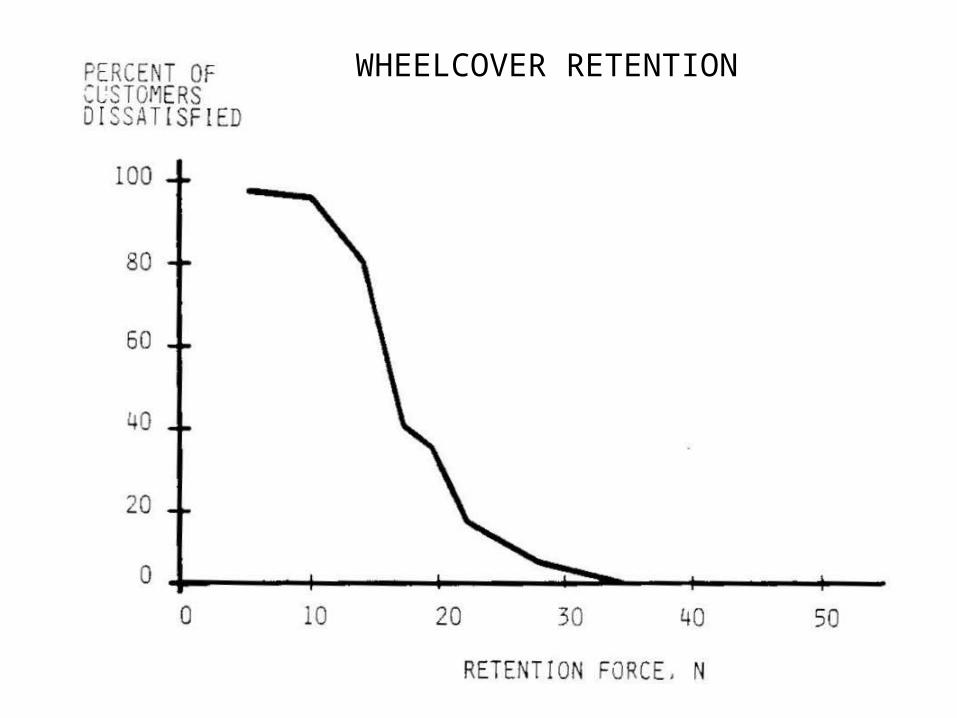
WHEELCOVER RETENTION
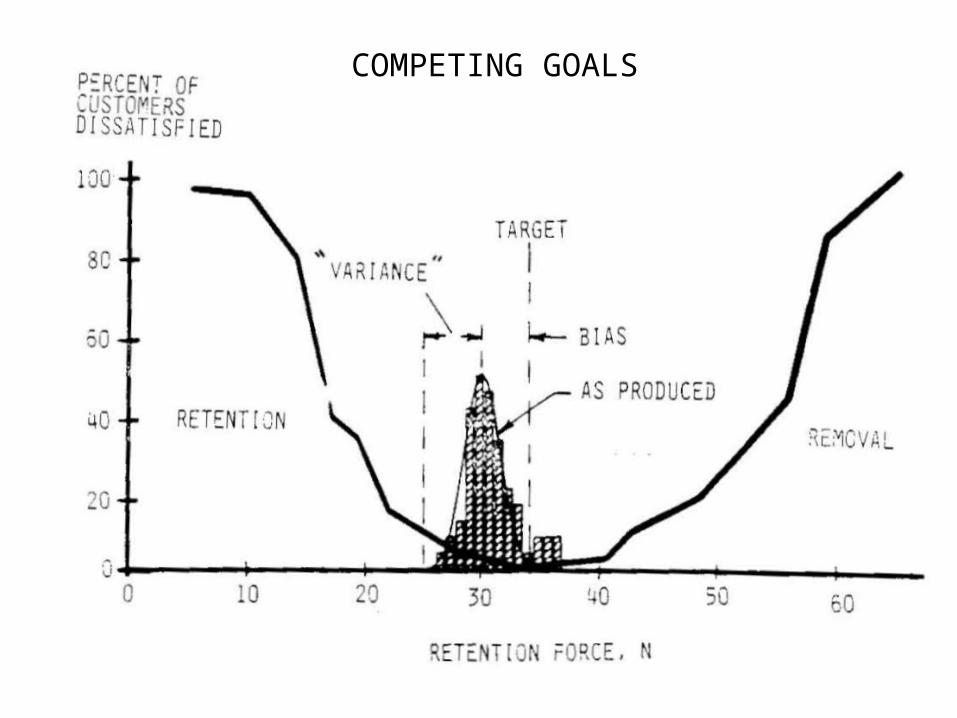
COMPETING GOALS
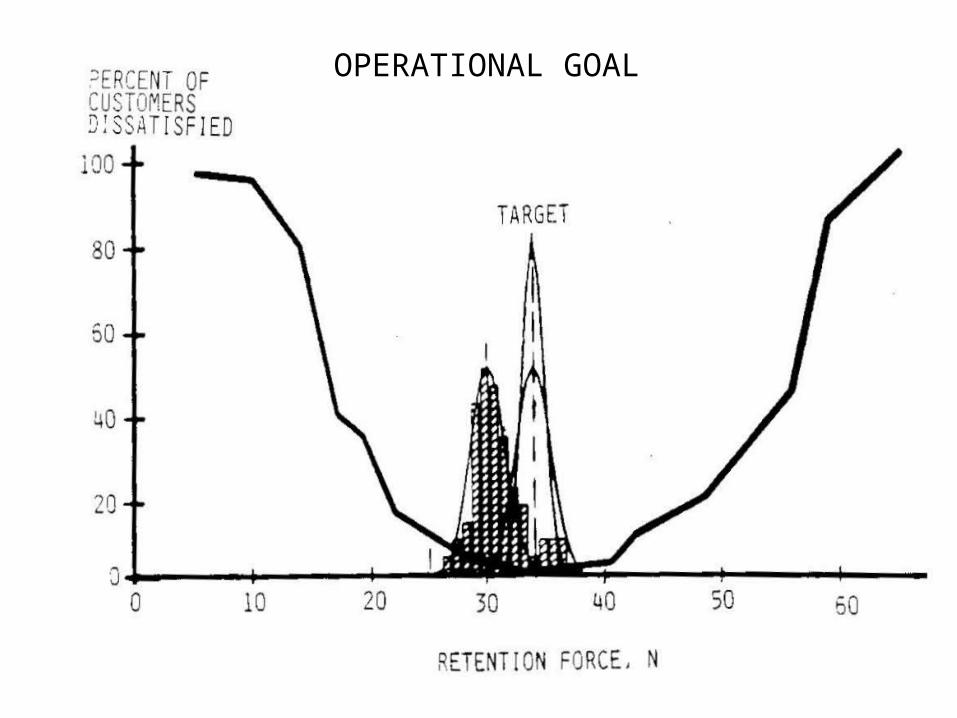
OPERATIONAL GOAL
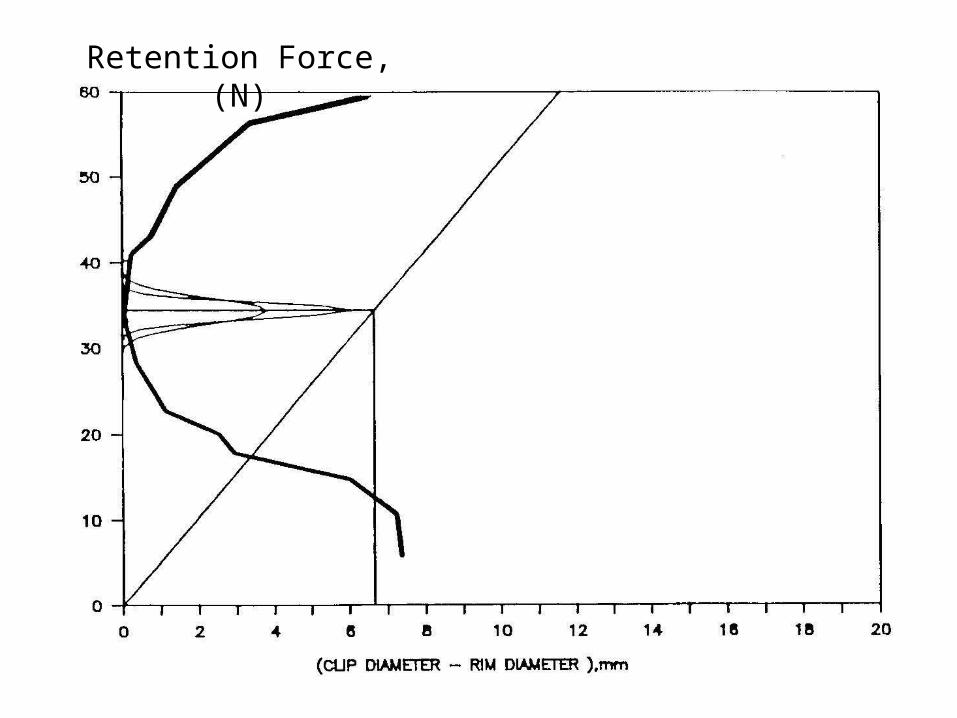
Retention Force, (N)

Retention Force, (N)
Retention Force, (N)
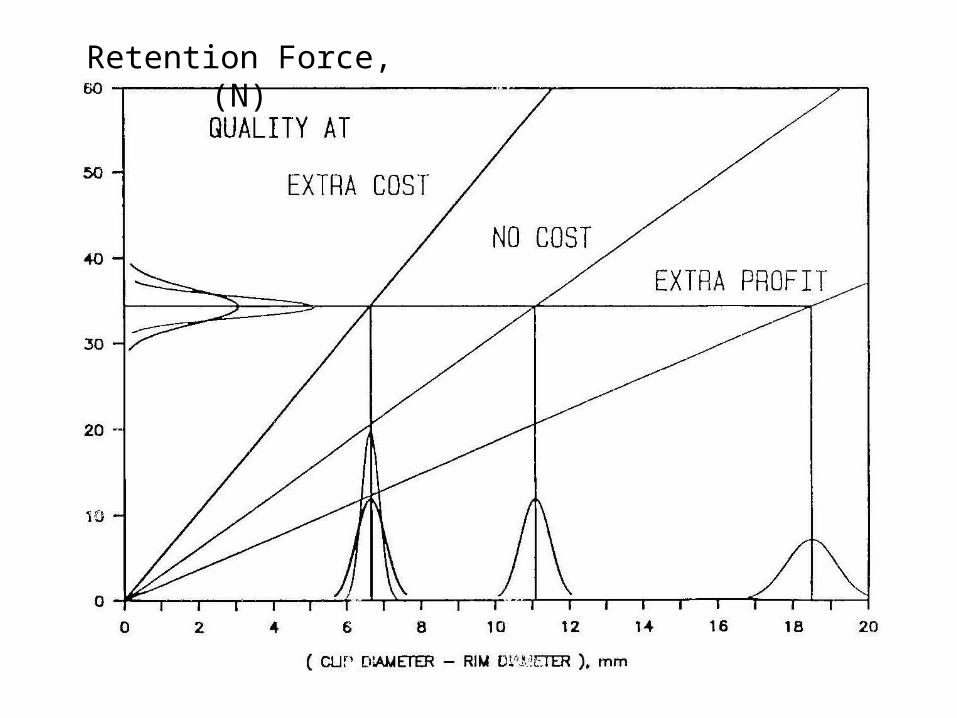
Retention Force, (N)