Embed Size (px)
Citation preview

Robust Decision Making:
Good Decisions Without Good Predictions
Robert Lempert
Director,
RAND Pardee Center for Longer Range Global Policy and
the Future Human Condition
Sustainable Water Resources
UF Water Institute
February 11, 2014
2
How to Use Deeply Uncertain Information to Inform Decisions?
Today’s decision makers confront many challenges
where quantitative information is indispensible to good
choices
But the quantitative methods and tools commonly used to
inform decision processes can prove counter productive
under conditions of deep uncertainty
New methods, exploiting new information technology and
recent cognitive science, can improve decisions under
such conditions

3
Climate-Related Decisions Poses Both Analytic and Organizational Challenges
Climate-related decisions involve:
• Incomplete information from new, fast-moving,
and sometimes irreducibly uncertain science
• Many different interests and values
• Long-time scales
• Near certainty of surprise
How to make plans more robust and
adaptable while preserving public
accountability?
Public planning should be:
• Objective
• Subject to clear rules and procedures
• Accountable to public

4
Traditional Water Planning Makes Sense When There Isn’t Much Uncertainty
• Traditional “predict-then-act” analysis begins by
characterizing uncertainty:
Characterize
uncertainty
Rank
strategies Sensitivity
analysis

5
Traditional Water Planning Makes Sense When There Isn’t Much Uncertainty
• Traditional “predict-then-act” analysis begins by
characterizing uncertainty:
Characterize
uncertainty
Rank
strategies Sensitivity
analysis
But when uncertainties are deep:
• Uncertainties are underestimated
• Competing analyses can contribute to gridlock
• Misplaced concreteness can blind decisionmakers to surprise

6
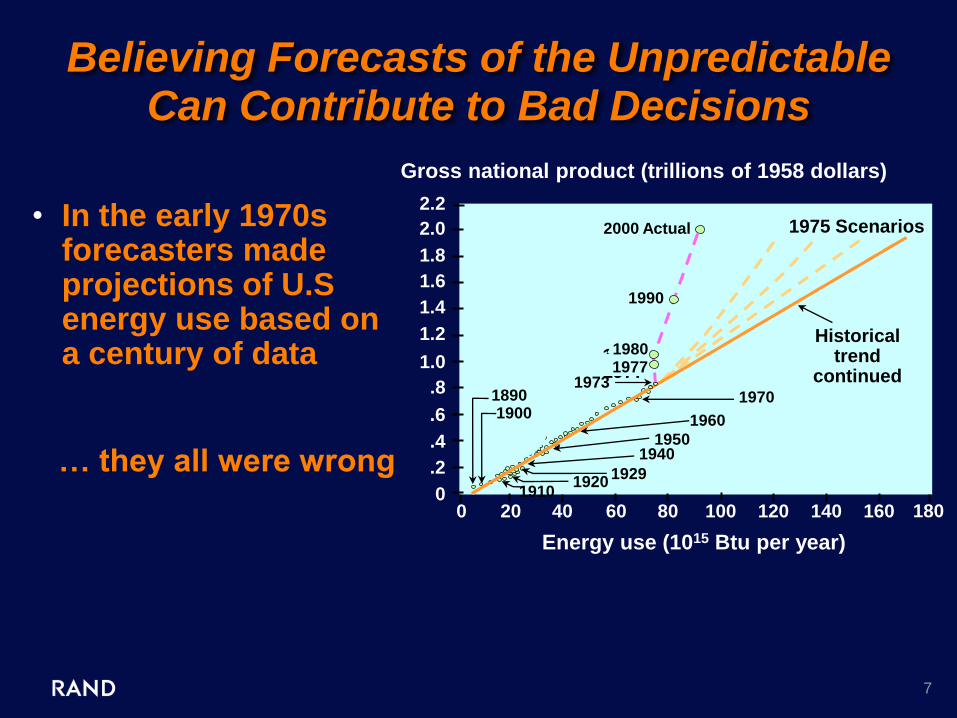
Believing Forecasts of the Unpredictable Can Contribute to Bad Decisions
• In the early 1970s forecasters made projections of U.S energy use based on a century of data
Gross national product (trillions of 1958 dollars)
2.2
2.0
1.8
1.6
1.4
1.2
1.0
.8
.6
.4
.2
0 180
Energy use (1015 Btu per year)
0
Historical trend
continued 1970
1920 1929
1940 1950
1960
1910
1973
1973
1900 1890
20 40 60 80 100 120 140 160
1975 Scenarios
7
Believing Forecasts of the Unpredictable Can Contribute to Bad Decisions
Gross national product (trillions of 1958 dollars)
2.2
2.0
1.8
1.6
1.4
1.2
1.0
.8
.6
.4
.2
0 180
Energy use (1015 Btu per year)
0
Historical trend
continued 1970
1920 1929
1940 1950
1960
1910
1973
1973
1900 1890
20 40 60 80 100 120 140 160
2000 Actual
1990
1980 1977
1975 Scenarios 2000 Actual
1990
1980 1977
• In the early 1970s forecasters made projections of U.S energy use based on a century of data
… they all were wrong

8
Climate Change Is One Source of Uncertainty Facing Water Managers
Deep uncertainty occurs when the parties to a decision do not
know or do not agree on the likelihood of alternative futures or
how actions are related to consequences
Lower emissions scenario
(RCP 2.6)
Higher emissions scenario
(RCP 8.5)
IPCC Fifth Assessment report multi-model projections of precipitation changes

9
Under Conditions of Deep Uncertainty, Often Useful to Run Analysis Backwards
– Forwards:
– Backwards:
Candidate
strategy
Identify
Vulnerabilities
Identify Responses
and Tradeoffs
Characterize
uncertainty
Rank
strategies Sensitivity
analysis
RDM (Robust Decision Making) follows this backwards approach

10
Many Resource Management Agencies Use RDM
2008
2009
2010
2011
2012
2013
Long-term Water Resources Planning
Coastal Protection & Restoration
USBR
CO
River
Basin
Study
California
Water
Plan
Water Resource
Foundation
CO Springs Utilities
& NYC
World
Bank:
Ho Chi
Min City
Climate
Impacts
on Sierra
Nevada
Water
Utility
(EID)
Louisiana
Coastal Master
Plan New Orleans
Risk
Mitigation
&
Comm.
Study
(NOAA)
Port of L.A. &
sea level rise
(NSF)
Vulnerability
Assessment &
Risk
Management
Tools
EPA Water
Quality
Case
Studies
World Bank:
Climate
Resilient
African
Infrastructure
NY-NJ Climate
Resilience
Planning
2017
Update
2012 Update
MWD
IRP
Denver
Water
IEUA (NSF)

11
Outline
• Do the Analysis Backwards
– Inland Empire Utilities Agency
• Embed analysis in process of stakeholder
engagement
– Colorado River Basin Supply and Demand Study
• How Can You Use RDM?
12
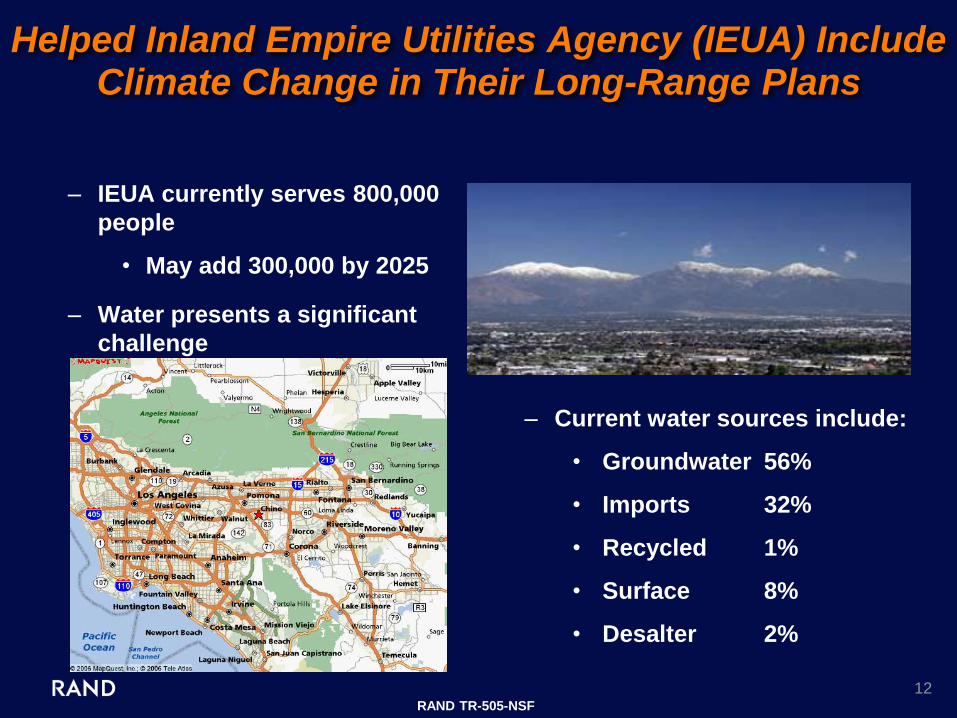
– Current water sources include:
• Groundwater 56%
• Imports 32%
• Recycled 1%
• Surface 8%
• Desalter 2%
Helped Inland Empire Utilities Agency (IEUA) Include Climate Change in Their Long-Range Plans
– IEUA currently serves 800,000
people
• May add 300,000 by 2025
– Water presents a significant
challenge
RAND TR-505-NSF

13
– Current water sources include:
• Groundwater 56%
• Imports 32%
• Recycled 1%
• Surface 8%
• Desalter 2%
Focus of IEUA’s 25 year plan
Helped Inland Empire Utilities Agency (IEUA) Include Climate Change in Their Long-Range Plans
– IEUA currently serves 800,000
people
• May add 300,000 by 2025
– Water presents a significant
challenge
RAND TR-505-NSF

14
Model Performance
of plans
IEUA Plans
System data
& climate forecasts
Simulation Model Assesses Performance of IEUA Plans in Alternative Futures
Groves et. al. (2007)
Uncertain Factors (X)
Natural process
Performance of strategies
External trends
Relationships (R)
WEAP model of IEUA system
Performance Metrics (M)
Cost
Use simulation model to assess performance of
IEUA plan in each of hundreds of futures

15
0 1.0 2.0 3.0 4.0
PV shortage cost ($ billions)
2.5
3.0
3.5
4.0
PV
su
pp
ly c
os
t ($
billio
ns
)
Current IEUA plan forever
Model results show performance of current IEUA plan in 200 plausible futures
“Scenario Maps” Help Decision Makers Visualize a Plans’ Performance Over Many Futures
RAND DB-550-NSF Scenario
Tradeoff
Decision
Structuring
Cases

16
0 1.0 2.0 3.0 4.0
PV shortage cost ($ billions)
2.5
3.0
3.5
4.0
PV
su
pp
ly c
os
t ($
billio
ns
)
Current IEUA plan forever
Note That Plan Generates Surpluses in a Future With Benign Future Climate
RAND DB-550-NSF
Temp: +0.7oC Precip: +3%
0
50
100
150
200
250
300
350
400
2005 2010 2015 2020 2025 2030
Year A
nn
ual
su
pp
ly (
taf)
Recycled
Groundwater
Imports
Surplus
Local Supplies

17
0 1.0 2.0 3.0 4.0
PV shortage cost ($ billions)
2.5
3.0
3.5
4.0
PV
su
pp
ly c
os
t ($
billio
ns
)
Current IEUA plan forever
But Plan Suffers Shortages in a Future With Adverse Future Climate
RAND DB-550-NSF
Temp: +1.6oC Precip: -10%
0
50
100
150
200
250
300
350
400
2005 2010 2015 2020 2025 2030
Year A
nn
ual
su
pp
ly (
taf)
Recycled
Groundwater
Local Supplies Imports
Dry-year yield
Surplus
Shortage

18
0 1.0 2.0 3.0 4.0
PV shortage cost ($ billions)
2.5
3.0
3.5
4.0
PV
su
pp
ly c
ost
($ b
illio
ns)
Current IEUA Plan Forever
$3.75 billion cost threshold
Current plan generates high costs in 120 of 200 cases
Analyzing Patterns Across Many Futures Provides Decision-Relevant Information
19
0 1.0 2.0 3.0 4.0
PV shortage cost ($ billions)
2.5
3.0
3.5
4.0
PV
su
pp
ly c
os
t ($
bil
lio
ns)
Current IEUA plan forever
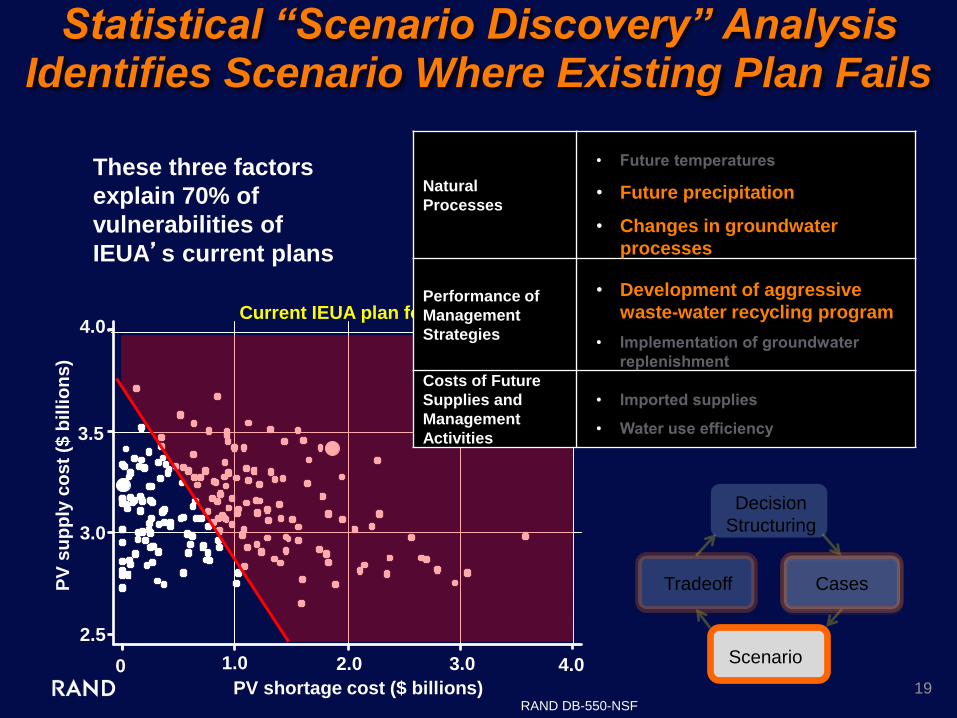
Statistical “Scenario Discovery” Analysis Identifies Scenario Where Existing Plan Fails
Natural
Processes
•
• Future precipitation
• Changes in groundwater
processes
Performance of
Management
Strategies
• Development of aggressive
waste-water recycling program
•
Costs of Future
Supplies and
Management
Activities
•
•
These three factors
explain 70% of
vulnerabilities of
IEUA’s current plans
RAND DB-550-NSF
Scenario
Tradeoff
Decision
Structuring
Cases

20
What Should IEUA Do Now, and What Can They Wait to Do Later?
Act now to
augment
2005 Plan?
NO
Monitor, and
take additional
action if
supplies drop
too low
In 2015, 2020, 2025, ….
YES
Implement
additional
efficiency,
recycling, and
replenishment
In 2015, 2020, 2025, ….
Monitor, and
take additional
action if
supplies drop
too low
Scenario
Tradeoff
Decision
Structuring
Cases

21
Just Allowing the Current UWMP to Update Reduces Vulnerable Cases Substantially
0 20 40 30 10
Static options
Update options
Number of Cases
(PV Costs > $3.75 billion)
UWMP with updates
RAND DB-550-NSF
Current UWMP Forever 120
Scenario
Tradeoff
Decision
Structuring
Cases

22
Compare Alternative Plans With Different Mixes of “Act Now” vs. “Act Later”
0 20 40 30 10
Static options
Update options
Number of Cases
(PV Costs > $3.75 billion)
UWMP with updates
UWMP + replenishment with updates
UWMP + efficiency
UWMP + efficiency with updates
UWMP + DYY and recycling with updates
UWMP + all enhancements
Economic Costs Decrease, But Unquantified Opportunity
Costs Increase
RAND DB-550-NSF
Current UWMP Forever 120
Scenario
Tradeoff
Decision
Structuring
Cases

23
Compare Alternative Plans With Different Mixes of “Act Now” vs. “Act Later”
0 20 40 30 10
Number of Scenarios
(PV Costs > $3.75 billion)
UWMP with updates
UWMP + replenishment with updates
UWMP + efficiency
UWMP + efficiency with updates
UWMP + DYY and recycling with updates
UWMP + all enhancements
Economic Costs Decrease, But Unquantified Opportunity
Costs Increase
RAND DB-550-NSF
Current UWMP Forever 120
IEUA chose to accelerate their dry-year yield and recycling programs, and adapt as needed down the road

24
Outline
• Do the Analysis Backwards
– Inland Empire Utilities Agency
• Embed analysis in process of stakeholder
engagement
– Colorado River Basin Supply and Demand Study
• How Can You Use RDM?

25
RDM Approach Also Used to Help Develop New Plans for Managing Colorado River
2012 Bureau of Reclamation study, in
collaboration with seven states and other
users:
• Generated consensus on
potential risks to system
• Suggested adaptive contingency
plan, with • High priority near-term actions
&
• Future actions contingent on
how the future unfolds

26
Basin Expected to Face Imbalances Between Demand and Supply
and Demand Projected
Groves. Fischbach, Bloom, Knopman and Keefe. Adapting to a Changing Colorado River: Making Future
Water Deliveries More Reliable Through Robust Management Strategies. RAND Corporation, 2013.
27
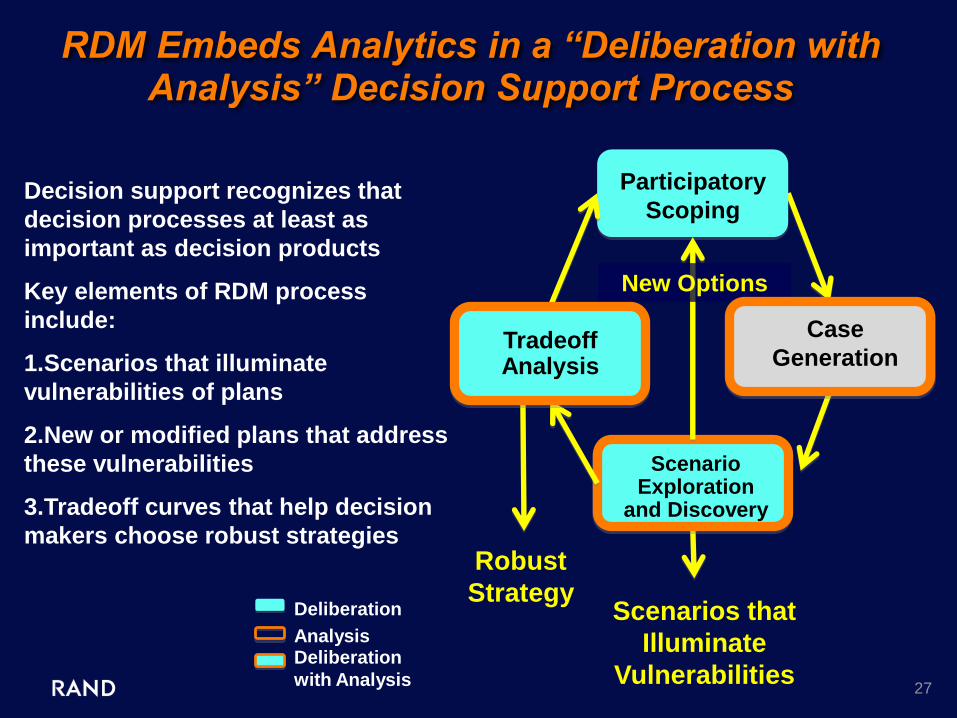
RDM Embeds Analytics in a “Deliberation with Analysis” Decision Support Process
Scenarios that
Illuminate
Vulnerabilities
Robust
Strategy Deliberation
Analysis Deliberation
with Analysis
Participatory
Scoping
Scenario Exploration
and Discovery
Decision support recognizes that
decision processes at least as
important as decision products
Key elements of RDM process
include:
1.Scenarios that illuminate
vulnerabilities of plans
2.New or modified plans that address
these vulnerabilities
3.Tradeoff curves that help decision
makers choose robust strategies
New Options
Case
Generation Tradeoff Analysis

28
Decision Structuring: Work with Decision Stakeholders to Define Objectives/Parameters
1. Decision Structuring
Deliberation with Stakeholders
• Metrics that reflect decision makers’ goals
• Management strategies (levers) considered to pursue goals
• Uncertain factors that may affect ability to reach goals
• Relationships among metrics, levers, and uncertainties
Information needed to organize
simulation modeling
Also called “XLRM”

29
Case Generation: Evaluate Strategy in Each of Many Plausible Futures
2. Case Generation
Simulating Futures
Large database of simulations
model results
(each element shows
performance of a strategy in one future)
• Strategy
• Plausible assumptions
• Potential outcomes
100s/1000s of cases
30
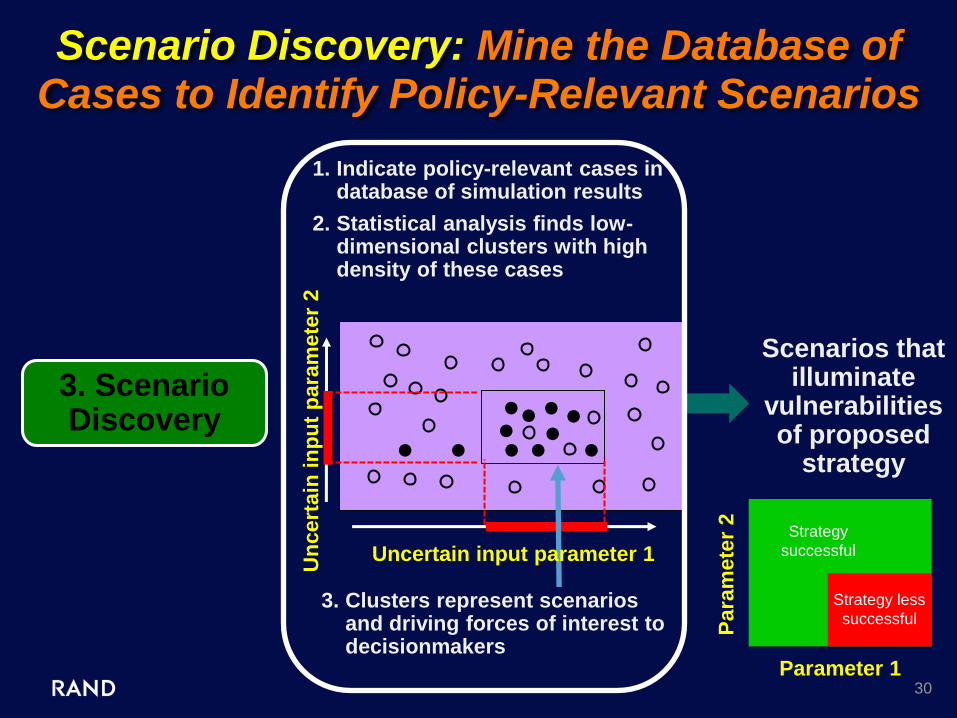
Scenario Discovery: Mine the Database of Cases to Identify Policy-Relevant Scenarios
Scenarios that illuminate
vulnerabilities of proposed
strategy
3. Scenario Discovery . . .. . . . . . . .
Un
cert
ain
in
pu
t p
ara
mete
r 2
1. Indicate policy-relevant cases in database of simulation results
2. Statistical analysis finds low-dimensional clusters with high density of these cases
3. Clusters represent scenarios and driving forces of interest to decisionmakers
Uncertain input parameter 1
Parameter 1
Para
mete
r 2
Strategy
successful
Strategy less
successful

31
Tradeoff Analysis: Help Decision-makers to Compare Tradeoff Among Strategies
Robust strategy or
information to enable
decision-makers to make more
robust strategy
4. Tradeoff Analysis
Visualization helps decision-makers
compare strategies

32
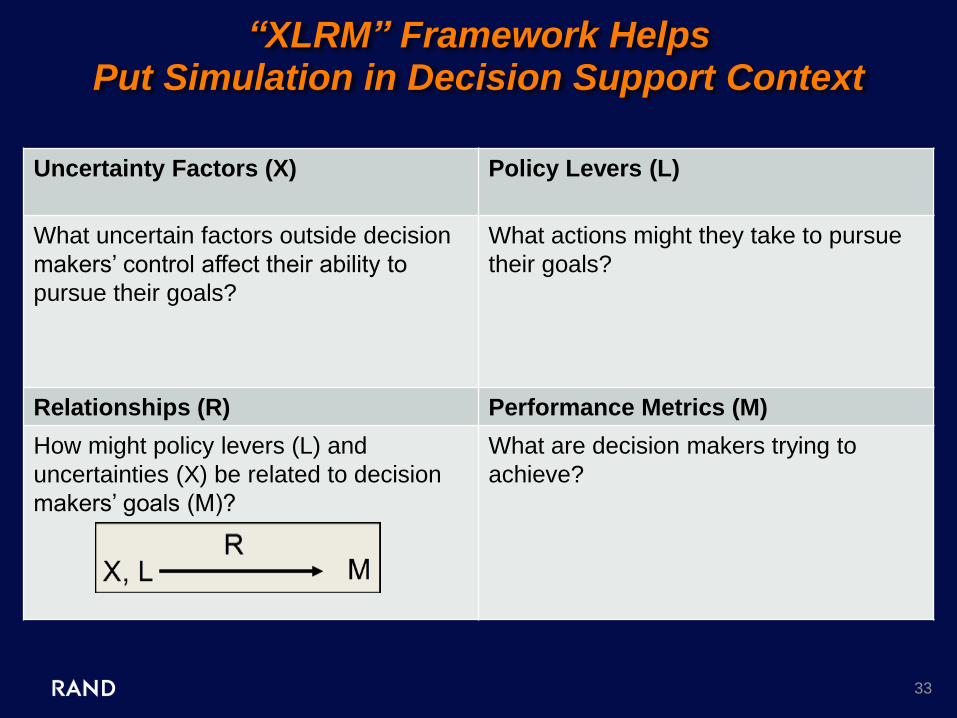
“XLRM” Framework Helps Put Simulation in Decision Support Context
Uncertainty Factors (X) Policy Levers (L)
What uncertain factors outside decision
makers’ control affect their ability to
pursue their goals?
What actions might they take to pursue
their goals?
Relationships (R) Performance Metrics (M)
What are decision makers trying to
achieve?
33
“XLRM” Framework Helps Put Simulation in Decision Support Context
Uncertainty Factors (X) Policy Levers (L)
What uncertain factors outside decision
makers’ control affect their ability to
pursue their goals?
What actions might they take to pursue
their goals?
Relationships (R) Performance Metrics (M)
How might policy levers (L) and
uncertainties (X) be related to decision
makers’ goals (M)?
What are decision makers trying to
achieve?

34
“XLRM” Framework for the Colorado River Basin Study
Uncertain Factors (X) Options and Strategies (L)
Demand Conditions (6)
Supply Conditions (4)
• Observed Resampled (103 traces)
• Paleo Resampled (1,244 traces)
• Paleo Conditioned (500 traces)
• Downscaled GCM Projected (112
traces)
System Operations Conditions (2)
Options for demand reduction
and supply augmentation (40)
Portfolios of many options
designed to adjust over time in
response to new information (4)
• Near-term actions
• Signposts
• Contingent actions
Relationships or Models (R) Performance Metrics (M)
Colorado River Simulation
System (CRSS)
• Water delivery (5)
• Electric power (3),
Recreation (11), Ecological
(5), Water quality (1), and
Flood control (1)
35
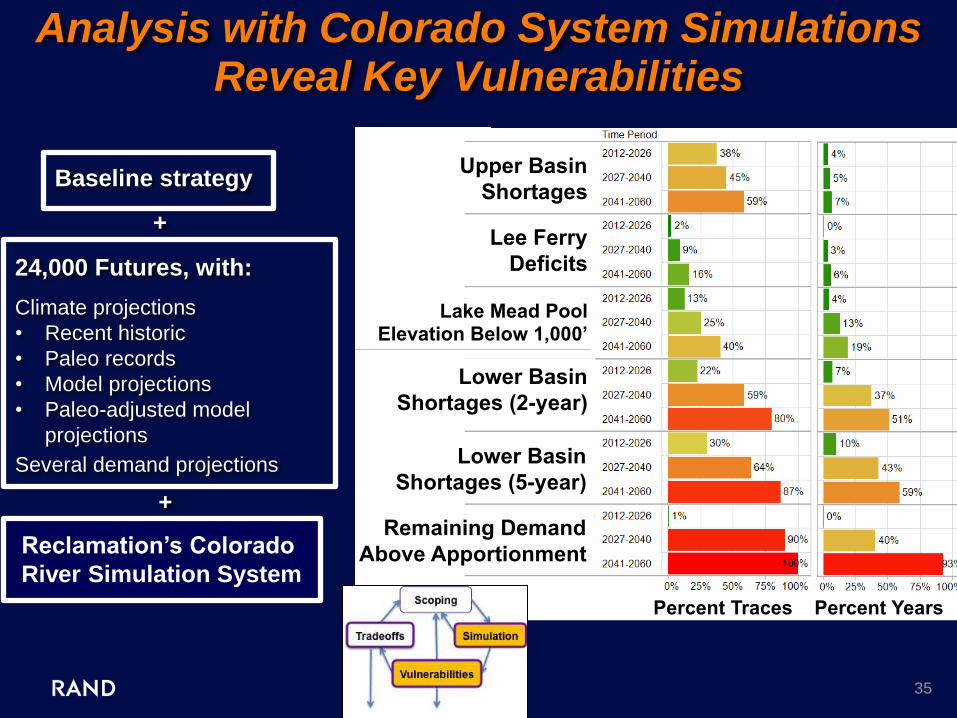
24,000 Futures, with:
Climate projections
• Recent historic
• Paleo records
• Model projections
• Paleo-adjusted model
projections
Several demand projections
Analysis with Colorado System Simulations Reveal Key Vulnerabilities
Upper Basin
Shortages
Lee Ferry
Deficits
Lake Mead Pool Elevation Below 1,000’
Lower Basin
Shortages (2-year)
Lake Mead Pool Elevation Below 1,000’
Lower Basin
Shortages (5-year)
Remaining Demand
Above Apportionment
Percent Traces Percent Years
+
Baseline strategy
+
Reclamation’s Colorado
River Simulation System

36
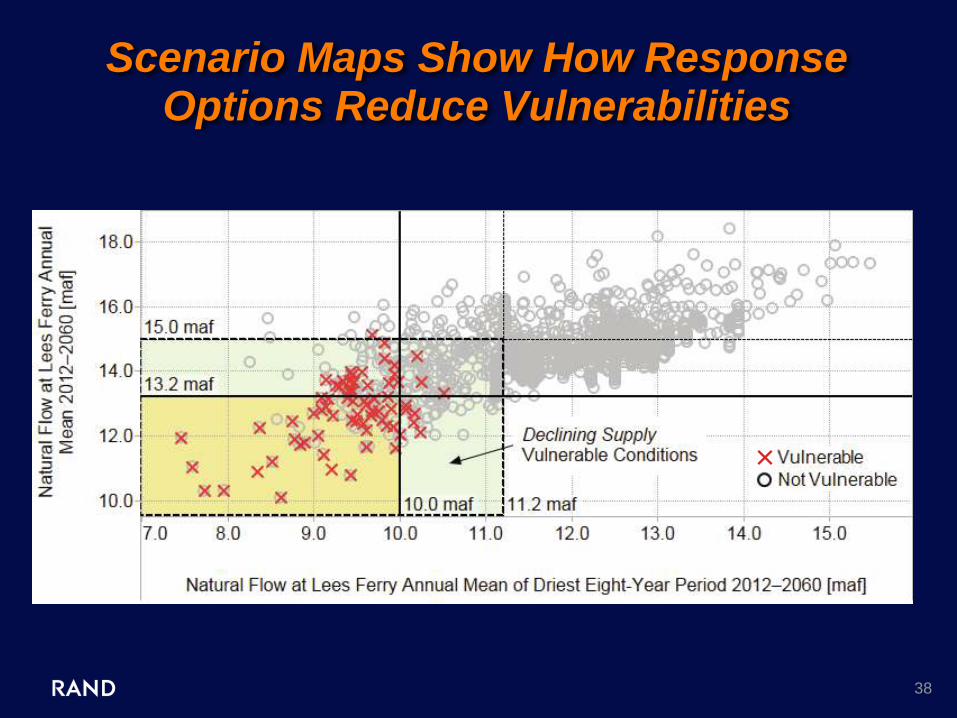
Scenarios Illuminate Vulnerabilities of Plan
Lee Ferry Deficit Vulnerability
Mean Annual Natural Flow during Driest 8 Years (maf)
11.2 maf
13.8 maf

37
Response Options Reduce Key Vulnerabilities
Upper Basin
Shortages
Lee Ferry
Deficits
Lower Basin Shortages
(2-year)
Lake Mead Pool Elevation
Below 1,000’
Lower Basin Shortages
(5-year)
Remaining Demand
Above Apportionment
38
Scenario Maps Show How Response Options Reduce Vulnerabilities

39
Initial Actions
(dependent
on beliefs)
Initial Actions
Contingent
Actions
Common Options
Strategy
Analysis Supports Consideration of Near- and Longer-Term Actions
40
Outline
• Do the Analysis Backwards
– Inland Empire Utilities Agency
• Embed analysis in process of stakeholder
engagement
– Colorado River Basin Supply and Demand Study
• How Can You Use RDM?

41
RDM Uses Exploratory, Rather Than Consolidative, Models
• Consolidative models:
– Bring together all relevant knowledge into a single package
which, once validated, can be used as a surrogate for the real
world
– Aim to provide predictions
• Exploratory models:
– Map assumptions onto consequences, without privileging any
one set of assumptions
– Cannot be validated
– Aim to provide large databases of simulation results that can
be used to inform policy choices
Bankes (1993); Weaver et. al. (2013)
42
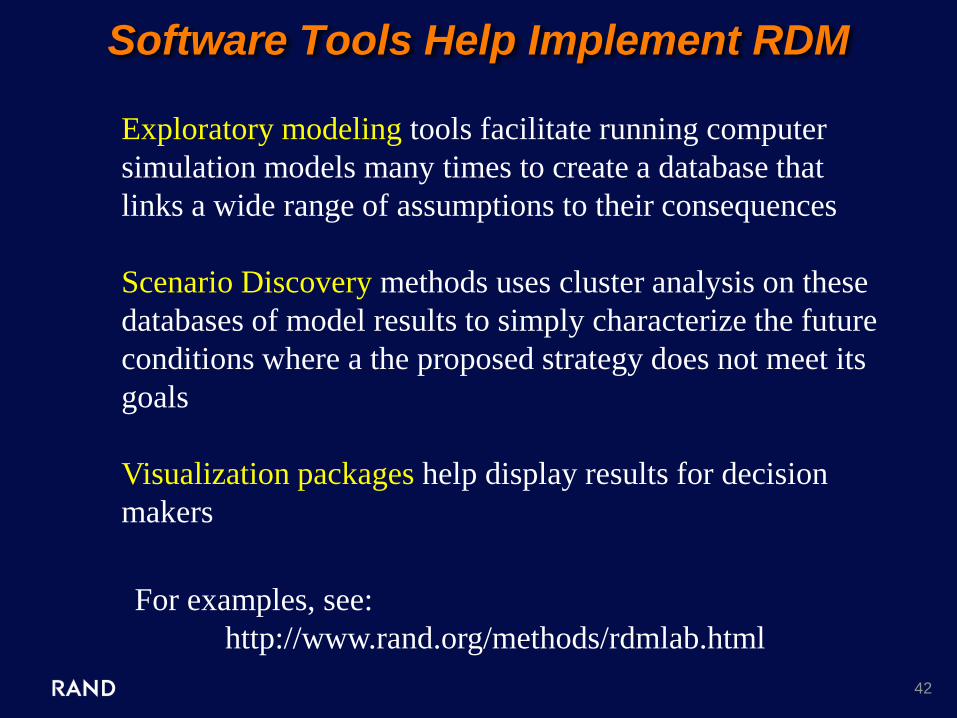
Software Tools Help Implement RDM
Exploratory modeling tools facilitate running computer
simulation models many times to create a database that
links a wide range of assumptions to their consequences
Scenario Discovery methods uses cluster analysis on these
databases of model results to simply characterize the future
conditions where a the proposed strategy does not meet its
goals
Visualization packages help display results for decision
makers
For examples, see:
http://www.rand.org/methods/rdmlab.html

43
RDM Considers Sets of Alterative Probability Distributions
EV = r x( )ò V s, x( )dx
Expected value of strategy s for distribution r(x) is given by
HARD
1.Choosing what strategies to consider
2.Choosing what futures to consider
3.Calculating the performance of strategy s in some
future x
4.Knowing – and convincing other people that you know –
the true probability distribution
EASY
•Calculating the integral for any once you have 1-3
above
r x( )
Thus RDM considers many probability distributions over
the set of futures x -- NOT a uniform distribution
V s, x( )

44
Some Strategies Are Robust Over a Wide Range of Probability Estimates
This chart: •Shows expected cost to taxpayers from re-authorizing U.S. Terrorism Risk Insurance Act •Quoted on floor of US Senate by a proponent •Called “insidious” by opponents •Usefully informed Congressional debate
CBO, Treasury
Assumption
RAND, MG-679-CTRMP

45
How Can You Use RDM?
• RDM can help inform flexible and robust plans that
manage climate and other uncertainties
• Rests on straightforward concept
Stress test plans against wide range of futures
• To implement RDM’s “backwards” analysis:
1. Identify ‘XLRM’ factors
2. Run your planning models for many different futures
3. Use statistics and visualization on database of runs to
identify vulnerable scenarios and robust responses
http://www.rand.org/international/pardee/
http://www.rand.org/methods/rdmlab.html

46
Thank you!