Embed Size (px)
Citation preview
Robotics for Powder Sample Preparation
Afonso da Maia Fernandes Ribeiro [email protected]
Instituto Superior Tecnico, Universidade de Lisboa, Lisboa, Portugal
November 2019
Abstract
Unsupervised robots have been accepted in many industries but given the delicate nature of thepharmaceutical product, this sector is a late adopter. However, the benefits that this technology canbring to pharmaceutical companies across all stages of drug development are promoting the growthof laboratory automation, in the context of Pharma 4.0.. Due to the complexity and importance ofpowder dispensing for drug manufacturing, many bulk solid handling solutions have emerged, but nonehas proven ideal for all applications. The main goal was to implement an automatic powder dosingand sample creation platform flexible enough to be used with a myriad of vessels and in differentlaboratory applications, contributing to the optimization of pharmaceutical development. To this end,two workspaces were designed to and several modules were implemented, two for sample transportation,one for powder dosing , one for weighing and a master to coordinate them. Their software architecturewas developed so to make them versatile to changes. The diverse modules were tested and the overallfunctionality of the system was evaluated under different conditions. It was concluded that the systemcould create powder samples unsupervised with good accuracy and repeatability, and some additionscould lead to the full sampling automation.Keywords: Pharmaceutical Industry, Laboratory Automation, Robotics, Automated Sampling,Powder Dispensing, Small Container Handling
1. Introduction
Automation has been implemented in many ar-eas of industry but due to the delicate nature ofdrug production, this sector is a late adopter. Dueto the product created, the pharmaceutical indus-try has very specific and distinguished character-istics. Since its final product is meant to be usedas medicine, its production is heavily regulated bynorms referred to as Good Manufacturing Practices(GMPs) and Good Laboratory Practices (GLPs).These regulations make sure the quality standardsimposed are fulfilled, in all the stages of drug de-velopment, from drug discovery, to preclinical andclinical research and finally market distribution. Inaddition to these guidelines, the Food and Drug Ad-ministration (FDA) and the European MedicinesAgency (EMA) provide market specific regulations,which further increase the standards for pharma-ceutical companies. This quality assurance is es-pecially important in the case of Contract Devel-opment & Manufacturing Organizations (CDMOs),that manufacture products for different clients andhave large amounts of projects and materials tomanage.
The time-to-market of a drug is often over 10years, giving an idea of the importance of pro-
cess optimisation to minimize error and maximizethroughput. Some of the opportunities for improve-ment in the industry are: slow and ineffective dataflow, time-consuming stock management and mate-rial transport and slow manual preparation of sam-ples, capsules and solutions. All of these issuescould be solved with digitalization and automation,two concepts correlated with Industry 4.0. It is inthis context that the fourth industrial revolution,intertwines with the pharmaceutical sector, a phe-nomenon called Pharma 4.0. The recent automa-tion market brings a myriad of tools for the phar-maceutical industry. In 2005, the western Europeanmarket of laboratory automation was estimated tobe around $245 million, with roughly 20% repre-senting robotics for drug development applications[7]. There is a current trend of automation growthin laboratories. Information tools and databasesprovided by the Laboratory Management Informa-tion System (LIMS) provide means for automatingand integrating tasks [5] and are used to recordand monitor performed analyses. increasing samplethroughput and reducing turnaround times. Dig-italization and simulation allow for better supplychain management and scheduling of activities [3],for example, by predicting product demand [1], re-
1

ducing overall operation costs. As for automation,many systems have emerged from electronic note-books and bar codes to fully automated laborato-ries.
The objective of this work is to implement an au-tomated dispensing platform that was reliable andaccurate enough to work unsupervised. It shouldalso be flexible, so it is applicable not only to sam-pling with different product sources and destina-tions but to other laboratory processes where pow-der dispensing is used.
2. Laboratory Automation Overview
Automation and robotics can promote productiv-ity, facilitate process monitoring and reduce risksand human error. In the pharmaceutical industryspecifically, safety and risk mitigation have greatimportance. Automation can shield the staff fromharm by substituting it in dangerous tasks. Due tothe regulatory entities, process transparency is alsoa concern and digitalization provides a way to makeall data respective to any operation available for in-spection. Another positive aspect of automation isthat it removes human error and allows for incom-parable repeatability. This is especially importantin drug development, since small errors and varia-tions can lead to significant negative effects on thefinal product. Robots also have higher availabilityand often speed and consequently higher through-put. This is further noticed when working with HP-APIs, which has no influence in a robotics environ-ment. One last benefit is that it relieves staff ofrepetitive tasks and allows them to have a supervi-sion role of many operations, while also letting themfocus on tasks that require their cognitive skills.
During drug manufacturing, the product is fre-quently in powder form. Bulk solid dispensing au-tomation emerges in the context of creating sam-ples for testing and providing aid in many othertasks where powder is handled, such as capsule fill-ing, creation of pills and dissolution analyses. Manyanalytical techniques are performed by instrumentswith built-in automation, but that is hardly adapt-able to other processes, meaning there is always aneed for the analyst to bridge the gap between lab-oratory equipment.
Related to this topic of incurable human inter-vention, most tools need the preparation of samplesdone by an analyst so it would be very profitable toany pharmaceutical company to have a system thatis flexible enough sample small volumes of solids andliquids, from different sources and to many destina-tion vessels. While automation of liquid dosing hasbeen widely implemented, powder dispensing, stillpresents some unresolved challenges. Powder sam-ple preparation is a lengthy, repetitive and labor-intensive process. Not only is it a very repetitive
task but some speed and precision are required,making it a great candidate for automation. In 2009a market survey indicated 24% of the respondentsconsidered automation of powder dispensing to be amajor issue in their company and 62% consider theautomation useful to avoid time-consuming man-ual processing and increase productivity [2]. Thesurvey also indicated that most powders used areconsidered problematic. The major concerns aboutautomating solid dispensing are the waste of prod-uct, the minimum dispensed mass, the system ro-bustness and the cross-contamination.
2.1. Powder Flowability PrinciplesParticle size and shape are the most importantproperties in bulk solid behavior [4]. Small non-spherical particles usually present worse flowabil-ity, due to adhesive interparticle forces [8, p. 23-31].Density is related to particle size and has a greatimpact on powder behavior. It is used to computemany metrics to estimate flowability, although noneare considered universally accurate. Electrostaticeffects and humidity also have some importance.This nonexistence of a simple way to determine bulksolid flowability hinders theories of powder flow butdoes not inhibit the dynamic research of dispensingtools in the latest years [9].
2.2. Dispensing Methods and Market SolutionsBelow is a list of the current powder dispensingmethods, none of which has proven to be optimalfor all powders and applications.
• Gravimetric- Mechanically controlled flowfrom a storage container into a destinationplaced in a balance
• Overhead hopper- Dispensed mass is calcu-lated based on the weight loss in the hopper.
• Volumetric- A specific volume is pulled intoand pushed out of a probe and used to computethe mass dispensed based on density.
• Electrically charged pin- A voltage is ap-plied to a pin, attracting powder, and is thenshut off to dispense the powder.
• Pneumatic- Vacuum is created on a thin tubeabsorbing powder into it. Then, a positivepressure is applied, and the powder is pushedout of the tube into the destination.
Many solutions have been invented both for dis-pensing the powder into small vials and for han-dling these and other containers. Designs are basedon a turntable setup for quicker, more accurate dis-pensing and robotic arms for handling tasks such asopening and closing vials. All of them have satisfac-tory dosing precision but often only for free-flowingpowders and only some of them include features to
2

minimize cross-contamination. Another limitationis that most of the platforms are only capable ofhandling vials and not smaller containers such ascrucibles or microplates. Additionally, only a few ofthem are not enclosed and can interact with exter-nal tools. A research showed that these automatedsolutions stall frequently, have trouble dispensinglow volumes of solid and require a large minimumpowder mass. Finally, all off-the-shelf present abig challenge in software integration with exter-nal equipment. They work independently whenperforming their tasks which inhibits automationbetween different instruments. For these reasons,pharmaceutical companies remain skeptical aboutthe automation of powder sampling.
The desired implementation must be modular,so it is usable in other powder dispensing appli-cations besides sampling and flexible to work withother laboratory instruments. The dispensing mod-ule must be effective with different powders andminimize cross-contamination. The transport mod-ule should be adjustable to a myriad of vessels.
3. Implemented SolutionsIn this section, the studied manual sampling opera-tion is explained and the two envisioned automatedworkspaces for sample preparation are presented.The modules implemented for each workspace andtheir components are described in terms of hard-ware. The software implemented is explored interms of tasks and communication and the final ex-perimental setup is presented.
3.1. Task DescriptionIn the studied CDMO, the sampling process thathas considered the most relevant and challengingto automate was the creation of Differential Scan-ning Calorimetry (DSC) samples. These are used inthe screening process of many formulations and pro-vide very useful information for the decision makersduring drug development. This technique is usedto evaluate the Glass Transition Temperature (Tg)and melting temperatures, for example. The DSCruses small powder containers, called crucibles, withonly about 4mg of powder each, composed of a pan,where the powder is dosed into, and a lid, that cov-ers the pan afterwards.
Currently, most of the sample preparation forDSC is made by hand. The analyst places the panand lid in the balance and sets the weight as tare.He then takes the pan out of the balance and dosessome powder into it. He then takes the pan back tothe balance and checks for the powder mass. Thisstep is repeated until a valid mass is reached. Afterthat, the crucible is taken to a sealing press and per-manently closed and sometimes the lid is pierced.The entire process takes around 5 minutes. For themanual process, the following components are nec-
essary: a dispensing tool and source of powder, abalance and a way to register masses, pans, lids anda place for finished samples, a sealing press, tweez-ers and an optional needle.
3.2. Workspace A – Gripper Robot as TransportModule
Based on the robotic arm setups available in themarket, a pick-and-place approach was used in thesample transport, making the system flexible to theaddition of more tools. Given the round shape ofthe containers used, a 3-finger (self-centering grip-per) would be more adequate. Regarding the dis-pensing, this would have to be done by anotherrobot, since the end-effector must be compatiblewith a dispensing tool. As an initial workspace,the design represented in figure 1 was modelled.
Figure 1: Modelled workspace A.
3.3. Workspace B – Carousel as Transport Module
Looking at the market turntable solutions, a differ-ent handling module was designed, a carousel thatwould hold the pans by their rim. The balancewould be integrated in a section of the carousel.This solution reduces flexibility, but it removesthe need for the transport robot. The workspaceoverview of this alternative is shown in 2.
Figure 2: Modelled workspace B.
3.4. Hardware components
The two workspace have the same master, dis-pensing module and weighing module but differenttransport modules. The hardware components usedin each module are presented in this section.
3

3.4.1 Gripper robot
The robots used are from Epson, model T3 401SSCARA. It has three revolute joints and one pris-matic joint giving it 4 degrees of freedom: positionin x, y and z and rotation in z. As imporant speci-fications, the load capacity is 1kg and the repeata-bility is 0.02mm (horizontal and vertical).
Due to its availability and simplicity to imple-ment, an Arduino UNO was used to control thestepper motor drivers. Due to the low forces andspeeds but high precision required for the desiredtasks, a small stepper motor was adequate. A28BYJ-48 stepper motor with a ULN2003 driverboard were used. As notable specifications, the stepangle is 11.25◦/64 and its gear ratio is 64 : 1 givingit a minimum shaft rotation angle of 0.176◦.
Given the small dimensions of the crucibles, mar-ket grippers were not adequate, so a prototype ofa gripper was created and is shown in figure 3. A
Figure 3: Modelled and manufactured 3-finger gripper.
planetary gear design was used, requiring only onerotating motion (provided by the stepper motor)to move three fingers in a curved trajectory to thecenter, facilitating the centering and grabbing ofthe parts. The stepper motor used coupled witha gear ratio of 2 means every step of the motoris about 0.043mm of finger travel distance (around1.3% of the radius of the parts to grab). The gripperparts were manufactured and assembled and thenattached to the robot’s shaft.
To avoid the need for the gripper to pick up theparts from a flat surface, some trays were madeby additive manufacturing (illustrated in figure 4.They have specifically designed slots to be compat-ible with the gripper’s fingers.
Figure 4: Crucible tray.
3.4.2 Carousel
The DSCr compatible disk was manufactured totransport the pans in holes with a specific diameterthat hold the pans by their rims. The movementof this disk is provided by a stepper motor con-trolled by an Arduino. The described componentsare shown in figure 5.
Figure 5: Modelled and manufactured carousel and conicalpart used to push the pans up.
The objective of having the pans protruding outof the disk’s bottom, is to be able to weigh them.With a specifically designed part, every individualpan is pushed up as it goes over the balance, allow-ing their mass to be measured.
3.4.3 Powder Gun and Vacuum Generator
Because of its immediate availability in the lab, thedispensing method used was pneumatic, a powdergun illustrated in figure 6. This tool is connectedto a Venturi vacuum generator that converts com-pressed air into vacuum to absorb powder until aswitch is pressed, which makes the compressed airby-pass the Venturi system and thereby forcing airout. The manual foot switch was disassembled andreplaced by a relay. The pressure of the compressedair and vacuum fed to the powder gun can be man-ually regulated. The powder gun is composed oftwo parts with thin hollow tubes at their tips, withvery close diameters. At the end of the smallesttube, a filter is inserted, to let air through and notpowder. This smaller tube is then inserted in thelarger tube, creating a chamber with only one inlet.The powder is sucked inside the larger tube until ithits the filter. The dispensing range is from 1mgto 10g but must be adjusted manually. An adapterwas designed and manufactured by additive man-ufacturing in order to fix the powder gun to therobot, and is shown in figure 6.
Figure 6: Powder gun attached and its adapter.
4
Two smaller components were added to this mod-ule, an anti-static ring that minimizes static elec-tricity with and a paint brush to remove excess pow-der from the tip of the powder gun.
3.4.4 Raspberry Pi and MX5 BalanceIn terms of communication in the workspace, therewould be a master that dictates the tasks to runduring the sampling. To create the link betweenall the slaves, one option was to use a componentfrom the transport module and the other is to havean external device. Since flexibility was always aconcern, a separate device was opted to be master,a Raspberry Pi.
The weighing of the powder mass used in a DSCsample must be very accurate. For this reasoning,the MX5 microbalance from Mettler Toledo wasused as the weighing module, since it was the small-est balance available with the required precision.
3.5. Software ArchitectureIn this section, the algorithm for each module is ex-plained. Transport module B can directly influencethe weighing and dispensing modules’ operations,while transport module A is easy to troubleshootseparately. To improve experiment validity whentesting the complete system, the master-slaves ar-chitecture implemented in the laboratory was theone designed for workspace A.
The components attached to the robots only needto communicate with them and not with the master,since they are only activated when the robots arein specific positions. Using a cascade setup, themaster-slaves setup is illustrated in figure 7.
Figure 7: Master-Salves cascade setup.
This methodology makes it easier to separateeach module for testing. To note are the colorsused for each component, used in the below pre-sented flowcharts for an easier understanding of theinvolved components in each step.
3.5.1 Weighing ModuleThe MX5 balance operates in MT SICS program-ming language. The master sends commands in theform of strings and the balance responds with otherstrings. The commands used are the orders to zero
the balance, tare the balance and return the massmeasured.
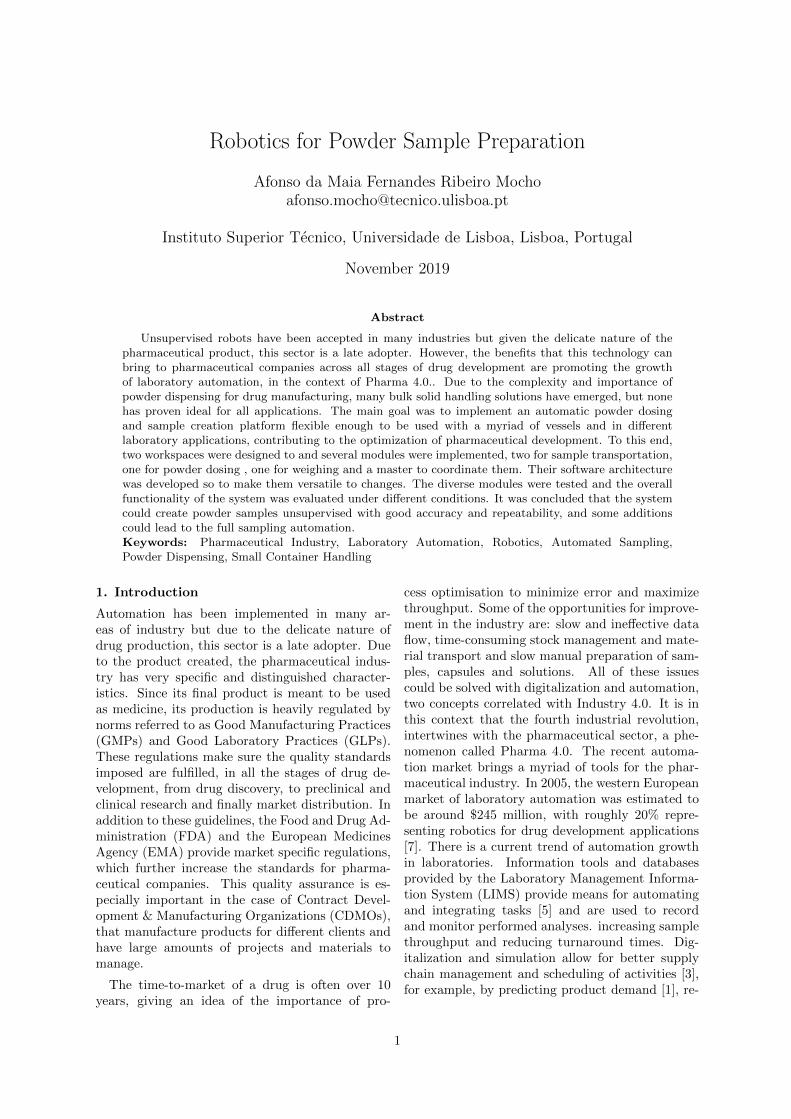
3.5.2 MasterThe master’s program was coded in Python 3 lan-guage and is designed to coordinate the top-levelslaves present in the workspace. First, the masterestablishes communications with the slaves, zeroesthe balance and homes the two robots. It then ini-tiates the sampling sequence, illustrated in figure 8.
Figure 8: Master flowchart.
The balance is used as a sensor to determineif the transport module was successful in placingthe parts. After the dispensing module runs, theamount of powder dispensed is either too small andanother dispensing run is made, it is in the validrange and the dispensing is successful or it is toolarge and the sample must be discarded. In the twolater cases, the transport module is ordered to takethe sample from the balance to a designated loca-tion. The ’increment ... fails’ give the system aspecific amount of times to attempt a task beforea human needs to intervene (labelled as ’STOP’ ).The command sent from the master to the robots to
5
adjust coordinates is used so the transport modulesgrabs parts from a new tray slot (getting a new setof pan and lid) and so the dispensing module ab-sorbs powder from a slightly different location.
3.5.3 Dispensing ModuleThis module’s loop routine starts with the master’sorder to dispense powder until the right amount ofmass is reached. The robot takes powder from thesource and moves to the balance. It then lowersthe powder gun to the pan and activates the relay,dispensing powder into the pan. It ends with therobot travelling to its home position and receivingthe order to adjust its coordinates for a new run.
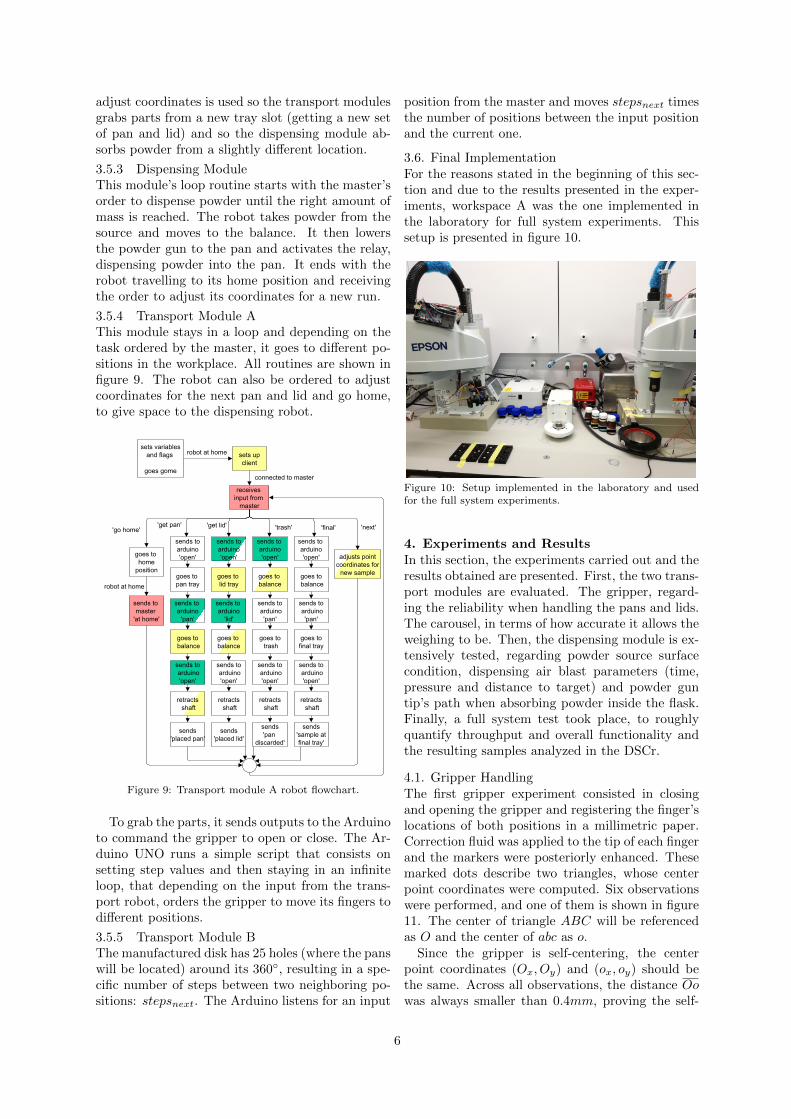
3.5.4 Transport Module AThis module stays in a loop and depending on thetask ordered by the master, it goes to different po-sitions in the workplace. All routines are shown infigure 9. The robot can also be ordered to adjustcoordinates for the next pan and lid and go home,to give space to the dispensing robot.
Figure 9: Transport module A robot flowchart.
To grab the parts, it sends outputs to the Arduinoto command the gripper to open or close. The Ar-duino UNO runs a simple script that consists onsetting step values and then staying in an infiniteloop, that depending on the input from the trans-port robot, orders the gripper to move its fingers todifferent positions.
3.5.5 Transport Module BThe manufactured disk has 25 holes (where the panswill be located) around its 360◦, resulting in a spe-cific number of steps between two neighboring po-sitions: stepsnext. The Arduino listens for an input
position from the master and moves stepsnext timesthe number of positions between the input positionand the current one.
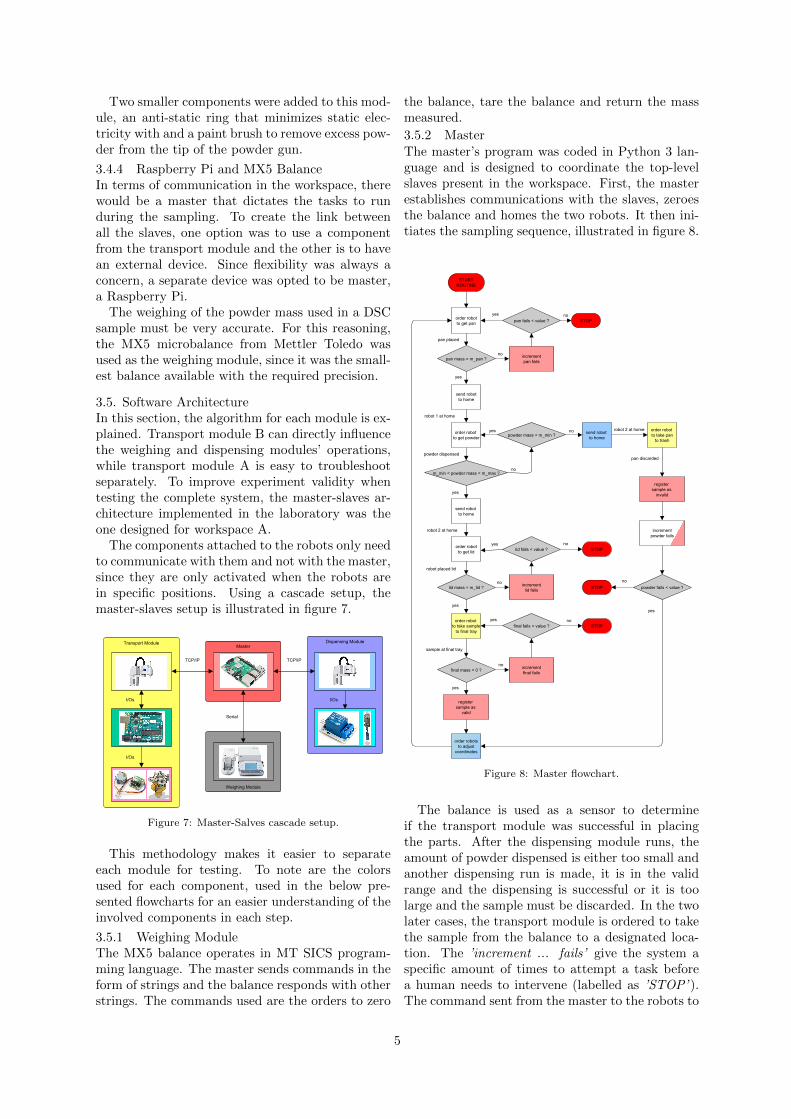
3.6. Final ImplementationFor the reasons stated in the beginning of this sec-tion and due to the results presented in the exper-iments, workspace A was the one implemented inthe laboratory for full system experiments. Thissetup is presented in figure 10.
Figure 10: Setup implemented in the laboratory and usedfor the full system experiments.
4. Experiments and ResultsIn this section, the experiments carried out and theresults obtained are presented. First, the two trans-port modules are evaluated. The gripper, regard-ing the reliability when handling the pans and lids.The carousel, in terms of how accurate it allows theweighing to be. Then, the dispensing module is ex-tensively tested, regarding powder source surfacecondition, dispensing air blast parameters (time,pressure and distance to target) and powder guntip’s path when absorbing powder inside the flask.Finally, a full system test took place, to roughlyquantify throughput and overall functionality andthe resulting samples analyzed in the DSCr.
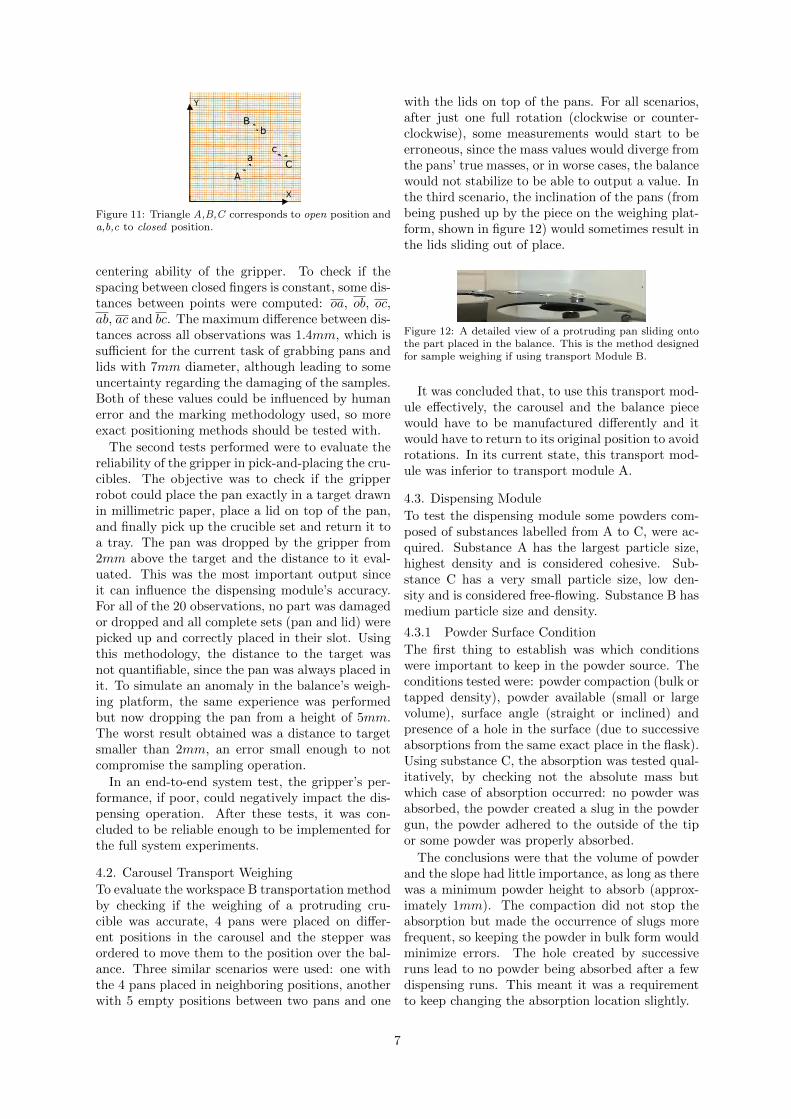
4.1. Gripper HandlingThe first gripper experiment consisted in closingand opening the gripper and registering the finger’slocations of both positions in a millimetric paper.Correction fluid was applied to the tip of each fingerand the markers were posteriorly enhanced. Thesemarked dots describe two triangles, whose centerpoint coordinates were computed. Six observationswere performed, and one of them is shown in figure11. The center of triangle ABC will be referencedas O and the center of abc as o.
Since the gripper is self-centering, the centerpoint coordinates (Ox, Oy) and (ox, oy) should bethe same. Across all observations, the distance Oowas always smaller than 0.4mm, proving the self-
6
X
XXX
X X
YYY
Y Y Y2 3
65
A
B
Ca
b
c
Figure 11: Triangle A,B,C corresponds to open position anda,b,c to closed position.
centering ability of the gripper. To check if thespacing between closed fingers is constant, some dis-tances between points were computed: oa, ob, oc,ab, ac and bc. The maximum difference between dis-tances across all observations was 1.4mm, which issufficient for the current task of grabbing pans andlids with 7mm diameter, although leading to someuncertainty regarding the damaging of the samples.Both of these values could be influenced by humanerror and the marking methodology used, so moreexact positioning methods should be tested with.
The second tests performed were to evaluate thereliability of the gripper in pick-and-placing the cru-cibles. The objective was to check if the gripperrobot could place the pan exactly in a target drawnin millimetric paper, place a lid on top of the pan,and finally pick up the crucible set and return it toa tray. The pan was dropped by the gripper from2mm above the target and the distance to it eval-uated. This was the most important output sinceit can influence the dispensing module’s accuracy.For all of the 20 observations, no part was damagedor dropped and all complete sets (pan and lid) werepicked up and correctly placed in their slot. Usingthis methodology, the distance to the target wasnot quantifiable, since the pan was always placed init. To simulate an anomaly in the balance’s weigh-ing platform, the same experience was performedbut now dropping the pan from a height of 5mm.The worst result obtained was a distance to targetsmaller than 2mm, an error small enough to notcompromise the sampling operation.
In an end-to-end system test, the gripper’s per-formance, if poor, could negatively impact the dis-pensing operation. After these tests, it was con-cluded to be reliable enough to be implemented forthe full system experiments.
4.2. Carousel Transport Weighing
To evaluate the workspace B transportation methodby checking if the weighing of a protruding cru-cible was accurate, 4 pans were placed on differ-ent positions in the carousel and the stepper wasordered to move them to the position over the bal-ance. Three similar scenarios were used: one withthe 4 pans placed in neighboring positions, anotherwith 5 empty positions between two pans and one
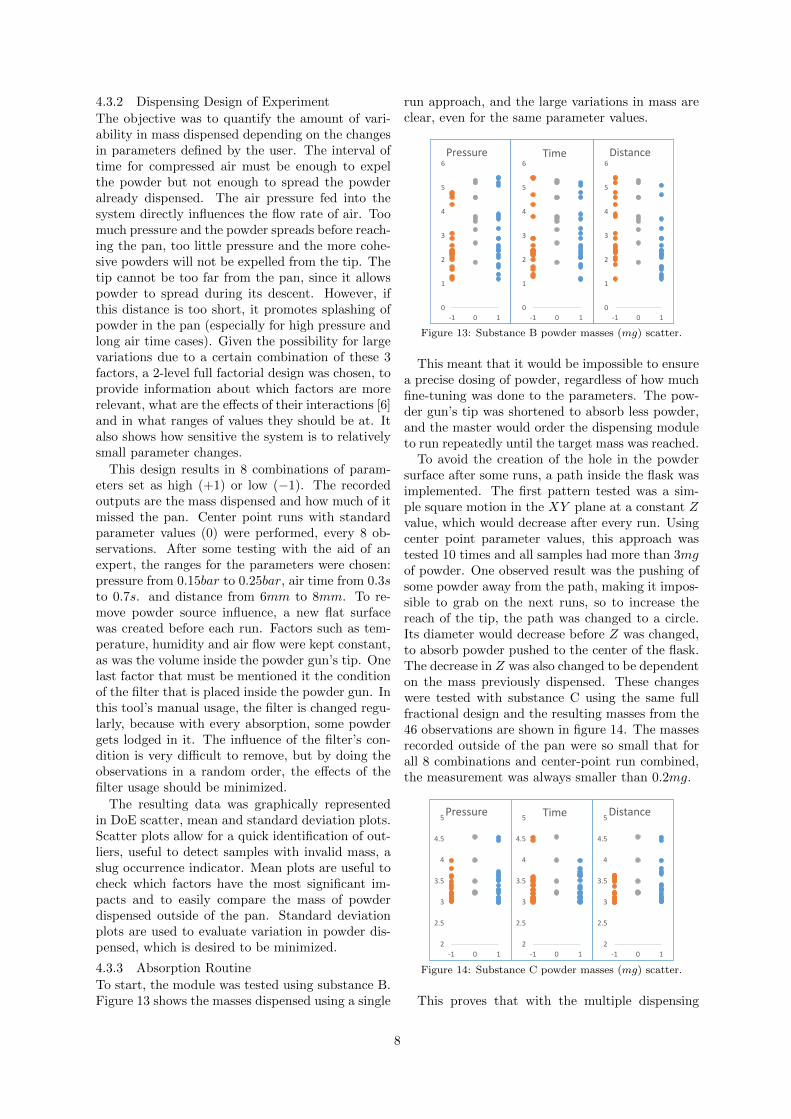
with the lids on top of the pans. For all scenarios,after just one full rotation (clockwise or counter-clockwise), some measurements would start to beerroneous, since the mass values would diverge fromthe pans’ true masses, or in worse cases, the balancewould not stabilize to be able to output a value. Inthe third scenario, the inclination of the pans (frombeing pushed up by the piece on the weighing plat-form, shown in figure 12) would sometimes result inthe lids sliding out of place.
Figure 12: A detailed view of a protruding pan sliding ontothe part placed in the balance. This is the method designedfor sample weighing if using transport Module B.
It was concluded that, to use this transport mod-ule effectively, the carousel and the balance piecewould have to be manufactured differently and itwould have to return to its original position to avoidrotations. In its current state, this transport mod-ule was inferior to transport module A.
4.3. Dispensing Module
To test the dispensing module some powders com-posed of substances labelled from A to C, were ac-quired. Substance A has the largest particle size,highest density and is considered cohesive. Sub-stance C has a very small particle size, low den-sity and is considered free-flowing. Substance B hasmedium particle size and density.
4.3.1 Powder Surface Condition
The first thing to establish was which conditionswere important to keep in the powder source. Theconditions tested were: powder compaction (bulk ortapped density), powder available (small or largevolume), surface angle (straight or inclined) andpresence of a hole in the surface (due to successiveabsorptions from the same exact place in the flask).Using substance C, the absorption was tested qual-itatively, by checking not the absolute mass butwhich case of absorption occurred: no powder wasabsorbed, the powder created a slug in the powdergun, the powder adhered to the outside of the tipor some powder was properly absorbed.
The conclusions were that the volume of powderand the slope had little importance, as long as therewas a minimum powder height to absorb (approx-imately 1mm). The compaction did not stop theabsorption but made the occurrence of slugs morefrequent, so keeping the powder in bulk form wouldminimize errors. The hole created by successiveruns lead to no powder being absorbed after a fewdispensing runs. This meant it was a requirementto keep changing the absorption location slightly.
7
4.3.2 Dispensing Design of Experiment
The objective was to quantify the amount of vari-ability in mass dispensed depending on the changesin parameters defined by the user. The interval oftime for compressed air must be enough to expelthe powder but not enough to spread the powderalready dispensed. The air pressure fed into thesystem directly influences the flow rate of air. Toomuch pressure and the powder spreads before reach-ing the pan, too little pressure and the more cohe-sive powders will not be expelled from the tip. Thetip cannot be too far from the pan, since it allowspowder to spread during its descent. However, ifthis distance is too short, it promotes splashing ofpowder in the pan (especially for high pressure andlong air time cases). Given the possibility for largevariations due to a certain combination of these 3factors, a 2-level full factorial design was chosen, toprovide information about which factors are morerelevant, what are the effects of their interactions [6]and in what ranges of values they should be at. Italso shows how sensitive the system is to relativelysmall parameter changes.
This design results in 8 combinations of param-eters set as high (+1) or low (−1). The recordedoutputs are the mass dispensed and how much of itmissed the pan. Center point runs with standardparameter values (0) were performed, every 8 ob-servations. After some testing with the aid of anexpert, the ranges for the parameters were chosen:pressure from 0.15bar to 0.25bar, air time from 0.3sto 0.7s. and distance from 6mm to 8mm. To re-move powder source influence, a new flat surfacewas created before each run. Factors such as tem-perature, humidity and air flow were kept constant,as was the volume inside the powder gun’s tip. Onelast factor that must be mentioned it the conditionof the filter that is placed inside the powder gun. Inthis tool’s manual usage, the filter is changed regu-larly, because with every absorption, some powdergets lodged in it. The influence of the filter’s con-dition is very difficult to remove, but by doing theobservations in a random order, the effects of thefilter usage should be minimized.
The resulting data was graphically representedin DoE scatter, mean and standard deviation plots.Scatter plots allow for a quick identification of out-liers, useful to detect samples with invalid mass, aslug occurrence indicator. Mean plots are useful tocheck which factors have the most significant im-pacts and to easily compare the mass of powderdispensed outside of the pan. Standard deviationplots are used to evaluate variation in powder dis-pensed, which is desired to be minimized.
4.3.3 Absorption Routine
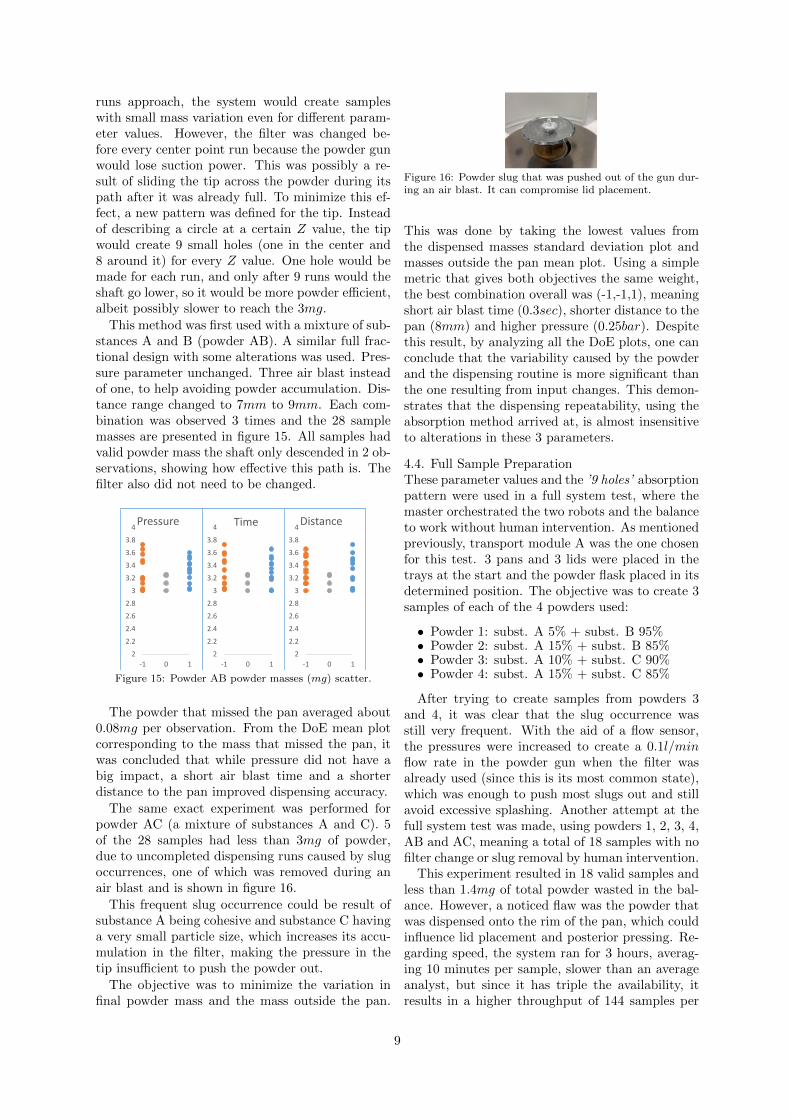
To start, the module was tested using substance B.Figure 13 shows the masses dispensed using a single
run approach, and the large variations in mass areclear, even for the same parameter values.
methocel
mass
mean
stdev
0
1
2
3
4
5
6
-1 0 1
Pressure
0
1
2
3
4
5
6
-1 0 1
Time
0
1
2
3
4
5
6
-1 0 1
Distance
2
2.2
2.4
2.6
2.8
3
3.2
3.4
3.6
3.8
4
-1 0 1
Pressure
2
2.2
2.4
2.6
2.8
3
3.2
3.4
3.6
3.8
4
-1 0 1
Time
2
2.2
2.4
2.6
2.8
3
3.2
3.4
3.6
3.8
4
-1 0 1
Distance
0
0.2
0.4
0.6
0.8
1
1.2
1.4
1.6
1.8
2
-1 0 1
Pressure
0
0.2
0.4
0.6
0.8
1
1.2
1.4
1.6
1.8
2
-1 0 1
Time
0
0.2
0.4
0.6
0.8
1
1.2
1.4
1.6
1.8
2
-1 0 1
Distance
Figure 13: Substance B powder masses (mg) scatter.
This meant that it would be impossible to ensurea precise dosing of powder, regardless of how muchfine-tuning was done to the parameters. The pow-der gun’s tip was shortened to absorb less powder,and the master would order the dispensing moduleto run repeatedly until the target mass was reached.
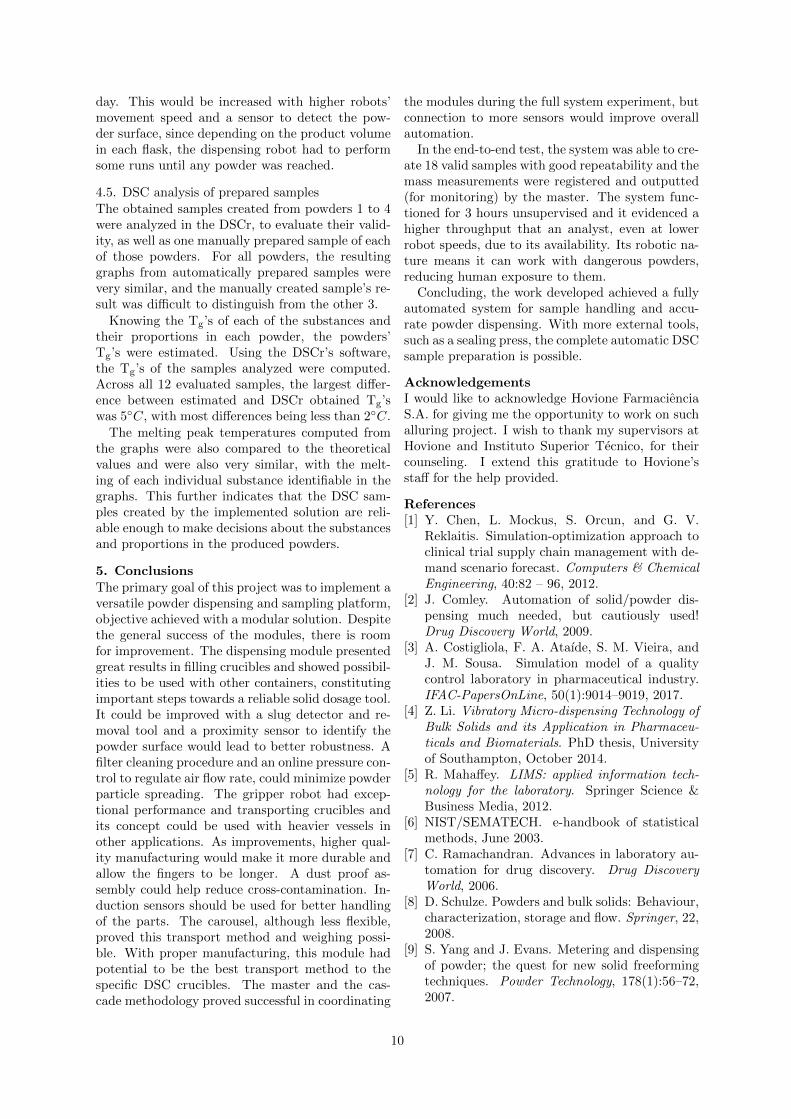
To avoid the creation of the hole in the powdersurface after some runs, a path inside the flask wasimplemented. The first pattern tested was a sim-ple square motion in the XY plane at a constant Zvalue, which would decrease after every run. Usingcenter point parameter values, this approach wastested 10 times and all samples had more than 3mgof powder. One observed result was the pushing ofsome powder away from the path, making it impos-sible to grab on the next runs, so to increase thereach of the tip, the path was changed to a circle.Its diameter would decrease before Z was changed,to absorb powder pushed to the center of the flask.The decrease in Z was also changed to be dependenton the mass previously dispensed. These changeswere tested with substance C using the same fullfractional design and the resulting masses from the46 observations are shown in figure 14. The massesrecorded outside of the pan were so small that forall 8 combinations and center-point run combined,the measurement was always smaller than 0.2mg.
copovidone
masses
mean
st dev
2
2.5
3
3.5
4
4.5
5
-1 0 1
Pressure
2
2.5
3
3.5
4
4.5
5
-1 0 1
Time
2
2.5
3
3.5
4
4.5
5
-1 0 1
Distance
2
2.2
2.4
2.6
2.8
3
3.2
3.4
3.6
3.8
4
-1 0 1
Pressure
2
2.2
2.4
2.6
2.8
3
3.2
3.4
3.6
3.8
4
-1 0 1
Time
2
2.2
2.4
2.6
2.8
3
3.2
3.4
3.6
3.8
4
-1 0 1
Distance
0
0.1
0.2
0.3
0.4
0.5
0.6
0.7
0.8
0.9
1
-1 0 1
Pressure
0
0.1
0.2
0.3
0.4
0.5
0.6
0.7
0.8
0.9
1
-1 0 1
Time
0
0.1
0.2
0.3
0.4
0.5
0.6
0.7
0.8
0.9
1
-1 0 1
Distance
Figure 14: Substance C powder masses (mg) scatter.
This proves that with the multiple dispensing
8
runs approach, the system would create sampleswith small mass variation even for different param-eter values. However, the filter was changed be-fore every center point run because the powder gunwould lose suction power. This was possibly a re-sult of sliding the tip across the powder during itspath after it was already full. To minimize this ef-fect, a new pattern was defined for the tip. Insteadof describing a circle at a certain Z value, the tipwould create 9 small holes (one in the center and8 around it) for every Z value. One hole would bemade for each run, and only after 9 runs would theshaft go lower, so it would be more powder efficient,albeit possibly slower to reach the 3mg.
This method was first used with a mixture of sub-stances A and B (powder AB). A similar full frac-tional design with some alterations was used. Pres-sure parameter unchanged. Three air blast insteadof one, to help avoiding powder accumulation. Dis-tance range changed to 7mm to 9mm. Each com-bination was observed 3 times and the 28 samplemasses are presented in figure 15. All samples hadvalid powder mass the shaft only descended in 2 ob-servations, showing how effective this path is. Thefilter also did not need to be changed.
powder 2
mass
mean
stdev
2
2.2
2.4
2.6
2.8
3
3.2
3.4
3.6
3.8
4
-1 0 1
Pressure
2
2.2
2.4
2.6
2.8
3
3.2
3.4
3.6
3.8
4
-1 0 1
Time
2
2.2
2.4
2.6
2.8
3
3.2
3.4
3.6
3.8
4
-1 0 1
Distance
2
2.2
2.4
2.6
2.8
3
3.2
3.4
3.6
3.8
4
-1 0 1
Pressure
2
2.2
2.4
2.6
2.8
3
3.2
3.4
3.6
3.8
4
-1 0 1
Time
2
2.2
2.4
2.6
2.8
3
3.2
3.4
3.6
3.8
4
-1 0 1
Distance
0
0.1
0.2
0.3
0.4
0.5
0.6
0.7
0.8
0.9
1
-1 0 1
Pressure
0
0.1
0.2
0.3
0.4
0.5
0.6
0.7
0.8
0.9
1
-1 0 1
Time
0
0.1
0.2
0.3
0.4
0.5
0.6
0.7
0.8
0.9
1
-1 0 1
Distance
Figure 15: Powder AB powder masses (mg) scatter.
The powder that missed the pan averaged about0.08mg per observation. From the DoE mean plotcorresponding to the mass that missed the pan, itwas concluded that while pressure did not have abig impact, a short air blast time and a shorterdistance to the pan improved dispensing accuracy.
The same exact experiment was performed forpowder AC (a mixture of substances A and C). 5of the 28 samples had less than 3mg of powder,due to uncompleted dispensing runs caused by slugoccurrences, one of which was removed during anair blast and is shown in figure 16.
This frequent slug occurrence could be result ofsubstance A being cohesive and substance C havinga very small particle size, which increases its accu-mulation in the filter, making the pressure in thetip insufficient to push the powder out.
The objective was to minimize the variation infinal powder mass and the mass outside the pan.
Figure 16: Powder slug that was pushed out of the gun dur-ing an air blast. It can compromise lid placement.
This was done by taking the lowest values fromthe dispensed masses standard deviation plot andmasses outside the pan mean plot. Using a simplemetric that gives both objectives the same weight,the best combination overall was (-1,-1,1), meaningshort air blast time (0.3sec), shorter distance to thepan (8mm) and higher pressure (0.25bar). Despitethis result, by analyzing all the DoE plots, one canconclude that the variability caused by the powderand the dispensing routine is more significant thanthe one resulting from input changes. This demon-strates that the dispensing repeatability, using theabsorption method arrived at, is almost insensitiveto alterations in these 3 parameters.
4.4. Full Sample PreparationThese parameter values and the ’9 holes’ absorptionpattern were used in a full system test, where themaster orchestrated the two robots and the balanceto work without human intervention. As mentionedpreviously, transport module A was the one chosenfor this test. 3 pans and 3 lids were placed in thetrays at the start and the powder flask placed in itsdetermined position. The objective was to create 3samples of each of the 4 powders used:
• Powder 1: subst. A 5% + subst. B 95%• Powder 2: subst. A 15% + subst. B 85%• Powder 3: subst. A 10% + subst. C 90%• Powder 4: subst. A 15% + subst. C 85%
After trying to create samples from powders 3and 4, it was clear that the slug occurrence wasstill very frequent. With the aid of a flow sensor,the pressures were increased to create a 0.1l/minflow rate in the powder gun when the filter wasalready used (since this is its most common state),which was enough to push most slugs out and stillavoid excessive splashing. Another attempt at thefull system test was made, using powders 1, 2, 3, 4,AB and AC, meaning a total of 18 samples with nofilter change or slug removal by human intervention.
This experiment resulted in 18 valid samples andless than 1.4mg of total powder wasted in the bal-ance. However, a noticed flaw was the powder thatwas dispensed onto the rim of the pan, which couldinfluence lid placement and posterior pressing. Re-garding speed, the system ran for 3 hours, averag-ing 10 minutes per sample, slower than an averageanalyst, but since it has triple the availability, itresults in a higher throughput of 144 samples per
9
day. This would be increased with higher robots’movement speed and a sensor to detect the pow-der surface, since depending on the product volumein each flask, the dispensing robot had to performsome runs until any powder was reached.
4.5. DSC analysis of prepared samplesThe obtained samples created from powders 1 to 4were analyzed in the DSCr, to evaluate their valid-ity, as well as one manually prepared sample of eachof those powders. For all powders, the resultinggraphs from automatically prepared samples werevery similar, and the manually created sample’s re-sult was difficult to distinguish from the other 3.
Knowing the Tg’s of each of the substances andtheir proportions in each powder, the powders’Tg’s were estimated. Using the DSCr’s software,the Tg’s of the samples analyzed were computed.Across all 12 evaluated samples, the largest differ-ence between estimated and DSCr obtained Tg’swas 5◦C, with most differences being less than 2◦C.
The melting peak temperatures computed fromthe graphs were also compared to the theoreticalvalues and were also very similar, with the melt-ing of each individual substance identifiable in thegraphs. This further indicates that the DSC sam-ples created by the implemented solution are reli-able enough to make decisions about the substancesand proportions in the produced powders.
5. ConclusionsThe primary goal of this project was to implement aversatile powder dispensing and sampling platform,objective achieved with a modular solution. Despitethe general success of the modules, there is roomfor improvement. The dispensing module presentedgreat results in filling crucibles and showed possibil-ities to be used with other containers, constitutingimportant steps towards a reliable solid dosage tool.It could be improved with a slug detector and re-moval tool and a proximity sensor to identify thepowder surface would lead to better robustness. Afilter cleaning procedure and an online pressure con-trol to regulate air flow rate, could minimize powderparticle spreading. The gripper robot had excep-tional performance and transporting crucibles andits concept could be used with heavier vessels inother applications. As improvements, higher qual-ity manufacturing would make it more durable andallow the fingers to be longer. A dust proof as-sembly could help reduce cross-contamination. In-duction sensors should be used for better handlingof the parts. The carousel, although less flexible,proved this transport method and weighing possi-ble. With proper manufacturing, this module hadpotential to be the best transport method to thespecific DSC crucibles. The master and the cas-cade methodology proved successful in coordinating
the modules during the full system experiment, butconnection to more sensors would improve overallautomation.
In the end-to-end test, the system was able to cre-ate 18 valid samples with good repeatability and themass measurements were registered and outputted(for monitoring) by the master. The system func-tioned for 3 hours unsupervised and it evidenced ahigher throughput that an analyst, even at lowerrobot speeds, due to its availability. Its robotic na-ture means it can work with dangerous powders,reducing human exposure to them.
Concluding, the work developed achieved a fullyautomated system for sample handling and accu-rate powder dispensing. With more external tools,such as a sealing press, the complete automatic DSCsample preparation is possible.
AcknowledgementsI would like to acknowledge Hovione FarmacienciaS.A. for giving me the opportunity to work on suchalluring project. I wish to thank my supervisors atHovione and Instituto Superior Tecnico, for theircounseling. I extend this gratitude to Hovione’sstaff for the help provided.
References[1] Y. Chen, L. Mockus, S. Orcun, and G. V.
Reklaitis. Simulation-optimization approach toclinical trial supply chain management with de-mand scenario forecast. Computers & ChemicalEngineering, 40:82 – 96, 2012.
[2] J. Comley. Automation of solid/powder dis-pensing much needed, but cautiously used!Drug Discovery World, 2009.
[3] A. Costigliola, F. A. Ataıde, S. M. Vieira, andJ. M. Sousa. Simulation model of a qualitycontrol laboratory in pharmaceutical industry.IFAC-PapersOnLine, 50(1):9014–9019, 2017.
[4] Z. Li. Vibratory Micro-dispensing Technology ofBulk Solids and its Application in Pharmaceu-ticals and Biomaterials. PhD thesis, Universityof Southampton, October 2014.
[5] R. Mahaffey. LIMS: applied information tech-nology for the laboratory. Springer Science &Business Media, 2012.
[6] NIST/SEMATECH. e-handbook of statisticalmethods, June 2003.
[7] C. Ramachandran. Advances in laboratory au-tomation for drug discovery. Drug DiscoveryWorld, 2006.
[8] D. Schulze. Powders and bulk solids: Behaviour,characterization, storage and flow. Springer, 22,2008.
[9] S. Yang and J. Evans. Metering and dispensingof powder; the quest for new solid freeformingtechniques. Powder Technology, 178(1):56–72,2007.
10


![Research Article Preparation of Niobium Metal …downloads.hindawi.com/archive/2013/629341.pdfResearch Article Preparation of Niobium Metal Powder by Two-Stage ... process [ ]. Similar](https://img.dokumen.tips/doc/110x75/5aff1d1e7f8b9a434e901a63/research-article-preparation-of-niobium-metal-article-preparation-of-niobium.jpg)
![Collag Pow Quickly dissolving powder nippi for research use Collagen … · 2018-11-27 · Quickly dissolving powder nippi for research use Collagen type t [Features] [Usage] [ Preparation](https://img.dokumen.tips/doc/110x75/5f11864a4c4e4f37e57a31aa/collag-pow-quickly-dissolving-powder-nippi-for-research-use-collagen-2018-11-27.jpg)