Embed Size (px)
Citation preview
Hydraulic Laboratory Report HL-2008-7
Robles Diversion Dam High Flow and Sediment Bypass Structure Ventura, California
U.S. Department of the Interior Bureau of Reclamation September 2008

1
Hydraulic Laboratory Report HL-2008-7
Robles Diversion Dam High Flow and Sediment Bypass Structure Ventura, California Physical Model Study Brent Mefford Hillary Stowell Chuck Heinje

2
Acknowledgments The author would like to thank Mr. Rudy Campbell and Mr Billy Baca for assisting with model design, construction and testing. Mr. Blair Greiman (D86-68540) and Yong Lai (D86-68540) for provided technical support on sediment transport. This report was peer reviewed by Robert Einhellig, (D86-68640).
Hydraulic Laboratory Reports The Hydraulic Laboratory Report series is produced by the Bureau of Reclamation’s Water Resources Research Laboratory (Mail Code D-8560), PO Box 25007, Denver, Colorado 80225-0007. At the time of publication, this report was also made available online at http://www.usbr.gov/pmts/hydraulics_lab/pubs/HL/HL-2008-7.pdf
Disclaimer No warranty is expressed or implied regarding the usefulness or completeness of the information contained in this report. References to commercial products do not imply endorsement by the Bureau of Reclamation and may not be used for advertising or promotional purposes.
Mission Statements
The mission of the Department of the Interior is to protect and provide access to our Nation's natural and cultural heritage and honor our trust responsibilities to Indian Tribes and our commitments to island communities.
___________________________ The mission of the Bureau of Reclamation is to manage, develop, and protect water and related resources in an environmentally and economically sound manner in the interest of the American public.

3
Table of Contents
Robles Diversion Dam Physical Model Study................................................................................ 7 Summary..................................................................................................................................... 7
HFB Spillway Location .......................................................................................................... 7 Service Spillway Performance................................................................................................ 8 HFB Spillway Hydraulic Performance ................................................................................... 8 Fish Passage ............................................................................................................................ 9 Service Spillway Modifications.............................................................................................. 9
Background............................................................................................................................... 10 Model Objective ....................................................................................................................... 11 Study Test Plan ......................................................................................................................... 11 Physical Model ......................................................................................................................... 12 Model Scaling ........................................................................................................................... 14
Sediment Modeling............................................................................................................... 15 River Sediment...................................................................................................... 16 Model Sediment .................................................................................................... 17 Bed Load Rate ...................................................................................................... 17 Time Scale for Sedimentation Process ..................................................................... 17
Hydraulic Structures ................................................................................................................. 18 Model Operation ....................................................................................................................... 19
Simulated Flood Hydrographs .............................................................................................. 20 Model Tests............................................................................................................................... 22
Data Collection ..................................................................................................................... 22 Test Results............................................................................................................................... 22
Two-year Flood with Post-Dam-Removal Sediment Loading, Test Ss6000........................ 23 Ten-Year Flood with Post-Dam-Removal Sediment Loading, Test Ss14000 -.................... 28
High Flow Bypass Spillway ..................................................................................................... 31 Model Test Results for Left Bank HFB Spillway................................................................. 32 HFB-L6000 Test Results ...................................................................................................... 32 HFB-L14000 Test Results .................................................................................................... 38
Model Test Results for HFB Spillway Located Adjacent to the Service Spillway near the Right Bank .......................................................................................................................................... 43
HFB-R6000 Test Results ...................................................................................................... 44 HFB-R14000 Test Results .................................................................................................... 49
Guide Wall Modifications to the Spillway ............................................................................... 54 Fish Passage.............................................................................................................................. 55
Stilling Pool Modifications ................................................................................................... 57 Left Bank Fishway................................................................................................................ 58 Downstream Channel............................................................................................................ 60
Service Spillway Modifications................................................................................................ 60
4
LIST OF FIGURES Figure 1 - View of Robles Diversion Dam from above the right bank......................................... 10 Figure 2 - View of Matilija Dam .................................................................................................. 11 Figure 3 – View of 1:20 scale moveable-bed model of Robles diversion Dam. .......................... 12 Figure 4 - Plan view of model and section showing model upstream boundary weir. ................. 13 Figure 5 – Model and prototype critical shear relationship for sediment. .................................... 15 Figure 6 - Settling velocity for sand particles in water. ................................................................ 16 Figure 7 - Comparison of model and prototype bed material gradation....................................... 17 Figure 8 - View of the service spillway and canal headworks looking downstream................... 19 Figure 9 - Pretest channel bed topography. .................................................................................. 20 Figure 10 - Scaled 6,000 ft3/s peak-flow hydrograph. ................................................................. 21 Figure 11 - Scaled 14,000 ft3/s peak-flow hydrograph. ................................................................ 21 Figure 12 - Photograph of the model showing canal and service spillway. ................................. 22 Figure 13 – Photograph of sediment delta building toward the service spillway......................... 23 Figure 14 – Sediment delta encroaching on the fishway exit at the peak of the Ss6000 test. ...... 24 Figure 15 - Flow velocities measured during peak flow, test Ss6000. ......................................... 25 Figure 16 – Post-test Ss6000 diversion pool bed elevations upstream of diversion dam............. 25 Figure 17 - Post-test sediment deposition photographs for test Ss6000. ...................................... 26 Figure 18 – Gradation of surface sediment samples taken at a cross section 63 ft upstream of the dam axis following test Ss6000. ................................................................................................... 27 Figure 19 – Flow velocities measured during peak flow, test Ss14000........................................ 29 Figure 20 - Post-test Ss14000 diversion pool bed elevations upstream of diversion dam. .......... 30 Figure 21 - Post-test sediment deposition photographs for test Ss14000. .................................... 31 Figure 22 View of HFB spillway bay numbering scheme used in the model. ............................. 31 Figure 23 – HFB spillway plan and sections. ............................................................................... 33 Figure 24 - HFB spillway locations tested in the model............................................................... 33 Figure 25 - Sediment passing through the HFB spillway during the flood peak.......................... 34 Figure 26 - Flow velocities measured during peak flow, test HFB-L6000. ................................. 35 Figure 27 – Post-test HFB-L6000 diversion pool bed elevations upstream of diversion dam. .... 35 Figure 28 – Post-test sediment deposition photographs for test HFB-L6000............................... 36 Figure 29 – Close range photogrammetry-generated plot of final channel elevations for test HFB-L6000. Elevations shown are model referenced to a zero datum at elevation 757.75................. 37 Figure 30 – HFB-L6000 surface sediment gradation sampled along a cross section located 63 ft upstream of the dam axis. ............................................................................................................. 38 Figure 31 - View of sediment filling the HFB stilling basin. ....................................................... 38 Figure 32 - Flow velocities measured during peak flow, test HFB-L14000. ............................... 40 Figure 33 - Post-test HFB-L14000 diversion pool bed elevations upstream of diversion dam.... 40 Figure 34 - Post-test sediment deposition photographs for test HFB-L14000. ............................ 41 Figure 35 - Close range photogrammetry-generated plot of final channel elevations for test HFB-L14000. Elevations shown are model referenced to a zero datum at elevation 757.75............... 42 Figure 36 - HFB-L14000 surface sediment gradation sampled along a cross section located 63 ft upstream of the dam axis .............................................................................................................. 43 Figure 37 -View of sediment delta reaching the HFB spillway after 15.5 hrs ............................. 44 Figure 38 - Flow velocities measured during peak flow, test HFB-R6000. ................................. 45 Figure 39 - Post-test HFB-R6000 diversion pool bed elevations upstream of diversion dam. .... 46 Figure 40 - Post-test sediment deposition photographs for test HFB-R6000. .............................. 47

5
Figure 41 - Close range photogrammetry-generated plot of final channel elevations for test HFB-R6000. Elevations shown are model referenced to a zero datum at elevation 757.75 ................ 48 Figure 42 - HFB-R6000 surface sediment gradation sampled along a cross section located 63 ft upstream of the dam axis. ............................................................................................................. 49 Figure 43 – Sediment delta passing in front of the canal entrance and flushing through the service spillway. ........................................................................................................................................ 49 Figure 44 - Flow velocities measured during peak flow, test HFB-R14000. ............................... 50 Figure 45 - Post-test HFB-R14000 diversion pool bed elevations upstream of diversion dam. .. 51 Figure 46 - Post-test sediment deposition photographs for test HFB-R14000. ............................ 52 Figure 47 - Close range photogrammetry-generated plot of final channel elevations for test HFB-R14000. Elevations shown are model referenced to a zero datum at elevation 757.75 .............. 53 Figure 48 - HFB-R14000 surface sediment gradation sampled along a cross section located 63 ft upstream of the dam axis. ............................................................................................................. 54 Figure 49 – Plan view of spillway guide walls tested in the model.............................................. 55 Figure 50 - Flow velocities measured in front of canal entrance.................................................. 56 Figure 51 - Photograph of fishway entrances below Robles Diversion Dam service spillway (Casitas Irrigation District). .......................................................................................................... 57 Figure 52 – Illustration of single spillway pool concept............................................................... 59 Figure 53 – Single pool concept shown with service spillway releases of 1,000 ft3/s. ................ 60 Figure 54 –Water surface elevation measured in right bank fishway entrance pool. ................... 61 Figure 55 – View of stilling pool guide wall extension added to prevent sediment from being pulled into the right bank fishway entrance pool.......................................................................... 61 Figure 56 - Sections through the HFB spillway and service spillway.......................................... 62 Figure 57 - Sediment deposition in the right bank fishway attraction pool following a ten year flood simulation. ........................................................................................................................... 62 Figure 58 - Local scouring following eight hours prototype of the service spillway operating at 1500 ft3/s. ...................................................................................................................................... 63 Figure 59 - Local scouring following eight hours prototype operation of the service spillway after removal of baffles on apron. Figure 56 shows pre-sluicing condition. ....................................... 63 Figure 60 – Final configuration of HFB spillway with left side fishway and common downstream channel. ......................................................................................................................................... 64 Figure 61 - Tailwater elevation measured in the HFB spillway stilling basin.............................. 65 Figure 62 - HFB spillway left side fishway shown with weir and orifice baffles. (Baffle dimensions shown are preliminary.) ............................................................................................. 66 Figure 63 - Left side fishway shown with streaming flow style baffles. (Baffle dimensions shown are preliminary.)............................................................................................................................ 67 Figure 64 – Model tests showing dye injected in the right bank fishway (top), in HFB bays 5 and 6 (middle) and in bay 8 and the left bank fishway (bottom). Spillway flows are 1,300 ft3/s service spillway and 6,900 ft3/s HFB spillway. ............................................................................ 68 Figure 65 – Photograph of 2,500 ft3/s released from the service spillway gates flowing down the final downstream channel geometry during the declining limb of a ten year flood simulation. HFB spillway gates are closed...................................................................................................... 69

6
LIST OF TABLES
Table 1 - Model Reynolds numbers for selected prototype river flows. ...................................... 15 Table 2 - Flow and water-surface elevations measured during test Ss6000. ................................ 24 Table 3 - Flow and water-surface elevations measured during test Ss14000. .............................. 29 Table 4 - Flow and water-surface elevations measured during test HFB-L6000. ........................ 34 Table 5 - Flow and water-surface elevations measured during test HFB-L14000. ...................... 39 Table 6 - Flow and water-surface elevations measured during test HFB-R6000. ........................ 45 Table 7 - Flow and water-surface elevations measured during test HFB-R14000. ...................... 50

7
Robles Diversion Dam Physical Model Study
Summary This report presents the results of a Bureau of Reclamation hydraulic model study of the proposed high flow bypass (HFB) spillway for Robles Diversion Dam. Robles Diversion Dam is located on the Ventura River approximately 14 river miles from the ocean. A 1:20 Froude-scale model of the proposed facility was tested to determine the interaction of flows and bed load sediments near the facility following decommissioning and removal of Matilija Dam located about two river miles upstream. The HFB spillway was proposed to enhance sediment movement through the diversion pool thereby reducing the impacts of elevated bed load levels resulting from the upstream dam removal. A new auxiliary fishway and 1.5 ft dam raise associated with the HFB is also proposed to improve upstream fish passage at the diversion dam during HFB operation. HFB Spillway Location - Tests of two- and ten-year floods passing through the diversion pool without the HFB spillway showed canal diversions would be significantly impacted by the entrainment of bed sediments into the canal. In contrast, tests of the HFB spillway located near the left bank or adjacent to the right bank service spillway resulted in unimpacted canal diversion during both floods. The tests clearly demonstrated the importance of passing the majority of the flow away from the canal intake during flood flows transporting high bed load. A comparison of sediment deposition in the diversion pool following the two-year flood event (figures 29 and 41) shows a left bank spillway location provides the least sediment deposition near the canal headworks when the service spillway is not operated. A similar response was also noted from the ten-year flood tests. Prior to operating the service spillway the sediment delta progressed down the right bank at a slower rate for the HFB left bank location compared to the near right bank location. The slower initial movement of sediment along the right bank for the left bank HFB option resulted in sediment taking about 3.0 hrs (prototype) longer to reach the service spillway after the service spillway gates were opened compared to the near right bank location. However, no discernable difference of sediment entrainment into the canal was observed between HFB locations. For both locations, high flow releases through the service spillway dominated bed load movement near the canal headworks quickly negating bed sediment differences resulting from HFB spillway location. Neither spillway location prevented inundation of the right bank fishway exit located well upstream of the dam. The fishway exit was impacted by sediment during all model tests. Also, the HFB spillway at either location will likely not prevent deposition in front of the canal followed by entrainment of bed sediments into the canal if significant sediment deposits are present in the pool area prior to a flood event, during larger floods or significantly longer duration floods than those tested. Locating the HFB spillway adjacent to the service spillway as shown in figure 60 is recommended. The near right bank location provides for better attraction for fish to the fishways and better access to the HFB facility during flood events.

8
Service Spillway Performance - The flow pattern entering the left spillway bays was relatively poor. A strong flow contraction occurred off the left wall of bay 4 and to a lesser extent bay 3. Flow velocities measured upstream of the dam show flow approaches the service spillway entrance at a sharp angle. Adding a curved upstream guide wall extending about 21 ft into the diversion pool was found to effectively guide flow into the spillway. The spillway had a discharge capacity of 5,800 ft3/s at pool elevation 767.1 with the curved guide wall extension on bay 4. Operation of the service spillway at full diversion pool during periods of high bed load generally increased movement of bed sediments toward the canal headworks and increased the potential for entrainment of bed sediments into the canal. Best results were achieved by using the HFB spillway to pass all spillway flows from about 2,500 ft3/s up to the capacity of the HFB spillway. Sluicing bed load through the service spillway also resulted in significant deposition of sediment in the downstream spillway channel. Tests of the existing downstream channel during the ten-year flood event resulted in approximately 10 ft of sediment deposited against the baffled apron energy dissipater and sediment completely filling the downstream pools between the rock weirs. Several modifications to the service spillway and downstream channel were tested to improve downstream flushing of bed sediments and attraction conditions for upstream fish passage. These tests resulted in recommended modifications to the spillway and downstream river channel. The recommended design is shown in figure 60. The major recommendations are:
• The service spillway radial gates should be modified to control flow to elevation 768.5.
• The stilling basin end sill should be raised to elevation 754.25 to prevent the hydraulic jump from sweeping out of the basin at higher pool elevations.
• The channel invert between the baffled apron drop and the downstream end of the fishway entrance structure should be raised to elevation 745.0 and the entrance slots for the fishway raised to about elevation 745.5.
• The channel downstream of the fishway entrance structure should slope up to elevation 750 to provide a pool area at the fishway entrance then slope downward at 1.5 percent to the existing channel, a distance of about 400 ft.
HFB Spillway Hydraulic Performance – Similar to the service spillway, strong flow contractions occurred off the outer spillway walls as flow entered spillway bays 5 and 8. Flow contractions occurred at both spillway locations tested. Entrance conditions to the spillway were improved by adding curved guide walls extended into the diversion pool similar to the wall proposed for the service spillway. Guide walls tested for the near right bank HFB spillway location are shown in figure 49. Guide walls were not included in the left bank HFB tests. However, a similar wall shape could also be applied to a HFB spillway located on the left bank to reduce the flow contractions noted during the tests. For the near right bank HFB location shown, guide walls between bays 4 and 5 were tested as a single pier that improved flow into both bays. With the upstream guide
9
walls installed the spillway discharge capacity was 9,900 ft3/s at pool elevation 767.1 (test conducted without sediment transport through the spillway). Stilling basins of different lengths and with and without endsills were tested. Type 1 basins without endsills are recommended to promote flushing of bed load away from the structure and the HFB fishway entrance, figure 56. Downstream of the HFB stilling basins, a 2.0 percent slope rock ramp provides a transition between the HFB structure, the service spillway channel and the downstream river channel. Fish Passage – The existing upstream fish passage exit was inundated by sediment deposition in the diversion pool for all test conditions. HFB spillway location and gate operation were ineffective at preventing the sediment delta in the diversion pool from building in front of the fishway exit. Flow into the fishway exit was not modeled, however, flow passing through the fishway with the sediment deposition observed would likely entrain large amounts of sediment resulting in plugging of the fishway. Based on the test results, the fishway exit gates would likely be closed prior to a large flood. Fish would then exit through the canal headworks structure and swim in front of the service spillway entrance to pass upstream. An evaluation of flow velocities upstream of the canal and service spillway found flow velocities are less than about 6 ft/s during single spillway gate operation (figure 50). Operating with multiple service spillway gates open would likely increase sediment deposition in front of the canal diversion and result in widely variable flow velocity in the area. Flow velocities reaching about 15 ft/s were measured upstream of the spillway apron with a fully developed sediment delta passing through the spillway. The downstream entrance to the fishway may also be impacted during large flows by sediment deposition. In all tests sediment deposited against the fishway entrance structure obstructing the fishway entrance gates to varying degrees. For the recommended design, sediment deposits about 3 ft deep covered the area around the fishway entrance following the ten-year flood. A second fishway was proposed adjacent to the left wall of the HFB spillway to provide fish passage during HFB spillway operation (figure 60). The HFB fishway was designed to operate only during operation of the HFB spillway at diversion pool elevation 768.0. Downstream of the HFB spillway a constructed channel approximately 400 ft long starting at elevation 753.25 and sloping at about 2 percent conveyed flow and sediment downstream away from the diversion structure. The slope of the channel is similar to other reaches of the Ventura River. The downstream channel was sloped from right to left at 0.5 percent to cause flow to gradually contract to a remnant channel downstream of the right bank fishway as spillway flows recede. Service Spillway Modifications - Increasing the diversion pool elevation by about 1 ft requires several modifications to the existing spillway and fishway. The top of the current service spillway gates is 767.25. A 1-ft pool rise would require the top of the gates be also raised approximately 1 foot. The model showed the hydraulic jump in the service spillway stilling basin sweeps out of the basin under the higher diversion pool at some gate openings. To hold the jump in the basin, the model endsill was raised 1.5 ft prototype.

10
Background
Robles diversion dam is located on the Ventura River near Ventura, California at approximately river mile (RM) 14.16 (figure 1). The diversion supplies water to Lake Casitas by canal. The normal maximum diversion is approximately 500 ft3/s. The existing diversion dam is a low rock weir with a gated spillway, canal diversion headworks and a fish pass located on the right abutment. The diversion weir has a hydraulic height of 13 feet. The fish pass was constructed in 2002 to allow southern California steelhead (Oncorhynhus mykiss), a
listed species, to migrate upstream of the diversion dam.
Matilija Dam is a 160 ft high (originally 190 ft high) concrete arch dam located about 2 miles upstream of Robles diversion dam on Matilija Creek (figure 2). Decommissioning and removal of Matilija Dam is proposed to address a dam safety risk and re-establish access for endangered steelhead to the upper reaches of Matilija Creek. The storage behind the dam has been significantly reduced by deposition of coarse sediment (USBR, 2002). The proposed removal of Matilija Dam is expected to result in increased sediment transport to the Ventura River for many years. The focus of this study is the hydraulic design of a new high flow bypass (HFB) spillway for Robles diversion dam. The HFB will improve the movement of bed load sediments past the diversion structure. This report covers physical modeling of the diversion facility conducted at the Bureau of Reclamation’s Water Resources Research Laboratory (WRRL) in Denver, Colorado. The physical model study provided design support to the Army Corps of Engineers, Los Angles District, the principle designer for the project.
Figure 1 - View of Robles Diversion Dam from above the right bank.

11
Figure 2 - View of Matilija Dam
Model Objective The primary objectives of the model study were to evaluate the HFB spillway effectiveness for reducing the impact of future increases in sediment load on canal operation and fish passage. These objectives were pursued through the following study tasks: For two-year and ten-year return flood events,
• Investigate the position of the HFB structure in relation to flow and bed sediment movement.
• Investigate spillway gate operation in relation to the movement and deposition of bed load sediment within the backwater influence of the diversion dam.
• Evaluate sediment deposition and sluicing near the canal intake structure. • Investigate hydraulics with respect to fish passage. • Investigate the impact of increased bed load sediment on operation of the
existing fishway.
Study Test Plan The study test plan was designed to evaluate HFB spillway benefits to project operations by contrasting post-dam removal bed load sediment conditions with and without the HFB spillway. Also, the study was designed to address HFB sediment sluicing performance with respect to spillway location on the dam. HFB locations adjacent to the service spillway (referred to as right-bank) and near the left bank were studied. The performance of each alternative was evaluated for the two-year and ten-year floods.
12
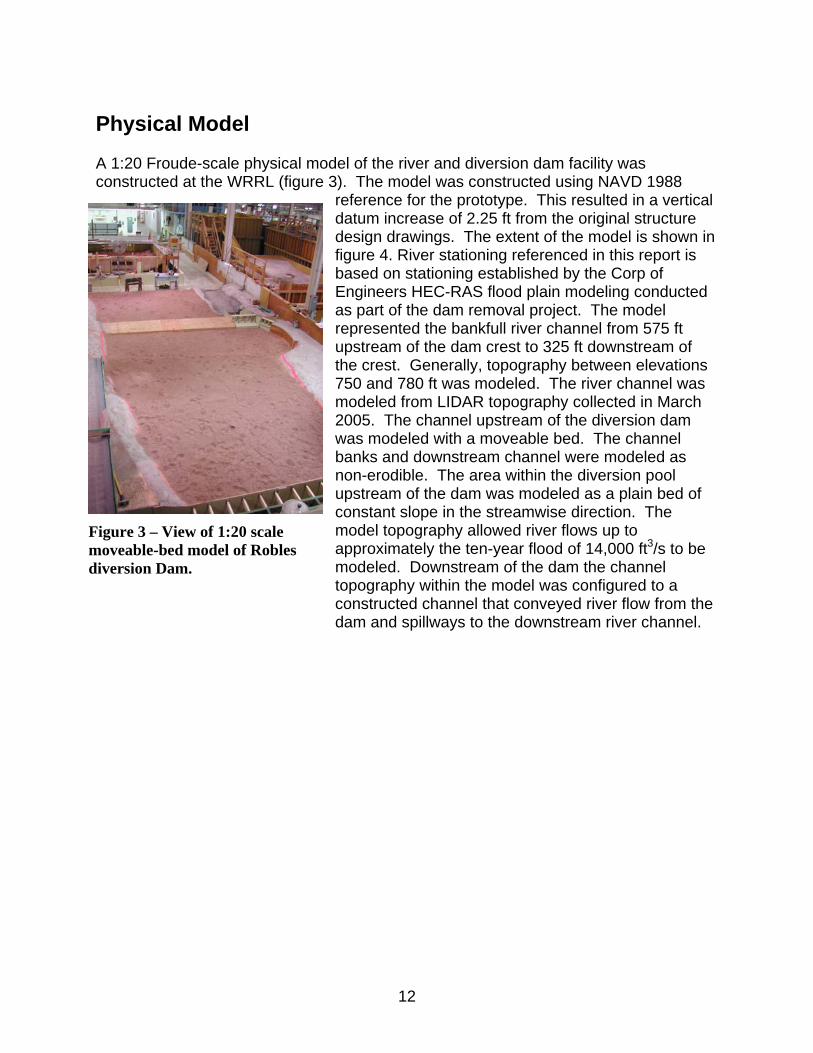
Physical Model A 1:20 Froude-scale physical model of the river and diversion dam facility was constructed at the WRRL (figure 3). The model was constructed using NAVD 1988
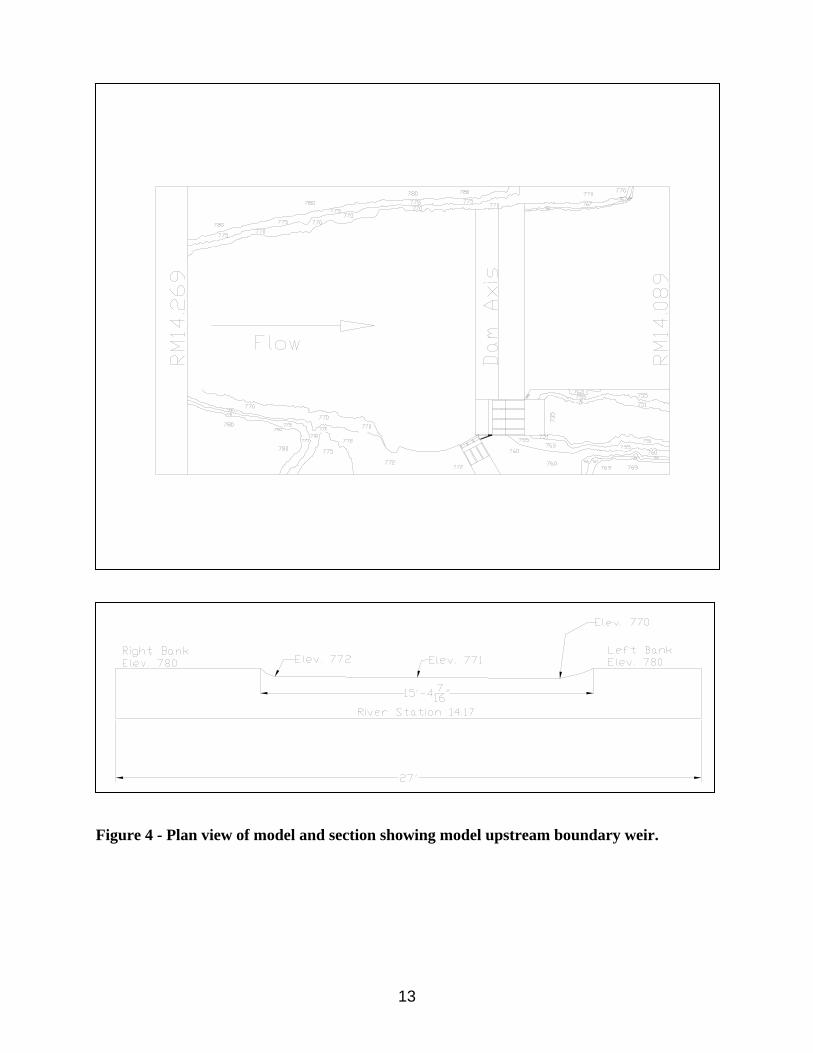
reference for the prototype. This resulted in a vertical datum increase of 2.25 ft from the original structure design drawings. The extent of the model is shown in figure 4. River stationing referenced in this report is based on stationing established by the Corp of Engineers HEC-RAS flood plain modeling conducted as part of the dam removal project. The model represented the bankfull river channel from 575 ft upstream of the dam crest to 325 ft downstream of the crest. Generally, topography between elevations 750 and 780 ft was modeled. The river channel was modeled from LIDAR topography collected in March 2005. The channel upstream of the diversion dam was modeled with a moveable bed. The channel banks and downstream channel were modeled as non-erodible. The area within the diversion pool upstream of the dam was modeled as a plain bed of constant slope in the streamwise direction. The model topography allowed river flows up to approximately the ten-year flood of 14,000 ft3/s to be modeled. Downstream of the dam the channel topography within the model was configured to a constructed channel that conveyed river flow from the dam and spillways to the downstream river channel.
Figure 3 – View of 1:20 scale moveable-bed model of Robles diversion Dam.
13
Figure 4 - Plan view of model and section showing model upstream boundary weir.
14
Model Scaling Physical model scaling is used to create similitude between model and prototype of major forces controlling the physical processes being studied. Not all forces can be properly scaled simultaneously. Generally, open channel flow problems are modeled based on a Froude scaling relationship. The Froude number relates inertia and gravity forces expressed as, gdvFr /= (v = flow velocity, g = acceleration of gravity and d = flow depth). Similitude between model and prototype is achieved when the Froude number in the model and prototype are the same. Using Froude scaling the following relationships apply to the 1:20 geometric scale chosen:
788,120
8920
47.420
20
5.2/
5.1/
/
/
==
==
==
=
mp
mp
mp
mp
Q
q
V
L
where: L is length or depth, V is velocity, q is discharge per unit width, Q is discharge and p/m refers to a ratio of prototype to model
Forces not related in the Froude number, such as surface tension and viscosity do not scale by the Froude relationship. The effect on model similitude of distorting these forces must be evaluated separately. Surface tension can normally be neglected unless very shallow flows are anticipated in the model. Viscosity can be neglected when flow in the model and prototype is fully turbulent. The transition between laminar flow (viscous flow) and turbulent flow is defined by a relationship of viscous forces to inertial forces referred to as the Reynolds number, ν/re VdR = (V = average velocity, dr = hydraulic
radius and ν = kinematic viscosity). Turbulent flow occurs when the Reynolds number is larger than about 2000. For physical models of natural channels, a Reynolds number threshold of 5000 is often used due to the high variability of flow velocity and depth. Based on Froude scaling, the Reynolds number in the model will be distorted by the Froude scale ratio to the exponent 1.5. The 20:1 geometric scale selected for the model yields a distortion of the model Reynolds number of 89.4. Therefore, model Reynolds numbers are equal to prototype values divided by 89.4. Model Reynolds numbers were determined using HEC-RAS flow modeling to predict average flow velocity and hydraulic depth as a function of river flow near the upstream extent of the model (RM 14.17). For each river flow, prototype Reynolds numbers were calculated and divided by the model distortion factor to determine model values (see table 1). Model Reynolds numbers are greater than 5000 for modeled river flows above 3000 ft3/s and greater than 2000 for modeled river flows above about 1000 ft3/s.
15
Table 1 - Model Reynolds numbers for selected prototype river flows.
Prototype River Flow, ft3/s
1500 3000 6000 10000 14000
Model Reynolds Number
3368 6518 11850 18720 24200
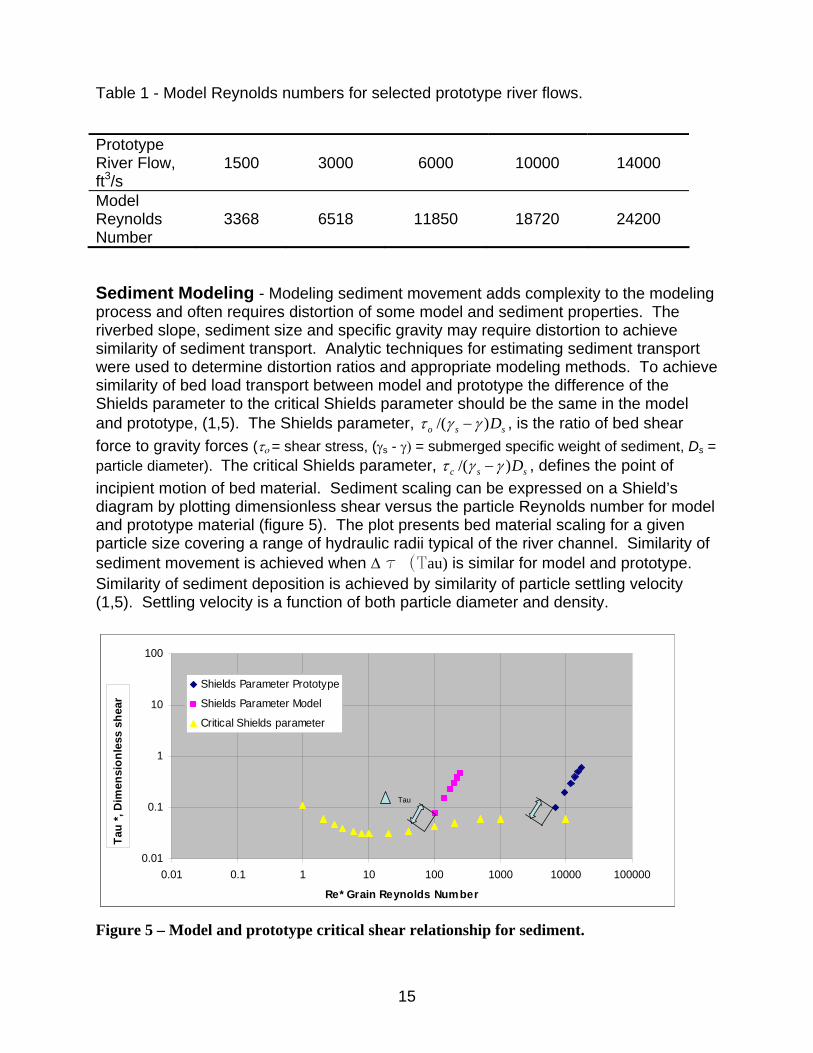
Sediment Modeling - Modeling sediment movement adds complexity to the modeling process and often requires distortion of some model and sediment properties. The riverbed slope, sediment size and specific gravity may require distortion to achieve similarity of sediment transport. Analytic techniques for estimating sediment transport were used to determine distortion ratios and appropriate modeling methods. To achieve similarity of bed load transport between model and prototype the difference of the Shields parameter to the critical Shields parameter should be the same in the model and prototype, (1,5). The Shields parameter, sso D)/( γγτ − , is the ratio of bed shear force to gravity forces (το = shear stress, (γs - γ) = submerged specific weight of sediment, Ds = particle diameter). The critical Shields parameter, ssc D)/( γγτ − , defines the point of incipient motion of bed material. Sediment scaling can be expressed on a Shield’s diagram by plotting dimensionless shear versus the particle Reynolds number for model and prototype material (figure 5). The plot presents bed material scaling for a given particle size covering a range of hydraulic radii typical of the river channel. Similarity of sediment movement is achieved when ∆ τ (Tau) is similar for model and prototype. Similarity of sediment deposition is achieved by similarity of particle settling velocity (1,5). Settling velocity is a function of both particle diameter and density.
0.01
0.1
1
10
100
0.01 0.1 1 10 100 1000 10000 100000
Re* Grain Reynolds Number
Tau
*, D
imen
sion
less
she
ar
Shields Parameter Prototype
Shields Parameter Model
Critical Shields parameter
Tau
0.01
0.1
1
10
100
0.01 0.1 1 10 100 1000 10000 100000
Re* Grain Reynolds Number
Tau
*, D
imen
sion
less
she
ar
Shields Parameter Prototype
Shields Parameter Model
Critical Shields parameter
0.01
0.1
1
10
100
0.01 0.1 1 10 100 1000 10000 100000
Re* Grain Reynolds Number
Tau
*, D
imen
sion
less
she
ar
Shields Parameter Prototype
Shields Parameter Model
Critical Shields parameter
0.01
0.1
1
10
100
0.01 0.1 1 10 100 1000 10000 100000
Re* Grain Reynolds Number
Tau
*, D
imen
sion
less
she
ar
Shields Parameter Prototype
Shields Parameter Model
Critical Shields parameter
Tau
Figure 5 – Model and prototype critical shear relationship for sediment.
16
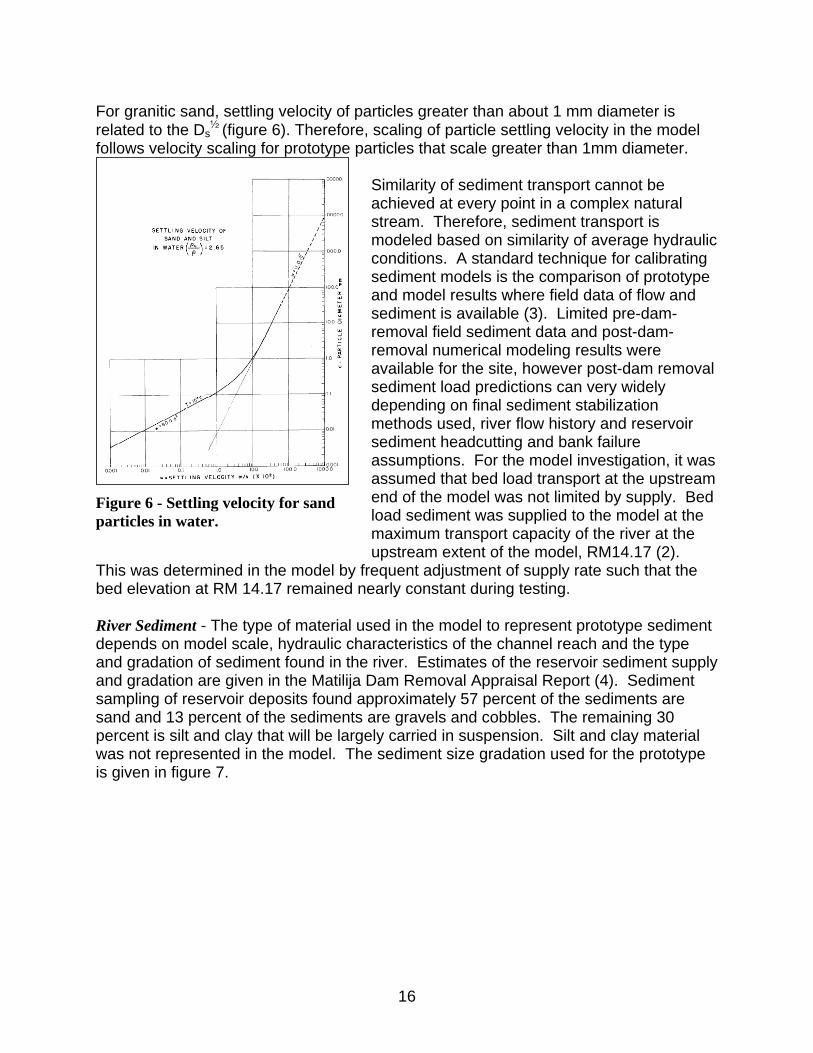
For granitic sand, settling velocity of particles greater than about 1 mm diameter is related to the Ds
½ (figure 6). Therefore, scaling of particle settling velocity in the model follows velocity scaling for prototype particles that scale greater than 1mm diameter.
Similarity of sediment transport cannot be achieved at every point in a complex natural stream. Therefore, sediment transport is modeled based on similarity of average hydraulic conditions. A standard technique for calibrating sediment models is the comparison of prototype and model results where field data of flow and sediment is available (3). Limited pre-dam- removal field sediment data and post-dam- removal numerical modeling results were available for the site, however post-dam removal sediment load predictions can very widely depending on final sediment stabilization methods used, river flow history and reservoir sediment headcutting and bank failure assumptions. For the model investigation, it was assumed that bed load transport at the upstream end of the model was not limited by supply. Bed load sediment was supplied to the model at the maximum transport capacity of the river at the upstream extent of the model, RM14.17 (2).
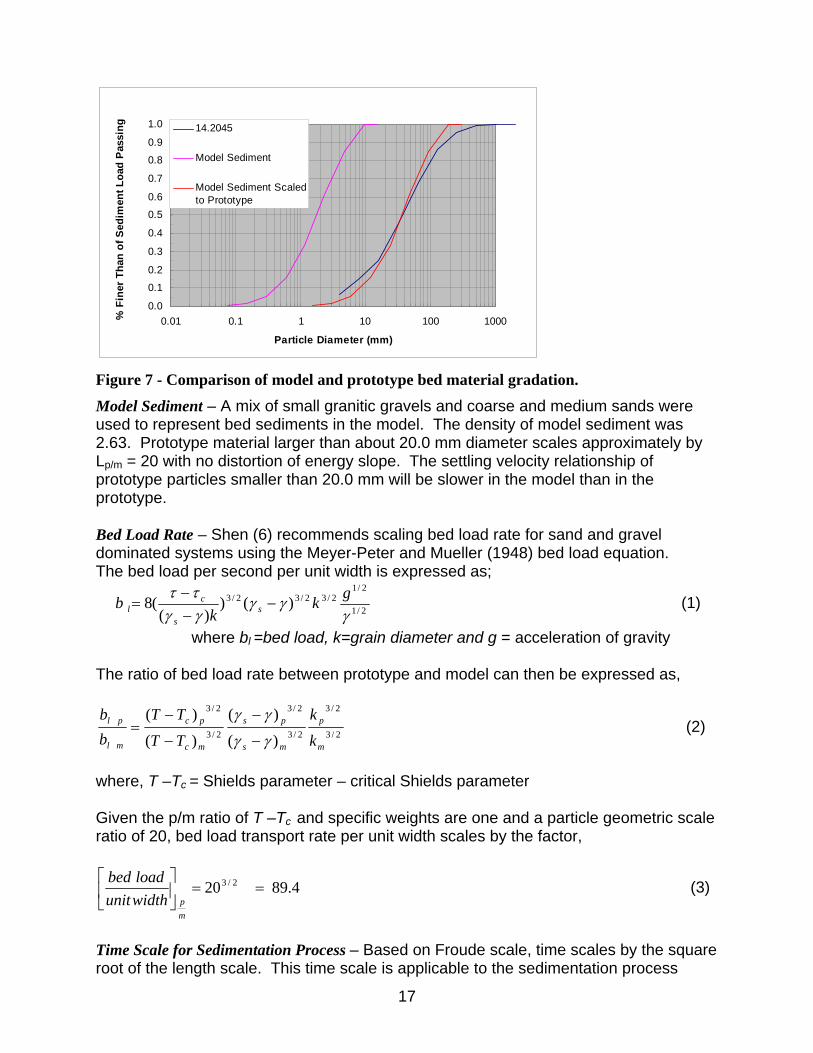
This was determined in the model by frequent adjustment of supply rate such that the bed elevation at RM 14.17 remained nearly constant during testing. River Sediment - The type of material used in the model to represent prototype sediment depends on model scale, hydraulic characteristics of the channel reach and the type and gradation of sediment found in the river. Estimates of the reservoir sediment supply and gradation are given in the Matilija Dam Removal Appraisal Report (4). Sediment sampling of reservoir deposits found approximately 57 percent of the sediments are sand and 13 percent of the sediments are gravels and cobbles. The remaining 30 percent is silt and clay that will be largely carried in suspension. Silt and clay material was not represented in the model. The sediment size gradation used for the prototype is given in figure 7.
Figure 6 - Settling velocity for sand particles in water.
17
0.0
0.1
0.2
0.3
0.4
0.5
0.6
0.7
0.8
0.9
1.0
0.01 0.1 1 10 100 1000
Particle Diameter (mm)
% F
iner
Tha
n of
Sed
imen
t Loa
d P
assi
ng 14.2045
Model Sediment
Model Sediment Scaledto Prototype
Figure 7 - Comparison of model and prototype bed material gradation.
Model Sediment – A mix of small granitic gravels and coarse and medium sands were used to represent bed sediments in the model. The density of model sediment was 2.63. Prototype material larger than about 20.0 mm diameter scales approximately by Lp/m = 20 with no distortion of energy slope. The settling velocity relationship of prototype particles smaller than 20.0 mm will be slower in the model than in the prototype. Bed Load Rate – Shen (6) recommends scaling bed load rate for sand and gravel dominated systems using the Meyer-Peter and Mueller (1948) bed load equation. The bed load per second per unit width is expressed as;
2/1
2/12/32/32/3 )()
)((8
γγγ
γγττ gk
kb s
s
cl −
−−
= (1)
where bl =bed load, k=grain diameter and g = acceleration of gravity
The ratio of bed load rate between prototype and model can then be expressed as,
2/3
2/3
2/3
2/3
2/3
2/3
)(
)(
)(
)(
m
p
ms
ps
mc
pc
ml
pl
k
k
TT
TTbb
γγ
γγ
−
−
−
−= (2)
where, T –Tc = Shields parameter – critical Shields parameter Given the p/m ratio of T –Tc and specific weights are one and a particle geometric scale ratio of 20, bed load transport rate per unit width scales by the factor,
4.8920 2/3 ==⎥⎦
⎤⎢⎣
⎡
mpwidthunit
loadbed (3)
Time Scale for Sedimentation Process – Based on Froude scale, time scales by the square root of the length scale. This time scale is applicable to the sedimentation process
18
when sediment can be modeled undistorted. This can be shown by applying similarity of bed load transport. For modeling sands and gravels, Shen proposes using a time
scale based on; )/( λλ −
=slbaT (4)
where, T = characteristic time, a= channel cross sectional area and bl = bed load based on Meyer-Peter and Mueller Equation 4 written in terms of scale ratios equals,
2/32/12/32 )()( −−− −−=mp
mps
mpc
mp
mp kTTLT γγ (5)
where: p/m = prototype to model scale ratio. When
mpcTT )( − and
mps )( γγ − =1 and particle size scales geometrically,
2/120=mpT (6)
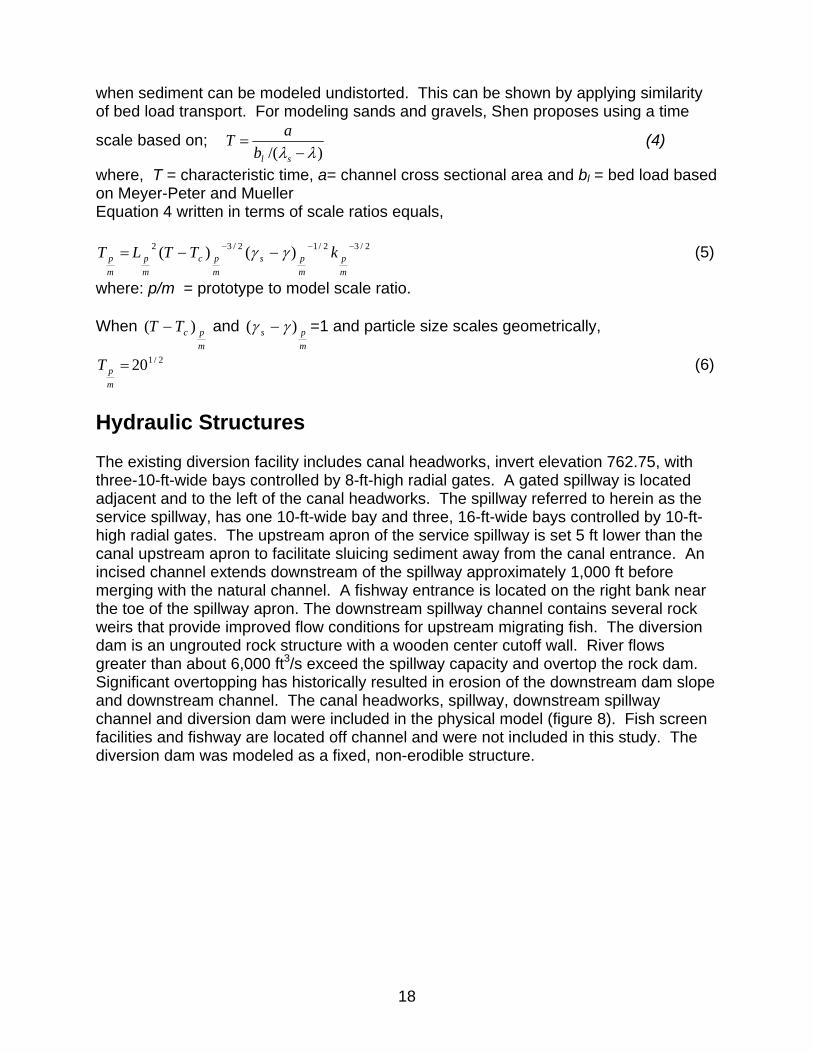
Hydraulic Structures The existing diversion facility includes canal headworks, invert elevation 762.75, with three-10-ft-wide bays controlled by 8-ft-high radial gates. A gated spillway is located adjacent and to the left of the canal headworks. The spillway referred to herein as the service spillway, has one 10-ft-wide bay and three, 16-ft-wide bays controlled by 10-ft- high radial gates. The upstream apron of the service spillway is set 5 ft lower than the canal upstream apron to facilitate sluicing sediment away from the canal entrance. An incised channel extends downstream of the spillway approximately 1,000 ft before merging with the natural channel. A fishway entrance is located on the right bank near the toe of the spillway apron. The downstream spillway channel contains several rock weirs that provide improved flow conditions for upstream migrating fish. The diversion dam is an ungrouted rock structure with a wooden center cutoff wall. River flows greater than about 6,000 ft3/s exceed the spillway capacity and overtop the rock dam. Significant overtopping has historically resulted in erosion of the downstream dam slope and downstream channel. The canal headworks, spillway, downstream spillway channel and diversion dam were included in the physical model (figure 8). Fish screen facilities and fishway are located off channel and were not included in this study. The diversion dam was modeled as a fixed, non-erodible structure.
19
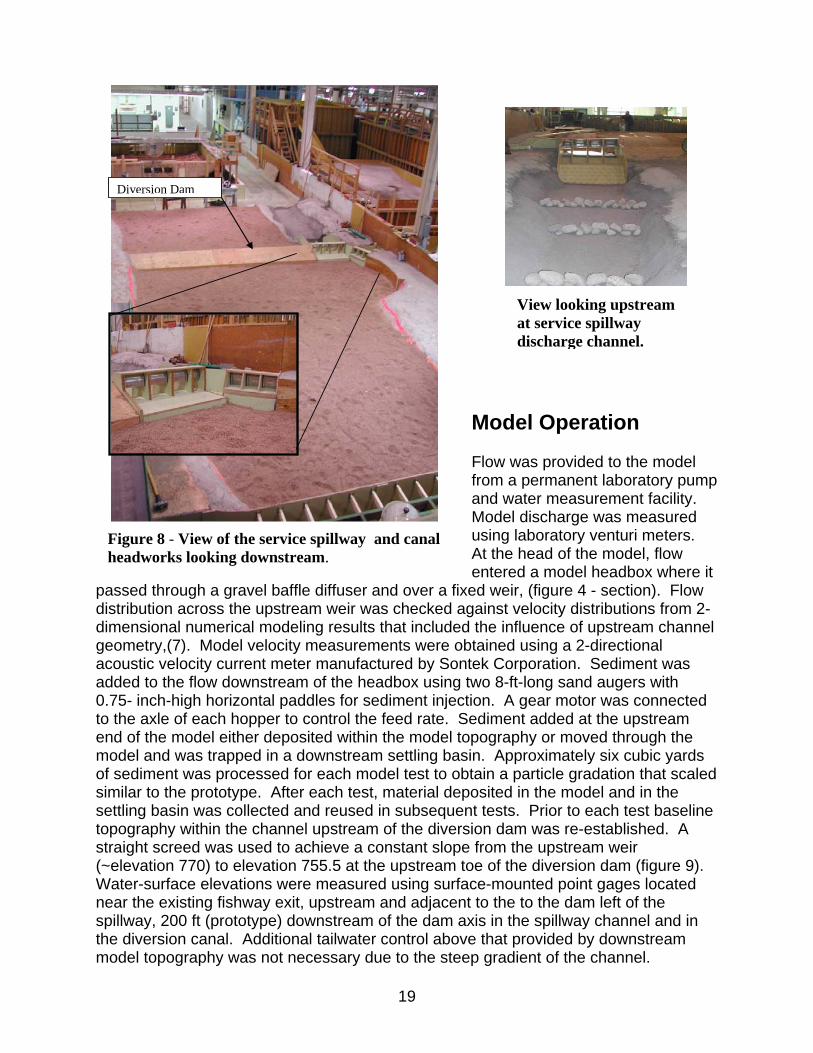
Model Operation Flow was provided to the model from a permanent laboratory pump and water measurement facility. Model discharge was measured using laboratory venturi meters. At the head of the model, flow entered a model headbox where it
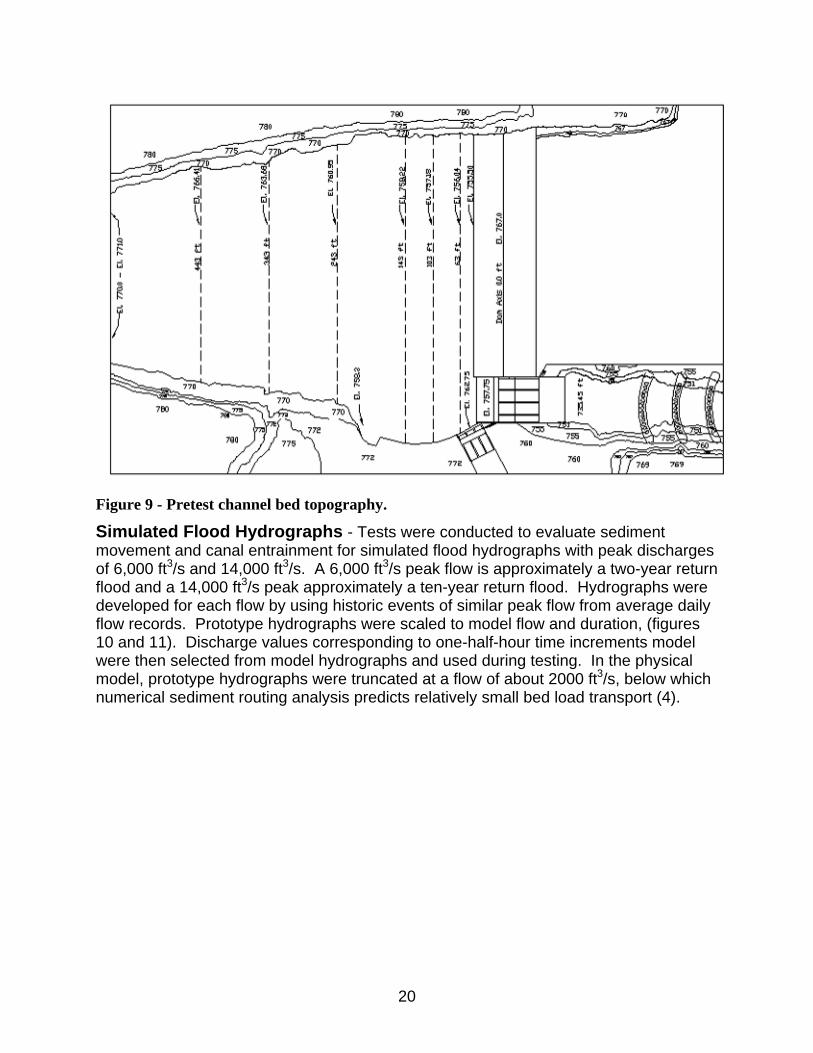
passed through a gravel baffle diffuser and over a fixed weir, (figure 4 - section). Flow distribution across the upstream weir was checked against velocity distributions from 2-dimensional numerical modeling results that included the influence of upstream channel geometry,(7). Model velocity measurements were obtained using a 2-directional acoustic velocity current meter manufactured by Sontek Corporation. Sediment was added to the flow downstream of the headbox using two 8-ft-long sand augers with 0.75- inch-high horizontal paddles for sediment injection. A gear motor was connected to the axle of each hopper to control the feed rate. Sediment added at the upstream end of the model either deposited within the model topography or moved through the model and was trapped in a downstream settling basin. Approximately six cubic yards of sediment was processed for each model test to obtain a particle gradation that scaled similar to the prototype. After each test, material deposited in the model and in the settling basin was collected and reused in subsequent tests. Prior to each test baseline topography within the channel upstream of the diversion dam was re-established. A straight screed was used to achieve a constant slope from the upstream weir (~elevation 770) to elevation 755.5 at the upstream toe of the diversion dam (figure 9). Water-surface elevations were measured using surface-mounted point gages located near the existing fishway exit, upstream and adjacent to the to the dam left of the spillway, 200 ft (prototype) downstream of the dam axis in the spillway channel and in the diversion canal. Additional tailwater control above that provided by downstream model topography was not necessary due to the steep gradient of the channel.
Diversion Dam
Figure 8 - View of the service spillway and canal headworks looking downstream.
View looking upstream at service spillway discharge channel.
20
Figure 9 - Pretest channel bed topography.
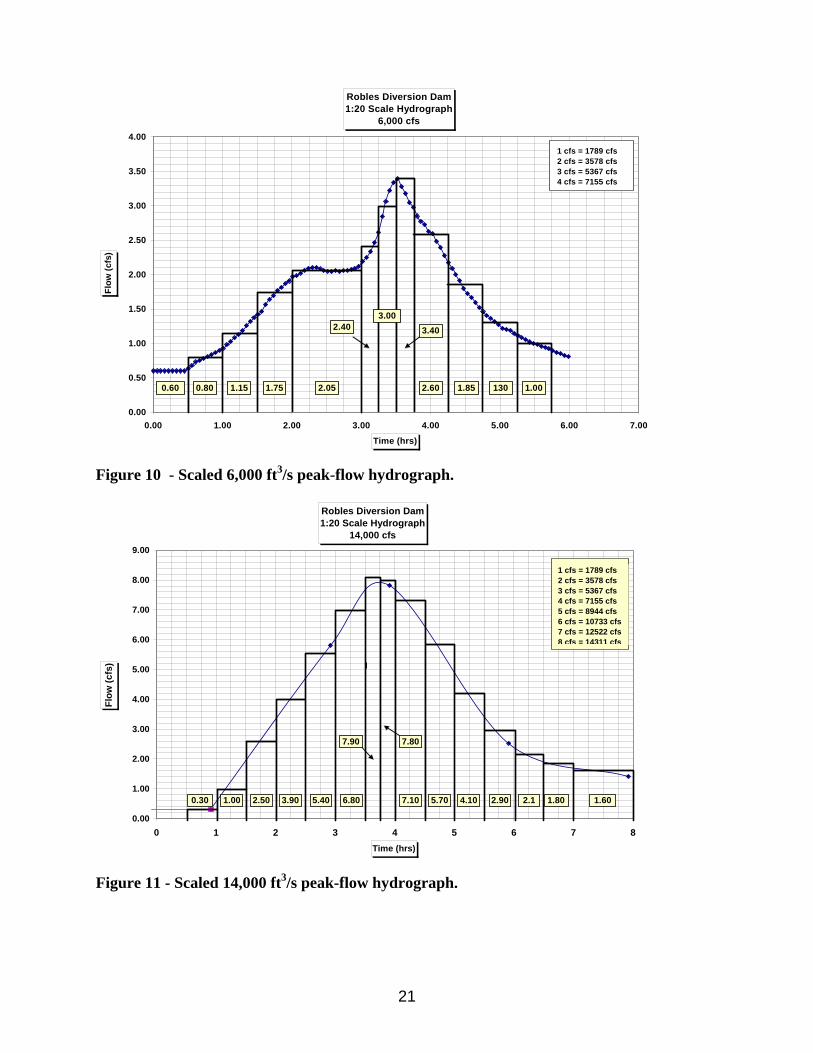
Simulated Flood Hydrographs - Tests were conducted to evaluate sediment movement and canal entrainment for simulated flood hydrographs with peak discharges of 6,000 ft3/s and 14,000 ft3/s. A 6,000 ft3/s peak flow is approximately a two-year return flood and a 14,000 ft3/s peak approximately a ten-year return flood. Hydrographs were developed for each flow by using historic events of similar peak flow from average daily flow records. Prototype hydrographs were scaled to model flow and duration, (figures 10 and 11). Discharge values corresponding to one-half-hour time increments model were then selected from model hydrographs and used during testing. In the physical model, prototype hydrographs were truncated at a flow of about 2000 ft3/s, below which numerical sediment routing analysis predicts relatively small bed load transport (4).
21
Robles Diversion Dam1:20 Scale Hydrograph
6,000 cfs
0.00
0.50
1.00
1.50
2.00
2.50
3.00
3.50
4.00
0.00 1.00 2.00 3.00 4.00 5.00 6.00 7.00
Time (hrs)
Flow
(cfs
)
1 cfs = 1789 cfs2 cfs = 3578 cfs3 cfs = 5367 cfs4 cfs = 7155 cfs
0.60 0.80 1.15 1.75 2.05
2.403.00
3.40
2.60 1.85 130 1.00
Figure 10 - Scaled 6,000 ft3/s peak-flow hydrograph.
Robles Diversion Dam1:20 Scale Hydrograph
14,000 cfs
0.00
1.00
2.00
3.00
4.00
5.00
6.00
7.00
8.00
9.00
0 1 2 3 4 5 6 7 8Time (hrs)
Flow
(cfs
)
1 cfs = 1789 cfs2 cfs = 3578 cfs3 cfs = 5367 cfs4 cfs = 7155 cfs5 cfs = 8944 cfs6 cfs = 10733 cfs7 cfs = 12522 cfs8 cfs = 14311 cfs
ll
0.30 1.00 2.50 3.90 5.40 6.80
7.90 7.80
7.10 5.70 4.10 2.90 2.1 1.80 1.60
Figure 11 - Scaled 14,000 ft3/s peak-flow hydrograph.

22
Model Tests Tests were conducted for the two-year and ten-year flow hydrographs. The spillway gates were operated to maintain a pool elevation upstream of the diversion dam of 767.0 until flow exceeded the control capacity of the spillway above which the diversion
dam was allowed to overtop. The canal gates were operated to limit flow diversion to the canal to a maximum of 500 ft3/s. Gate operation (gate selection and gate opening) was varied during the study to broadly investigate the relation of gate location on sediment sluicing performance. For the study, spillway gates were referred to in increasing order from right to left looking downstream, figure 12. Individual canal gates are not referenced as they were opened uniformly during the study. Sediment was fed to the flow as required to control bed scour or bed
load deposition in the channel at RM 14.27 to within +/- 1.0 ft prototype of the initial bed elevation. All tests were conducted for a post-dam-removal sediment load. Data Collection - Prior to and following tests, digital photographs were taken of the model from approximately twelve locations around the periphery of the model. Photographs were used to develop close range photogrammetric contour maps of the channel surface. The leading edge of the sediment delta upstream of the dam was also surveyed following each test as a check of the photogrammetric contours. During the tests, water surfaces were measured at all point gauges following flow changes. At the peak of the hydrograph, mid-depth velocity measurements were taken at 50-ft-intervals (prototype) across the channel 63 ft upstream of the dam axis. Total sediment volumes added during each test were recorded. Continuous measurement of the sediment load provided to the model was not attempted due to the difficulty of maintaining a calibrated delivery system for the large volume of sediment supplied during each test. Additional site specific velocity measurements were made during selected tests to document flow conditions for fish passage. Test Results Six moveable bed sediment tests were conducted to investigate spillway location. The canal headgates were operated to pass 500 ft3/s for all tests. The model tests are referenced in the report based on the spillway options tested.
Canal
Spillway Gates
Figure 12 - Photograph of the model showing canal and service spillway.

23
The nomenclature used to reference the six tests is listed below. Flood Peak Service Spillway HFB Spillway added
near Left Bank HFB Spillway added near Right Bank
6,000 ft3/s Ss6000 HFB-L6000 HFB-R6000 14,000 ft3/s Ss14000 HFB-L14000 HFB-R14000 Two-year Flood with Post-Dam-Removal Sediment Loading, Test Ss6000 – Spillway gates were opened starting with Bay 1 followed by progressively opening bays
2-4 to maintain the pool elevation as flow increased. During the falling limb of the hydrograph, gates were closed starting with gate four and finishing with gate one. River flows and diversion pool elevation for each time step are given in table 2. Significant bed load transport started at flows between 2500 ft3/s and 3000 ft3/s. Bed load deposition within the diversion pool occurred largely in the form of a sediment delta that progressively worked downstream (figure 13). The delta progressed downstream faster near the left and right banks than mid-channel. This was likely due to higher flows entering the model near the left bank due to channel topography and the downstream right bank
flow release through the spillway. A noticeable acceleration in the growth of the delta near the right bank was noted as the delta approached the zone upstream of the spillway where flow velocities rapidly accelerated. Upstream of the sediment delta, flow was generally shallow and swift. In the model, flow moving along the dam axis caused a strong flow contraction off the left upstream wall of bay 4 with a lesser contraction in bay 3. The contraction appeared to significantly reduce the flow capacity of bays 4 and 3 during high flows, however, no attempt was made in the study to measure the flow capacity of individual spillway bays. At the hydrograph peak the sediment delta had inundated the fishway exit (figure 14) and had reached to within about 50 ft of the spillway apron. The sediment delta reached the spillway apron after about 17 hrs (prototype) and started sluicing downstream. Flow velocity above the sediment delta was generally too shallow to measure in the model. Mid-depth flow velocities measured downstream of the sediment delta during the flood peak show a strong directional velocity component along the dam axis toward the spillway (figure 15). During the declining limb of the hydrograph, the sediment delta continued to spread laterally along the dam. Some bed sediments were entrained into the canal during the final one-third of the hydrograph as deposition in front of the canal headworks reached the canal sill elevation. Post-test channel bed elevations upstream of the dam are shown in figure 16. Photographs of the deposition pattern in the diversion pool and downstream spillway channel are shown in figure 17. Sediment deposition upstream of the delta front was fairly uniform across the channel with only minor channelization evident. The lack of channelization of the delta sediment likely resulted from the pool water surface in
Figure 13 – Photograph of sediment delta building toward the service spillway.
Sediment Delta

24
the model being held nearly constant until the test was terminated. This was necessary to evaluate and compare diversion pool deposition patterns as a function of spillway flow routing. The model was not operated to evaluate post-flood sediment sluicing effectiveness. Following the test, surface sediment samples were taken at a cross section 63 ft upstream of the dam axis. The gradation analysis of all samples is given in figure 18. The samples show coarser material located near the center of the channel and finer material near both banks.
Table 2 - Flow and water-surface elevations measured during test Ss6000.
Hydrograph Qprototype Elevation (ft) Elevation (ft) Elevation (ft)
Duration, hr (cfs) Dam Fishway Exit Spillway Channel0 1234 744.50
2.23 1420 766.84 n/a4.47 2057 767.44 767.50 745.256.71 3130 767.27 767.19 746.608.94 3667 766.84 767.01 747.9113.4 4293 766.54 766.68 747.9414.53 5367 767.14 767.25 748.8815.65 6082 767.24 766.94 749.3517.14 4651 766.74 766.35 748.9619.36 3309 766.54 766.38 747.0621.6 2326 766.94 766.94 745.8723.84 1789
Figure 14 – Sediment delta encroaching on the fishway exit at the peak of the Ss6000 test.

25
Figure 15 - Flow velocities measured during peak flow, test Ss6000.
Figure 16 – Post-test Ss6000 diversion pool bed elevations upstream of diversion dam.

26
Figure 17 - Post-test sediment deposition photographs for test Ss6000.
Upstream of Service Spillway Gate Structure River Channel Downstream
of Service Spillway
Upstream of Diversion Canal
Upstream Fishway Exit
Diversion Pool
Upstream of Diversion Canal
Upstream Fishway Exit
Diversion Pool

27
Gradation Analysis
0.0
20.0
40.0
60.0
80.0
100.0
120.0
0 50 100 150 200 250 300 350 400
Particle Diameter (mm)
% P
assi
ng
Base Line Composite
Deposition - 350' from Canal ApronDeposition - 260' from Canal Apron
Deposition - 170' from Canal ApronDeposition - 100' from Canal Apron
Deposition - 20' from Canal Apron
Figure 18 – Gradation of surface sediment samples taken at a cross section 63 ft upstream of the dam axis following test Ss6000.

28
Ten-Year Flood with Post-Dam-Removal Sediment Loading, Test Ss14000 - The test was run for 6.0 hours in the model representing about 26.5 hours prototype. The test was terminated prior to the end of the hydrograph because sediment deposition upstream of the dam reached a steady state condition with bed load passing through the diversion pool to the spillway. Spillway gates were opened starting with Bay 1 followed by opening Bays 2-4 as required to prevent dam overtopping. The capacity of the spillway prior to dam overtopping was about 5,600 ft3/s. Water-surface elevations measured during the test are given in table 3. Some variability in water surface elevation occurred during the testing due to the diversion pool response time and frequent gate adjustments required to maintain a nearly constant pool elevation until all spillway gates were full open. The sediment delta extended downstream to the fishway exit after about 6.7 hrs (prototype). The delta reached the spillway apron and sediment started passing through the spillway after approximately 11 hrs (prototype) at a flow of 12,100 ft3/s. At the flood peak, the sediment delta extended onto the canal apron initiating entrainment of bed sediment into the canal. Large quantities of sediment were entrained by the spillway into the downstream channel. Surveys of the spillway channel invert elevation during the test revealed the area between rock weirs filled with sediment changing the channel invert to a plain bed. In the model, sediment near the head of the spillway channel deposited to about elevation 750 partially covering the baffled apron and the fishway entrance. Fishway flow exiting the fishway was not modeled and therefore the model may not correctly represent local flushing of sediment near the fishway entrance. At about 17 hrs (prototype, flow = 10,000 ft3/s) the sediment delta built to the crest of the dam and bed sediment began passing over the crest. During much of the declining limb of the hydrograph sediment depositions in the canal restricted the diversion capacity of the canal to less than full capacity. Near-dam velocities measured during the rising limb of the flow hydrograph at a flow of 6,977 ft3/s are shown in figure 19. Upstream of the sediment delta’s downstream leading edge flow depths were too shallow to measure flow velocity in the model. Near the fishway exit, greater than 11 ft of deposition occurred during the test (figure 20). In front of the canal headworks, sediment deposits reached higher than elevation 763. Post-test sediment deposition within diversion pool bed, canal and downstream channel is shown in figure 21. A general pattern within the basin of sediment movement toward the spillway and canal headworks is evident.

29
Table 3 - Flow and water-surface elevations measured during test Ss14000.
Hydrograph Qprototype Elevation (ft) Elevation (ft) Elevation (ft)
Duration, hr (cfs) Dam Crest Upstream Spillway
0 536.66 n/a 764.46 n/a2.23 1788.85 766.84 766.71 744.784.47 4472.14 766.64 766.39 748.206.7 6976.53 769.64 768.89 749.788.93 9659.81 770.37 769.95 750.8211.16 12164.21 770.84 769.94 751.0913.39 14131.95 771.44 769.67 751.0614.86 13953.06 771.34 769.90 750.9616.34 12700.87 771.44 770.07 749.9117.82 10196.47 771.34 770.07 749.9820.05 7334.30 770.34 n/a 749.2521.17 5187.68 768.14 n/a 748.0421.69 4472.14 767.24 n/a 747.7122.21 3756.59 766.84 n/a 747.2223.32 3219.94 766.84 n/a 747.4824.45 2862.17 766.84 n/a 746.69
Figure 19 – Flow velocities measured during peak flow, test Ss14000.

30
Figure 20 - Post-test Ss14000 diversion pool bed elevations upstream of diversion dam.

31
Figure 21 - Post-test sediment deposition photographs for test Ss14000.
High Flow Bypass Spillway The high flow bypass spillway was designed to increase the spillway capacity of the diversion dam from about 6,000 ft3/s to about 14,000 ft3/s. Increased spillway diversion capacity will be needed following removal of Matillia Dam to expand the water districts ability to sluice increased bed load through the diversion pool during major flood events. The proposed HFB spillway had four 30-ft- wide radial gate spillway bays, (figure 22). In the model study, the HFB gates are referenced from right to left as spillway gates 5 through 8. The upstream sill elevation of the HFB spillway apron was set similar to the
8
5
6
78
5
6
78
5
6
7
Figure 22 View of HFB spillway bay numbering scheme used in the model.
Upstream of Sluice Radial Gate Structure & Dam Crest
River Channel Downstreamof Service Spillway
Downstream of Diversion Canal
Upstream Fishway Exit
View looking Downstream
Upstream of Sluice Radial Gate Structure & Dam Crest
Downstream of Diversion Canal
Upstream Fishway Exit
View looking Downstream
32
service spillway at elevation 757.75, (figure 23). Flow from the gates entered a 51.4-ft-long Reclamation Type I stilling basin. Downstream of the HFB spillway stilling basin, the channel was sloped upward at a 1V:4H slope to elevation 757.0 followed by a rock ramp sloping downward at approximately 2.5 percent. The downstream rock ramp was designed to provide flow conditions suitable for upstream passage of adult steelhead. The service spillway channel and the HFB spillway channel were separated by a rock berm for a distance of about 900 ft downstream. Two series of tests were conducted to evaluate sediment deposition in the diversion pool based on HFB spillway location. The first location tested was on the dam 187 ft left of the service spillway near the left bank, figure 24. This location was chosen to evaluate diversion pool sediment movement and deposition when high flows were released downstream adjacent to the bank opposite the diversion. The second HFB location tested was 30 ft to the left of the existing spillway. This location provided more of a river center release and was desirable as it provided for access to all facilitates from the right bank and allowed for easier management of spills for fish passage. Sediment movement and deposition patterns within the diversion pool were documented for both HFB positions.
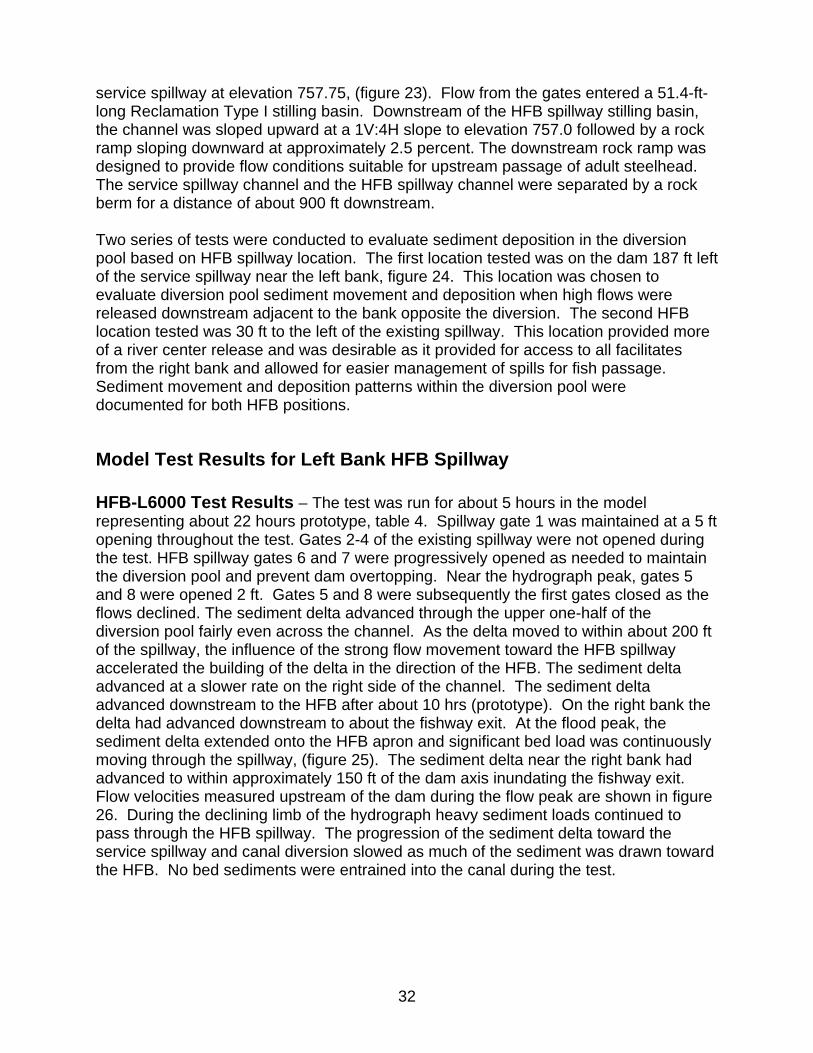
Model Test Results for Left Bank HFB Spillway HFB-L6000 Test Results – The test was run for about 5 hours in the model representing about 22 hours prototype, table 4. Spillway gate 1 was maintained at a 5 ft opening throughout the test. Gates 2-4 of the existing spillway were not opened during the test. HFB spillway gates 6 and 7 were progressively opened as needed to maintain the diversion pool and prevent dam overtopping. Near the hydrograph peak, gates 5 and 8 were opened 2 ft. Gates 5 and 8 were subsequently the first gates closed as the flows declined. The sediment delta advanced through the upper one-half of the diversion pool fairly even across the channel. As the delta moved to within about 200 ft of the spillway, the influence of the strong flow movement toward the HFB spillway accelerated the building of the delta in the direction of the HFB. The sediment delta advanced at a slower rate on the right side of the channel. The sediment delta advanced downstream to the HFB after about 10 hrs (prototype). On the right bank the delta had advanced downstream to about the fishway exit. At the flood peak, the sediment delta extended onto the HFB apron and significant bed load was continuously moving through the spillway, (figure 25). The sediment delta near the right bank had advanced to within approximately 150 ft of the dam axis inundating the fishway exit. Flow velocities measured upstream of the dam during the flow peak are shown in figure 26. During the declining limb of the hydrograph heavy sediment loads continued to pass through the HFB spillway. The progression of the sediment delta toward the service spillway and canal diversion slowed as much of the sediment was drawn toward the HFB. No bed sediments were entrained into the canal during the test.

33
Figure 23 – HFB spillway plan and sections.
Figure 24 - HFB spillway locations tested in the model

34
A small amount bed material passed downstream through gate 1 into the spillway channel. Survey bed elevations of the post-test sediment deposition in the diversion pool are given in figure 27. Photographic records of the post-test sediment deposition are given in figure 28. A close range photogrammetric survey of the post-test diversion pool bed is shown in figure 29. At the end of the test flood, the leading edge of the sediment delta near the right bank was located about 100 ft upstream of the canal diversion thus allowing the canal to be operated at capacity during the entire flood. Surface sediment gradation
samples of the post-test bed near the dam do not indicate a significant change in bed material gradation occurred in the diversion pool, (figure 30). The data does show slightly finer material deposited adjacent to the channel boundaries.
Table 4 - Flow and water-surface elevations measured during test HFB-L6000. Hydrograph Qprototype Elevation (ft) Elevation (ft) Elevation (ft) Spillway Gate Operation
Duration, hr (cfs) Dam Fishway Exit Spillway Channel0 1431 766.54 766.30 742.10
2.23 2057 766.84 766.82 744.30 Gate 1 @ 5' & Gate 6 @ 2.5'4.47 3130 766.44 766.43 744.436.7 3667 765.14 765.18 744.73
8.94 4293 765.64 765.61 744.7910.06 5367 766.44 766.49 744.8911.17 6082 766.44 765.84 745.8112.89 4651 766.24 765.90 745.3515.12 3309 766.54 766.43 744.8917.35 2326 765.94 765.77 744.6619.58 1789 766.74 765.44 744.73 Gate 1 @ 5' ; Gate 6 @ 1'
3 canal gates open; Gate 1 @ 5'
Gate 1 @ 5' ; Gates 6,7 @ 5'Gate 1 @ 5' ; Gate 6 @ 5'Gate 1 @ 5' ; Gate 6 @ 2'
Gate 1 @ 5' & Gate 6 @ 4.0'Gate 1 @ 5' & Gate 6&7 @ 4.5'Gate 1 @ 5' & Gate 6&7 @ 5.0'Gate 1 @ 5' & Gate 6&7 @ 6.5'Gate 1 @ 5' & Gate 6&7 @ 10.0' & Gates 5&[email protected]'
Figure 25 - Sediment passing through the HFB spillway during the flood peak.

35
Figure 26 - Flow velocities measured during peak flow, test HFB-L6000.
Figure 27 – Post-test HFB-L6000 diversion pool bed elevations upstream of diversion dam.
36
Three views of Sediment in Diversion Pool with Left Bank HFB Spillway
View of Spillway Channel
View looking upstream at leftbank rock ramp
View of sediment depositionat fishway exit
Three views of Sediment in Diversion Pool with Left Bank HFB Spillway
View of Spillway Channel
View looking upstream at leftbank rock ramp
View of sediment depositionat fishway exit
Figure 28 – Post-test sediment deposition photographs for test HFB-L6000.

37
Figure 29 – Close range photogrammetry-generated plot of final channel elevations for test HFB-L6000. Elevations shown are model referenced to a zero datum at elevation 757.75.

38
Gradation Analysis
0.0
20.0
40.0
60.0
80.0
100.0
120.0
0 50 100 150 200 250 300 350 400
Particle Diameter (mm)
% P
assi
ng
Base Line Composite
Deposition - 330' from Canal Apronl
Deposition - 130' from Canal Apron
Deposition - 60' from Canal Apron
Figure 30 – HFB-L6000 surface sediment gradation sampled along a cross section located 63 ft upstream of the dam axis.
HFB-L14000 Test Results – The test was run for 7.0 hours in the model representing about 31 hours prototype, (table 5). Spillway gates were opened starting with gate 1 at a 5 ft opening followed by gates 6 and 7. When the river flow reached 7,000 ft3/s gates 5 and 8 were partially opened. At a flow of about 10,000 ft3/s gates 5-8 were fully open. At the flow peak all gates were fully open and the dam was overtopping by about 0.75 ft. Strong flow contractions off the upstream guide walls were visible on bays 4, 5 and 8 reducing flow capacity through those bays. The sediment delta extended downstream to the HFB spillway and started passing through the spillway after about 6.7 hrs
(prototype). Eleven hours into the flood (prototype) the sediment delta moving down the right bank inundated the fishway exit. After 15 hrs (prototype) the sediment delta reached the service spillway and was passing down the spillway channel. The spillway channel rapidly filled with sediment behind the rock weirs until the channel was flowing over a smooth bed of sediment. The large amount of bed material passing through the HFB resulted in the stilling basins downstream of gates 6 and 7 and to a lesser degree gates 5 and 8 filling with sediment when the gates were fully open, figure 31. The strong flow contraction through Bays 5 and 8 tended to sluice these basins along the inside walls where flow concentration
was highest. As in previous tests, some variation in water surface elevation occurred
Figure 31 - View of sediment filling the HFB stilling basin.
39
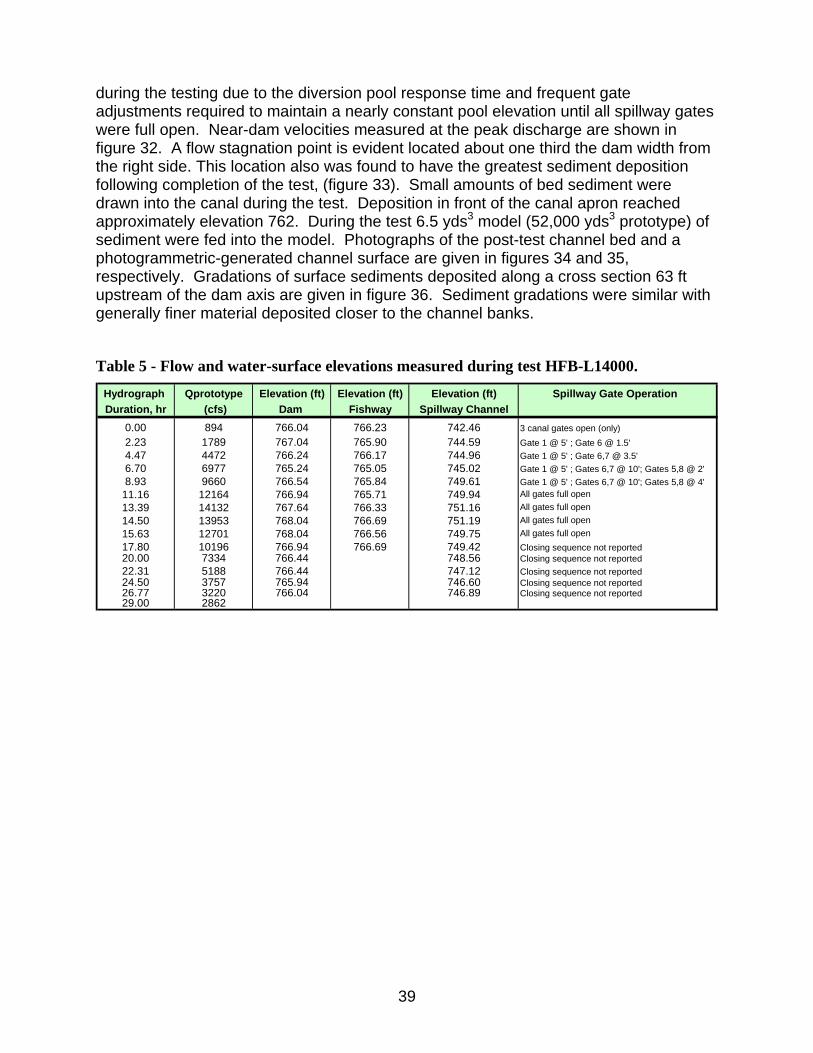
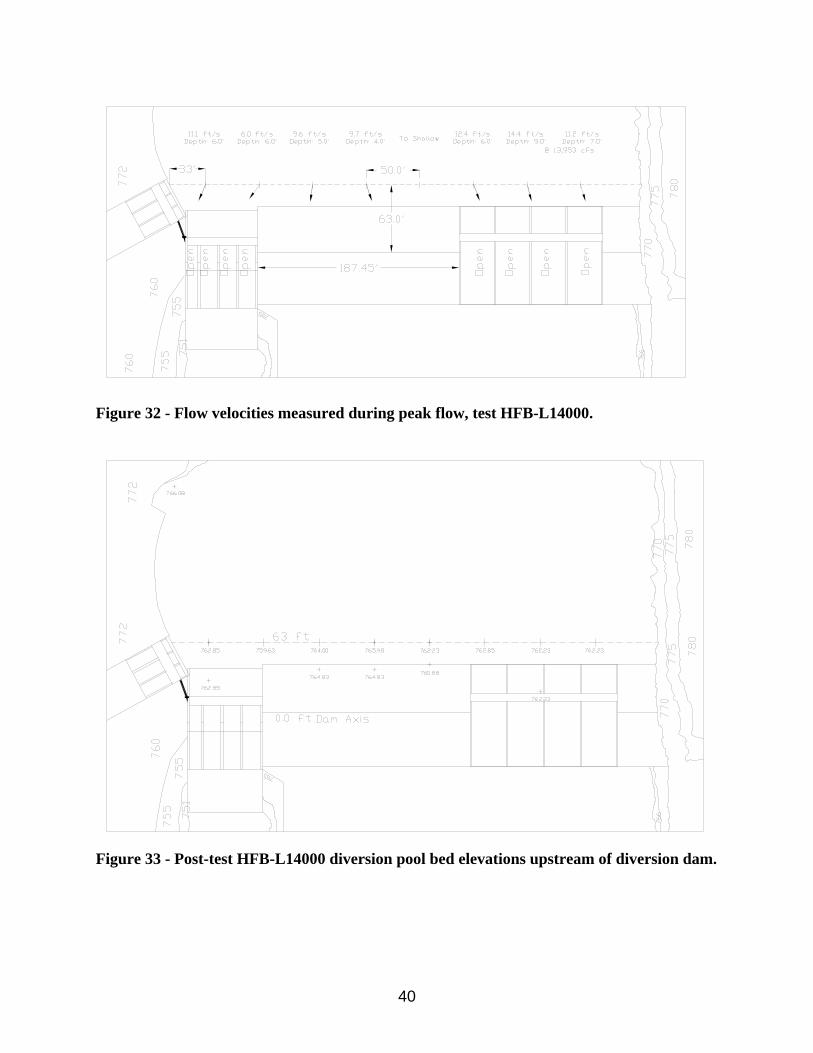
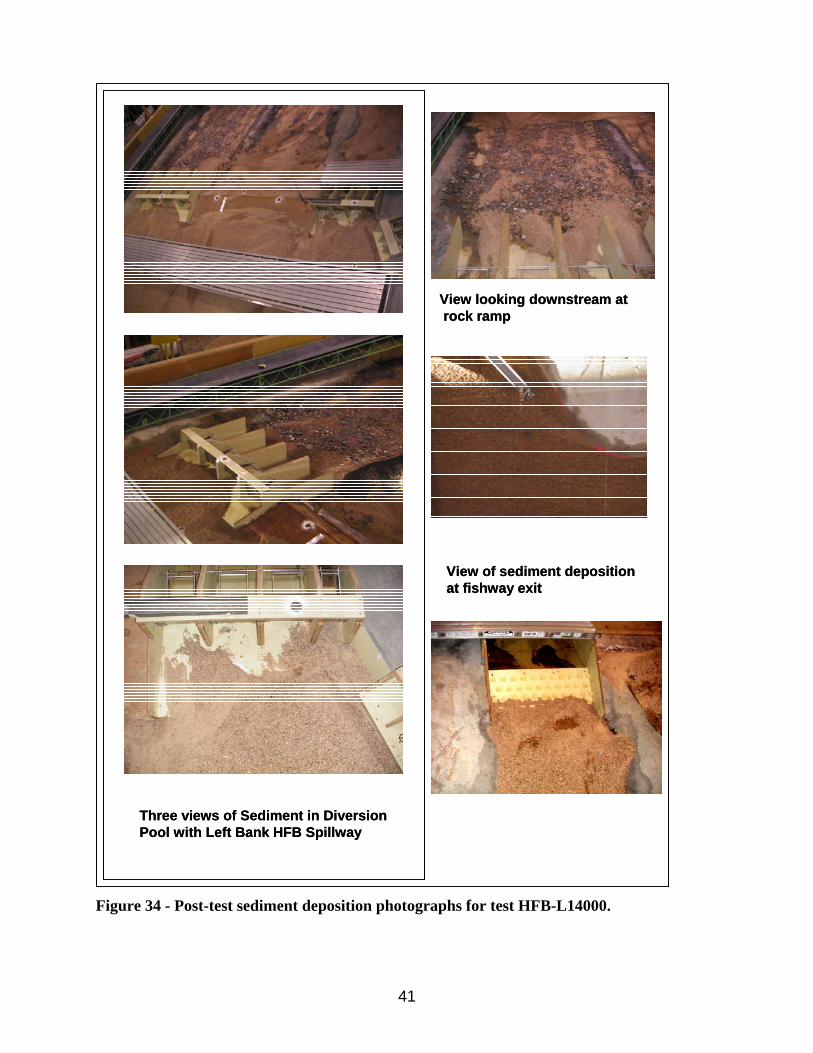
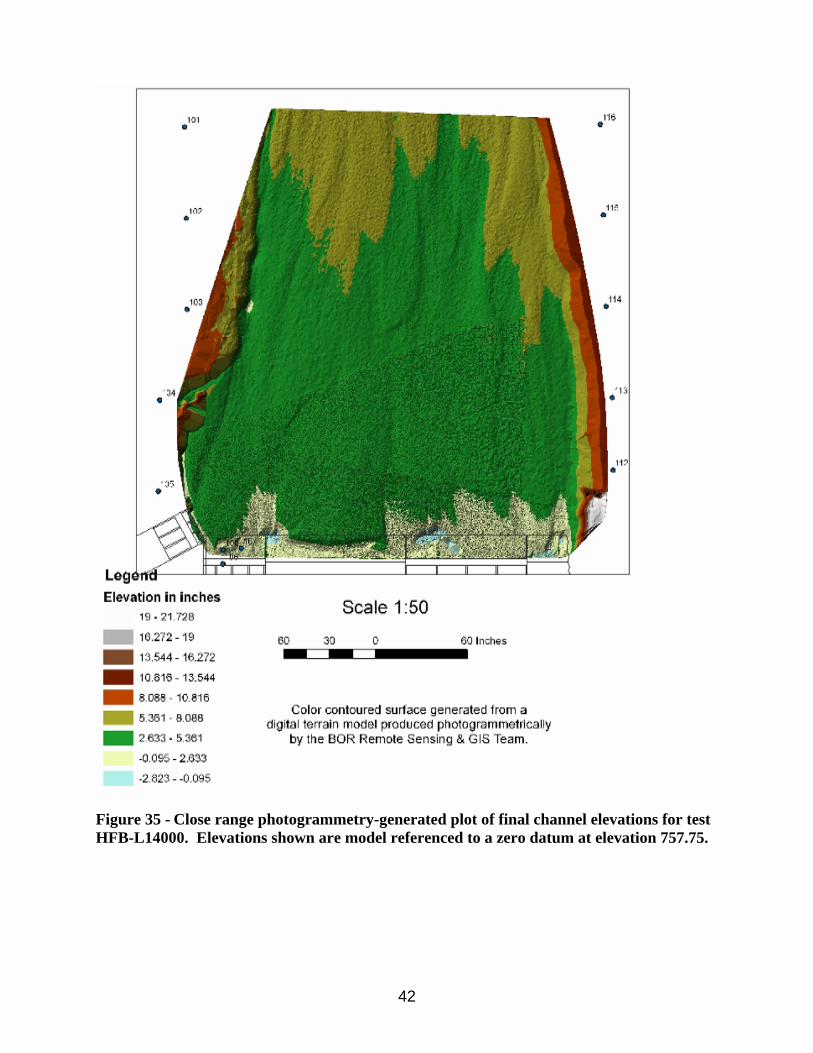
during the testing due to the diversion pool response time and frequent gate adjustments required to maintain a nearly constant pool elevation until all spillway gates were full open. Near-dam velocities measured at the peak discharge are shown in figure 32. A flow stagnation point is evident located about one third the dam width from the right side. This location also was found to have the greatest sediment deposition following completion of the test, (figure 33). Small amounts of bed sediment were drawn into the canal during the test. Deposition in front of the canal apron reached approximately elevation 762. During the test 6.5 yds3 model (52,000 yds3 prototype) of sediment were fed into the model. Photographs of the post-test channel bed and a photogrammetric-generated channel surface are given in figures 34 and 35, respectively. Gradations of surface sediments deposited along a cross section 63 ft upstream of the dam axis are given in figure 36. Sediment gradations were similar with generally finer material deposited closer to the channel banks.
Table 5 - Flow and water-surface elevations measured during test HFB-L14000. Hydrograph Qprototype Elevation (ft) Elevation (ft) Elevation (ft) Spillway Gate OperationDuration, hr (cfs) Dam Fishway Spillway Channel
0.00 894 766.04 766.23 742.462.23 1789 767.04 765.90 744.59 Gate 1 @ 5' ; Gate 6 @ 1.5'4.47 4472 766.24 766.17 744.966.70 6977 765.24 765.05 745.028.93 9660 766.54 765.84 749.61
11.16 12164 766.94 765.71 749.9413.39 14132 767.64 766.33 751.1614.50 13953 768.04 766.69 751.1915.63 12701 768.04 766.56 749.7517.80 10196 766.94 766.69 749.42 Closing sequence not reported20.00 7334 766.44 748.56 Closing sequence not reported22.31 5188 766.44 747.12 Closing sequence not reported24.50 3757 765.94 746.60 Closing sequence not reported26.77 3220 766.04 746.89 Closing sequence not reported29.00 2862
All gates full openAll gates full openAll gates full open
Gate 1 @ 5' ; Gates 6,7 @ 10'; Gates 5,8 @ 4'
3 canal gates open (only)
Gate 1 @ 5' ; Gate 6,7 @ 3.5'Gate 1 @ 5' ; Gates 6,7 @ 10'; Gates 5,8 @ 2'
All gates full open
40
Figure 32 - Flow velocities measured during peak flow, test HFB-L14000.
Figure 33 - Post-test HFB-L14000 diversion pool bed elevations upstream of diversion dam.
41
Three views of Sediment in Diversion Pool with Left Bank HFB Spillway
View looking downstream at rock ramp
View of sediment depositionat fishway exit
Three views of Sediment in Diversion Pool with Left Bank HFB Spillway
View looking downstream at rock ramp
View of sediment depositionat fishway exit
Figure 34 - Post-test sediment deposition photographs for test HFB-L14000.
42
Figure 35 - Close range photogrammetry-generated plot of final channel elevations for test HFB-L14000. Elevations shown are model referenced to a zero datum at elevation 757.75.

43
Gradation Analysis
0.0
20.0
40.0
60.0
80.0
100.0
120.0
0 50 100 150 200 250 300 350 400
Particle Diameter (mm)
% P
assi
ng
Base Line Composite
Deposition - 330' from Canal Apron
Deposition - 230' from Canal Apron
Deposition - 147' from Canal Apron
Deposition - 80' from Canal Apron
Deposition - 30' from Canal Apron
Figure 36 - HFB-L14000 surface sediment gradation sampled along a cross section located 63 ft upstream of the dam axis
Model Test Results for HFB Spillway Located Adjacent to the Service Spillway near the Right Bank The HFB spillway was moved to a location 30 ft to the left of the service spillway and tests of 6,000 ft3/s and 14,000 ft3/s peak flow hydrographs repeated. Within this document the location is referred to as the right bank location. Thirty foot separation from the service spillway was chosen to provide reasonable separation of structures for construction of the prototype. The location resulted in the center of Bay 8 of the HFB spillway being approximately centered in the river channel,(figure 24).
44
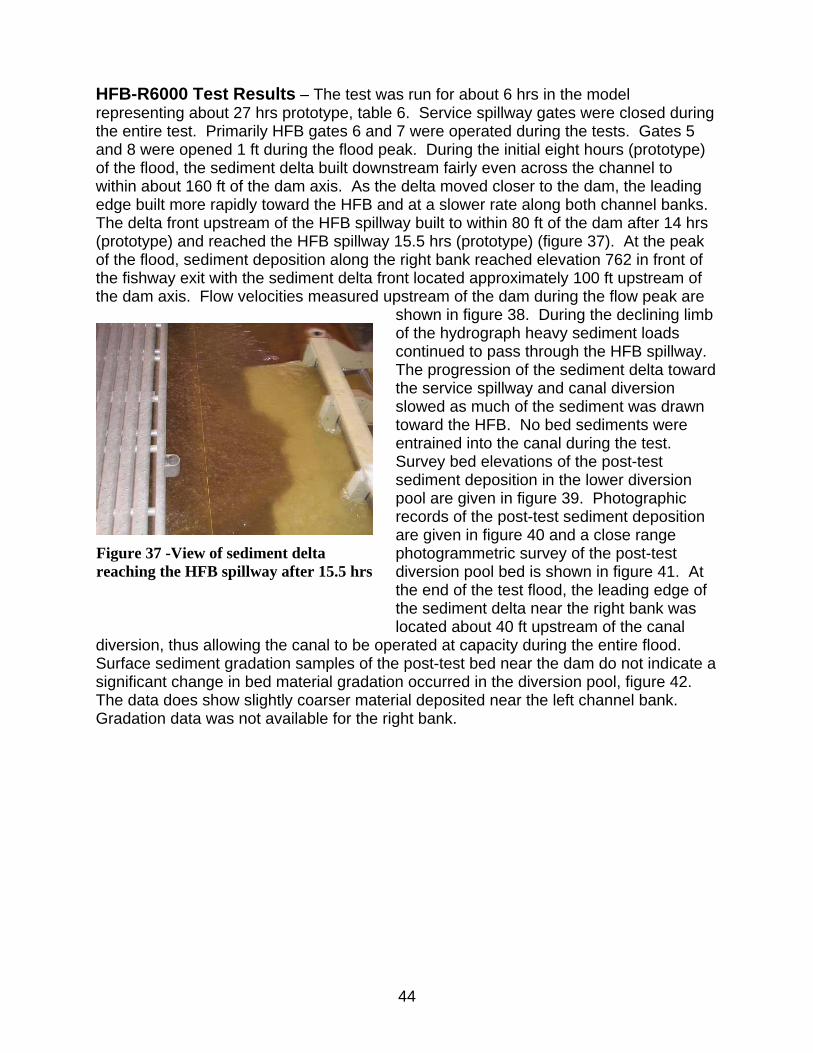
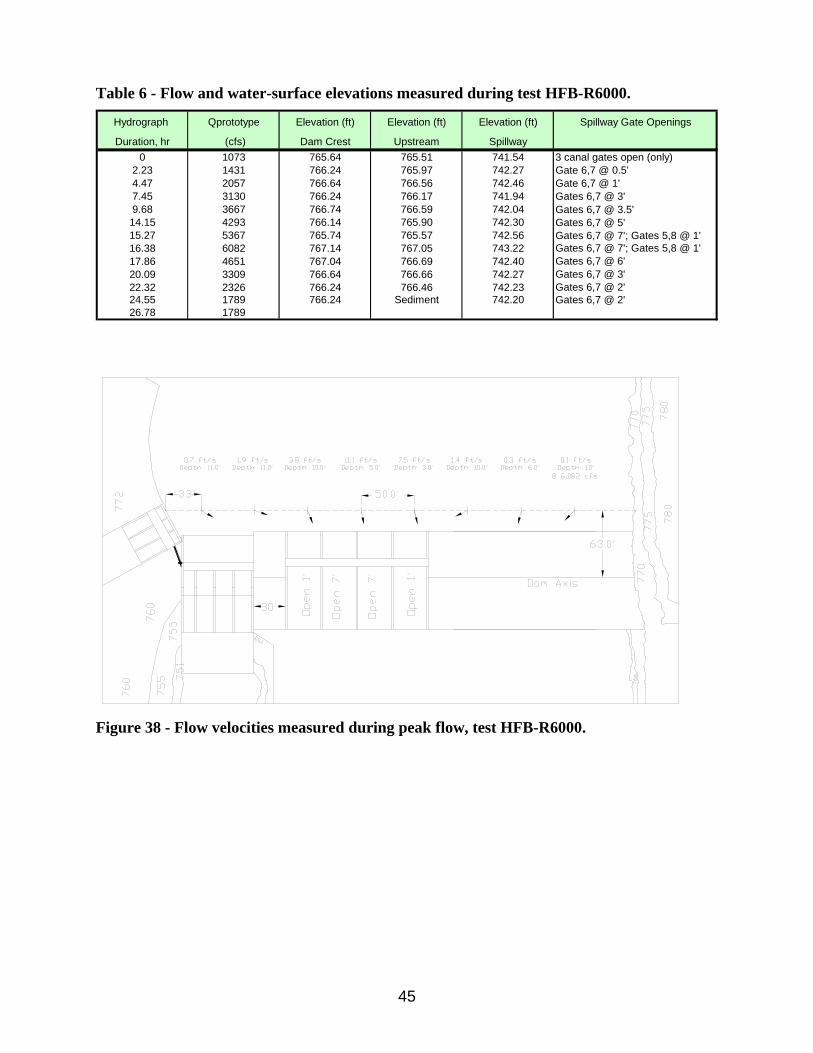
HFB-R6000 Test Results – The test was run for about 6 hrs in the model representing about 27 hrs prototype, table 6. Service spillway gates were closed during the entire test. Primarily HFB gates 6 and 7 were operated during the tests. Gates 5 and 8 were opened 1 ft during the flood peak. During the initial eight hours (prototype) of the flood, the sediment delta built downstream fairly even across the channel to within about 160 ft of the dam axis. As the delta moved closer to the dam, the leading edge built more rapidly toward the HFB and at a slower rate along both channel banks. The delta front upstream of the HFB spillway built to within 80 ft of the dam after 14 hrs (prototype) and reached the HFB spillway 15.5 hrs (prototype) (figure 37). At the peak of the flood, sediment deposition along the right bank reached elevation 762 in front of the fishway exit with the sediment delta front located approximately 100 ft upstream of the dam axis. Flow velocities measured upstream of the dam during the flow peak are
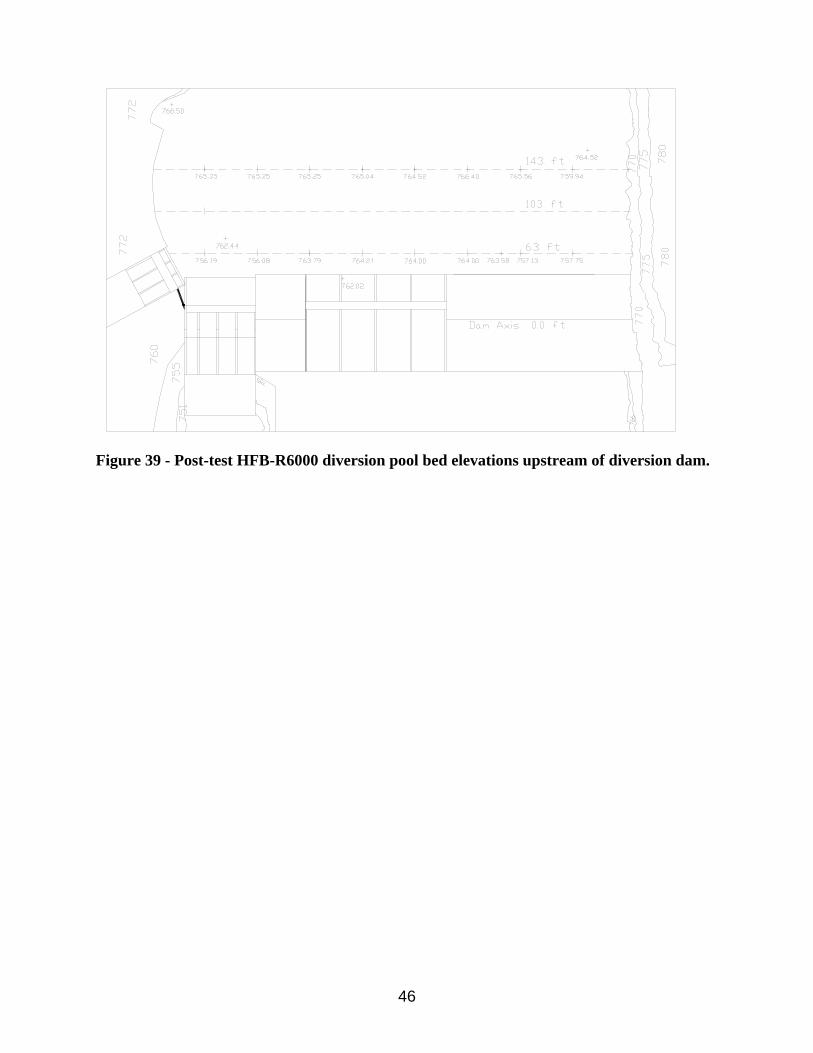
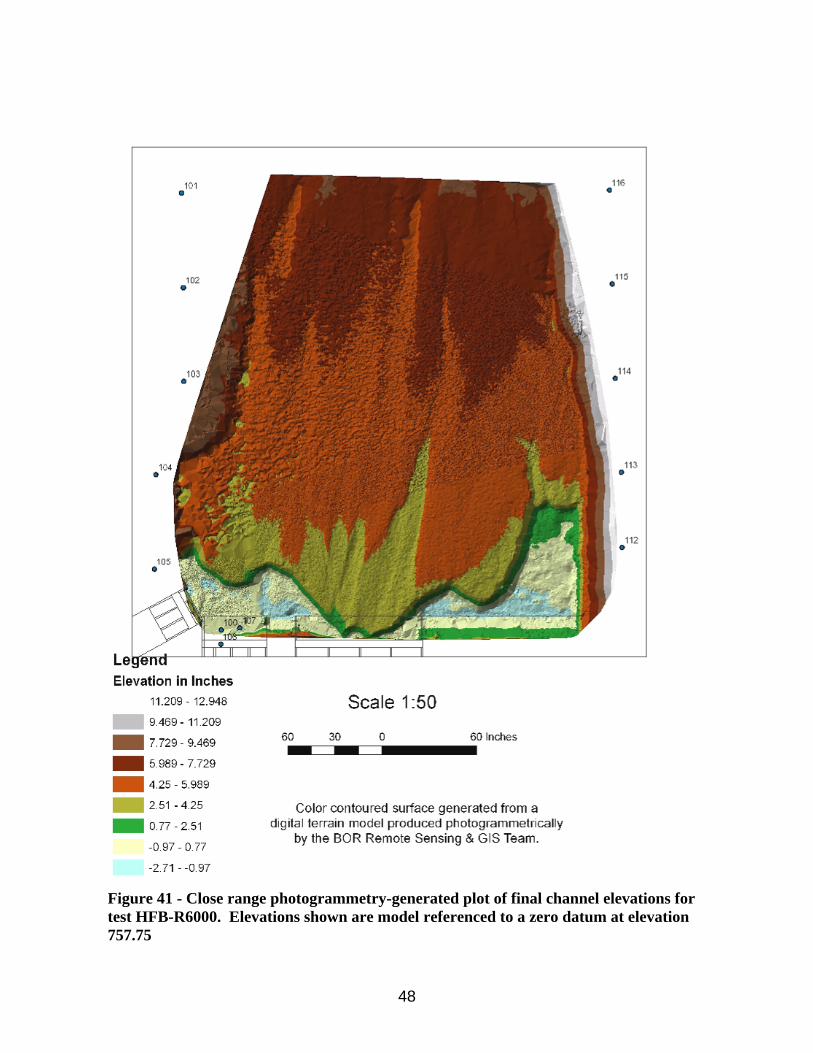
shown in figure 38. During the declining limb of the hydrograph heavy sediment loads continued to pass through the HFB spillway. The progression of the sediment delta toward the service spillway and canal diversion slowed as much of the sediment was drawn toward the HFB. No bed sediments were entrained into the canal during the test. Survey bed elevations of the post-test sediment deposition in the lower diversion pool are given in figure 39. Photographic records of the post-test sediment deposition are given in figure 40 and a close range photogrammetric survey of the post-test diversion pool bed is shown in figure 41. At the end of the test flood, the leading edge of the sediment delta near the right bank was located about 40 ft upstream of the canal
diversion, thus allowing the canal to be operated at capacity during the entire flood. Surface sediment gradation samples of the post-test bed near the dam do not indicate a significant change in bed material gradation occurred in the diversion pool, figure 42. The data does show slightly coarser material deposited near the left channel bank. Gradation data was not available for the right bank.
Figure 37 -View of sediment delta reaching the HFB spillway after 15.5 hrs
45
Table 6 - Flow and water-surface elevations measured during test HFB-R6000.
Hydrograph Qprototype Elevation (ft) Elevation (ft) Elevation (ft)
Duration, hr (cfs) Dam Crest Upstream Spillway0 1073 765.64 765.51 741.54
2.23 1431 766.24 765.97 742.274.47 2057 766.64 766.56 742.467.45 3130 766.24 766.17 741.949.68 3667 766.74 766.59 742.04 Gates 6,7 @ 3.5'14.15 4293 766.14 765.90 742.30 Gates 6,7 @ 5'15.27 5367 765.74 765.57 742.56 Gates 6,7 @ 7'; Gates 5,8 @ 1'16.38 6082 767.14 767.05 743.2217.86 4651 767.04 766.69 742.4020.09 3309 766.64 766.66 742.2722.32 2326 766.24 766.46 742.2324.55 1789 766.24 Sediment 742.2026.78 1789
Gates 6,7 @ 2'Gates 6,7 @ 2'
Gates 6,7 @ 6'Gates 6,7 @ 3'
Gates 6,7 @ 7'; Gates 5,8 @ 1'
Gates 6,7 @ 3'Gate 6,7 @ 1'Gate 6,7 @ 0.5'
Spillway Gate Openings
3 canal gates open (only)
Figure 38 - Flow velocities measured during peak flow, test HFB-R6000.
46
Figure 39 - Post-test HFB-R6000 diversion pool bed elevations upstream of diversion dam.

47
Looking Upstream at HFB Spillway
Looking Upstream at Service Spillway Stilling Basin
Views of the Sediment Delta In the Diversion Pool
Looking Upstream from the Left Bank
Dam Axis
Looking Upstream at HFB Spillway
Looking Upstream at Service Spillway Stilling Basin
Views of the Sediment Delta In the Diversion Pool
Looking Upstream from the Left Bank
Dam Axis
Figure 40 - Post-test sediment deposition photographs for test HFB-R6000.
48
Figure 41 - Close range photogrammetry-generated plot of final channel elevations for test HFB-R6000. Elevations shown are model referenced to a zero datum at elevation 757.75

49
Figure 42 - HFB-R6000 surface sediment gradation sampled along a cross section located 63 ft upstream of the dam axis.
HFB-R14000 Test Results – The test was run for 6.8 hours in the model representing about 30.5 hours prototype, table 7. The HFB spillway was operated during the flood with the objective of minimizing use of the service spillway. Gate 1 was opened 5 ft during the initial stage of the flood then closed and HFB gates 6 and 7 partially opened. When the river flow reached 7,000 ft3/s gates 6 and 7 were fully opened and gates 5 and 8 were partially opened. At a flow of about 10,000 ft3/s gates 5-8 were fully open and gates 2, 3 and 4 were partially open. All gates were fully open for flows above12,000 ft3/s. At the flow peak all gates were fully open and the dam was overtopping by about 0.2 ft. Strong flow contractions off the upstream guidewalls were visible on bays 4 and 5 and to a lesser degree on bay 8. The sediment delta extended downstream to the HFB spillway and started passing through the spillway after about 8 hrs (prototype). Ten hours into the flood (prototype) the sediment delta moving down
the right bank inundated the fishway exit. After 12 hrs (prototype) the sediment delta reached the service spillway and was moving along the canal apron wall and passing through the spillway (figure 43). As observed in previous tests, sediment passing through the service spillway deposited in the downstream channel forming a plain bed above the rock weirs. Similar to Test 5, the HFB stilling basins partially filled with sediment with the gates fully open. The basins self cleaned as the gates were partially closed during the recession of the flood. Near-dam velocities measured at the peak discharge are shown in figure 44. Flow velocities from 10 ft/s to 15 ft/s were measured upstream of the
Figure 43 – Sediment delta passing in front of the canal entrance and flushing through the service spillway.
Gradation Analysis
0.0
20.0
40.0
60.0
80.0
100.0
120.0
0 50 100 150 200 250 300 350 400Particle Diameter (mm)
Base Line Composite Deposition - 400' from Canal Apron
Deposition - 310' from Canal Apron
% P
assi
ng

50
spillways and low velocity flow on the left half of the channel. The sediment delta in front of the canal apron reached about elevation 762.0 during the declining limb of the flood resulting in small amounts of bed sediment being entrained into the canal. During the test 6.0 yds3 model (48,000 yds3 prototype) of sediment were fed into the model. Post-test bed elevations, photographs of the post-test channel bed and a photogrammetric-generated map of the post-test diversion pool bed, are given in figures 45, 46, and 47, respectively. Gradations of surface sediments deposited at cross section 63 ft upstream of the dam axis are given in figure 48. Sediment gradations were similar with generally finer material deposited close to the right bank. Table 7 - Flow and water-surface elevations measured during test HFB-R14000.
Hydrograph Qprototype Elevation (ft) Elevation (ft) Elevation (ft) Spillway Gate Operation
Duration, hr (cfs) Dam Fishway Exit Spillway Channel0 894 764.74 764.69 742.66 3 canal gates open (only)
2.23 1789 766.54 766.46 743.02 Gate 1 @ 5' 4.47 4472 766.44 766.23 744.56 Gate 1 closed; Gate 6,7 @ 5'6.7 6977 766.14 765.64 746.01 Gates 6,7 @ 10'; Gates 5,8 @ 4'8.94 9660 766.54 765.64 748.11 Gates 5-8 @ 10'; Gate 2 @ 7'; Gate 3,4 @ 5'
11.17 12164 766.64 765.61 749.55 All gates full open13.4 14132 767.34 765.57 750.20 All gates full open
14.52 13953 767.14 765.80 751.52 All gates full open16.38 12701 767.04 765.57 751.42 All gates full open18.61 10196 765.44 Sediment 751.55 Gates 1 and 2 closed20.84 7334 766.34 Sediment 749.91 Gates 1,2,4 and 8 Closed23.07 5188 765.44 Sediment 749.61 Gates 1,2,4, 7and 8 Closed25.3 3757 764.84 Sediment 748.96 Gates 1,2,4 and 7,8 Closed
27.53 3220 766.24 Sediment 749.38 Gates 1,2,3 & 4 open29.76 2862
Figure 44 - Flow velocities measured during peak flow, test HFB-R14000.

51
Figure 45 - Post-test HFB-R14000 diversion pool bed elevations upstream of diversion dam.

52
Diversion pool upstream of Dam
Sediment Deposition near Fishway Exit
Sediment Deposition in Spillway ChannelViews of Sediment Deposition Upstreamof the Spillways
Diversion pool upstream of Dam
Sediment Deposition near Fishway Exit
Sediment Deposition in Spillway ChannelViews of Sediment Deposition Upstreamof the Spillways
Figure 46 - Post-test sediment deposition photographs for test HFB-R14000.

53
Figure 47 - Close range photogrammetry-generated plot of final channel elevations for test HFB-R14000. Elevations shown are model referenced to a zero datum at elevation 757.75

54
Gradation Analysis
0.0
20.0
40.0
60.0
80.0
100.0
120.0
0 50 100 150 200 250 300 350 400
Particle Diameter (mm)
% P
assi
ng
Base Line Composite
Deposition - 400' from Canal Apron
Deposition - 290' from Canal Apron
Deposition - 150' from Canal Apron
Deposition - 30' from Canal Apron
Figure 48 - HFB-R14000 surface sediment gradation sampled along a cross section located 63 ft upstream of the dam axis.
Guide Wall Modifications to the Spillway Guide walls were added to reduce the flow contraction that occurred on the outside walls of service spillway bay 4 and HFB spillway bays 5 and 8. A strong flow contraction occurred off the left wall of bay 4 and to a lesser extent bay 3 of the service spillway. Flow velocities measured upstream of the dam in tests Ss6000 and Ss14000 show flow approaches the service spillway entrance at an angle. Adding a curved upstream guide wall extending about 21 ft into the diversion pool was found to effectively guide flow into the spillway. Figure 49 shows the guide wall arrangement tested for the service spillway with the right bank HFB spillway option. The discharge capacity of the service spillway with the guide wall extension on bay 4 was 5,800 ft3/s at pool elevation 767.1. Strong flow contraction occurred off the outer walls of HFB bays 5 and 8 for both spillway locations tested. Entrance conditions to the spillway were improved by adding curved guide walls extended into the diversion pool similar to the service spillway guide wall. Guide walls tested for the near right bank HFB spillway location are also shown in figure 49. Although not tested in the model, similar guide walls could be applied to the left bank HFB spillway location to improve entrance conditions. For the right bank HFB location shown, guide walls between bays 4 and 5 were tested as a single pier that improved flow into both bays. The discharge capacity of the HFB spillway with upstream guide walls was 9,900 ft3/s flow at pool elevation 767.1 (test conducted without sediment transport through the spillway).
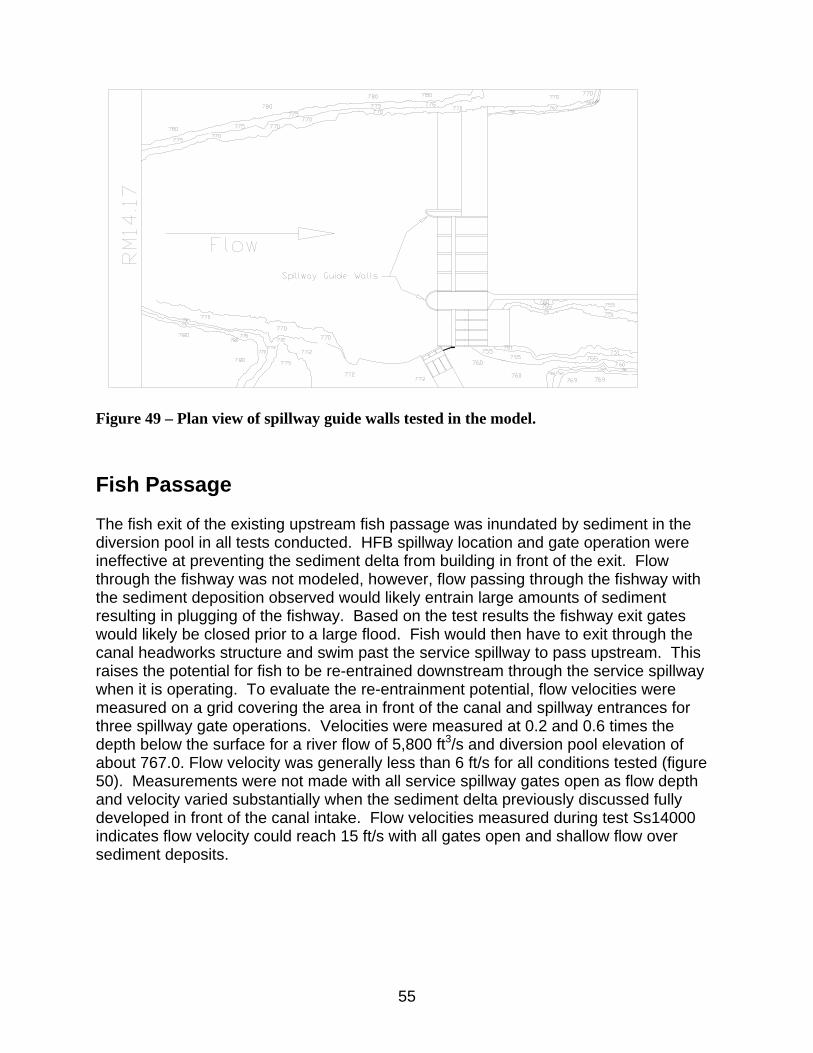
55
Figure 49 – Plan view of spillway guide walls tested in the model. Fish Passage The fish exit of the existing upstream fish passage was inundated by sediment in the diversion pool in all tests conducted. HFB spillway location and gate operation were ineffective at preventing the sediment delta from building in front of the exit. Flow through the fishway was not modeled, however, flow passing through the fishway with the sediment deposition observed would likely entrain large amounts of sediment resulting in plugging of the fishway. Based on the test results the fishway exit gates would likely be closed prior to a large flood. Fish would then have to exit through the canal headworks structure and swim past the service spillway to pass upstream. This raises the potential for fish to be re-entrained downstream through the service spillway when it is operating. To evaluate the re-entrainment potential, flow velocities were measured on a grid covering the area in front of the canal and spillway entrances for three spillway gate operations. Velocities were measured at 0.2 and 0.6 times the depth below the surface for a river flow of 5,800 ft3/s and diversion pool elevation of about 767.0. Flow velocity was generally less than 6 ft/s for all conditions tested (figure 50). Measurements were not made with all service spillway gates open as flow depth and velocity varied substantially when the sediment delta previously discussed fully developed in front of the canal intake. Flow velocities measured during test Ss14000 indicates flow velocity could reach 15 ft/s with all gates open and shallow flow over sediment deposits.
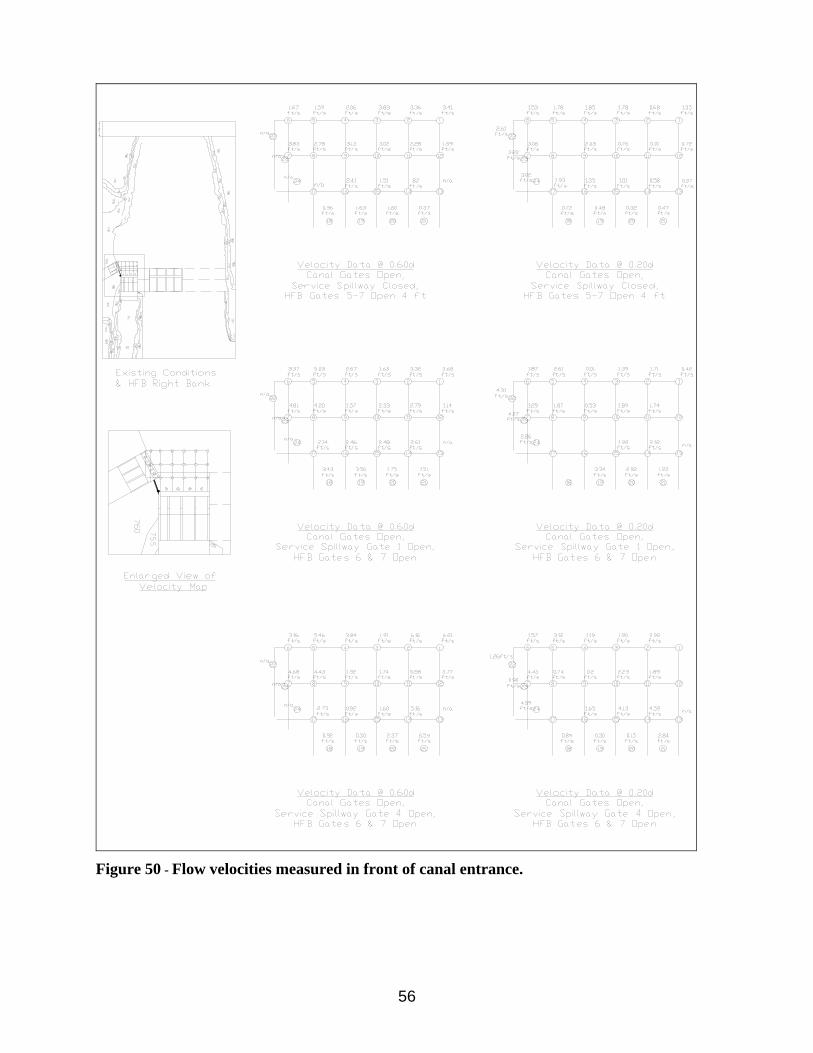
56
Figure 50 - Flow velocities measured in front of canal entrance.

57
Model tests of the HFB spillway conducted to evaluate spillway location included the existing channel topography downstream of the service spillway and a separate channel downstream of the HFB spillway. The two channels were separated by a rock berm that extended downstream about 900 ft. Several problems with the downstream channel configuration were identified during the model tests. The test results indicated the entrance to the fishway (figure 51) could be impacted by sediment deposition if the service spillway gates were used to pass significant flood flows. Sediment deposited to about elevation 750 in the fishway entrance pool and filled in the pools between rock weirs in the downstream channel. However, fishway flow was not modeled in the initial tests and therefore sediment deposition
near the fishway entrances may not have been fully represented in those tests. Concerns were also expressed by fishery agencies over the length of the channel separation downstream of the spillways. Separate spillway channels would restrict the movement of fish between spillway flows and could increase the risk of fish stranding following HFB operation. Stilling Pool Modifications - Previous model simulations of the ten-year flood resulted in substantial sediment deposition in the right bank fishway entrance pool when the service spillway was operated. Attempts to sluice sediment from the pool in the model were largely unsuccessful. To reduce sediment deposition in the pool and improve post-flood sluicing effectiveness, the floor of the fishway entrance pool was raised 2.75 ft to elevation 745.0. The fishway entrance slots were also raised to the new invert. The floor of the fishway entrance was left at elevation 742.25 to maintain sufficient depth on the fishway baffles. In the model, fishway flow was supplied to the fishway entrance structure to better evaluate sediment deposition near the structure. A single stilling pool concept was tested in the model as an alternative to the initial separate channel design. A single stilling pool would allow fish during HFB operation to move across the channel, providing better access to the fishway, figures 52 and 53. For the single pool concept, the HFB stilling pool and the downstream river channel were set higher than the river downstream of the service spillway to avoid a stagnate pool from forming downstream of the HFB during flow releases less than about 1,000 ft3/s. Tests of the single pool option identified several conditions that were undesirable. Most significantly, HFB spillway flow transported large amounts of sediment into the service spillway fishway entrance pool through the intertie between the pools. This eliminated the ability to control sediment deposition in the fishway entrance pool by adjusting spillway operation. Additionally, poor flow conditions for fish occurred during operation of the service spillway at flows above about 1,000 ft3/s with the HFB spillway closed. This type of operation resulted in flow moving into the HFB stilling basin and then flowing downstream as a wide shallow flow over the full width of the HFB end sill.
Figure 51 - Photograph of fishway entrances below Robles Diversion Dam service spillway (Casitas Irrigation District).

58
Tailwater elevations measured in the model for service spillway operation (HFB closed) are shown in figure 54. Both sediment and flow conditions were improved by extending the length of the HFB stilling basin 11.7 ft (basin floor length of 46.7 ft) and extending the right wall of bay 5 to the downstream end of the stilling pool, figures 55 and 56. A sluice gate was placed in the wall separating the service spillway and HFB spillway stilling pools to allow controlled movement of water between the stilling pools. Tests of the downstream wall extension resulted in no discernable movement of HFB sediment into the fishway entrance pool. The wall extension also prevented flow from the service spillway into the HFB spillway when the sluice gate was closed. The sluice gate allowed for draining the HFB basin into the lower service spillway pool following HFB operation. Operation of the service spillway during the ten-year flood resulted in about 2 to 3 ft of sediment in the fishway entrance pool following a ten-year flood simulation, figure 57. Following the flood, the service spillway was operated at 2,500 ft3/s for about eight hours prototype in an attempt to sluice material out of the fishway entrance pool. The sluicing exercise resulted in only localized scouring of material located near the base of the baffled apron, figure 58. The top three rows of baffles on the baffled apron energy dissipater were then removed in the model to determine if sluicing of the fishway entrance pool could be improved. The service spillway was again operated at full pool for eight hours prototype at 2,500 ft3/s at full pool. Removing the baffles showed improved sluicing of sediment with material being removed from the upstream one-half of the pool, figure 59. Left Bank Fishway - To further improve fish passage during HFB operation, a new fishway was proposed adjacent to the left wall of the HFB spillway and the dam crest was raised approximately 1.5 ft to elevation 768.75 (figure 60). During the model testing it was evident that operation of the HFB spillway, new fishway, and diversion would all benefit from having a greater range of diversion pool elevation prior to overtopping the dam. For the final model tests the crest of the dam was raised and the full diversion pool elevation was set at 768.0. The left side fishway would only operate during HFB spillway operation. The fishway exit is shown integrated with the guide wall upstream of spillway bay eight. The maximum head drop across the fishway is about 12 ft assuming a minimum flow release of 2,500 ft3/s from the HFB spillway. Tailwater elevations measured in the model HFB stilling basin are shown in figure 61. The fishway was designed to pass about 170 ft3/s at pool elevation 768.0. The fishway exit was modeled as a 20 ft long sill with a crest elevation of 766.0. An overshot gate was proposed for the sill to close off the fishway when the HFB spillway was not operating. The gate was not represented in the model. The fishway modeled was 32 ft wide with 12 baffles spaced at 12.2 ft centers at an invert slope of 8.2 percent. Fishway entrance and exit flow conditions were investigated in the model. Fishway baffles were installed in the model fishway, however flow conditions within the fishway were not investigated due to the small size of the fishway in the model. Two types of fishway baffles are offered herein for consideration. First is a modified Ice Harbor weir and orifice style baffle, figure 62. Each baffle is 8 ft high with 4-2 ft square orifices located flush with the bottom and two 11 ft long weirs adjacent to the outer walls. In the center of the baffle is a 10-ft-long non-overflow wall. The pools would have an energy dissipation factor (EDF) of 3.5 ft-lbs/s/ft3 at 170 ft3/s flow.

59
The second proposed baffle design is a multiple slot roughened channel design developed by the author to mimic several important attributes of flow in a natural stream, figure 63. The baffles cause a pool and drop pattern and direct the flow toward the center of the channel creating the highest velocity in the center with lower velocity near channel edges. The rock-lined trapezoid channel produces great variability of flow depth and velocity from deep higher-velocity flow in the channel center to shallower near-bank flow with low velocity. The baffles can be designed to control flow over a wide range of head change by extending all baffles to the maximum water surface design height, or baffles near the center of the channel can be shorter and allowed to overtop as the upstream water level rises during a flood. Using shorter baffles in the center of the fishway that become submerged results in rapid increases in flow passing down the center of the fishway channel. This has proven desirable where a rapid rise in through-fishway flow is needed to produce good attraction during high river flows while providing passage conditions near the channel boundaries. The HFB fishway shown herein designed on the streaming flow concept would be a 32-ft-wide rock-lined trapezoidal channel with a 10-ft-wide bottom and 3H:1V side slopes. Typical baffles for this style fishway are composed of individual rock boulders or concrete columns set in an upstream-aligned chevron shape and spaced about 1.0 to 1.5 ft apart, depending on design flow. Boulders are typically used on lower gradient fishways with pool lengths of greater than 15 ft and a flow depth under normal conditions of less than 4 ft. Concrete columns have the advantage that they can be constructed to any height and diameter. Therefore, when strong control of the fishway flow is desired and flow depths exceed about 4 ft, columns are recommended. This design has been used for numerous non-salmonid fishways at slopes up to 5 percent, and the fishway design has proven to work well where large flows are passed through the fishway.
Figure 52 – Illustration of single spillway pool concept.

60
Figure 53 – Single pool concept shown with service spillway releases of 1,000 ft3/s.
Downstream Channel - Downstream of the two spillways the channels merge into a common channel with a low flow channel along the right bank. The rock berm previously separating the channels was removed and the channel shape modified to gradually merge HFB flow with the service spillway flow. The channel downstream of the service spillway was modeled with a 20-ft-wide low flow channel at elevation 750.0. To the left of the low flow channel, the channel sloped up at 1 on 5 to elevation 751 and then at approximately 1 percent to the left side of the service spillway channel. The invert elevation of the low flow channel at the downstreamend of the fishway pool was held similar to existing to maintain the required tailwater on the fishway. The low flow channel was sloped at 1.5 percent until intersecting the existing channel elevation, a distance of about 400 ft. The invert elevation of the channel downstream of the HFB stilling pool was set at 753.25. The channel was sloped downstream at 2.0 percent and 0.25 percent normal to the downstream direction until intersecting the low flow channel. The left bank of the HFB channel was converged toward the low flow channel as shown in figure 60. Combined spillway operation and right and left bank fishway operation are shown in figure 64. Several photographs show dye streaks to highlight the direction of flow movement. The channel flowing at 2,500 ft3/s released from the service spillway following a ten year flood simulation is shown in figure 65. Service Spillway Modifications Increasing the diversion pool by about 1 ft requires several modifications to the existing spillway. The top of the existing service spillway gates is 767.25. A 1 ft pool raise would also require the top of the gates be raised approximately 1 foot. The model also showed the hydraulic jump in the service spillway stilling basin could sweep out of the basin under the higher diversion pool. To hold the jump in the basin, the endsill was raised 1.5 ft.

61
Service Spillway Tailwater Elevation
y = -3E-07x2 + 0.0027x + 750.34R2 = 0.9791
749
750
751
752
753
754
755
756
757
758
0 1000 2000 3000 4000 5000
Service Spillway Discharge, cfs
Tailw
ater
Ele
vatio
n, ft
Figure 54 –Water surface elevation measured in right bank fishway entrance pool.
Figure 55 – View of stilling pool guide wall extension added to prevent sediment from being pulled into the right bank fishway entrance pool.
Fishway Entrance

62
Figure 56 - Sections through the HFB spillway and service spillway.
Figure 57 - Sediment deposition in the right bank fishway attraction pool following a ten year flood simulation.
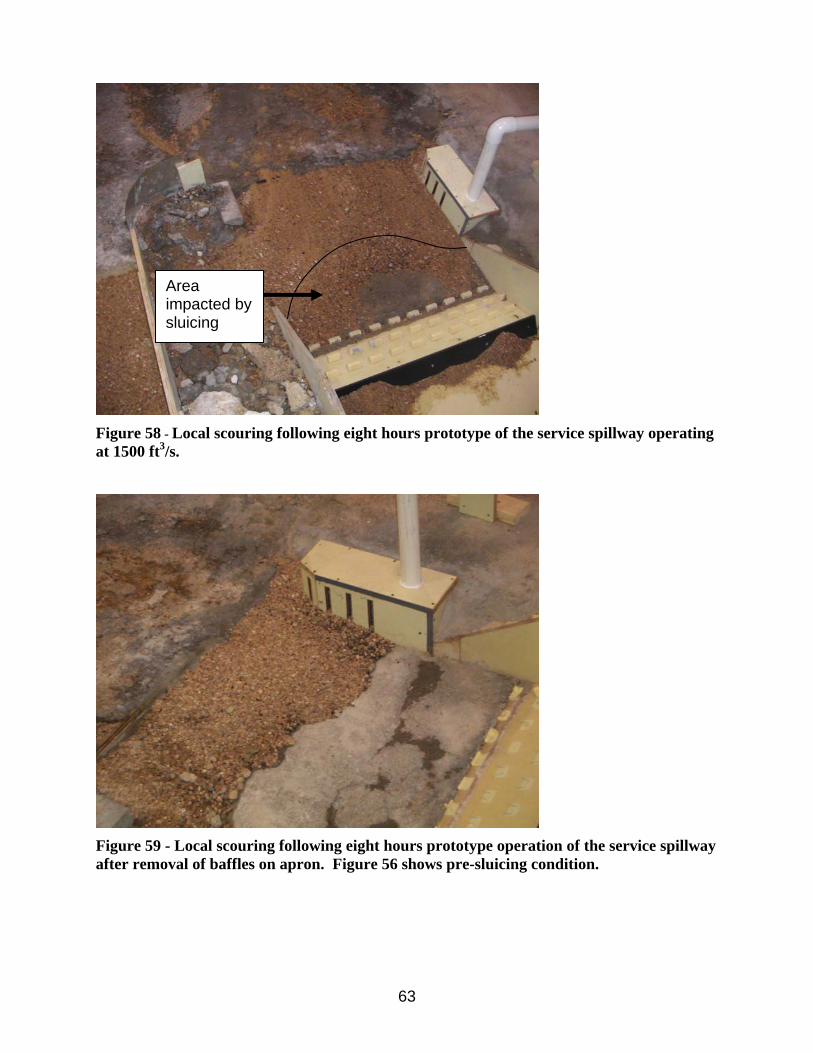
63
Figure 58 - Local scouring following eight hours prototype of the service spillway operating at 1500 ft3/s.
Figure 59 - Local scouring following eight hours prototype operation of the service spillway after removal of baffles on apron. Figure 56 shows pre-sluicing condition.
Area impacted by sluicing
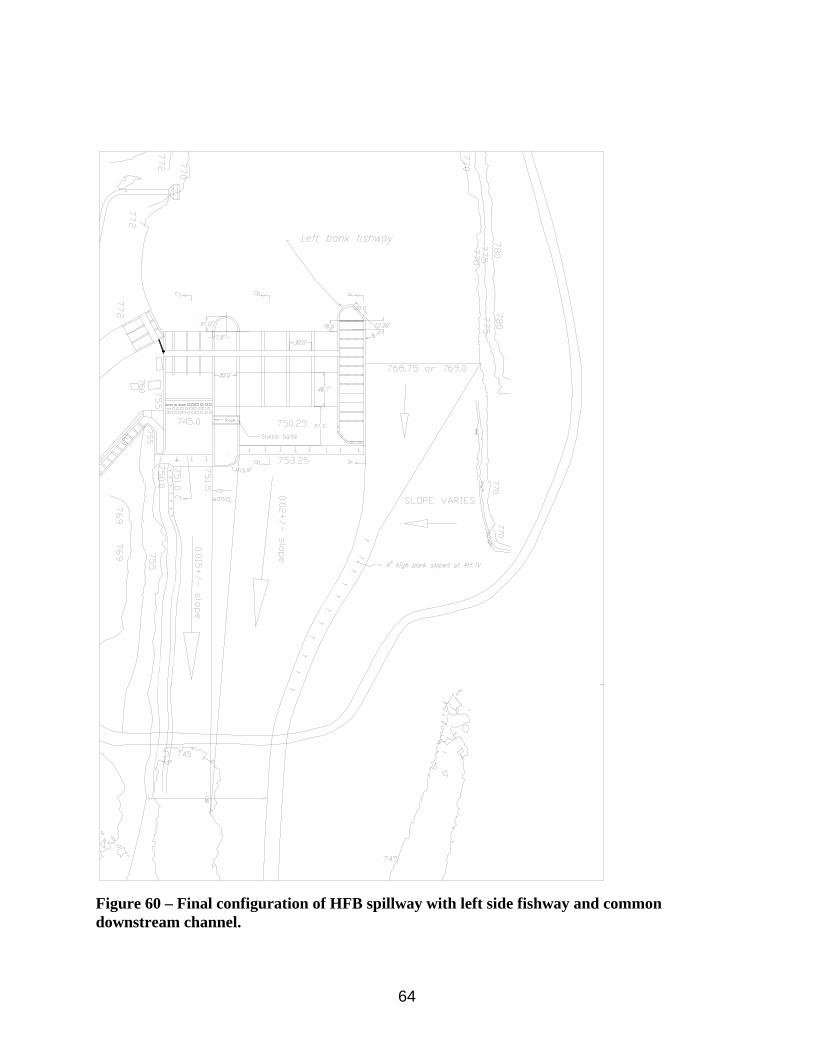
64
Figure 60 – Final configuration of HFB spillway with left side fishway and common downstream channel.
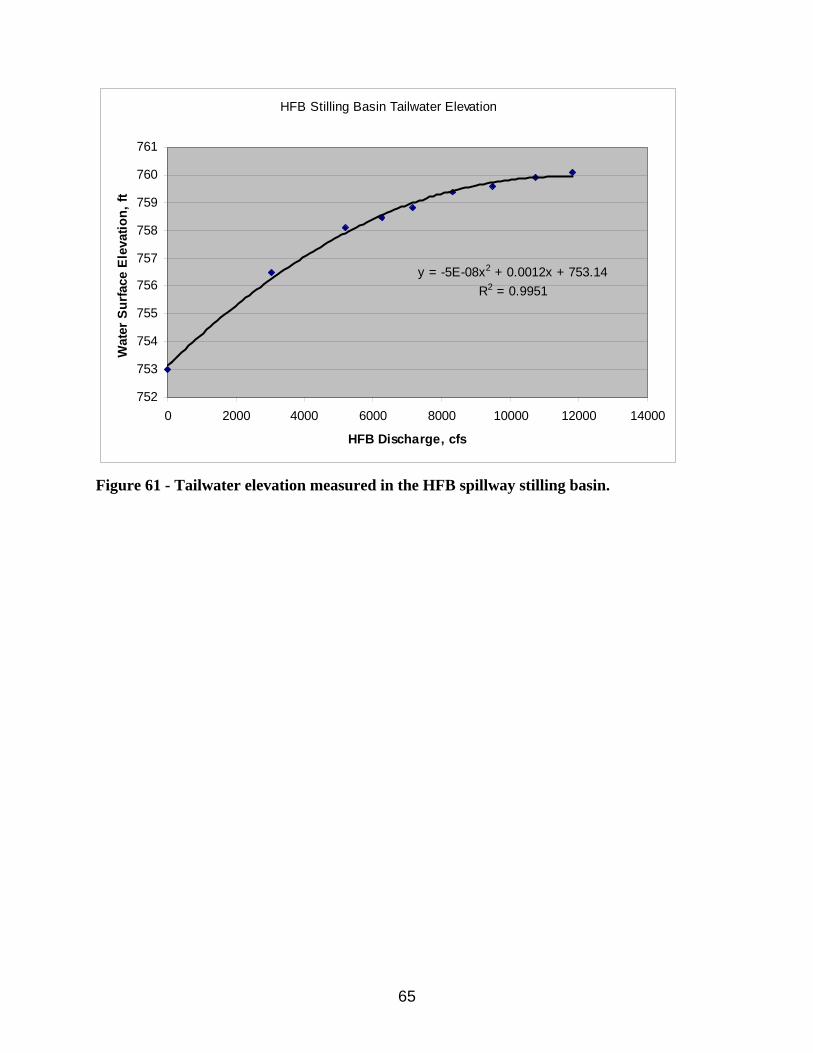
65
HFB Stilling Basin Tailwater Elevation
y = -5E-08x2 + 0.0012x + 753.14R2 = 0.9951
752
753
754
755
756
757
758
759
760
761
0 2000 4000 6000 8000 10000 12000 14000
HFB Discharge, cfs
Wat
er S
urfa
ce E
leva
tion,
ft
Figure 61 - Tailwater elevation measured in the HFB spillway stilling basin.

66
Figure 62 - HFB spillway left side fishway shown with weir and orifice baffles. (Baffle dimensions shown are preliminary.)
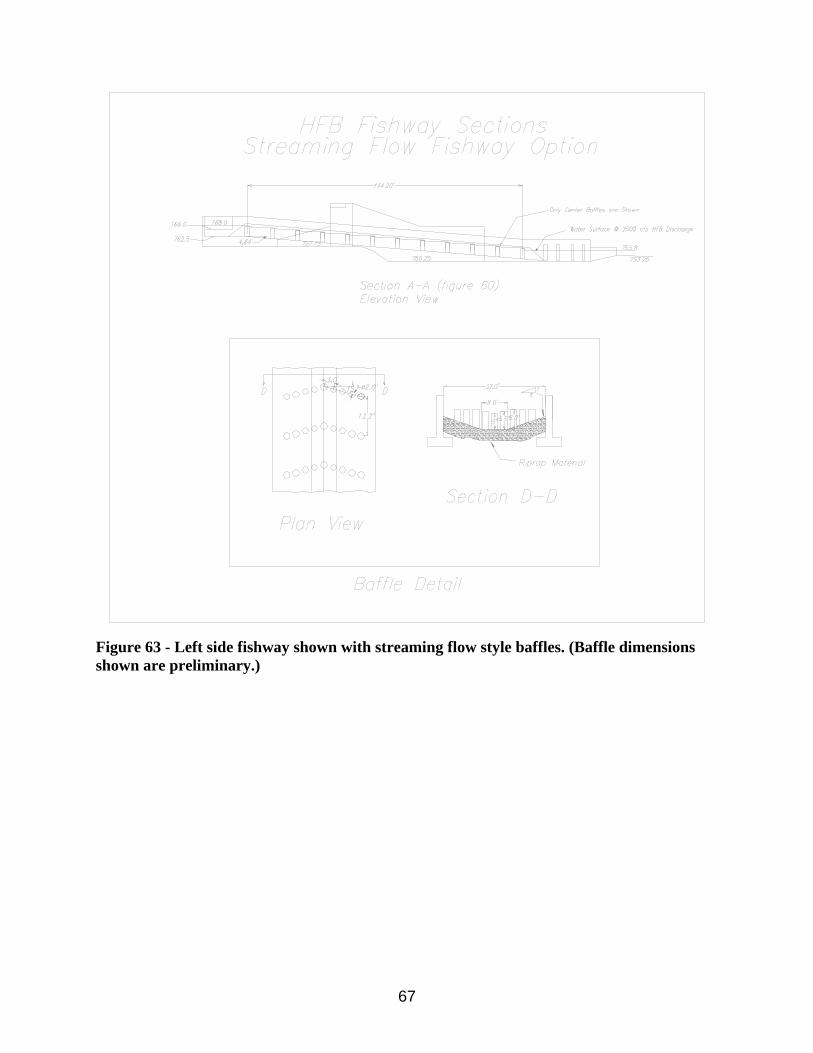
67
Figure 63 - Left side fishway shown with streaming flow style baffles. (Baffle dimensions shown are preliminary.)
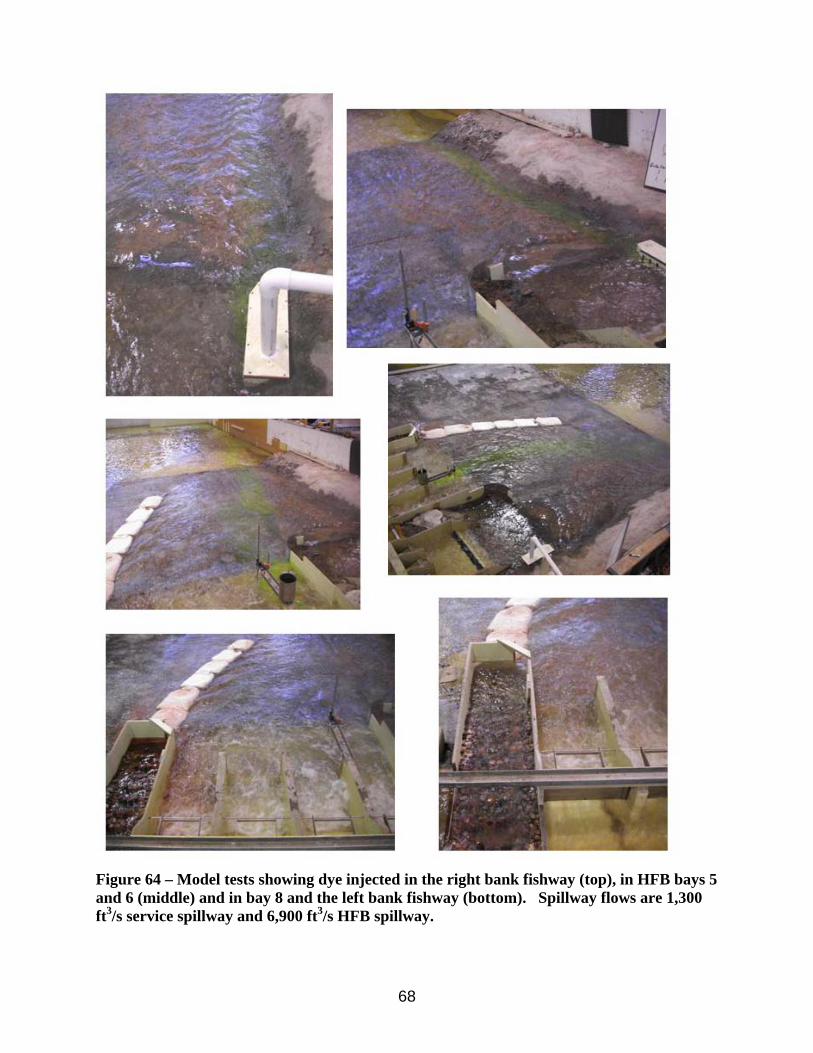
68
Figure 64 – Model tests showing dye injected in the right bank fishway (top), in HFB bays 5 and 6 (middle) and in bay 8 and the left bank fishway (bottom). Spillway flows are 1,300 ft3/s service spillway and 6,900 ft3/s HFB spillway.

69
Figure 65 – Photograph of 2,500 ft3/s released from the service spillway gates flowing down the final downstream channel geometry during the declining limb of a ten year flood simulation. HFB spillway gates are closed.
70
References
1. Dodge R. A. 1988. Overtopping Flow on Low Embankment Dams – Summary Report of Model Tests. US Bureau of Reclamation Hydraulics Laboratory. Report No. REC-ERC 88-3.
2. Dodge R.A. 1954. Milburn Diversion Dam Model Study Missouri River Basin Project, Nebraska, Progress Report No. 4. General Studies of Headworks and Sluiceway Structures. U.S. Bureau of Reclamation Hydraulics Laboratory. Report No. Hyd-385.
3. Franco J. J., 1978. Guidlelines for the Design, Adjustment and Operation of Models for the Study of River Sedimentation Problems. U.S. Army Corps of Engineers, Waterways Experiment Station.Vicksburg, Mississippi.
4. Hall E., et al. 2000, Matilija Dam Removal Apprasial Report, Bureau of Reclamation, Technical Service Center, Denver, Colorado.
5. Pugh A. C. 1985. Hydraulic Model Studies of Fuse Plug Embankments. U.S. Bureau of Reclamation Hydraulics Laboratory. Report No. REC-ERC 85-7.
6. Shen, W. Hsiew, 1971. River Mechanics Vol. II. Chapter 21, Modeling of Fluvial Processes, Colorado State University, Fort Collins, Colorado
7. Y.G. Lai and B.P. Greimann, 2008. "Two-Dimensional Numerical Model Study of Sediment Movement at the Robles Diversion Dam on the Ventura River, California", Sedimentation and Rivers Group, Bureau of Reclamation, Denver Technical Center, Denver Colorado.

71

![· tablecimientos Robles: Casa Robles (C/ Álvarez Quintero, 58 / 954213150); Robles Laredo (C/ Sierpes, 90 (esq. Plaza San Francisco] 954293232); Robles Placentines (C/ Placentines,](https://img.dokumen.tips/doc/110x75/5fa721a67176845ed43b8340/tablecimientos-robles-casa-robles-c-lvarez-quintero-58-954213150-robles.jpg)