Embed Size (px)
Citation preview

Robert Messenger, BS, RRTRespiratory Clinical Education Specialist
Invacare Corporation
Relevant Disclosures Respiratory Clinical Education Specialist, Invacare
Corp.
Other Associations▪ Coleman Research Group▪ Guidepost Global Advisors▪ Remedy Sleep Centers


Early O2 and HME payment models afforded high labor and service intensity with excellent profit
Over the last 20+ years oxygen and other HME payments have been significantly decreased
Operational costs have increased steadily in the same 20 year period, with particular increases in delivery & delivery related costs
Modern O2 users are more stable, active and ambulatory…and more demanding

Demand for home O2 therapy is ever increasing, as is the demand for ambulatory systems
NCB and other payment reduction initiatives will continue to push reimbursement down
The HME industry is relatively immature with few standardized process and accurate benchmarks
Technology offers cost shifting and total cost reductions without compromising service and care

HME is a relatively young industry just beginning to experience signs of maturity
Normal industry maturing includes Greater regulatory oversight Price (reimbursement) compression Manufacturer/supplier consolidation Competitor consolidation Typically results in fewer but larger competitors
COGs leveling or increases Maturing products level, new
products cost more Margin compression SG&A increases

Despite the changing reimbursement and continued operational cost challenges, home O2 can be provided in clinically sound, patient focused, operationally efficient and cost beneficial manner

25
50
75
100
125
150
175
200
1997
1998
1999
2000
2001
2002
2003
2004
2005
2006
2007
2008
2009
2010
Hospital and Related ServicesNursing Homes &Adult Day Care
Physicians
NOTE: The values shown for Medicare oxygen payment rates for 2008, 2009, and 2010 include the estimated combined effects of payment rate reductions from DMEPOS competitive bidding (2008-2010), and decreases in total Medicare spending for home oxygen (2009-2010) resulting from the impact of the 36-month rental cap in January 2009. Other figures reflect consumer price index (CPI) for various price categories (Bureau of Labor Statistics).
Oxygen Therapy Payment Rate


Charlotte, NC$122.12
Cincinnati, OH$106.60
Cleveland, OH$103.00
Dallas, TX$123.00
Miami, FL$125.00
Orlando, FL$115.00
Pittsburg, PA$102.84
Riverside, CA$122.90
Kansas City, MO$125.00
Portable Oxygen: $28.77 → $20.81 (- 27%)
OGPE: $51.63 → $41.88 (- 18%)


In 2010 COPD costs the US est. $29.5 billion in direct costs & $20.4 billion in indirect costs1
14.8 million Americans diagnosed with COPD2
150 million days of lost work annually1
A person with COPD dies every 4-minutes in the US3
3rd leading of cause of death4
2nd leading cause of disability1
1. NHLBI: Morbidity and Mortality: 2007 Chartbook on Cardiovascular, Lung and Blood Diseases.
2. CDC Fast Facts: COPD. http://www.cdc.gov/nchs/fastats/copd.htm - accessed 3/17/11.
3. Extrapolated from CDC data: http://www.cdc.gov/mmwr/preview/mmwrhtml/mm5745a4.htm - accessed 3/24/11
4. National Vital Statistics Reports Volume 59, Number 2. http://www.cdc.gov/nchs/data/nvsr/nvsr59/nvsr59_02.pd//f

COPD ranks #3 in acute hospital admissions (DRG: 088) 672,000 COPD discharges in 20061
Avg. annual hospitalized days 8.182
Avg. LOS 5.1 days3
Avg. per day cost $2,9594
Avg. total cost/admission $15,0934
Avg. payment/admission $19,6355
22.6% of COPD patients are readmitted within 30-days6
There are an est. 1.4 – 1.5 million home oxygen users1. CDC. National Hospital Discharge Survey, 1979-2006. 2006 Unpublished Data.2. Schneider KM, O’Donnell BE, Dean D. Prevalence of multiple chronic conditions in the United States’
Medicare population. Health Qual Life Outcomes. 2009;7:82.3. http://www.health.ny.gov/nysdoh/hospital/drg/2009_siw.pdf4. Dalal AA, Christensen L, Liu F, Riedel AA. Direct costs of chronic obstructive pulmonary disease
among managed care patients. Int J COPD 2010;5:341-49.5. 2007 Medicare PPS Inpatient Hospital Discharge Data.6. Jencks SF, Williams MV, Coleman EA. Rehospitalizations among patients in the Medicare fee-for-
service program. N Eng J Med 2009;360:1418-28.
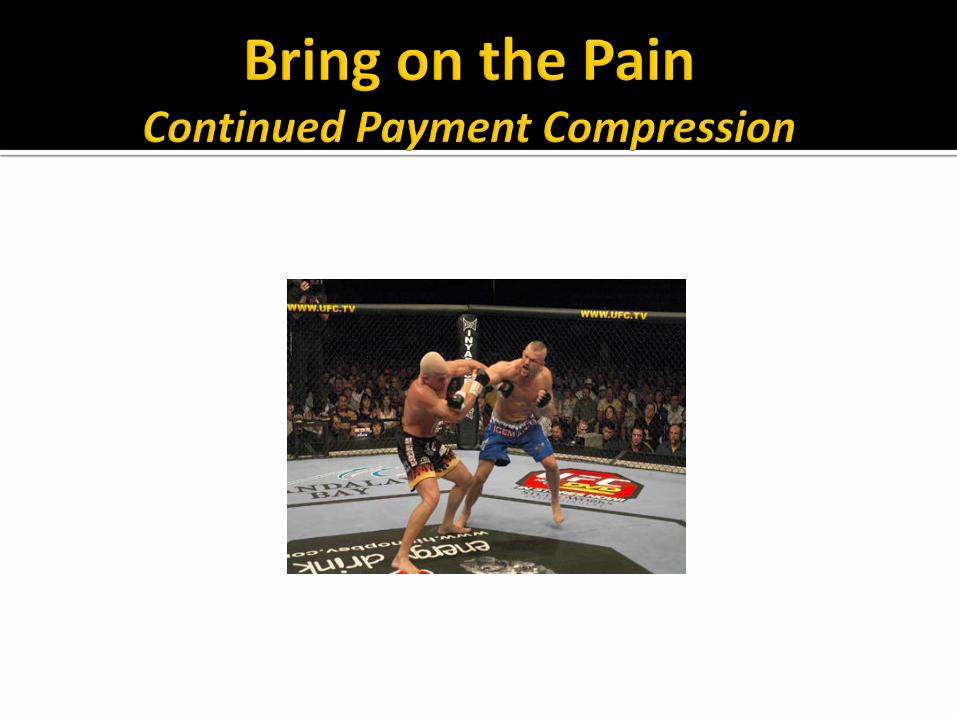
CONCENTRATORS E1390YEAR CHARGES CLAIMS PATIENTS2004 $2,235,894,826 10,119,765 843,3142005 $2,226,690,832 10,898,491 908,2082006 $2,345,492,182 11,722,524 976,8772007 $2,386,826,316 12,015,169 999,5092008 $2,536,595,964 12,712,109 1,059,3422009 $1,771,951,097 10,129,045 844,087
LIQUID STATIONARY E0439YEAR CHARGES CLAIMS PATIENTS2004 $153,508,470 737,321 61,4432005 $143,814,414 724,639 60,3872006 $136,594,841 682,936 56,9112007 $130,285,460 653,005 54,2862008 $134,480,871 670,925 55,9102009 $78,002,048 441,063 36,755
OGPE Transfill Devices K0738YEAR CHARGES CLAIMS PATIENTS2007 $17,352,646 337,247 28,1042008 $28,790,535 558,393 46,5332009 $33,197,126 643,738 53,645


Wages Over a 10 years period, average wages have increased
approximately 35%1
Fuel prices have more than doubled over the last decade Peaked in 2008 but increasing again in 2011 as crude
prices are rising Health insurance premiums have nearly tripled
over the last decade2
Vehicle maintenance expenses have increased Maintenance & repair
Freight services (UPS, FedEx) have increased1Social Security Agency; national wage index 20102Kaiser Family Foundation 2010 Annual Summary of Employer Health Benefits

$2.50
$2.70
$2.90
$3.10
$3.30
$3.50
$3.70
$3.90
$4.10
$4.30
$4.50
Apr-10 May-10 Jun-10 Jul-10 Aug-10 Sep-10 Oct-10 Nov-10 Dec-10 Jan-11 Feb-11 Mar-11 Apr-11 May-11
Apr-10 May-10 Jun-10 Jul-10 Aug-10 Sep-10 Oct-10 Nov-10 Dec-10 Jan-11 Feb-11 Mar-11 Apr-11 May-11
Series1 $3.06 $3.09 $2.95 $2.91 $2.96 $2.95 $3.05 $3.14 $3.24 $3.39 $3.58 $3.90 $4.06 $4.10
Monthly FSC Average

Average Annual Worker and Employer Contributions to Premiums and Total Premiums for Family Coverage,
1999-2010
* Estimate is statistically different from estimate for the previous year shown (p<.05).
Source: Kaiser/HRET Survey of Employer-Sponsored Health Benefits, 1999-2010.
$5,791
$6,438*
$7,061*
$8,003*
$9,068*
$9,950*
$10,880*
$11,480*
$12,106*
$12,680*
$13,375*
$13,770*

Costs are up and reimbursement is down Future SG&A costs will be higher and
reimbursement will be flat or lower Demand for home oxygen remains steady

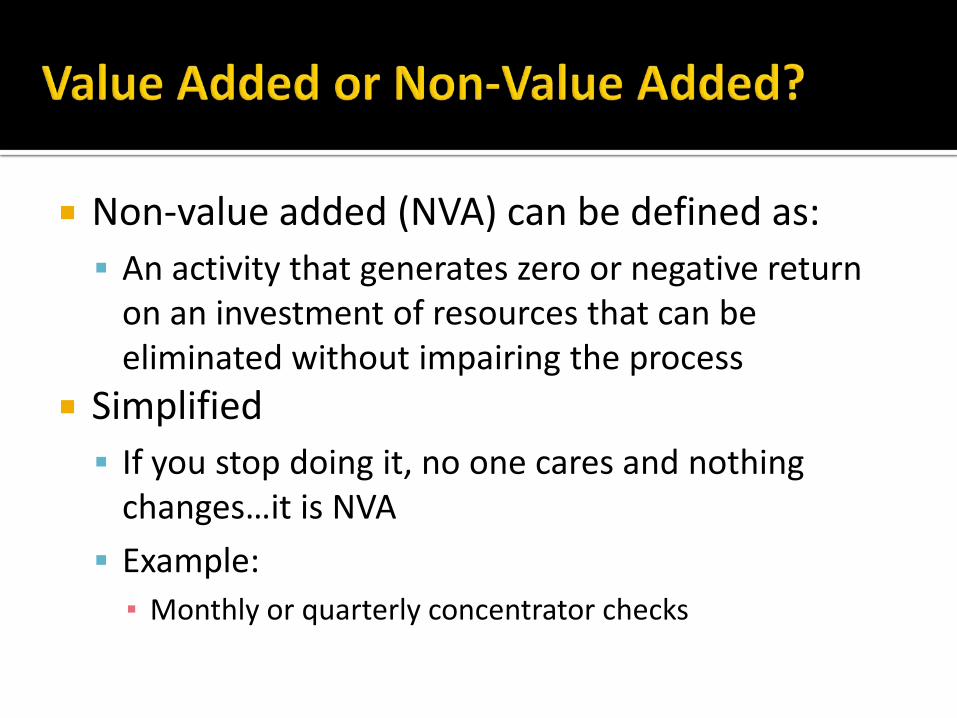
Non-value added (NVA) can be defined as: An activity that generates zero or negative return
on an investment of resources that can be eliminated without impairing the process
Simplified If you stop doing it, no one cares and nothing
changes…it is NVA Example:▪ Monthly or quarterly concentrator checks

Home oxygen service is plagued with expensive NVA activities
Many of the “services” grew from marketing strategies and sales related behaviors Not based in science or outcomes Cultural beliefs
Most of the process related to portable gas delivery (of any type) are NVA Don’t mistake delivery for care and service

CSR Order intake Keystroke work order
Order processing Pick & pull, staging for delivery Lot & serialized tracking
Loaded & routed Call family, schedule delivery
Delivery to home Signed delivery ticket, pick up empty cylinders
Return to warehouse/stock Dirty equipment returns; cylinders staged for refilling
Order confirmation System confirmation of delivery, lot & serial numbers and logistical
management of returned cylinders Cylinder refilling process Internal or external
Filled cylinders staged, ready for use

Delivery21%
Preparation and Return,
Disposables, and Scheduled
Maintenance12%
Other Operating and Overhead
Costs21%
Patient Assessment,
Training, Education and Monitoring
9%
Intake and Customer Service
6%
Unscheduled Repairs and Maintenance
3%
System Acquisition 28%
1Morrison Informatics. A Comprehensive Cost Study of Medicare Home Oxygen. June 2006

ACTIVITY COST
Intake & Customer Service $12.66
Preparation, return, PM, disposables
$25.24
Delivery $42.26
Total $80.16
1Morrison Informatics. A Comprehensive Cost Study of Medicare Home Oxygen. June 2006

Routine concentrator checks New systems have prolonged check requirements
Routine respiratory therapist visits Valuable contributor or NVA cost?
Ancillary supply deliveries Non-covered supplies & freight


Strategy Shifting from an OpEx model to a CapEx model Smaller but more frequent expenses to larger, depreciable
expenses Cash flow driven model shifts expenses to
depreciation▪ Improved balance sheet▪ Good vs. bad debt: the short term lease▪ Positive cash flow & improved EBITDA/Op Income
Leadership Change must be driven by the top of the organization
and pushed down There must be a team of champions▪ Behavior modification and cultural changes are hard work

Technology, tools & techniques Investing in technology with a strong ROI produces
near immediate improvement in operational efficiency▪ Technology replaces labor & NVA processes
Non-delivery O2 systems replace the majority of NVA processes central to the provision of home O2therapy▪ Eliminate most of the 8 to 20 steps associated with a
portable O2 delivery ▪ Eliminating routine delivery does not mean elimination
of care & service▪ Reallocation of clinical & technical resources

Elimination of portable gas delivery is good for patients The 8-20 delivery related steps add no value to the
patient’s clinical or lifestyle needs Delivery is a ball & chain▪ Promotes rationing of portable system▪ May inadvertently promote non-compliance▪ Source of anxiety & customer/referral source complaints
Compliant, active and ambulatory O2 patients live longer1
1Petty TL, Bliss PL: Ambulatory oxygen therapy, exercise and survival with advanced chronic obstructive pulmonary disease. (The Nocturnal Oxygen Therapy Trial Revisited) Resp Care 2000; 45:204-213.

0%
10%
20%
30%
40%
50%
60%
70%
80%
90%
100%
0 0.5 1 1.5 2 2.5 3 3.5 4
Surv
ivor
Fra
ctio
n
Years in Study
High Walk COT
High Walk NOT
Low Walk COTLow Walk NOT
1Petty TL, Bliss PL: Ambulatory oxygen therapy, exercise and survival with advanced chronic obstructive pulmonary disease. (The Nocturnal Oxygen Therapy Trial Revisited) Resp Care 2000; 45:204-213.
Comparison of survivorship in high walk, high oxygen patients compared with low walk, low oxygen patient shows highly statistically significant differences. Low walk, high oxygen survival is better than low walk, low oxygen at 2.5 years, but not at 3.5 years. These differences are statistically significant (p = 0.01)

OGPE Technology Models Concentrator transfill system (E1390 & K0738)▪ Nearly a decade of history▪ Most clinically diverse▪ Largest impact in Medicare claims
Concentrator & Pulse-dose POC (E1390 & E1392)▪ Growing in popularity▪ Generally focused on 2-3 LPM patients▪ Ideal for traveler’s and extended daily ambulation
TPOC (E1390 & E1392)▪ Popularity seems to have peaked over last 12-18 months▪ Generally focused on 2 LPM patients with CF needs▪ Ideal for traveler’s and extended daily ambulation

Future patient activity (ambulation) cannot be anticipated based on recent activity levels.
Ask the patient what they would do on a daily and weekly basis prior to the health decline that resulted in LTOT –focus on the period 6-months to a year ago (be mindful of weather).
The decision tree to the right can help you assist your providers in making the right product decision.
Note that this is a general guide. To identify the best system additional factors may need to be taken into consideration.

Soft implementation approaches Frequent flyer & outlier patients Highly ambulatory patients Patient or referral source requested (demanded)
Aggressive implementation methods Carpet bomb▪ Any O2 patient that has a portable system and received a
least 6 deliveries in a year▪ All new patients prescribed a portable O2 system

Standard of Care Model Two classes of patient▪ Nocturnal/Homebound▪ Stationary system only
▪ Ambulatory▪ Stationary/OGPE O2 system

Elimination of routine O2 delivery is not the elimination of care & service Reallocation of technician & clinician time
Identify value-added processes Clinical interventions that produce improved
outcomes. Ex: disease management that drive compliance to therapy, reduced readmissions, etc.▪ 30-day COPD Readmission Prevention Program
Clinician supported marketing & sales efforts▪ Local conferences, CEU programs
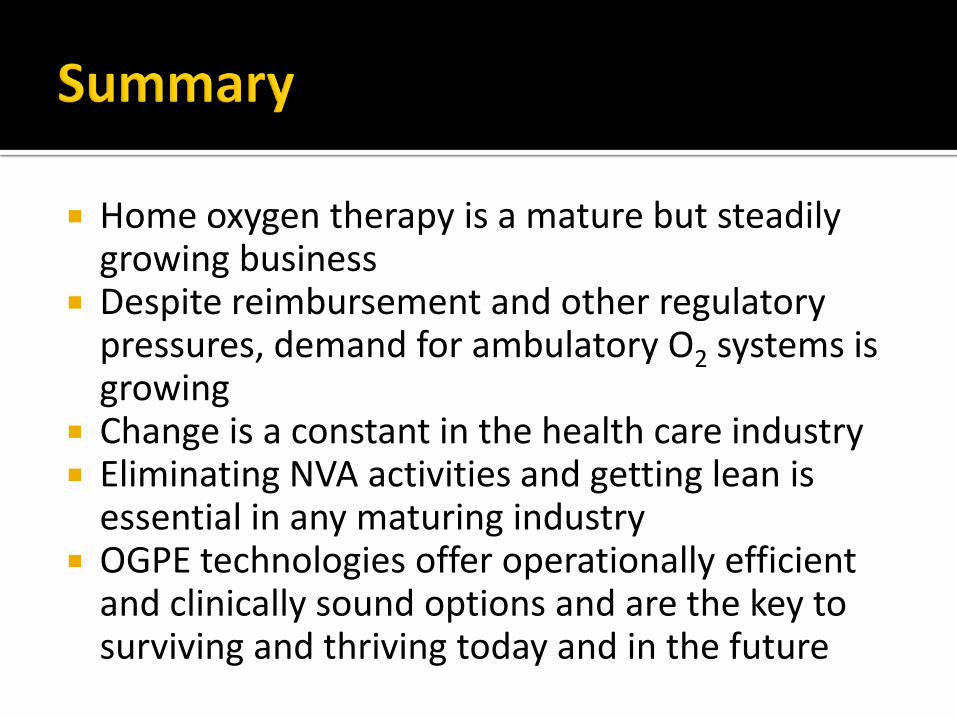
Home oxygen therapy is a mature but steadily growing business
Despite reimbursement and other regulatory pressures, demand for ambulatory O2 systems is growing
Change is a constant in the health care industry Eliminating NVA activities and getting lean is
essential in any maturing industry OGPE technologies offer operationally efficient
and clinically sound options and are the key to surviving and thriving today and in the future