Embed Size (px)
Citation preview

VIRGINIA SWRP – DDRRAAFFTT April 2015 Page | 210
Roanoke River Basin Summary
For a full description of localities included in the water supply plans, as well as explanations of various
terms and concepts used throughout this summary, please review the Introduction to SWRP Plan
Appendices.
The Roanoke River Basin covers 6,393 square miles, or approximately 15% of the Commonwealth’s total
area. The basin is bordered by the James River Basin on the north, the Albemarle-Chowan River Basin
to the east, and the New River Basin to the west. The southern boundary of the Basin is the
Virginia/North Carolina state line. The Roanoke River headwaters begin in the Blue Ridge Mountains in
eastern Montgomery County. Once through the City of Roanoke, the river generally flows east-southeast
to the Virginia state line, exiting the Commonwealth near the Mecklenburg-Brunswick County line. The
river travels southeast across North Carolina and enters the Albemarle Sound. In Virginia, the Roanoke
River is often referred to as the Staunton River, particularly below Leesville Lake.
In addition to the Roanoke itself, the Basin also contains the Yadkin River sub-basin. The Yadkin River
forms in North Carolina and is the northernmost part of the Pee Dee River drainage. The Pee Dee River
flows south entering the Atlantic Ocean near Georgetown, South Carolina.
The following seventeen counties and four cities are entirely or partially located within the Basin:
Counties of Appomattox, Bedford, Botetourt, Brunswick, Campbell, Carroll, Charlotte, Floyd, Franklin,
Grayson, Halifax, Henry, Mecklenburg, Montgomery, Patrick, Pittsylvania, and Roanoke; Cities of
Danville, Martinsville, Roanoke, and Salem. These jurisdictions are represented within eight regional
water supply plans: Lake Country, Charlotte/Town, Halifax/Towns, Region 2000, Roanoke Valley, New
River Valley, West Piedmont, and Southwest Virginia.

VIRGINIA SWRP – DDRRAAFFTT April 2015 Page | 211
Roanoke River Basin Localities
Three physiographic provinces are represented in the Basin, the Valley and Ridge Province to the
northwest and the Blue Ridge and Piedmont Provinces to the southeast. The topography of the Basin
ranges from broad valleys and linear ridges in the Valley and Ridge Province followed by the moderate to
steep slopes in the Blue Ridge and ending in the gently sloping terrain east of the mountains in the
Piedmont Province.

VIRGINIA SWRP – DDRRAAFFTT April 2015 Page | 212
Roanoke River Basin Physiographic Provinces
Over 62% of the Roanoke River Basin is forested, while nearly 25% is in cropland and pasture.
Approximately 10% is considered urban. The remainder is streams, lakes, ponds, wetlands, small
barren/mixed uses, or quarries. The Roanoke River Basin is divided into seven USGS hydrologic unit
codes (HUC) as follows: HUC 03010101 Upper Roanoke; HUC 03010102 Middle Roanoke; HUC
03010103 Upper Dan; HUC 03010104 Lower Dan; HUC 03010105 Banister; HUC 03010106 Roanoke
Rapids and HUC 03040101 Upper Yadkin. The seven hydrologic units are further divided into 87
waterbodies or watersheds and 202 sixth order sub-watersheds.
Existing Water Sources
Water sources utilized in the Basin include stream intakes, reservoirs, springs, and groundwater wells.
Surface water sources (reservoirs, streams, and springs) account for 100 withdrawals; additionally there
are 601 groundwater withdrawals currently identified in the Roanoke River Basin. Large source water
reservoirs used include Smith Mountain Lake and Leesville Lake to the north and John H. Kerr Reservoir
(known locally in Virginia as Buggs Island Lake), and Lake Gaston located along the North Carolina state

VIRGINIA SWRP – DDRRAAFFTT April 2015 Page | 213
line. These reservoirs range in size from the 33,300 acre Kerr Reservoir to the 2,600-acre Leesville Lake.
Smaller reservoir sources used include Falling Creek Reservoir, Beaverdam Reservoir, Beaver Creek
Reservoir, Carvins Cove Reservoir, Spring Hollow Reservoir, Keysville Reservoir, Georges Creek
Reservoir, Stoney Creek Reservoir, Phelps Creek Reservoir, Schoolfield Reservoir, Hale Creek
Reservoir, and Philpott Reservoir. Stream intakes and spring sources used in the Basin include the Dan
River, Roanoke River, Big Otter River, Blackwater River, South Mayo River, Smith River; Reed Creek,
Cherrystone Creek, Rutledge Creek, Sycamore Creek, Leatherwood Creek, Little Beaver Creek; Boones
Mill Spring, and Crystal Springs.
Roanoke River Basin Major Reservoir and Stream Sources
Groundwater wells provide source water for most of the community water systems in the Basin.
Groundwater sources outnumber surface water withdrawals in all use types except agriculture. The
number of residential groundwater sources (SSU_SM) is unknown and, therefore, is not included in the
figure below. As estimated for the year 2010, approximately 345,880 people in the Basin use private
groundwater wells for residential water supply.

VIRGINIA SWRP – DDRRAAFFTT April 2015 Page | 214
Roanoke River Basin Source Type by User Type
Nontraditional water sources, such as water reclamation and reuse, desalination, and interconnection are
used by two localities in the basin. The Bedford Regional Water Authority is permitted to generate and
distribute up to 2.0 MGD of reclaimed water and Halifax County Service Authority is permitted to generate
and distribute up to 4.0 MGD of reclaimed water. The water is currently provided to non-municipal
facilities for use in cooling and boiler feed.
Transfers
Water withdrawn in the Basin may be used by the withdrawing user, or it may be transferred to another
user. The transfer of water within and between river basins is a demand management practice that can
address water supply and/or water quality needs by moving water from a basin or sub-basin with surplus
supply to a basin or sub-basin with a supply deficit. Most often this practice of transferring water across
sub-basin boundaries within a river basin - intrabasin transfers - occurs within a single county, but they
can occur across county lines. Water movement that occurs when water is withdrawn from one major
basin and transferred to a user in another major basin is called an interbasin transfer. Interbasin transfers
of water are less common in Virginia.
2
182
417
28
36
36
0 100 200 300 400 500
AG
SSU_LG
CWS
Number of Surface Water Sources
Number of Groundwater Sources

VIRGINIA SWRP – DDRRAAFFTT April 2015 Page | 215
In the Roanoke River Basin, intrabasin transfers primarily exist between municipal CWS. The following
lists the reported intrabasin transfers between water providers and the entities to which they sell water
(water purchaser).
User Type Water Purchaser and System(s) Water Provider
CWS Botetourt County: Cloverdale/Vista Park Town of Troutville
CWS Bedford County RWA: Stewartsville
Consecutive Western Virginia Water Authority
CWS Town of Boydton Roanoke River Service Authority
CWS Franklin County: Forest Hills Blackwater River (Town of Rocky Mount)
CWS Henry County PSA: Edgewood Village,
Woodland Avenue City of Martinsville
CWS Henry County PSA: Sandy Level City of Eden, North Carolina
CWS Town of Hurt Town of Altavista
CWS Town of La Crosse Roanoke River Service Authority
CWS Pittsylvania County SA: Greenwood Drive,
Route 58 West Henry County PSA
CWS Pittsylvania County SA: Grit Town of Hurt
CWS Pittsylvania County SA: Mount Cross Road,
Mount Hermon, Ringgold Industrial Park, Route 29 North, Route 360
City of Danville
CWS Pittsylvania County SA: Route 40 West
Gretna Road Town of Gretna
CWS Pittsylvania County SA: Tightsqueeze Town of Chatham
CWS Western Virginia Water Authority: Andrew
Lewis Place City of Salem
SSU_LG Goodyear-Danville Plant City of Danville
Roanoke River Basin Intrabasin Transfers

VIRGINIA SWRP – DDRRAAFFTT April 2015 Page | 216
Interbasin transfers exist in the Roanoke River Basin with Roanoke water being sold to supply CWS and
SSU_LG in other basins.
User Type Water Purchaser and System(s) Water Provider
CWS City of Virginia Beach U. S. Army Corps of Engineers
CWS City of Chesapeake - Northwest
River System City of Norfolk
CWS US Navy-Dam Neck City of Norfolk
CWS US Navy-Oceana City of Norfolk
CWS Town of South Hill Roanoke River Service Authority
CWS Town of Brodnax Roanoke River Service Authority
SSU_LG Georgia Pacific Skippers Plant Roanoke Rapids Sanitary District
SSU_LG Interstate 95 Rest Area located in
Greensville County Roanoke Rapids Sanitary District
Roanoke River Basin Interbasin Transfers
Since 1998, the City of Virginia Beach has pumped fresh water from an intake on Lake Gaston in
Brunswick County to Lake Prince located in Isle of Wight County’s portion of the James River Basin.
Lake Prince is owned by the City of Norfolk and Lake Gaston is owned by the U.S. Army Corps of
Engineers (USACE). Water is purchased by Virginia Beach from the USACE.
City of Virginia Beach Sources and Service Area
68
68 Hampton Roads Planning District Commission: Hampton Roads Regional Water Supply Plan

VIRGINIA SWRP – DDRRAAFFTT April 2015 Page | 217
Existing Water Use
The total estimated water use provided in the regional water supply plans is summarized in the figure
below. The total estimated water use is approximately 159 MGD, with 112 MGD of surface water use and
47 MGD of groundwater use. Although the number of groundwater withdrawals far exceeds the number
of surface water withdrawals in the Roanoke River Basin, the estimated amount of use from surface water
exceeds that from groundwater.
Roanoke River Basin Estimated Use by Source and Type
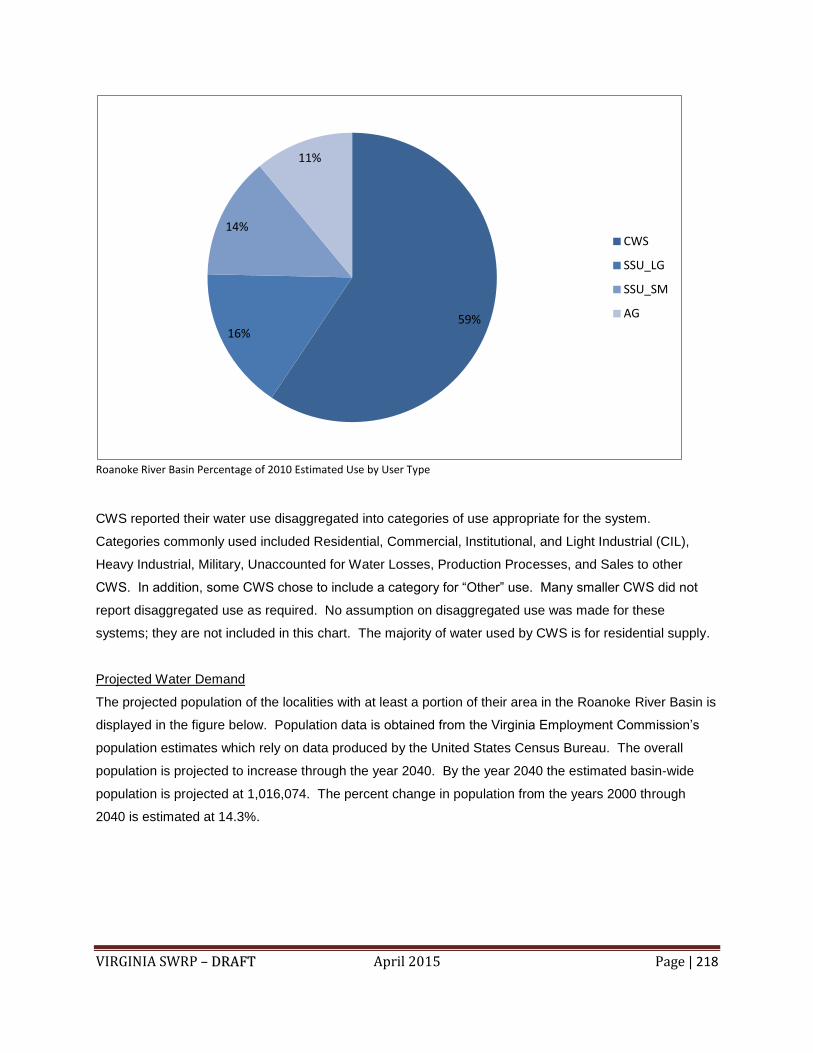
CWS use an estimated 59% of the total water in the Basin followed by SSU_LG (16%), SSU_SM (14%)
and AG (11%).
8.72
21.70
1.27
14.99
8.84
0.00
24.14
79.60
0.00 20.00 40.00 60.00 80.00 100.00
AG
SSU_SM
SSU_LG
CWS
Estimated Surface Water Use 2010 (MGD)
Estimated Groundwater Use 2010 (MGD)
VIRGINIA SWRP – DDRRAAFFTT April 2015 Page | 218
Roanoke River Basin Percentage of 2010 Estimated Use by User Type
CWS reported their water use disaggregated into categories of use appropriate for the system.
Categories commonly used included Residential, Commercial, Institutional, and Light Industrial (CIL),
Heavy Industrial, Military, Unaccounted for Water Losses, Production Processes, and Sales to other
CWS. In addition, some CWS chose to include a category for “Other” use. Many smaller CWS did not
report disaggregated use as required. No assumption on disaggregated use was made for these
systems; they are not included in this chart. The majority of water used by CWS is for residential supply.
Projected Water Demand
The projected population of the localities with at least a portion of their area in the Roanoke River Basin is
displayed in the figure below. Population data is obtained from the Virginia Employment Commission’s
population estimates which rely on data produced by the United States Census Bureau. The overall
population is projected to increase through the year 2040. By the year 2040 the estimated basin-wide
population is projected at 1,016,074. The percent change in population from the years 2000 through
2040 is estimated at 14.3%.
59% 16%
14%
11%
CWS
SSU_LG
SSU_SM
AG

VIRGINIA SWRP – DDRRAAFFTT April 2015 Page | 219
Roanoke River Basin Projected Population
A 30- to 50-year projection of future water demand is required by the WSP Regulation. Thirty years is the
period of time common to all plans, so data is analyzed here for the timeframe of 2010 through 2040.
The total projected water demand in the Roanoke River Basin, as reported in the regional water supply
plans, is estimated to increase from approximately 159 MGD in 2010 to 197 MGD in 2040. The percent
change in water use during the 30-year timeframe is estimated at 23.5%.
855,530 889,265
930,437 973,379
1,016,074
0
200,000
400,000
600,000
800,000
1,000,000
1,200,000
2000 2010 2020 2030 2040

VIRGINIA SWRP – DDRRAAFFTT April 2015 Page | 220
Roanoke River Basin Projected Water Demand
As depicted in the table below, SSU_SM show the largest percent change (47.9%) in water demand over
the 30 year period. From this data, it appears the majority of population growth in the Basin may occur
outside the CWS service areas. Projected water demand for CWS has the next highest percentage
growth (25.3%) followed by SSU_LG (12.3%). The AG use in the Roanoke River Basin remains
unchanged over the planning period as detailed in the regional water supply plans. The steady state of
AG use is a best guess on the part of the planning entities, as the withdrawal data is limited and water
use on an annual basis, in particular for crop irrigation, may change depending on precipitation.
User Type
Reported Use 2010 MGD
Projected Use 2020 MGD
Projected Use 2030 MGD
Projected Use 2040 MGD
Percent Change (2010-2040)
CWS 94.58 102.63 110.7 118.72 25.3%
SSU_LG 25.41 26.46 27.5 28.55 12.3%
SSU_SM 21.70 25.17 28.6 32.10 47.9%
AG 17.56 17.56 17.56 17.56 -0.0%
Roanoke River Basin Projected Water Demand by User Type (2010-2040)
159.26 171.82
184.4 196.92
0
50
100
150
200
250
2010 2020 2030 2040
Water Demand (MGD)

VIRGINIA SWRP – DDRRAAFFTT April 2015 Page | 221
The percentage by user type of total projected 2040 demand is shown in the following figure. In 2040
CWS demand is estimated at 60% of the total demand in the Roanoke River Basin followed by SSU_SM
(16%), SSU_LG (15%), and AG (9%).
Roanoke River Basin Percentage of 2040 Projected Demand by User Type
Statement of Need and Alternative Water Sources
The following review of future water needs and alternative sources is obtained from the eight regional
water supply plans represented in the Roanoke River Basin. The information is presented for all those
localities with at least a portion of land area located within the Basin. The following lists the projected
deficits in the Basin.
Charlotte County Regional Water Supply Plan
Charlotte County the Towns of Charlotte Court House, Drakes Branch, Keysville, and Phenix
The regional plan provided ‘upper level’ and ‘lower level’ population and water demand projections.
Using the upper level demand projections for community water systems found in the water supply plan,
future deficits in water supply are anticipated in the four towns as follows:
Town of Drakes Branch: deficit of 0.153 MGD by 2020
Town of Phenix: deficit of 0.0002 MGD by 2010
Town of Charlotte Court House: deficit of 0.008 MGD by 2020
60% 15%
16%
9%
CWS
SSU_LG
SSU_SM
AG

VIRGINIA SWRP – DDRRAAFFTT April 2015 Page | 222
Town of Keysville: deficit of 0.207 MGD by 2050
Several alternatives are recommended for meeting this additional demand in the future: clarification of the
safe yield for Keysville Reservoir; development of additional groundwater supply in the towns of Drakes
Branch, Charlotte Court House, and Phenix; development of a water treatment plan at the Drakes Branch
Lake; and system interconnection of Charlotte Court House with either Drakes Branch or Keysville, and
system interconnection of Drakes Branch with Keysville.
Halifax County Regional Water Supply Plan
Halifax County and the Towns of Halifax, South Boston, Scottsburg, and Virgilina
The Halifax County Service Authority CWS anticipates reaching 80% of its VDH permitted capacity (2.4
MGD) for a three-month period at the Leigh Street Water Treatment Plant on the Dan River around 2035.
A deficit of 0.035 MGD may occur by the year 2050 based on the VDH permitted capacity. The Halifax
County Service Authority plans to address the 2035 capacity issue by requesting an increase in the
permitted withdrawal amount on the Dan River.
Lake Country Regional Water Supply Plan
Brunswick County and the Towns of Alberta, Brodnax, and Lawrenceville; Mecklenburg County and the
Towns of Boydton, Chase City, Clarksville, La Crosse, and South Hill
Total population for the planning area is projected to increase only slightly during the planning period.
Regional water supply is plentiful, and it is estimated that there are adequate water sources to provide for
the needs of the planning area now and in the foreseeable future; however, competition for water from
fast growing metropolitan areas in neighboring North Carolina and Tidewater Virginia was cited in the
plan as a potential threat to water quantity.
New River Valley Regional Water Supply Plan
Floyd County and Montgomery County
As a region, there is generally no deficit during the planning period. Some systems are already exploring
options to increase system capacity. Alternatives considered include the installation of pressure reducing
valves and the interconnection of systems with the City of Radford across the planning area. Floyd
County desires to increase educational efforts and develop additional well(s). Montgomery County
mentions joining the Blacksburg-Christiansburg-VPI Water Authority as a possible alternative in the
future.
Region 2000 Regional Water Supply Plan
Appomattox County and the Towns of Appomattox and Pamplin City; Campbell County and the Towns of
Altavista and Brookneal; Bedford County and the Town of Bedford (Bedford County participated in two
regional water supply plans, Region 2000 and the Roanoke Valley-Alleghany Regional Commission).

VIRGINIA SWRP – DDRRAAFFTT April 2015 Page | 223
As stated in the plan, in a planning area as diverse as Region 2000, the ability to meet water demands
may vary from one municipality to another. This may be due to population centers or system limitations.
Because of these complexities, water supply is adequate for a portion of the planning area through the
planning period of 2060. However, deficits are anticipated in the following community water system
supplies.
Bedford Regional Water Authority: deficit of 0.004 MGD by 2015, based on the VDH permitted
capacity of 0.79 MGD plus the 1.4 MGD purchase from the City of Lynchburg.
Campbell County Utility and Service Authority: deficit of 0.03 MGD by 2057, based on the VDH
permitted capacity of 4.4 MGD, if future water sales are factored into the projections.
Town of Altavista: deficit of 0.003 MGD by 2052, based on the VDH permitted capacity of 3.0
MGD.
Town of Appomattox: deficit of 0.0004 MGD by 2051, based on the VDH permitted capacity of
0.33 MGD.
Alternatives described for Bedford County include the Lakes Regional Water Treatment Plant on Smith
Mountain Lake and increased purchase from the City of Lynchburg. Campbell County and Town of
Altavista alternatives listed in the regional plan include storage at Boxley Rock Quarry with a pump-over
to Harvey Branch, a Campbell County Utility and Service Authority-Altavista intake on the Roanoke River
and water purchase agreements with Lynchburg City or Bedford County. The Town of Appomattox is
considering development of new groundwater wells or an intake on the James River as future
alternatives. In addition to the alternatives listed above, the region considers the following as water
supply alternatives: additional groundwater sources, reservoirs, intakes, inter-connections, reuse and
recycling, and demand management.
Roanoke Valley-Alleghany Regional Commission Water Supply Plan
Bedford County and the Town of Bedford (Bedford County participated in two regional water supply plans,
Roanoke Valley-Alleghany Regional Commission and Region 2000); Botetourt County and the Towns of
Buchanan, Fincastle, Rocky Mount, and Troutville; Franklin County and the Towns of Boones Mill and
Rocky Mount; Roanoke County; Cities of Roanoke and Salem; Town of Vinton
Current water sources are adequate to meet current and projected demand except for those supplying
the following localities:
Bedford County: deficit of 0.004 MGD by 2015
Botetourt County: deficit of 0.09 MGD by 2020
Franklin County: deficit of 0.03 MGD by 2020
City of Salem: deficit of 0.11 MGD by 2046
Town of Boones Mill: deficit of 0.002 MGD by 2018
Town of Troutville: deficit of 0.009 MGD by 2027

VIRGINIA SWRP – DDRRAAFFTT April 2015 Page | 224
Two water supply alternatives are listed as the most economical for the region: the expansion of the
Smith Mountain Lake Regional Water Treatment Plan in Bedford County and a new intake on Smith
Mountain Lake to supplement Western Virginia Water Authority’s (WVWA) Carvins Cove reservoir
system. Development of new groundwater sources is also mentioned by some of the localities with
predicted water supply deficits.
Southwest Virginia Regional Water Supply Plan
Carroll County and the Town of Hillsville; Grayson County and the Towns of Fries, Independence, and
Troutdale
Existing water sources are adequate to meet current and projected demands through the planning period.
West Piedmont Planning District Commission Regional Water Supply Plan
Henry County and the Town of Ridgeway; Patrick County and the Town of Stuart; Pittsylvania County and
the Towns of Chatham, Gretna, and Hurt; Cities of Danville and Martinsville
Regional water supply is adequate to provide for the needs of the planning area through the planning
period of 2060 except for Henry County and the Town of Gretna, as follows:
Henry County: deficit of 0.01 MGD by 2049 based on the VDH permitted capacity
Town of Gretna: demands may exceed reservoir safe yield by 2020
To address the deficit, Henry County Public Service Authority submitted a VWP permit application for an
increased withdrawal from the Upper Smith River, under review by DEQ at the development of the plan.
The Town of Gretna will likely pursue a new raw water intake on Whitethorn Creek and a pipeline to
Georges Creek Reservoir.

VIRGINIA SWRP – DDRRAAFFTT April 2015 Page | 225
Locality Estimated Year of Deficit Estimated Deficit Amount
(MGD)
Town of Drakes Branch 2020 0.153
Town of Phenix 2010 0.0002
Town of Charlotte Court House 2020 0.008
Town of Keysville 2050 0.207
Halifax County 2050 0.035
Bedford County 2015 0.004
Campbell County 2057 0.03
Town of Altavista 2052 0.003
Town of Appomattox 2051 0.0004
Henry County 2049 0.01
Town of Gretna 2020 Demands may exceed reservoir
safe yield
Botetourt County 2020 0.09
Franklin County 2020 0.03
City of Salem 0.11 2046
Town of Boones Mill 2018 0.002
Town of Troutville 2027 0.009
Roanoke River Basin Projected Water Deficits