Embed Size (px)
Citation preview

12/22/2008
1
Roadway Lighting and Visibility
D R ld B GibbDr. Ronald B. GibbonsGroup Leader, Lighting and Infrastructure
Technology
Motor Vehicle Crashes – Magnitude of the Problem
Cause and Number of Deaths
Other Adults
R
A
N
K
Infants Under 1
Toddlers
1-3
Young Children
4-7
Children
8-15
Youth 16-20
Young Adults 21-24 25-34 35-44 45-64
Elderly
65+
All Ages
Years of
Life Lost2
1
Perinatal Period 13,734
Congenital Anomalies
496
MV Traffic Crashes
533
MV Traffic Crashes
1,546
MV Traffic Crashes
5,979
MV Traffic Crashes
4,136
MV Traffic Crashes
6,759
Malignant Neoplasms
16,569
Malignant Neoplasms
139,785
Heart Disease 582,730
Heart Disease 700,142
Malignant Neoplasms
23%(8,614,131)
2
Congenital Anomalies
5,513
MV Traffic Crashes
421
Malignant Neoplasms
400
Malignant Neoplasms
829
Homicide
2,414
Homicide
2,738
Homicide
5,204
Heart Disease 13,326
Heart Disease 98,885
Malignant Neoplasms
390,214
Malignant Neoplasms
553,768
Heart Disease
22%(8,110,571)
Heart Accidental Exposure to Suicide Suicide Suicide Suicide MV Traffic Stroke Stroke Stroke MV Traffic
Top 10 Leading Causes of Death in the United States for 2001, by Age Group1
National Center for Statistics and Analysis
3
Heart Disease
479
Drowning 393
pSmoke/Fire
178
447
1,879
1,924
5,070 Crashes
6,891
15,518
144,486
163,538 Crashes
5%(1,700,952)
4 Homicide
332
Homicide
362
Congenital Anomalies
168
Homicide
391
Malignant Neoplasms
814
Accidental Poisoning
771
Malignant Neoplasms
3,994
Suicide
6,635
Diabetes
14,913
Chronic Lwr. Resp. Dis.
106,904
Chronic Lwr. Resp. Dis.
123,013
Stroke
5%(1,687,683)
5
Septicemia
312
Malignant Neoplasms
321
Accidental Drowning
164
Congenital Anomalies
324
Accidental Poisoning
566
Malignant Neoplasms
768
Heart Disease
3,160
HIV
5,867
Chronic Lwr. Resp. Dis.
14,490
Influenza/ Pneumonia
55,518
Diabetes
71,372
Chronic Lwr. Resp. Dis.
4%(1,444,745)
6
Influenza/ Pneumonia
299
Heart Disease
200
Homicide
133
Accidental Drowning
293
Heart Disease
398
Heart Disease
543
Accidental Poisoning
2,507
Accidental Poisoning
5,036
Chronic Liver Disease 13,009
Diabetes
53,707
Influenza/ Pneumonia
62,034
Suicide
3%(1,079,822)
7
MV Traffic Crashes
139
Exposure to Smoke/Fire
170
Heart Disease
82
Heart Disease
273
Accidental Drowning
326
Accidental Drowning
211
HIV
2,101
Homicide
4,268
Suicide
9,259
Alzheimer’s
53,245
Alzheimer’s
53,852
Perinatal Period
3%(1,070,154)
8
Nephritis/ Nephrosis
133
Septicemia
96
MV NonTraffic Crashes
51
Exposure to Smoke/Fire
140
Congenital Anomalies
244
Congenital Anomalies
206
Stroke
601
Chronic Liver Disease
3,336
MV Traffic Crashes
8,750
Nephritis/ Nephrosis
33,121
MV Traffic Crashes 42,443
Diabetes
3%(1,014,201)
9
Stroke
108
Influenza/ Pneumonia
92
Benign Neoplasms
46
MV NonTraffic Crashes
125
Accidental Falls 114
HIV
167
Diabetes
595
Stroke
2,491
HIV
5,437
Septicemia
25,418
Nephritis/ Nephrosis
39,480
Homicide
3%(924,263)
10
Meningitis
78
Perinatal Period
63
Septicemia
33
Chr. Lwr. Resp. Dis.
102
Acc. Dischg. Of Firearms
114
Accidental Falls 134
Congenital Anomalies
458
Diabetes
1,958
Nephritis/ Nephrosis
5,106
Hypertension Renal Dis.
16,397
Septicemia
32,238
Chronic Liver Disease
2%(623,998)
ALL3 27,568 4,288 2,703 6,672 15,851 14,940 41,683 91,674 412,204 1,798,420 2,416,425
All Causes 100%(36,866,317)
1When ranked by specific ages, motor vehicle crashes are the leading cause of death for age 2 and every age 4 through 33.. 2Number of years calculated based on remaining life expectancy at time of death; percents calculated as a proportion of total years of life lost due to all causes of death. 3Not a total of top 10 causes of death. Source: National Center for Health Statistics (NCHS) CDC, Mortality Data 2001 Note: The cause of death classification is based on the National Center for Statistics and Analysis (NCSA) Revised 68 Cause of Death Listing. This listing differs from the one used by the NCHS for its reports on leading causes of death by separating out unintentional injuries into separate causes of death, i.e., motor vehicle traffic crashes, accidental falls, motor vehicle nontraffic crashes, etc. Accordingly, the rank of some causes of death will differ from those reported by the NCHS. This difference will mostly be observed for minor causes of death in smaller age groupings.
Motor Vehicle Crashes – Magnitude of the Problem
Distribution of global injury mortality by cause:World Report on Road Traffic Injury Preventionp j y
World Health Organization, Geneva, 2004
“In low-income and middle-income countries, the phenomenon of pedestrians and vehicles not being properly visible is frequently a serious problem. In these places, there are fewer roads with adequate ill i ti d t b lit t ll ”
Suicide, 16.9%
Violence, 10.8%
Drowning, 7.3%
Road traffic injuries, 22.8%
Source: WHO Global Burden of Disease project, 2002, Version 1.
illumination and some may not be lit at all.”From Chapter 3: Risk Factors (pg 86)
War, 3.4%
Other intentional injuries, 0.2%
Other unintentional injuries, 18.1%Poisoning, 6.7%
Falls, 7.5%
Fires, 6.2%
Driver IssuesAccident Statistics show that more than 50% of fatal accidents occur during the night hours while g gonly 25% of the vehicle miles are driven.• Night driving has been described as a situation for
which humans have not evolved, leaving our visual system inadequate and inefficient for certain tasks (Rumar, 1990).
Determining the nat re of the dri ing task isDetermining the nature of the driving task is critical

12/22/2008
2
100 Car “Naturalistic” Approach• Data collection in a “naturalistic” setting to obtain
crash/pre-crash/near-crash/conflict data as well as distributions of driver performance100 d i i th i ( l d) hi l ith• 100 drivers in their own (or leased) vehicles with specialized instrumentation, on public roads, as close to unobserved as possible.
• Subjects use instrumented vehicles for an extended period (up to 13 months) without an experimenter present.
• Subjects are not coached or instructed to perform any j p yspecific actions other than drive as they normally do.
• Instrumentation is unobtrusive and inconspicuous to other drivers, but not invisible.
Naturalistic Data Collection ApproachHighly capable instrumentation (well beyond EDRs)
• Five channels of digital, compressed video• Four radar sensors front, rear (for all 100
vehicles), and side (for 20 vehicles)• Machine vision-based lane tracker• Many other sensors: GPS, glare, RF,
acceleration, yaw rate, controls, etc.• Cell phone, wireless internet, or hardwire
downloadTi i hi l k b i h• Tie into vehicle network to obtain other sensor information
• Rugged, crash tested, all solid state• Crash detection, Fault detection• Remote Access
The Naturalistic “100 Car” Driving Study:
Database Statistics42,300 hours of driving data collected82 Crashes and collisions• Defined as any contact between the subject vehicle and another
vehicle, fixed object, pedestrian pedacyclist, animal.761 Near crashes • Defined as a conflict situation requiring a rapid, severe evasive
t id hmaneuver to avoid a crash.8295 Critical incidents• Conflict requiring an evasive maneuver, but of less
magnitude than a near crash.
Driver Behavior - Spinny

12/22/2008
3
Driver Behavior – Silly Driver Behavior – Dopey
Driver Behavior - Sleepy Data Analysis

12/22/2008
4
ResultsThe primary cause of all of incidents is secondary task distraction• Doing other things in the vehicle
Any visual task must overcome the distraction of the driver in the vehicle
Lighting and Driver SafetyWhat we know…
Box [1972] showed that the night/day accident ratio was 66% higher on unlighted freeways than on lit ones.• 0.5 lux appeared to be the illuminance level which provided
the lowest accident rateOsner [1973] and Nishimori[1973] both showed a 56% reduction in accidents when lighting was added to a roadway.CIE Pub. No 93 “Road Lighting as an AccidentCIE Pub. N 93 Road Lighting as an Accident Countermeasure” rigorously analyzed 62 lighting and accident studies from 15 countries.• “(S)tatistically significant results show reductions (in
nighttime accidents) of between 13 and 75 percent.”
Motor Vehicle Crashes – Implications of Darkness
Vehicle occupant deaths, FARS, 1987-2003
Motor Vehicle Crashes – Implications of Darkness
Pedestrian deaths, FARS, 1987-2003

12/22/2008
5
Evaluating Impact of Light Pedestrian Fatalities – Fall PM Return to Standard Time
250
300Light Dark
100
150
200
PedestrianRun-off-road
Cra
shes
90-90
50
Weeks Before and After Return to Standard Time
Visual ActivityAs drivers, the visual task is a very complex activity• Detection of road hazards• Lane keeping• Wayfinding• Monitoring of the instrument panel• Observing other drivers• Pedestrian Detection• Sightseeing?
Mi di th th t i th hi l• Minding the other occupants in the vehicleWe distribute our visual resources between all of these activities• We allot attention to the task which seems most demanding• Not necessarily the most important
The Eye

12/22/2008
6
The RetinaCaptures photons and send nerve impulses to the brainTwo important regions of the retina are:• Fovea
• The central and most sensitive part of the visual field
• Highest Acuity• Almost entirely ConesAlmost entirely Cones
• Periphery• Low Acuity• High range of sensitivity• Almost entirely Rods
Visual ProcessThe visual process is partially automatic and partially consciousp y• Lane keeping is automatic
• Visual vection process• Object Detection and Wayfinding is conscious
Object Detection Process• Visual Search
• We have a standard search pattern as we drive• Looking for objects• Looking at signage• Following the road path
• Detection• Through the visual search, we find an object of interest
• This detection can be peripheral• Spotted to the side as a result of motion or through high
conspicuity• This detection can be foveal
• Found through the visual search patterng p• Recognition
• We attend to the objects of interest• This is a foveal task
• Reaction• We decide what the appropriate course of action
• Braking, steering etc.
Object Visibility

12/22/2008
7
Visibility with Glare Visibility with Extreme Glare
Visibility of ObjectsWe see objects based on their contrast to the background• This can either be color contrast or luminance contrast• In roadway lighting design, color is not considered
The IES lighting design requirements are consensus standards based on experience• Lighting design can be performed based on illuminance,
luminance or STVTh STV i i ht d f i f l l t d• The STV is a weighted average of a series of calculated Visibility Levels for a defined target
• Current target is a flat 7" square with 50% reflectance which represents the smallest object which will collide with a vehicle
• VL is calculated as: VL CC
L LL
act
th
Target Background
th
= =−Δ
IES RP-8Illuminance Design Criteria
Road and Pedestrian Conflict Pavement Classification
Area (Minimum Maintained Average Values) Uniformity Veiling Ratio Luminance Ratio Luminance
Road Pedestrian R1 R2 & R3 R4 Ratio Conflict Area Lux/fc Lux/fc Lux/fc Eave/Emin Lvrnax/Lavg
Freeway Class A 6.0/0.6 9.0/0.9 8.0/0.8 3.0 0.3 Freeway Class B 4.0/0.4 6.0/0.6 5.0/0.5 3.0 0.3
High 10.0/1.0 14.0/1.4 13.0/1.3 3.0 0.3 Expressway Medium 8.0/0.8 12.0/1.2 10.0/1.0 3.0 0.3
Low 6.0/0.6 9.0/0.9 8.0/0.8 3.0 0.3 High 12.0/1.2 17.0/1.7 15.0/1.5 3.0 0.3
Major Medium 9 0/0 9 13 0/1 3 11 0/1 1 3 0 0 3Major Medium 9.0/0.9 13.0/1.3 11.0/1.1 3.0 0.3 Low 6.0/0.6 9.0/0.9 8.0/0.8 3.0 0.3 8.0/0.8 12.0/1.2 10.0/1.0 4.0 0.4
Collector High Medium 6.0/0.6 9.0/0.9 8.0/0.8 4.0 0.4 Low 4.0/0.4 6.0/0.6 5.0/0.5 4.0 0.4 6.0/0.6 9.0/0.9 8.0/0.8 6.0 0.4
Local High Medium 5.0/0.5 7.0/0.7 6.0/0.6 6.0 0.4 Low 3.0/0.3 4.0/0.4 4.0/0.4 6.0 0.4

12/22/2008
8
IES RP-8Luminance Design Criteria
Road and Pedestrian Conflict Average Uniformity Uniformity Veiling Area Luminance Ratio Ratio Luminance
R ti RatioRoad Pedestrian L
Conflict Lave/Lmin Lmax/Lmin Lvmax/Lavg
Area ( cd/m2) (Maximum Allowed)
(Maximum Allowed)
(Maximum Allowed)
Freeway Class A 0.6 3.5 0.5 6.0
Freeway Class B 0.4 3.5 6.0 0.3
High 1.0 3.0 5.0 0.3
Expressway Medium 0.8 3.0 5.0 0.3
Low 0.6 3.5 6.0 0.3
Hi h 1 2 3 0 5 0 0 3 High 1.2 3.0 5.0 0.3
Major Medium 0.9 3.0 5.0 0.3 Low 0.6 3.5 6.0 0.3 High 0.8 3.0 5.0 0.4 Collector Medium 0.6 3.5 6.0 0.4 Low 0.4 4.0 8.0 0.4 High 0.6 6.0 10.0 0.4 Local Medium 0.5 6.0 10.0 0.4 Low 0.3 6.0 10.0 0.4
IES RP-8STV Design Criteria
Road and Pedestrian Conflict STV Luminance Criteria Area Criteria
Road Pedestrian Weighting UniformityLavg Lavg Road Pedestrian Weighting Uniformity Conflict Area Average
Lavg Cd/m2
Lavg Cd/m2 Ratio
VL Median Median Lmax/Lmin <7.3m >7.3m (Maximum
Allowed)
Freeway "A" 3.2 0.5 0.4 6.0
Freeway"B" 2.6 0.4 0.3 6.0
Expressway 3.8 0.5 0.4 6.0
High 4.9 1.0 0.8 6.0 Major Medium 4 0 0 8 0 7 6 0Major Medium 4.0 0.8 0.7 6.0
Low 3.2 0.6 0.6 6.0 High 3.8 0.6 0.5 6.0 Collector Medium 3.2 0.5 0.4 6.0
Low 2.7 0.4 0.4 6.0 High 2.7 0.5 0.4 10.0 Local Medium 2.2 0.4 0.3 10.0
Low 1.6 0.3 0.3 10.0
IES RP-8 – The Next Revision
Separation of street and roadway lighting• Different Visual TasksDifferent Visual Tasks
Adaptive Possibilities• Allowing for changing of road class based on
pedestrian and vehicle traffic changes
Draft is currently under review and should be completed within 1 yearp y
Roadway Lighting and Driver Safety – What we don’t know…The impact of lower lighting levels on driver safetyy• Are we over-lighting?
The impact of mesopic lighting levels on driver safety• Is White truly better?

12/22/2008
9
Threshold VL LevelsIESNA Specifies a Level of 1.6 to 4.9 for STVActual threshold values are much higherHi h li h i l l lik l i dHigher lighting levels are likely not required• Contrast control is required• Perfect uniformity may not be the best lighting condition
Visibility Level At Threshold: White Clothed Objects
50
60
70
80
0
10
20
30
40
50
Non
e
Hyb
rid
3UV
A
5UV
A
Non
e
Hyb
rid
3UV
A
5UV
A
HLB HID HHB HOH HLB-LP
IR-T
VES
VL
CyclistPerpendicularParallelStatic
The White IssueWhite Light might provide equivalent visual task performance at a lower illuminance level than pnon-White Sources
Equivalent Performance?• The task is performed with the same speed and
accuracyy• In outdoor lighting this equates to driver safety,
pedestrian safety, way finding performance, comfort
Why?So why is there a possible white light benefit?• The physiology of the eye lends itself to light sourcesThe physiology of the eye lends itself to light sources
which have radiation in the entire visual spectrum• Remember
• Our eye was developed to interact with the sun –The ultimate full spectrum light source.
• The effect is a result of the difference in the spectral sensitivity of the various photoreceptors in the retinasensitivity of the various photoreceptors in the retina
PhotoreceptorsRods• Sensitive to low levels of radiation• The Spectral Sensitivity of the rod is maximum at 507nm• The rods define the pupil size in all viewing types
(Photopic, Mesopic and Scotopic)
Cones• Cone are sensitive at high levels of radiation• There are 3 cone types defined by their spectral sensitivities• There are 3 cone types defined by their spectral sensitivities
• Long• Medium• Short

12/22/2008
10
Photoreceptor Sensitivity Cone Sensitivity
Relative Eye Sensitivities Overall Spectral Sensitivity of the Eye
Photopic Vision• Cone Vision - Using V(λ)Cone Vision Using V(λ)• > 3.5 cd/m² adaptation Luminance
Scotopic Vision• Rod Vision - Using V´(λ)• < 0.035 cd/m²
Mesopic VisionMesopic Vision• Mixture of Rod and Cone Vision• Transition state between photopic and scotopic
12/22/2008
11
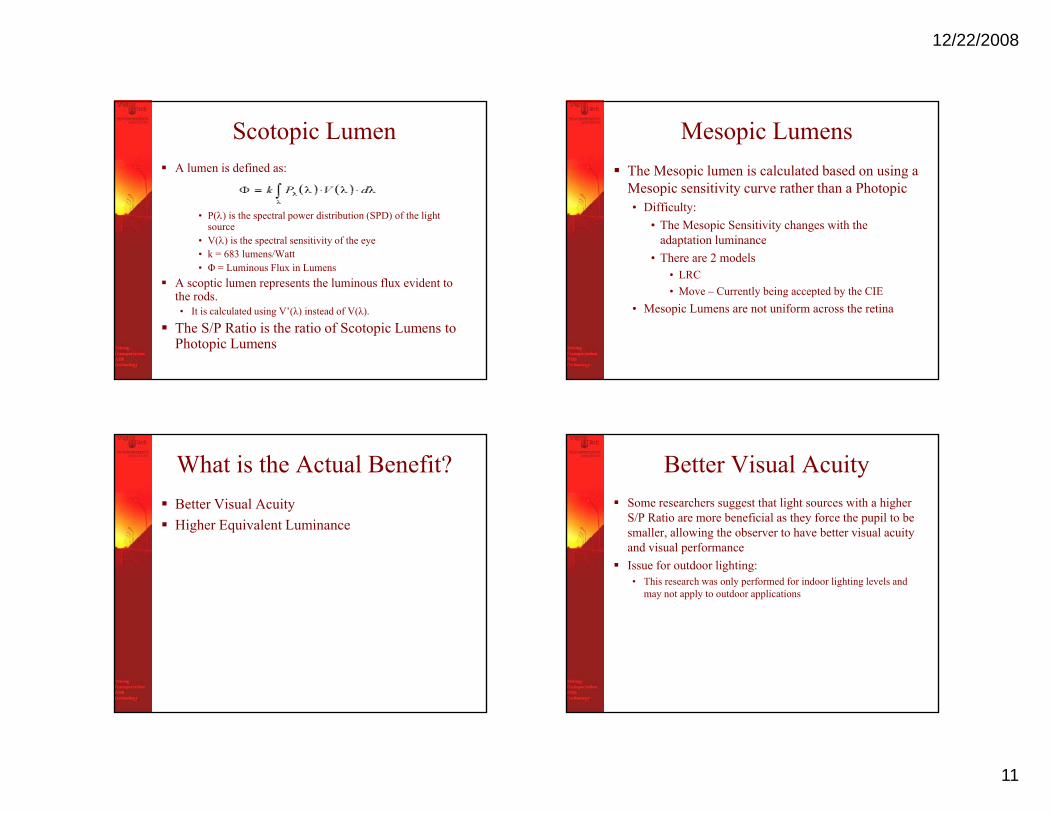
Scotopic LumenA lumen is defined as:
• P(λ) is the spectral power distribution (SPD) of the light source
• V(λ) is the spectral sensitivity of the eye• k = 683 lumens/Watt• Φ = Luminous Flux in Lumens
A scoptic lumen represents the luminous flux evident to scopt c u e ep ese ts t e u ous u ev de t tothe rods.• It is calculated using V’(λ) instead of V(λ).
The S/P Ratio is the ratio of Scotopic Lumens to Photopic Lumens
Mesopic LumensThe Mesopic lumen is calculated based on using a Mesopic sensitivity curve rather than a Photopicp y p• Difficulty:
• The Mesopic Sensitivity changes with the adaptation luminance
• There are 2 models• LRC
l b i d b h• Move – Currently being accepted by the CIE• Mesopic Lumens are not uniform across the retina
What is the Actual Benefit?Better Visual AcuityHigher Equivalent LuminanceHigher Equivalent Luminance
Better Visual AcuitySome researchers suggest that light sources with a higher S/P Ratio are more beneficial as they force the pupil to be smaller, allowing the observer to have better visual acuity and visual performanceIssue for outdoor lighting:• This research was only performed for indoor lighting levels and
may not apply to outdoor applications

12/22/2008
12
Higher Perceived LuminanceLight sources with a blue content create a higher response in the cones and therefore a higher p gperceived luminance• Higher Mesopic Luminance• Higher S/P ratio
Issue:• It is important to remember that this change is only p g y
evident in the periphery of the eye and not in the fovea• Rods must be present to create the effect
For outdoor lighting, this is the most critical aspect of white light.
How big is the benefit?There is conflicting research• LRC has shown that an object which appears at 20º
peripherally is perceived at a lower level in white light thanperipherally is perceived at a lower level in white light than in amber
• Lewis has shown similar effects for peripheral targetsIt has been proposed that Luminance Equivalence Multipliers be applied to lighting levels to account for the increased benefit of white light.• These values are based on the Mesopic lumen rating of the
light sourcelight source• The applicability value of the scaling factors is a topic of
debate Important:• The use of these scaling factors has not been approved by
the IESNA for Lighting Applications
Proposed LEMs for White Light
Source 1 fc Illuminance
0.1 fc Illuminance
Metal Halide 1 1Incandescent 1.5 2.9Mercury Vapor 2 4 4 4Mercury Vapor 2.4 4.4High Pressure Sodium
3.9 7.8
Low Pressure Sodium
4.8 14.6
Conflicting ResearchVTTI Crosswalk Lighting Results• Metal Halide under performs HPS in a object detectionMetal Halide under performs HPS in a object detection
task in a roadway environment• For the same vertical illuminance on the object,
detection distances were longer under HPS than MH for Black Clothed Objects and Equivalent for Denim Clothed Objects

12/22/2008
13
Crosswalk Lighting – Pedestrian Detection
Impact of Pedestrian Clothing On Pedestrian Detection
800
1000
1200
1400
1600
1800
2000
Dis
tanc
e (f
t)
Black No GlareDenim No GlareSurrogate No GlareWhite No Glare
0
200
400
600
6 10 20 30
Lamp Level
Crosswalk Lighting – Black Clothed
Impact Of Lamp Type Pedestrian Detection For Black Clothed Pedestrians
300
400
500
600
700
800
900
Dis
tanc
e (f
t)
HPS No GlareMH
0
100
200
300
6 10 20 30
Lamp Level
D
Crosswalk Lighting – Denim Clothes
Lamp Type and Denim Clothed Pedestrians
400
600
800
1000
1200
Dis
tanc
e (f
t)
HPS No GlareMH No Glare
0
200
400
6 10 20 30
Lamp Level
Why the difference in the Research Results?
Experimental Methods differences• Many experiments uses fixed geometry to determine the effects
Th lt th i t t d t l th ti• The results are then interpreted to apply across the entire visual field
• This is invalid as the visual field is not uniform across the retina
• Crosswalk Lighting Investigation• Use non fixed geometry – Free Driving• Most objects appeared foveally
• No Mesopic White Light effect is evident• No Mesopic White Light effect is evident• Older Drivers – 65+ years old
• The lens yellows with age and may impact performance for a non-yellow source
Neither of these methods truly represent what is happening in a vehicle
12/22/2008
14
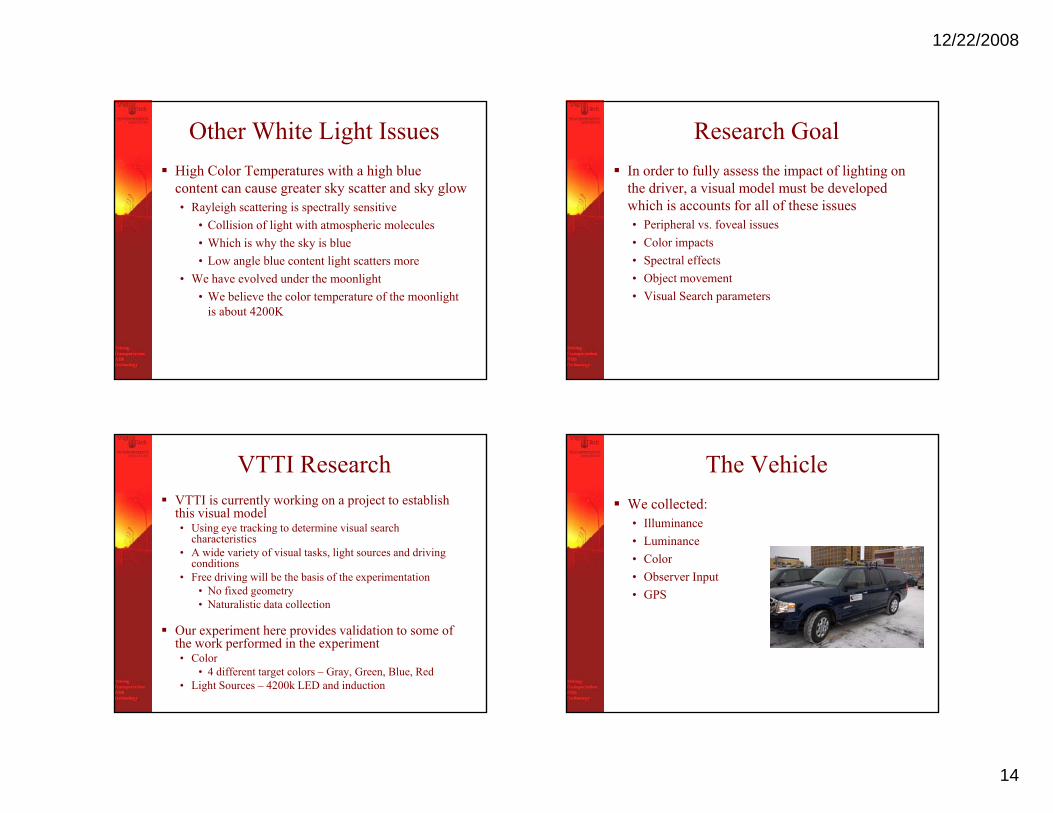
Other White Light IssuesHigh Color Temperatures with a high blue content can cause greater sky scatter and sky glowg y y g• Rayleigh scattering is spectrally sensitive
• Collision of light with atmospheric molecules• Which is why the sky is blue• Low angle blue content light scatters more
• We have evolved under the moonlight• We believe the color temperature of the moonlight
is about 4200K
Research GoalIn order to fully assess the impact of lighting on the driver, a visual model must be developed , pwhich is accounts for all of these issues• Peripheral vs. foveal issues• Color impacts• Spectral effects• Object movement• Visual Search parameters
VTTI ResearchVTTI is currently working on a project to establish this visual model• Using eye tracking to determine visual search• Using eye tracking to determine visual search
characteristics• A wide variety of visual tasks, light sources and driving
conditions• Free driving will be the basis of the experimentation
• No fixed geometry• Naturalistic data collection
Our experiment here provides validation to some of the work performed in the experiment• Color
• 4 different target colors – Gray, Green, Blue, Red• Light Sources – 4200k LED and induction
The VehicleWe collected:• IlluminanceIlluminance• Luminance• Color• Observer Input• GPS

12/22/2008
15
Color CameraCollecting RBG of road viewAssists in determining conflicts
Luminance CameraCollecting Photometrically yAccurate Road Characteristics
Illuminance5 illuminance meters• 4 measuring horizontal illuminance on the roof of the4 measuring horizontal illuminance on the roof of the
vehicle• Wheel path and centerline of the vehicle• 2 along centerline to measure gradient
• 1 measuring vertical illuminance at the windshield• Estimates of glare impact
Where the Results GoWe will be analyzing the detection distances and the luminance in each area.• A short report will be prepared
The data will add to our entire database of data.