Embed Size (px)
Citation preview

July 2015
July, 2015
Roadshow Presentation – 9-month Key Sales Figures 2014/15

� BC at a glance
� Highlights Q3 2014/15
� Financial Review
� Strategy & Outlook
Agenda
July, 2015 Q3 2014/15 Roadshow presentationPage 2

From the cocoa bean to the chocolate and cocoa products
Barry Callebaut is present in the key parts of the cocoa and chocolate
value chain
July, 2015 Q3 2014/15 Roadshow presentationPage 3
Cocoa Beans
Cocoa Powder
Cocoa Liquor
Cocoa Butter
Chocolate Couverture
Barry Callebaut’s core activities
~54%
80%
~46%
+ Sugar, Milk,
Fats, Others
Cocoa Farming
Compound/
Fillings
+ Sugar, Milk,
Others
Powder Mixes
Cocoa Processing
Chocolate
Manufacturing
Direct Sourcing
+ Sugar, Milk,
Others
Cocoa Origination

Barry Callebaut at a glance
• World leading producer and business-to-business supplier
of chocolate and cocoa products
• Fully integrated with strong position in cocoa-orign
countries
• Serving the entire food industry
• Outsourcing/ strategic partner of choice
• Largest supplier of Gourmet & Specialties
FY 2013/14
Sales Volume 1.7 mio. tonnes
Sales Revenue CHF 5.8 bn
EBIT CHF 416.2 mio.
Employees 9,300
Factories 54
July, 2015 Q3 2014/15 Roadshow presentationPage 4
Business description Key figures
Q3 2014/15
Sales Volume per Product Group
Q3 2014/15
Sales Volume per Region Gourmet global brands
Europe
43%
Americas
25%
Global
Cocoa
28%
Asia-
Pacific 4%
Food
Manu-
facturers
62%
Cocoa
Products
28%
Gourmet &
Specialties
11%
Favorable industry dynamics
Global growth prospects
Market size and outsourcing potential
Outsourcing rationale for customers
� Average market growth in chocolate: 1.8 % in
volume per year
� Influenced by population growth and increase
in disposable income
� Resilient industry to macro-economic downturn
� Fast growing in Emerging markets
Barriers to entry:
� Complex sourcing and supply chain
� Capital intensive business
� Size matters
� High innovation rate
� High level of regulation and quality
requirements
� Total Industrial chocolate market is about 6
mio tonnes
51%49%Produced in-house
by consumer
companies
Already
outsourced
� Free up capital to invest in marketing and
distribution
� Access to most recent innovation and new
developments in the industry
� Flexibility to adapt recipes in short time
� Reduce complexity in their supply chain
� Solutions to global trends and regulations
July, 2015 Q3 2014/15 Roadshow presentationPage 5

Our 54 factories provide us with manufacturing diversification and unique
competitive advantage
Chocolate factory
Cocoa processing factory
Integrated factory
New factories since 2014
July, 2015 Q3 2014/15 Roadshow presentationPage 6
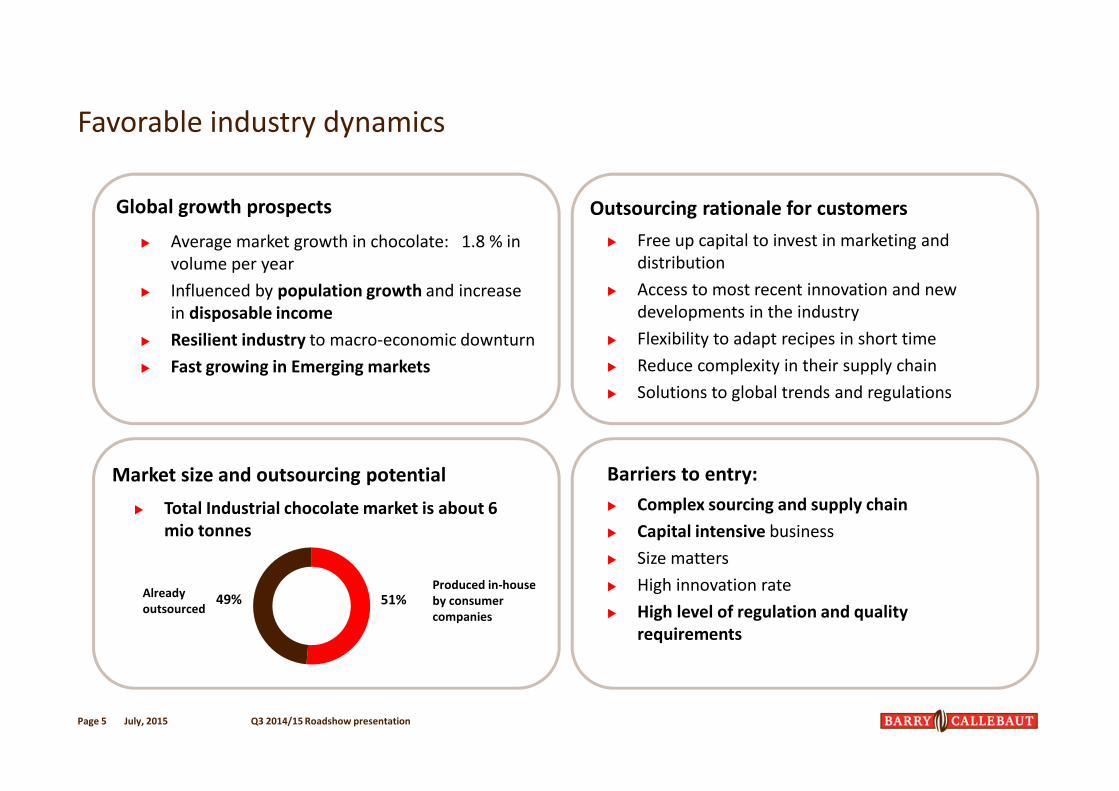
Chocolate and Cocoa markets
Barry Callebaut uniquely positioned in industrial chocolate and cocoa
markets
July, 2015 Q3 2014/15 Roadshow presentationPage 7
Sources: Third party study (2014); Proprietary estimates
Cocoa grinding capacity Industrial chocolate – open market
BC
Cargill
Olam
Blommer
Mondelez
Guan Chong
Ecom Cocoa
Nestlé
Ferrero
BT Cocoa
Others
BC
Cargill + ADM
Blommer
ADM
Cemoi
Puratos
Fuji Oil
IRCA
Guittard
Clasen
Others
� BC at a glance
� Highlights Q3 2014/15
� Financial Review
� Strategy & Outlook
Agenda
July, 2015 Q3 2014/15 Roadshow presentationPage 8

9-month Key Sales Figures - 2014/15
Volume continues to grow well above the global chocolate confectionery
market
July, 2015 Q3 2014/15 Roadshow presentationPage 9
� Sales volume growth +2.5% in a weak global chocolate
confectionery market (-2.1%*)
� Continued good volume growth in the chocolate
business
� Volume growth broadly based, supported by key growth
drivers: outsourcing +6.3%, Gourmet & Specialties
Products: +4.9%; emerging markets picking up +3.3%
� Sales revenue up +12.0% in local currencies, driven by a
more favorable product mix, as well higher cocoa bean
prices compared to last year
Source: * Nielsen data Sep- April – 25 countries

Volume
growth
July, 2015 Q3 2014/15 Roadshow presentationPage 10
+2.5% +3.7% +6.7% +0.8%
25%
4%
28%
Europe Americas Asia Pacific Global Cocoa
43%
25%
4%
28%
Market
Growth *
Source: * Nielsen data Sep- April – 25 countries
-2.0% -2.5% -1.5%
9-month Key Sales Figures - 2014/15
Volume growth +2.5% above the global chocolate confectionery market
which declined -2.1%*

…along our three key growth drivers
Volume growth
9 months
2014/15+4.9% vs prior year
%
of total Group
Volume
Gourmet & SpecialtiesEmerging Markets Long-term outsourcing &
Strategic partnerships
+3.3% vs prior year +6.3 % vs prior year
33%
31%
11%
CAGR 5 year
Volume+6.0 %+17.3% +21.0%
Page 11 July, 2015 Q3 2014/15 Roadshow presentation
9-month Key Sales Figures - 2014/15

� Acquisition of assets of American Almond, leader in the U.S. in
artisanal nut-based ingredients
� 2,000 tonnes of nut specialties per year and revenue of approx.
CHF 14.8 million (USD 15.9 million / EUR 14.2 million) in 2014
� Integration of American Almond into Barry Callebaut’s business
Region Americas as of August 1, 2015
� Complementing several acquisitions of adjacent products over
the last years
Recent developments - Expansion
Further expansion of our adjacent specialties business
July, 2015 Q3 2014/15 Roadshow presentationPage 12

� GarudaFood and Barry Callebaut signed a long-term
outsourcing agreement in South-East Asia on June 16th, 2015
� Barry Callebaut will take over some of the manufacturing
equipment from GarudaFood and set up its operations in a new
compound chocolate factory in Indonesia.
� Under the terms of the agreement, Barry Callebaut will supply a
minimum of 10,000 tonnes of compound chocolate per year to
GarudaFood’s biscuit factory in Gresik (Province of East Java).
� Plans to increase volume over the next three years.
Implementation will start in mid-2016
Recent developments - Expansion
Signing of first long-term outsourcing agreement in South-East Asia with
GarudaFood
July, 2015 Q3 2014/15 Roadshow presentationPage 13
� Effective October 1, 2015, Antoine de Saint-Affrique (1964,
French national) will take over from Juergen Steinemann who
was elected Vice Chairman of the Board in December 2014.
� Currently President Unilever Foods (combined turnover of EUR
12.4 billion across 8 regions and 3 categories) and a Member of
Unilever’s Group Executive Committee
� Excellent knowledge of consumer markets, strong customer and
stakeholder focus, extensive international working experience,
and remarkable success in building and integrating new
businesses as well as rebalancing portfolios towards faster
growing geographies
CEO Announcement
Antoine de Saint-Affrique to become CEO of Barry Callebaut
July, 2015 Q3 2014/15 Roadshow presentationPage 14

� BC at a glance
� Highlights Q3 2014/15
� Financial Review
� Strategy & Outlook
Agenda
July, 2015 Q3 2014/15 Roadshow presentationPage 15

6-year EBIT per tonne development
Improvement of the EBIT per tonne continues
285274
251
290
312
282
245
242
223
256
286282
1’269
2009/10
1’536
2011/12
1’378
2010/11
1’717
2012/13
+9.1%
2013/14 2014/15
(HY)
8931’210
EBIT per tonne in CHF
(as reported)
EBIT per tonne in CHF
(at constant currencies)
Volume in kMT
Page 16 July, 2015 Q3 2014/15 Roadshow presentation
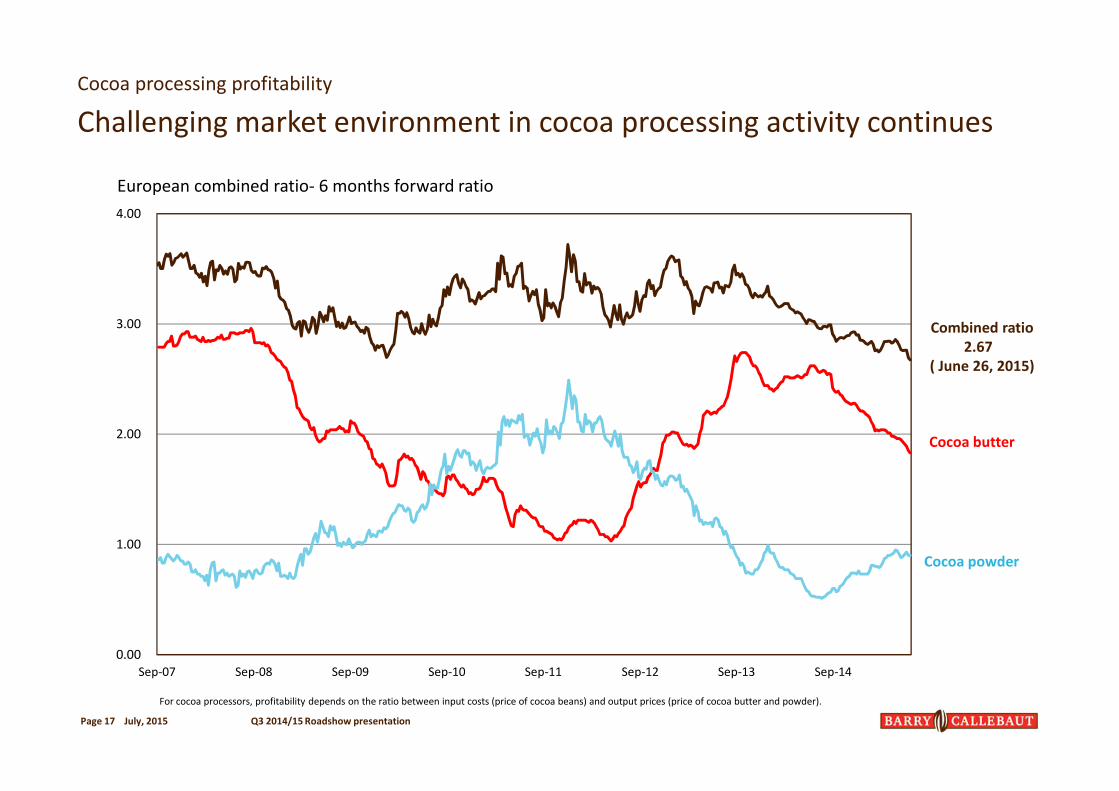
Challenging market environment in cocoa processing activity continues
Cocoa processing profitability
European combined ratio- 6 months forward ratio
For cocoa processors, profitability depends on the ratio between input costs (price of cocoa beans) and output prices (price of cocoa butter and powder).
Page 17
Combined ratio
2.67
( June 26, 2015)
Cocoa butter
Cocoa powder
0.00
1.00
2.00
3.00
4.00
Sep-07 Sep-08 Sep-09 Sep-10 Sep-11 Sep-12 Sep-13 Sep-14
July, 2015 Q3 2014/15 Roadshow presentation
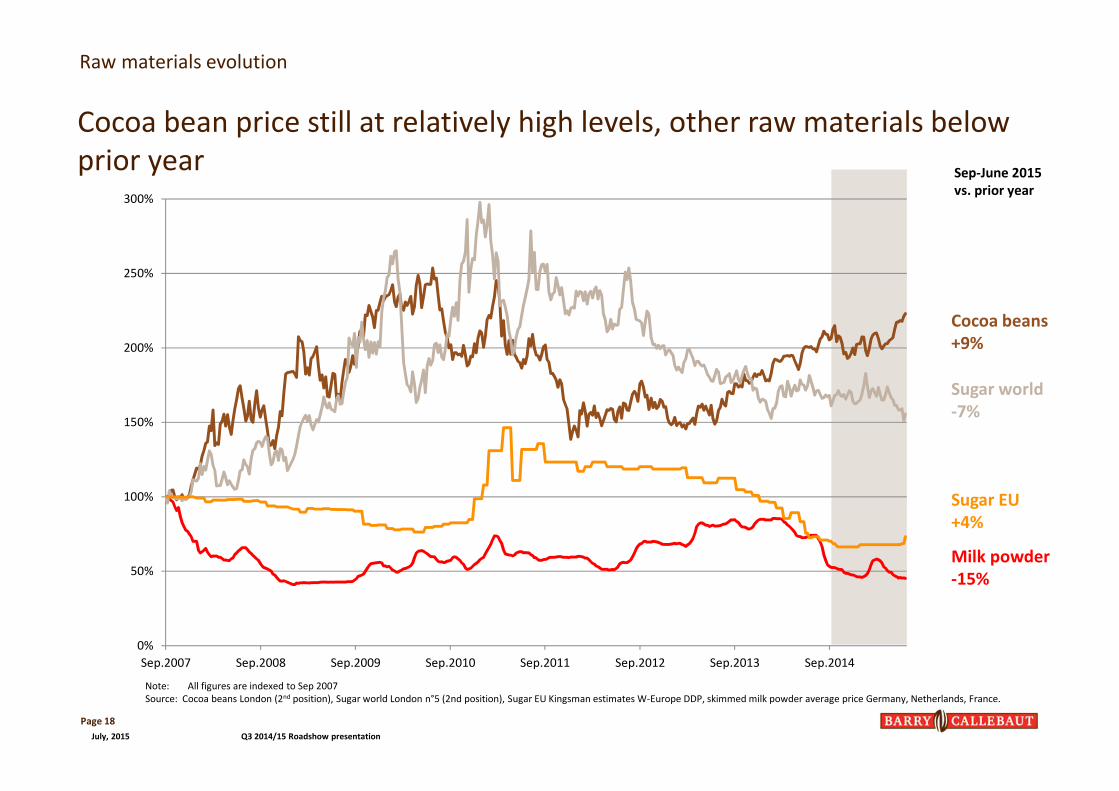
Cocoa bean price still at relatively high levels, other raw materials below
prior year
Raw materials evolution
Cocoa beans
+9%
Milk powder
-15%
Sugar EU
+4%
Sugar world
-7%
Page 18
Sep-June 2015
vs. prior year
Note: All figures are indexed to Sep 2007
Source: Cocoa beans London (2nd position), Sugar world London n°5 (2nd position), Sugar EU Kingsman estimates W-Europe DDP, skimmed milk powder average price Germany, Netherlands, France.
0%
50%
100%
150%
200%
250%
300%
Sep.2007 Sep.2008 Sep.2009 Sep.2010 Sep.2011 Sep.2012 Sep.2013 Sep.2014
July, 2015 Q3 2014/15 Roadshow presentation

Higher working capital needs due to acquisition of cocoa business and
higher cocoa bean price
July, 2015 Q3 2014/15 Roadshow presentationPage 19
914831
921 884965
888
975876754700798832889943
789904
1,010
FY 2008
1,037
FY 2007
834
FY 2006FY 2005FY 2004
CAGR +6.2%
FY 2014FY 2009 FY 2010 FY 2011
1,039
1,346
FY 2013
1,675
FY 2012
NWC CHF mio.
NWC per tonne
(CHF)
Cocoa bean price
(GBP)
10-year development
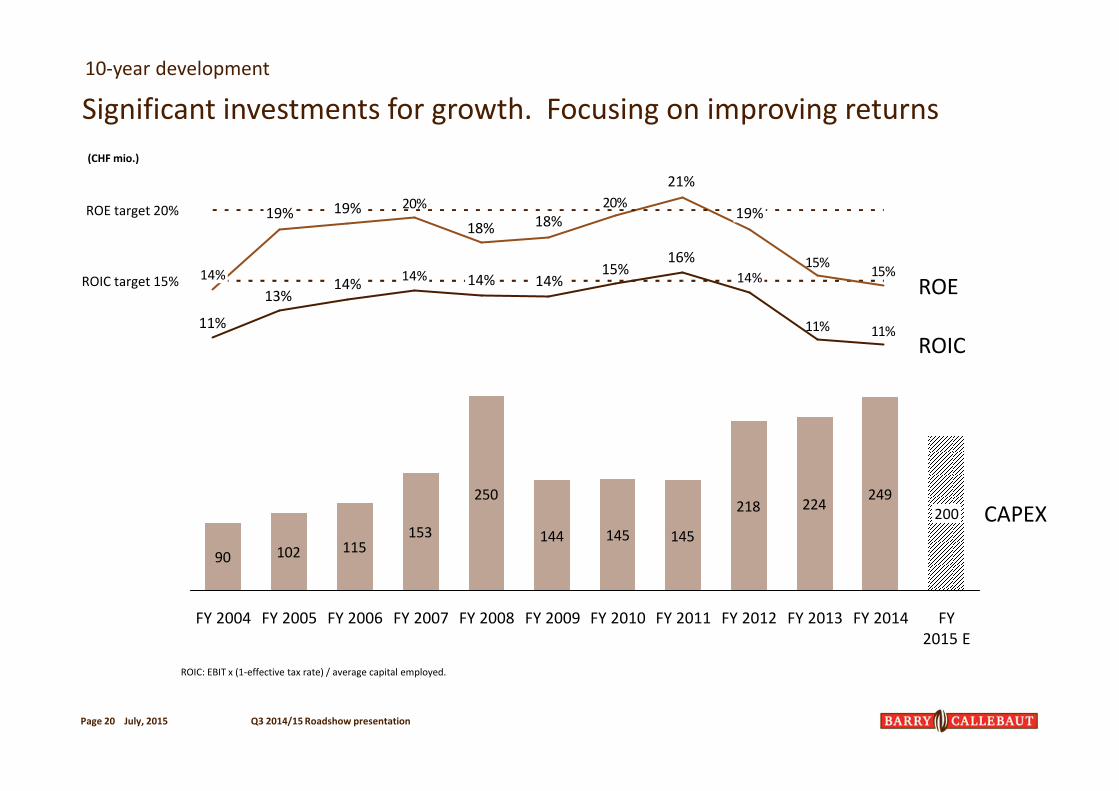
16%15%
13%
11%11%11%
15%
20%
18%
20%
15%
21%
18%
ROE target 20%
ROEROIC target 15%
ROIC
19%
14%14%14%14%
19%
14%
19%
14%
90 102 115153
250
144 145 145
218 224249
CAPEX
FY 2014FY 2013FY 2012FY 2011FY 2010FY 2009FY 2008FY 2007FY 2006FY 2005FY 2004 FY
2015 E
200
Significant investments for growth. Focusing on improving returns
(CHF mio.)
10-year development
Q3 2014/15 Roadshow presentationPage 20 July, 2015
ROIC: EBIT x (1-effective tax rate) / average capital employed.

� BC at a glance
� Highlights HY 2014/15
� Financial Review
� Strategy & Outlook
Agenda
July, 2015 Q3 2014/15 Roadshow presentationPage 21

The Barry Callebaut Group’s growth strategy
Our proven four-pillar strategy is the basis for our long-term business
success
Vision
4 strategic
pillars
Sustainable,
profitable
growth
Expansion
Innovation
Cost Leadership
Sustainable Cocoa
“Heart and engine of the
chocolate and cocoa industry”
Page 22 July, 2015 Q3 2014/15 Roadshow presentation
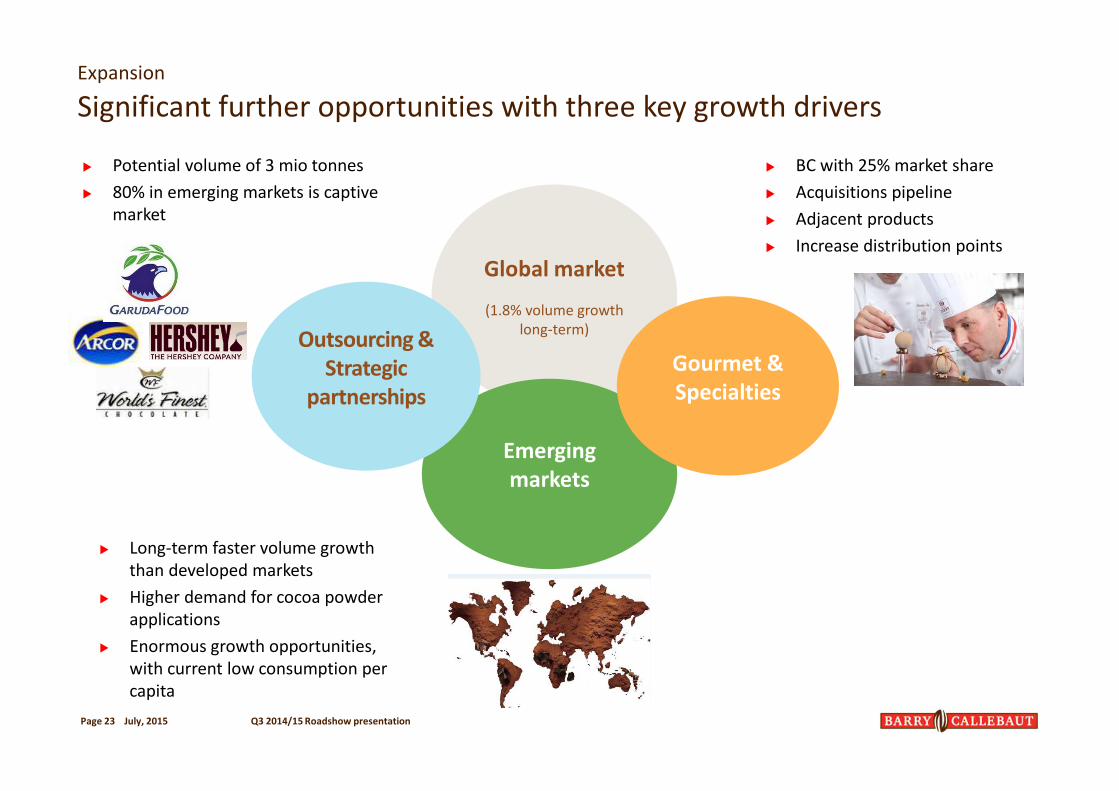
Significant further opportunities with three key growth drivers
Page 23
� BC with 25% market share
� Acquisitions pipeline
� Adjacent products
� Increase distribution points
� Long-term faster volume growth
than developed markets
� Higher demand for cocoa powder
applications
� Enormous growth opportunities,
with current low consumption per
capita
� Potential volume of 3 mio tonnes
� 80% in emerging markets is captive
market
Global market
(1.8% volume growth
long-term)
Emerging
markets
Gourmet &
Specialties
Outsourcing &
Strategic
partnerships
Expansion
July, 2015 Q3 2014/15 Roadshow presentation
Market/ Industry Outlook
� Temporary decline in the chocolate confectionery industry,
due to prices increases and soft economies across the
globe. Growth prospects in chocolate and cocoa remain
unchanged
� Significant opportunities along the key growth drivers
� Challenging cocoa products market
Mid-term Guidance*
� On average 6-8% volume growth per year, and
� EBIT per tonne to reach CHF 256 by 2015/16
Outlook
July, 2015 Q3 2014/15 Roadshow presentationPage 24
* Barring any unforseable events ; EBIT per tonne subject to currency translation impacts
July, 2015
Appendix

July, 2015 Q3 2014/15 Roadshow presentationPage 26
� Global number one player focused in chocolate and cocoa
� Global leader in Gourmet
� Proven and long-term oriented strategy
� Unparalled global footprint, present in all key markets
� Preferred outsourcing and strategic partner
� Leading and growing presence in emerging markets
� Deep R&D / Innovation know-how
� Cost leadership along the value chain
� Taking leadership in sustainable cocoa
� Entrepreneurial spirit
� Supportive ownership structure
What makes Barry Callebaut unique?

High cocoa bean price levels still weighing on our Balance Sheet and key
ratios
Balance Sheet & key ratios
Page 27
Feb 15 Aug 14 Feb 14
Total Assets [CHF m] 5,433.4 5,167.5 5,106.9
Net Working Capital [CHF m] 1,566.6 1,674.6 1,501.4
Non-Current Assets [CHF m] 2,139.5 2,175.6 2,068.6
Net Debt [CHF m] 1,790.6 1,803.5 1,698.2
Shareholders' Equity [CHF m] 1,654.4 1,790.7 1,658.9
Debt/Equity ratio 108.2% 100.7% 102.4%
Solvency ratio 30.4% 34.7% 32.5%
Net debt / EBITDA 3.2x 3.4x 3.6x
Interest cover ratio 4.6x 4.5x 4.9x
ROIC 10.9% 10.5% 11.1%
ROE 16.2% 14.7% 15.6%
July, 2015 Q3 2014/15 Roadshow presentation
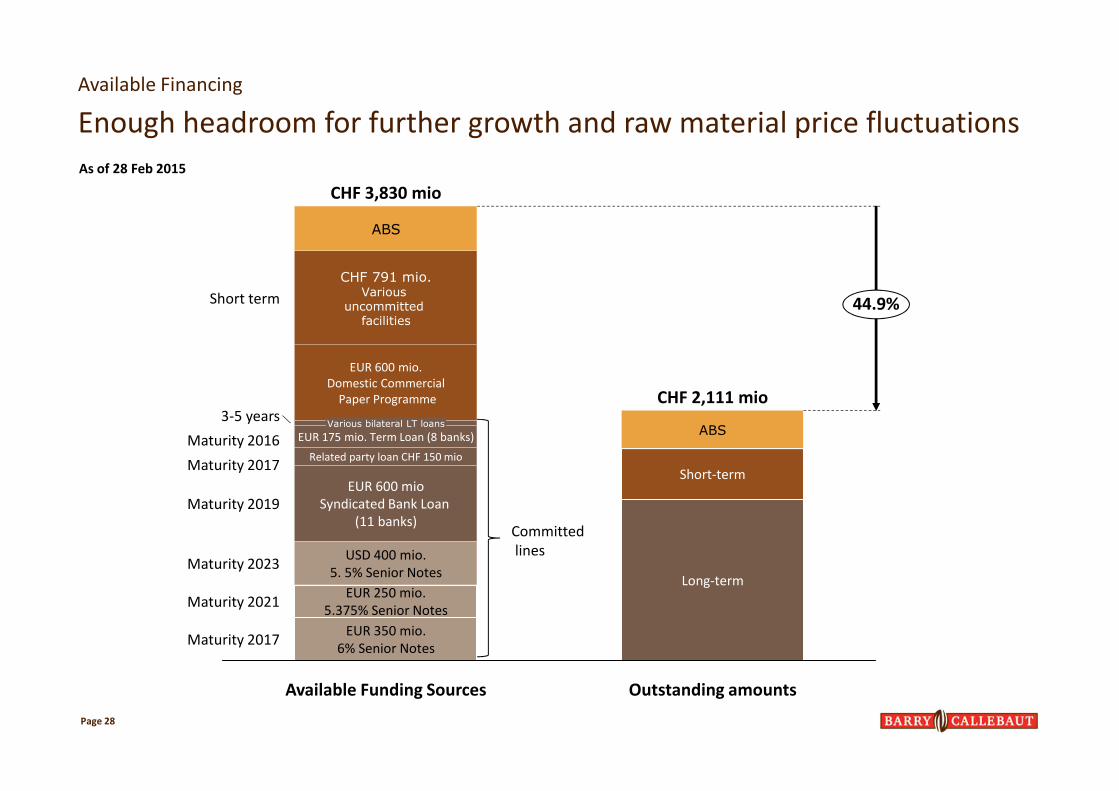
Available Financing
Enough headroom for further growth and raw material price fluctuations
Page 28
EUR 250 mio.
5.375% Senior Notes
USD 400 mio.
5. 5% Senior Notes
EUR 600 mio
Syndicated Bank Loan
(11 banks)
Related party loan CHF 150 mio
EUR 175 mio. Term Loan (8 banks)Various bilateral LT loans
EUR 600 mio.
Domestic Commercial
Paper Programme
CHF 791 mio.Various
uncommitted facilities
ABS
Maturity 2017
44.9%
Maturity 2021
EUR 350 mio.
6% Senior Notes
Outstanding amounts
Long-term
Short-term
ABS
Available Funding Sources
Maturity 2023
Maturity 2019
Maturity 2017
Maturity 2016
3-5 years
Short term
CHF 3,830 mio
CHF 2,111 mio
As of 28 Feb 2015
Committed
lines

Capital Expenditures
July, 2015 Q3 2014/15 Roadshow presentationPage 29
200
PLAN
2014/15
2013/14
249
2012/13
224
2011/12
218
2010/11
174
2009/10
145
CAPEX as % of sales revenue
Average = 3.9%+4.2%+4.6%+4.5%
+3.2%+3.2%
in CHF mio.
IT
Upgrade / efficiency gains
existing sites
Maintenance
Additional growth

Cash flow generation despite fast volume growth and expansion, which
also translated into high return to shareholders
458418434
407
348313
252228
116
451
CAGR 12.7%
2014
474
20132012
455
2011
480
201020092008200720062005200420032002
in CHFm
Negative FX impact* Operating Cash Flow before working capital changes
696%
522%
411%324%337%
436%
161%
69%47%-2%0%
502%
279%
Total return to
shareholders
Cash Flow
Q3 2014/15 Roadshow presentationPage 30 July, 2015

Net debt development – Increased driven by higher working capital
needs and further expansion
July, 2015 Q3 2014/15 Roadshow presentationPage 31
943790
871943930907954943
3.43.5
1.82.12.12.32.22.3
2.62.6
1,525
FY 2013FY 2010FY 2009FY 2008
1,042
FY 2007FY 2004 FY 2012
2.2
FY 2011FY 2006FY 2005
1,804
FY 2014
Net Debt (in CHF mio.)
Net debt /EBITDA
10-year development
July, 2015 Q3 2014/15 Roadshow presentationPage 32
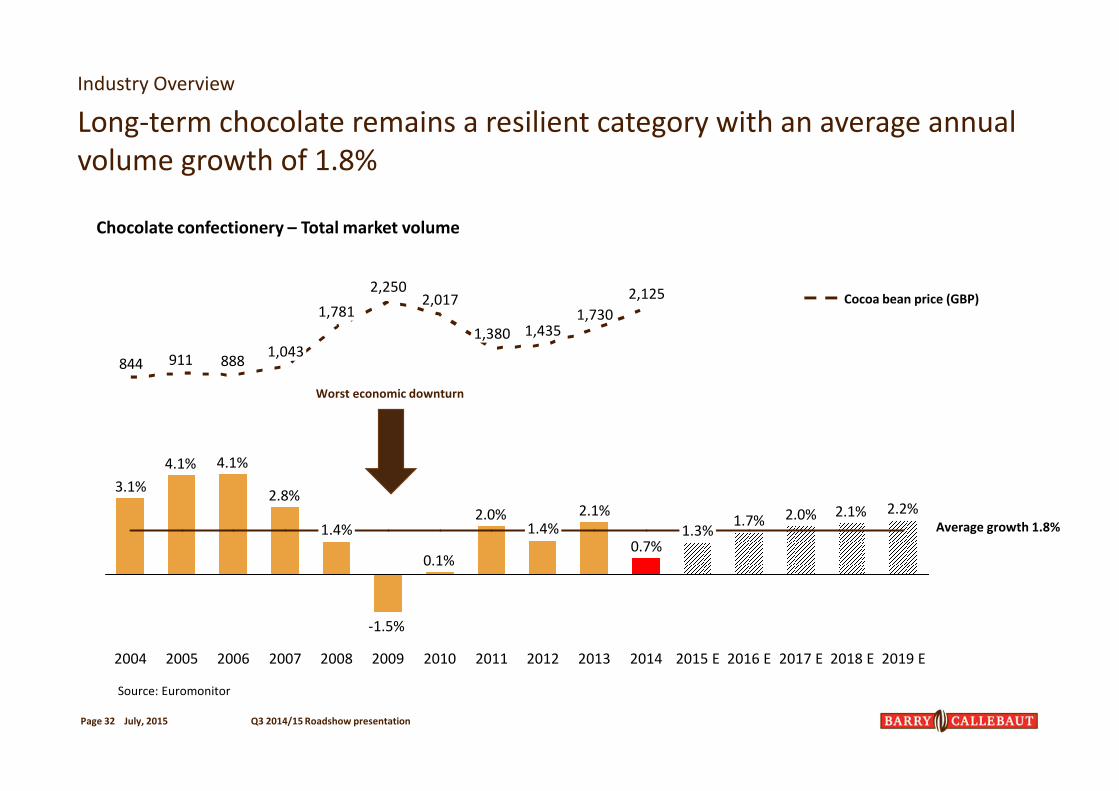
2.2%2.1%2.0%1.7%
0.7%
2.1%2.0%
0.1%
-1.5%
2.8%
4.1%4.1%
3.1%
888911844
2018 E2017 E201020092008
1.4%
200720062005 2016 E2015 E
1.3%
201420132012
1.4%
20112004
1,380
2,1252,250
1,781
1,043
1,4351,730
2019 E
2,017 Cocoa bean price (GBP)
Industry Overview
Long-term chocolate remains a resilient category with an average annual
volume growth of 1.8%
Worst economic downturn
Chocolate confectionery – Total market volume
Average growth 1.8%
Source: Euromonitor

West Africa is the world’s largest cocoa producer – BC sources locally
Source: ICCO estimates
� About 70% of total cocoa beans
come from West Africa
� BC processed ~940,000 tonnes or
22% of the world crop
� Barry Callebaut has various cocoa
processing facilities in origin
countries*, in Europe and in the USA
Total world harvest (13/14): 4’345 TMT
Ivory Coast*
40%
Ghana*
21%
Indonesia*
10%
Nigeria
6%
Cameroon*
5%
Brazil*
5%
Ecuador
5%
others
8%
July, 2015 Q3 2014/15 Roadshow presentationPage 33