Embed Size (px)
Citation preview
Government of the People’s Republic of Bangladesh
Ministry of Communication
Bangladesh Road Transport Authority
ROAD SAFETY CELL
NATIONAL
ROAD TRAFFIC ACCIDENT
REPORT
2004

Road Safety Cell, BRTA RTA Annual Report 2004
Prepared by
1. Dr. M A Momen, Chairman, BRTA. 2. Md. Ashraful Islam, Director (Engineering), BRTA. 3. Md. Aftab Ali, Manager, RSC, BRTA. 4. A.B.M. Abubaker Siddique, Accident Data Analyst, RSC,BRTA. This report has been produced with assistance from the CIDC3 Project. CIDC3 is an institutional development project supported by DFID (UK)

Road Safety Cell, BRTA RTA Annual Report 2004
Page 1
CONTENTS 1 INTRODUCTION.......................................................……………….............…… 3
2 THE ROAD TRAFFIC ACCIDENT DATABASE....................................….....…. 4
2.1 DATA COLLECTION...........................................................................…………. 4
2.2 REPORTING.........................................................................................……….... 4
2.3 INTERPRETATION OF DATA........................................................…….....……. 5
3 CASUALTY ACCIDENTS........................................................................…....… 6
4 CASUALTY ACCIDENTS BY TYPE OF COLLECTION ...………………….….. 10
5 CASUALTY ACCIDENTS BY TYPE OF JUNCTION.....................................… 21
6 TYPES OF VEHICLE INVOLVED IN CASUALTY ACCIDENTS...............….... 27
7 CASUALTIES..........................................................................................……… 37
8 FATALITIES........................................................................................……….... 41
9 NATIONAL HIGHWAY ROAD NETWORK: SAFETY PROFILE ...............…… 49
9.1 TRAFFIC PROFILE..................................................................................…..…. 49
9.2 SAFETY PERFORMANCE PROFILE.........................................................…… 49
10 COMMENTS AND DISCUSSION................................................................…… 53
10.1 FATAL PEDESTRIAN ACCIDENTS...........................................................…… 53
10.2 MULTIPLE FATALITIES ACCIDENTS.......................................................…… 53
10.3 BUSES AND HEAVY VEHICLES.............................................................…..… 53
11 CONCLUSION........................................................................................…….… 54
11.1 ROAD SAFETY INITIATIVES.....................................................................…… 54
11.2 ACCESS OF THE RTA DATABASE..........................................................…… 55

BRTA Road Safety Cell RTA Annual Report 2004
Page 2
Index of Tables
Table 3-1: Recorded Casualty Accidents by Division and City...............................………………….…. 6 Table 3-2 : Change in Recorded Casualty Accidents, 1999-2004...............................………………….. 7 Table 3-3 : Recorded Casualty Accidents by District (Zilla) ......................................…………………… 8 Table 4-1: Recorded Casualty Accidents by Type of Collision...................................………………….. 10Table 4-2 : Recorded Fatal Accidents by Type of Collision by Division and City....……………………… 17Table 4-3 : Recorded Fatal Accidents by Type of Collision by Division and City as percentage of total
fatal accidents in Division or City...............................………………………………………….. 17Table 4-4 : Change in Recorded Fatal Accidents by Type of Collision 1999-2004....……………………. 18 Table 4-5 : Recorded Fatal Accidents by Type of Collision by District (Zilla) ............……………………. 18 Table 4-6 : Recorded Fatal Accidents by Type of Junction and by Division and City as percentage of
total fatal accidents in Division or City. ...............………………………………………………. 19 Table 5-1 : Change in Recorded Fatal Accidents by Type of Collision 1999-2004………………………. 21 Table 5-2 : Recorded Fatal Accidents by Type of Junction and by Division and City……………………. 23 Table 5-3 : Recorded Fatal Accidents by Type of Junction and by Division and City as percentage of
total fatal accidents in Division or City. ................…………………………………………….… 23Table 5-4 : Change in Recorded Fatal Accidents by Type of Junction 1999-2004....……………………. 24 Table 5-5 : Fatality Rate by Type of Junction. ..............................................................……………….… 24 Table 5-6 : Recorded Fatal Accidents by Type of Junction by District (Zilla). .........……………………. 25 Table 6-1 : Number of Vehicles by Type involved in Recorded Casualty Accidents by Road
Environment and Road Class. .....................................................…………………………….. 27 Table 6-2 : Type of Registered Vehicles in Bangladesh. ..............................................…………………. 30 Table 6-3 : Number of Vehicles by Type involved in Recorded Casualty Accidents by
Type of Collision. ....................................................................................…………………….. 31 Table 6-4 : Number of Vehicles by Type involved in recorded Casualty Accidents by Road
Environment and Road Class in Dhaka Metropolitan Area……………………………………. 34Table 7-1 : Recorded Casualties by Division and City..................................................…………………. 37 Table 7-2 : Change in Recorded Casualties 1999-2004................................................………………… 38 Table 7-3 : Recorded Casualties by District (Zilla) ........................................................………………… 39 Table 8-1 : Road Accident Fatalities by Age.................................................................…………………. 41 Table 8-2 : Passenger Fatalities by Age and Sex..........................................................…………………. 42Table 8-3 : Pedestrian Fatalities by Age and Sex.......................................................…………………… 43Table 8-4 : Number of Motor Cycle driver fatalities by age and helmet…………………………………… 44 Table 8-7: A Safety Profile of the National Highways…...............................................…………………. 51Table 11-1: Recommendations for Road Safety Initiatives…........................................…………………. 55
Index of Figure Table 3-1 : Casualty Accidents by Division and City…..............................................……………………. 6 Table 3-2 : Casualty Accident Rate, 1999-2004….......................................................…………………. 7 Table 4-1 : Fatal Accidents by Type of Collision and Road Class…....................……………………….. 10 Table 4-2 : Accidents by Time…………………………………………………………………………………. 13 Table 4-3 : Total Accidents by Month…………………………………………………………………………. 16 Table 5-1 : Fatal Accidents by Type of Junction and Road Class…...........................…………………… 21 Table 6-1 : Comparison of Motor Vehicle type involved in fatal accident. …..........……………………… 30 Table 7-1 : Casualty Rate by Division and Metropolitan Area…................................…………………… 37 Table 7-2 : Casualty Rates 1999-2004….......................................................................………………… 38 Table 8-1 : Number of Road Accident Fatalities by Age…........................................…………………… 41 Table 8-2 : Number of Passenger Fatalities by Age and Sex…................................…………………… 42 Table 8-3 : Number of Pedestrian Fatalities by Age and Sex…............................……………………… 43 Table 8-4 : Number of Motor Cycle driver fatalities by age and helmet………………………. ………… 44

Road Safety Cell, BRTA RTA Annual Report 2004
Page 3
1 INTRODUCTION
This National Road Traffic Accident Report for the period 2004 is the fourth consecutive annual report
on road traffic accident statistics produced and published by the Road Safety Cell.
The Road Safety Cell (RSC) and the Police have been working closely together to safeguard the
integrity of the database and promote its statistical accuracy. It is widely recognised by road safety
practitioners in Bangladesh, including the RSC and the Police, that a Road Traffic Accident database is
neither complete nor entirely an accurate record of all road accidents committed over the period 2004 in
Bangladesh. The RSC and the police are continuing to address this issue through their different training
programmes to keep it under control.
Previous reports have included commentary on some aspects on road safety in Bangladesh in addition
to the standard statistical reporting as described above. In this edition, a safety profile of National
Highway Road Network is presented. This profile reports the rate of fatal accident occurrences and
other safety parameters for various links on the several national highways, which forms the principal
road network in Bangladesh. In addition, an extra 4(four) tables are added on casualties within Dhaka
Metropolitan Area. This will help researchers compare safety condition prevailing in Dhaka with other
mega cities of the world.
These valued records containing information on National Road Traffic Accident (RTA) has started
coming to light with the inception of Road Safety Cell (RSC) in 2001.This report is a database that
different research organisations and scholars can use to contribute in the field of accident management.
RSC believes that this endeavour will be effective provided it helps formulate policies to abate the rate
of accident fatalities in Bangladesh.

Road Safety Cell, BRTA RTA Annual Report 2004
Page 4
2 THE ROAD TRAFFIC ACCIDENT DATABASE
2.1 DATA COLLECTION
Road accident data is reported by Police working at the Thana level in an Accident Reporting Form
(ARF) which was introduced nation-wide in 1997. This form, which is written in Bangla and
published by the Government of Bangladesh, is a mandatory part of the investigation First
Information Report (FIR) completed by the Investigating Officer for each road accident case.
Completed ARFs are compiled at the Accident Data Units (ADUs) in six Ranges and four
Metropolitan Police offices (Dhaka Metro, Dhaka Range, Chittagong Metro, Chittagong Range,
Rajshahi Metro, Rajshahi Range, Khulna Metro, Khulna Range, Sylhet Range and Barisal Range)
where the data is entered into an electronic database. The software used to compile (and later
interrogate) the database is known as MAAP (for Micro-computer Accident Analysis Package,
developed and produced by TRL, UK) and the database is commonly referred to as the MAAP data.
From these regional ADUs, the accident data is transferred by computer diskette (floppy disk) to the
National ADU at Police Headquarters, Dhaka. The Road Safety Cell collects this data from the
Police Headquarters and enters it into its own master database.
The MAAP software, which is used to compile and interrogate the electronic accident database,
resides on the computers in each of the Police Range and Metro ADUs, the ADU at Police
Headquarters and at the RSC Resource Centre. The software is a DOS-based version.
2.2 REPORTING
This Report, the National Road Traffic Accident (RTA) Report 2004, is the fourth annual report
produced by the Road Safety Cell. The previous reports set the standard for annual RTA reporting
with full and comprehensive tabulation of national statistics for casualty road accidents and for
casualties (fatalities and injured persons).
As with the previous reports, the annual report for 2004 presents data on the following:
• Casualty Accidents
− by Divisions and Cities
− by type of collision
− by type of junction
− by type of vehicle involved

Road Safety Cell, BRTA RTA Annual Report 2004
Page 5
• Casualties
− by Divisions and Cities
− fatalities by age and road user group
− passenger fatalities by age and sex
− pedestrian fatalities by age and sex
The cities reported herein are Chittagong, Dhaka, Khulna and Rajshahi. RTA data for the cities of
Sylhet and Barisal is not separately reported herein as, in the database, the data for these two cities
is not fully differentiated from that of the districts. The RTA data for these two cities is included with
the data for their respective Divisions.
Additionally, a safety profile which reports the rate of fatal accident occurrence for various links on
the National Highway road network is presented. This analysis enables links to be ranked according
to their safety performance which can provide a criteria for determining a road reconstruction and
development programme and a criteria for prioritising and selection of road sections for road safety
improvement.
2.3 INTERPRETATION OF DATA
For targeting road safety improvement initiatives, interpretation of the accident data presented herein
to either establish accident profiles or compare accident rates by District, Division or City can be
undertaken with a measured degree of confidence. Caution is advised however when making
comparisons of safety performance with that of other countries or when endeavouring to determine
an absolute value of total accident occurrence.

Road Safety Cell, BRTA RTA Annual Report 2004
Page 6
3 CASUALTY ACCIDENTS
Table 3-1 : Recorded Casualty Accidents by Division and City
number of accidents 1 population2 accident rates severity (no. per 10,000 pop'n) Division or City
fatal grievous simple injurytotal
('000,000) fatal
accidents fatal + injury
accidents Divisions, excluding Cities Barisal 67 14 7 88 8.478 0.079 0.104 Chittagong 489 109 51 649 21.734 0.225 0.299 Sylhet 195 40 10 245 8.256 0.236 0.297 Dhaka 766 186 53 1005 34.800 0.220 0.289 Khulna 108 17 4 129 14.313 0.075 0.090 Rajshahi 369 96 45 510 30.944 0.119 0.165 total 1994 462 170 2626 118.524 0.168 0.222 Cities Chittagong City 44 10 9 63 3.347 0.131 0.188 Dhaka City 366 181 25 572 5.620 0.651 1.018 Khulna City 9 1 3 13 0.808 0.111 0.161 Rajshahi City 34 10 4 48 0.401 0.848 1.197 total 453 202 41 696 10.176 0.445 0.684 TOTAL 2447 664 211 3322 128.7 0.190 0.258
Notes: 1. This is the recorded number of accidents involving casualties (fatal and injury). Property damage only accidents are not included.
2. Year 2004 populations are derived from statistics published in the 2000 Statistical Yearbook and the Population Census 2001 Preliminary Report.
Figure 3-1 : Casualty Accident Rate by Division and City
0.00
0.20
0.40
0.60
0.80
1.00
1.20
Cas
ualty
acc
iden
ts p
er
10,0
00 p
op'n
Barisal Chittagong Sylhet Dhaka Khulna Rajshahi ChittagongCity
Dhaka City KhulnaCity
RajshahiCity
Divisions (excluding Cities) and Cities

Road Safety Cell, BRTA RTA Annual Report 2004
Page 7
Table 3-2 : Change in Recorded Casualty Accidents, 1999 - 2004
number of accidents 1 population2 accident rates severity (no. per 10,000 pop'n) year
fatal grievous simple injurytotal
('000,000) fatal
accidents fatal + injury
accidents Divisions, excluding the Cities
1999 1984 595 170 2749 110.057 0.180 0.250 2000 2129 579 160 2868 111.735 0.191 0.257 2001 1688 407 117 2212 113.414 0.149 0.195 2002 2087 557 158 2802 115.092 0.181 0.243 2003 2241 602 183 3026 115.092 0.195 0.263 2004 1994 462 170 2626 118.524 0.168 0.222
Cities 3 1999 448 391 134 973 9.449 0.474 1.030 2000 394 450 49 893 9.593 0.411 0.931 2001 341 235 20 596 9.738 0.350 0.612 2002 512 347 42 901 9.882 0.518 0.912 2003 511 319 56 886 9.882 0.517 0.897 2004 453 202 41 696 10.1764 0.445 0.684
Bangladesh 1999 2432 986 304 3722 119.506 0.204 0.311 2000 2523 1029 209 3761 121.328 0.208 0.310 2001 2029 642 137 2808 123.152 0.165 0.228 2002 2599 904 200 3703 123.152 0.211 0.301 2003 2752 921 239 3912 124.974 0.712 1.159 2004 2447 664 211 3322 128.7 0.613 0.905
Notes: 1. This is the recorded number of accidents involving casualties (fatal and injury). Property damage only accidents are not included.
2. Year 2004 populations are derived from statistics published in the 2000 Statistical Yearbook and the Population Census 2001 Preliminary Report.
3. Cities are Chittagong, Dhaka, Khulna and Rajshahi.
Figure 3-2 : Casualty Accident Rate, 1999 - 2004
0.00
0.20
0.40
0.60
0.80
1.00
1.20
Acc
iden
t rat
e (C
asua
lty a
ccid
ents
per
10
,000
pop
'n)
Divisions (excluding Cities) Cities Bangladesh
199920002001200220032004

Road Safety Cell, BRTA RTA Annual Report 2004
Page 8
Table 3-3 : Recorded Casualty Accidents by District (Zilla)
number of accidents 1 population2 accident rates severity ('000,000) (no. per 10,000 pop'n)
Division and
District fatal grievous simple injurytotal
grievous simple injuryBarisal Division Barguna 8 0 1 9 0.876 0.091 0.103 Barisal 17 7 2 26 2.436 0.070 0.107 Bhola 17 1 2 20 1.752 0.097 0.114 Jhalakati 7 0 0 7 0.727 0.096 0.096 Patuakhali 14 6 2 22 1.509 0.093 0.146 Pirojpur 4 0 0 4 1.177 0.034 0.034 Total 67 14 7 88 8.478 0.079 0.104 Chittagong Division Bandarban 6 4 3 13 0.306 0.196 0.425 Brahmanbaria 28 11 3 42 2.472 0.113 0.170 Chandpur 26 10 1 37 2.310 0.113 0.160 Chittagong District 106 13 11 130 3.493 0.303 0.372 Chittagong City 44 10 9 63 3.347 0.131 0.188 Comilla 125 28 12 165 4.794 0.261 0.344 Cox's Bazar 42 6 1 49 1.837 0.229 0.267 Feni 72 29 14 115 1.250 0.576 0.920 Khagrachhari 12 1 0 13 0.549 0.219 0.237 Lakshmipur 31 4 2 37 1.546 0.201 0.239 Noakhali 33 1 1 35 2.648 0.125 0.132 Rangamati 8 2 3 13 0.530 0.151 0.245 Total 533 119 60 712 25.081 0.213 0.284 Dhaka Division Dhaka District 56 17 3 76 3.342 0.168 0.227 Dhaka City 289 162 23 474 5.620 0.514 0.843 Faridpur 66 13 4 83 1.797 0.367 0.462 Gazipur 56 5 3 64 2.118 0.264 0.302 Gopalganj 33 8 1 42 1.183 0.279 0.355 Jamalpur 8 0 1 9 2.184 0.037 0.041 Kishoreganj 53 20 1 74 2.639 0.201 0.280 Madaripur 12 1 0 13 1.188 0.101 0.109 Manikganj 51 19 6 76 1.332 0.383 0.570 Munshiganj 53 11 4 68 1.352 0.392 0.503 Mymensingh 80 24 0 104 4.639 0.172 0.224 Narayanganj 101 31 16 148 2.235 0.452 0.662 Narsingdi 66 19 4 89 1.977 0.334 0.450 Netrokona 19 1 1 21 2.025 0.094 0.104 Rajbari 36 4 4 44 0.983 0.366 0.448 Shariatpur 8 2 3 13 1.105 0.072 0.118 Sherpur 25 5 1 31 1.303 0.192 0.238 Tangail 43 6 1 50 3.401 0.126 0.147 Total 1055 348 76 1479 40.421 0.261 0.366
Table 3-3 continued on next page

Road Safety Cell, BRTA RTA Annual Report 2004
Page 9
Table 3-3, continued
number of accidents 1 population2 accident rates severity (no. per 10,000 pop'n)
Division and
District fatal grievous simple injurytotal
('000,000) grievous simple injury
Sylhet Division Hobiganj 49 6 2 57 1.837 0.267 0.310 Moulavibazar 27 7 0 34 1.676 0.161 0.203 Sunamganj 19 4 0 23 2.057 0.092 0.112 Sylhet 100 23 8 131 2.686 0.372 0.488 Total 195 40 10 245 8.256 0.236 0.297 Khulna Division Bagerhat 8 0 0 8 1.584 0.051 0.051 Chaudanga 0 0 0 0 1.032 0.000 0.000 Jessore 35 3 0 38 2.551 0.137 0.149 Jhenaidah 30 2 1 33 1.625 0.185 0.203 Khulna District 10 3 3 16 1.631 0.061 0.098 Khulna City 9 1 3 13 0.808 0.111 0.161 Kushtia 2 0 0 2 1.790 0.011 0.011 Magura 14 7 0 21 0.848 0.165 0.248 Maherpur 6 1 0 7 0.606 0.099 0.116 Narail 3 0 0 3 0.720 0.042 0.042 Satkhira 0 1 0 1 1.926 0.000 0.005 Total 117 18 7 142 15.121 0.077 0.094 Rajshahi Division Bogra 26 8 4 38 3.123 0.083 0.122 Dinajpur 31 5 7 43 2.736 0.113 0.157 Gaibandha 19 8 1 28 2.213 0.086 0.127 Joypurhat 10 1 1 12 0.883 0.113 0.136 Kurigram 25 2 0 27 1.863 0.134 0.145 Lalmonirhat 23 3 1 27 1.138 0.202 0.237 Natore 18 21 2 41 2.484 0.072 0.165 Nawabganj 10 7 0 17 1.590 0.063 0.107 Nilphamari 9 1 2 12 1.484 0.061 0.081 Naogaon 5 0 0 5 1.621 0.031 0.031 Pabhna 48 7 6 61 2.251 0.213 0.271 Panchgarh 12 0 2 14 0.867 0.138 0.162 Rajshahi District 49 12 2 63 1.963 0.250 0.321 Rajshahi City 34 10 4 48 0.401 0.848 1.197 Rangpur 34 11 10 55 2.649 0.128 0.208 Sirajganj 35 6 7 48 2.829 0.124 0.170 Thakurgaon 15 4 0 19 1.250 0.120 0.152 Total 403 106 49 558 31.344 0.129 0.178 TOTAL 2447 664 211 3322 128.70 0.190 0.258

Road Safety Cell, BRTA RTA Annual Report 2004
Page 10
4 CASUALTY ACCIDENTS BY TYPE OF COLLISION.
Table 4-1 : Recorded Casualty Accidents by Type of Collision
Table 4-1 (a) : Fatal Accidents
number of accidents road environment road class collision type
urban rural total national regional feeder rural road city total
Head on 50 285 335 225 38 46 10 17 336 Rear end 69 187 256 133 30 32 12 50 257 Right angle 7 5 12 5 0 1 0 6 12 Side swipe 26 88 114 72 13 11 9 11 116 Overturned vehicle 25 180 205 113 32 37 15 10 207 Hit object in road 4 12 16 5 4 3 1 4 17 Hit object off road 3 33 36 20 8 4 3 1 36 Hit parked vehicle 6 26 32 17 4 4 3 4 32 Hit pedestrian 411 901 1312 545 167 210 88 319 1329 Hit animal 0 0 0 0 0 0 0 0 0 Other 31 59 90 28 7 17 14 26 92 Unknown 13 26 39 4 2 1 3 3 13 TOTAL 645 1802 2447 1167 305 366 158 451 2447 % total 26% 74% 100% 48% 12% 15% 6% 18% 100% Note: Collision type is the primary accident event.
Figure 4-1 : Fatal Accidents by Type of Collision and Road Class
0
100
200
300
400
500
600
Num
ber o
f Fat
al A
ccid
ents
Hea
d on
Rea
r end
Rig
ht a
ngle
Side
sw
ipe
Ove
rturn
edve
hicl
e
Hit
obje
ct in
road
Hit
obje
ct o
ffro
ad
Hit
park
edve
hicl
e
Hit
pede
stria
n
Hit
anim
al
Oth
er
Unk
now
n
Type of Collision
national highwayregional highway feeder road rural road city road

Road Safety Cell, BRTA RTA Annual Report 2004
Page 11
Table 4-1 (b) : Grievous and Simple Injury Accidents
number of accidents road environment road class collision type
urban rural total national regional feeder rural road city total
Head on 31 144 175 118 21 16 8 14 177 Rear end 97 82 179 61 21 13 4 82 181 Right angle 9 3 12 3 0 1 0 8 12 Side swipe 21 47 68 45 11 8 0 8 72 Overturned vehicle 4 55 59 32 7 15 5 1 60 Hit object in road 1 9 10 7 0 1 1 1 10 Hit object off road 5 24 29 21 4 3 0 2 30 Hit parked vehicle 11 16 27 18 1 0 1 7 27 Hit pedestrian 121 121 242 76 24 33 13 99 245 Hit animal 0 0 0 0 0 0 0 0 0 Other 26 31 57 20 9 3 1 25 58 Unknown 7 10 17 3 0 0 0 0 3 TOTAL 333 542 875 404 98 93 33 247 875 % total 38% 62% 100% 46% 11% 11% 4% 28% 100%
Table 4-1 (c) : Total Casualty Accidents
number of accidents road environment road class collision type
urban rural total national regional feeder rural road city total
Head on 81 429 510 343 59 62 18 31 513 Rear end 166 269 435 194 51 45 16 132 438 Right angle 16 8 24 8 0 2 0 14 24 Side swipe 47 135 182 117 24 19 9 19 188 Overturned vehicle 29 235 264 145 39 52 20 11 267 Hit object in road 5 21 26 12 4 4 2 5 27 Hit object off road 8 57 65 41 12 7 3 3 66 Hit parked vehicle 17 42 59 35 5 4 4 11 59 Hit pedestrian 532 1022 1554 621 191 243 101 418 1574 Hit animal 0 0 0 0 0 0 0 0 0 Other 57 90 147 48 16 20 15 51 150 Unknown 20 36 56 7 2 1 3 3 16 TOTAL 978 2344 3322 1571 403 459 191 698 3322 % total 29% 71% 100% 47% 12% 14% 6% 21% 100%

Road Safety Cell, BRTA RTA Annual Report 2004
Page 12
Table 4-1(d) : Recorded Casualty Accidents by time
Table 4-1(d1) : Fatal Accidents
number of accidents road environment road class time
urban rural total national regional feeder rural road city total
0/01 33 113 146 92 33 44 21 51 241 02/03 27 54 81 113 43 38 12 28 234 04/05 43 74 117 100 23 44 20 41 228 06/07 67 139 206 86 24 35 10 40 195 08/09 72 201 273 110 32 32 9 38 221 10/11 80 283 363 101 29 25 10 32 197 12/13 59 248 307 97 18 33 14 39 201 14/15 45 184 229 97 20 19 10 39 185 16/17 66 198 264 85 21 29 5 35 175 18/19 54 127 181 102 22 24 5 30 183 20/21 42 95 137 89 18 25 18 29 179 22/24 41 47 88 94 20 17 21 46 198 Unknown 34 21 55 2 2 3 2 1 10 TOTAL 663 1784 2447 1168 305 368 157 449 2447 % total 27% 73% 100% 48% 12% 15% 6% 18% 100%
Table 4-1(d2) : Grievous and Simple Injury Accidents
number of accidents road environment road class time
urban rural total national regional feeder rural road city total
0/01 27 47 74 48 4 5 1 18 76 02/03 8 17 25 19 0 0 0 6 25 04/05 12 11 23 12 2 0 1 9 24 06/07 26 40 66 37 5 5 2 18 67 08/09 32 66 98 40 16 9 6 27 98 10/11 53 73 126 59 13 15 5 39 131 12/13 37 66 103 42 19 11 2 29 103 14/15 30 60 90 38 12 13 3 24 90 16/17 35 57 92 40 13 13 4 24 94 18/19 22 38 60 26 6 8 4 17 61 20/21 26 42 68 29 6 11 4 19 69 22/24 18 15 33 12 2 2 1 17 34 Unknown 9 8 17 1 1 0 0 1 3 TOTAL 335 540 875 403 99 92 33 248 875 % total 38% 62% 100% 46% 11% 11% 4% 28% 100%

Road Safety Cell, BRTA RTA Annual Report 2004
Page 13
Table 4-1(d3) : Total Casualty Accidents
number of accidents road environment road class time
urban rural total national regional feeder rural road city total
0/01 60 160 220 140 37 49 22 69 317 02/03 35 71 106 132 43 38 12 34 259 04/05 55 85 140 112 25 44 21 50 252 06/07 93 179 272 123 29 40 12 58 262 08/09 104 267 371 150 48 41 15 65 319 10/11 133 356 489 160 42 40 15 71 328 12/13 96 314 410 139 37 44 16 68 304 14/15 75 244 319 135 32 32 13 63 275 16/17 101 255 356 125 34 42 9 59 269 18/19 76 165 241 128 28 32 9 47 244 20/21 68 137 205 118 24 36 22 48 248 22/24 59 62 121 106 22 19 22 63 232 Unknown 43 29 72 3 3 3 2 2 13 TOTAL 998 2324 3322 1571 404 460 190 697 3322 % total 30% 70% 100% 47% 12% 14% 6% 21% 100%
Figure 4-2 : Accidents by Time
0
20
40
60
80
100
120
140
160
No.
of A
ccid
ent
1-2 3-4 5-6 7-8 9-10 11-12 13-14 15-16 17-18 19-20 21-22 23-24
Time
National Regional Feeder Rural road City

Road Safety Cell, BRTA RTA Annual Report 2004
Page 14
Table 4-1(e) : Recorded Casualty Accidents by Working Day
Table 4-1(e1) (a) : Fatal Accidents
number of accidents road environment road class Day in a week
urban rural total national regional feeder rural road city total
Monday 92 249 166 166 41 48 32 60 347 Tuesday 117 257 175 175 42 54 23 81 375 Wednesday 80 246 160 160 33 50 29 58 330 Thursday 81 255 174 174 36 57 17 57 341 Friday 94 285 182 182 53 56 19 73 383 Saturday 78 265 157 157 57 53 23 57 347 Sunday 90 222 152 152 41 47 12 62 314 Unknown 12 24 36 2 1 2 2 3 10 TOTAL 644 1803 2447 1168 304 367 157 451 2447 % total 26% 74% 100% 48% 12% 15% 6% 18% 100%
Table 4-1( e2 : Grievous and Simple Injury Accidents
number of accidents road environment road class Day in a week
urban rural total national regional feeder rural road city total
Monday 48 80 128 53 21 15 4 36 129 Tuesday 48 83 131 58 11 21 6 36 132 Wednesday 43 76 119 49 14 18 7 33 121 Thursday 37 88 125 64 15 12 9 28 128 Friday 61 97 158 87 12 11 5 46 161 Saturday 42 52 94 50 9 7 0 30 96 Sunday 47 59 106 43 16 9 2 38 108 Unknown 4 10 14 0 0 0 0 0 0 TOTAL 330 545 875 404 98 93 33 247 875 % total 38% 62% 100% 46% 11% 11% 4% 28% 100%
Table 4-1(e3) : Total Casualty Accidents
number of accidents road environment road class Day in a week
urban rural total national regional feeder rural road city total
Monday 140 329 469 219 62 63 36 96 476 Tuesday 165 340 505 233 53 75 29 117 507 Wednesday 123 322 445 209 47 68 36 91 451 Thursday 118 343 461 238 51 69 26 85 469 Friday 155 382 537 269 65 67 24 119 544 Saturday 120 317 437 207 66 60 23 87 443 Sunday 137 281 418 195 57 56 14 100 422 Unknown 16 34 50 2 1 2 2 3 10 TOTAL 974 2348 3322 1572 402 460 190 698 3322 % total 29% 71% 100% 47% 12% 14% 6% 21% 100%

Road Safety Cell, BRTA RTA Annual Report 2004
Page 15
Table 4-1(f): Recorded Casualty Accidents by Month
Table 4-1(f1) : Fatal Accidents
number of accidents road environment road class collision type
urban rural total national regional feeder rural road city total
January 66 172 238 92 33 44 21 51 241 February 48 182 230 113 43 38 12 28 234 March 66 161 227 100 23 44 20 41 228 April 52 139 191 86 24 35 10 40 195 May 59 157 216 110 32 32 9 38 221 June 47 147 194 101 29 25 10 32 197 July 53 148 201 97 18 33 14 39 201 August 54 130 184 97 20 19 10 39 185 September 46 128 174 85 21 29 5 35 175 October 44 138 182 102 22 24 5 30 183 November 43 133 176 89 18 25 18 29 179 December 54 144 198 94 20 17 21 46 198 Unknown 10 26 36 2 3 2 2 1 10 TOTAL 642 1805 2447 1168 306 367 157 449 2447 % total 26% 74% 100% 48% 13% 15% 6% 18% 100% Note: Collision type is the primary accident event.
Table 4-1(f2) : Grievous and Simple Injury Accidents
number of accidents road environment road class collision type
urban rural total national regional feeder rural road city total
January 31 73 104 48 9 16 4 27 104 February 29 49 78 32 15 10 2 20 79 March 31 55 86 38 11 10 0 28 87 April 28 45 73 31 11 9 4 19 74 May 19 35 54 30 4 7 1 15 57 June 33 50 83 38 9 7 6 26 86 July 34 44 78 38 6 8 2 27 81 August 26 34 60 34 3 2 3 19 61 September 14 34 48 26 4 8 1 9 48 October 23 49 72 32 14 5 3 18 72 November 28 39 67 32 7 6 3 20 68 December 30 28 58 25 5 5 4 19 58 Unknown 6 8 14 0 0 0 0 0 0 TOTAL 332 543 875 404 98 93 33 247 875 % total 38% 62% 100% 46% 11% 11% 4% 28% 100%

Road Safety Cell, BRTA RTA Annual Report 2004
Page 16
Table 4-1(f3) : Total Casualty Accidents
number of accidents road environment road class collision type
urban rural total national regional feeder rural road city total
January 97 245 342 140 42 60 25 78 345 February 77 231 308 145 58 48 14 48 313 March 97 216 313 138 34 54 20 69 315 April 80 184 264 117 35 44 14 59 269 May 78 192 270 140 36 39 10 53 278 June 80 197 277 139 38 32 16 58 283 July 87 192 279 135 24 41 16 66 282 August 80 164 244 131 23 21 13 58 246 September 60 162 222 111 25 37 6 44 223 October 67 187 254 134 36 29 8 48 255 November 71 172 243 121 25 31 21 49 247 December 84 172 256 119 25 22 25 65 256 Unknown 16 34 50 2 3 2 2 1 10 TOTAL 974 2348 3322 1572 404 460 190 696 3322 % total 29% 71% 100% 47% 12% 14% 6% 21% 100%
Figure 4-3 : Total Accidents by Month
0
20
40
60
80
100
120
140
160
No.
of A
ccid
ent
January February March April May June July August September October November December
Month
National Regional Feeder Rural road City

Road Safety Cell, BRTA RTA Annual Report 2004
Page 17
Table 4-2 : Recorded Fatal Accidents by Type of Collision by Division and City
number of fatal accidents collision type
Division or City
Hea
d on
Rea
r en
d
Rig
ht
angl
e
Sid
e sw
ipe
Ove
r-tu
rned
ve
hicl
e H
it ob
ject
in
road
H
it ob
ject
of
f roa
d H
it pa
rked
ve
hicl
e H
it pe
des-
trian
Hit
anim
al
Oth
er
Un-
know
n total
Divisions, excluding Cities Barisal 7 4 0 1 9 0 3 3 36 0 4 0 67 Chittagong 101 37 1 31 44 7 10 10 223 0 21 4 489 Sylhet 27 16 1 9 21 2 4 3 104 0 8 0 195 Dhaka 106 92 2 17 82 3 7 6 434 0 17 0 766 Khulna 10 13 1 7 7 1 3 3 62 0 1 0 108 Rajshahi 59 47 2 38 33 0 8 3 166 0 13 0 369 total 310 209 7 103 196 13 35 28 1025 0 64 4 1994 Chittagong City 7 7 0 4 1 2 0 1 20 0 2 0 44 Dhaka City 7 38 5 4 10 1 0 3 275 0 23 0 366 Khulna City 0 1 0 1 0 0 1 0 5 0 1 0 9 Rajshahi City 13 3 0 6 1 1 0 0 8 0 2 0 34 total 27 49 5 15 12 4 1 4 308 0 28 0 453 TOTAL 337 258 12 118 208 17 36 32 1333 0 92 4 2447
Table 4-3 : Recorded Fatal Accidents by Type of Collision by Division and City as percentage of total fatal accidents in Division or City
% of fatal accidents in Division or City collision type
Division or City total
Hea
d on
Rea
r en
d
Rig
ht
angl
e
Sid
e sw
ipe
Ove
r-tu
rned
ve
hicl
e H
it ob
ject
in
road
H
it ob
ject
of
f roa
d H
it pa
rked
ve
hicl
e H
it pe
des-
trian
Hit
anim
al
Oth
er
Un-
know
n
Divisions, excluding Cities Barisal 67 10% 6% 0% 1% 13% 0% 4% 4% 54% 0% 6% 0% Chittagong 489 21% 8% 0% 6% 9% 1% 2% 2% 46% 0% 4% 1% Sylhet 195 14% 8% 1% 5% 11% 1% 2% 2% 53% 0% 4% 0% Dhaka 766 14% 12% 0% 2% 11% 0% 1% 1% 57% 0% 2% 0% Khulna 108 9% 12% 1% 6% 6% 1% 3% 3% 57% 0% 1% 0% Rajshahi 369 16% 13% 1% 10% 9% 0% 2% 1% 45% 0% 4% 0% total 1994 16% 10% 0% 5% 10% 1% 2% 1% 51% 0% 3% 0% Cities Chittagong City 44 16% 16% 0% 9% 2% 5% 0% 2% 45% 0% 5% 0% Dhaka City 366 2% 10% 1% 1% 3% 0% 0% 1% 75% 0% 6% 0% Khulna City 9 0% 11% 0% 11% 0% 0% 11% 0% 56% 0% 11% 0% Rajshahi City 34 38% 9% 0% 18% 3% 3% 0% 0% 24% 0% 6% 0% total 453 6% 11% 1% 3% 3% 1% 0% 1% 68% 0% 6% 0% TOTAL 2447 14% 11% 0% 5% 9% 1% 1% 1% 54% 0% 4% 0%

Road Safety Cell, BRTA RTA Annual Report 2004
Page 18
Table 4-4 : Change in Recorded Fatal Accidents by Type of Collision, 1999 - 2004
number of fatal accidents collision type
year H
ead
on
Rea
r end
Rig
ht
angl
e
Side
sw
ipe
Ove
rturn
ed
vehi
cle
Hit
obje
ct
in ro
ad
Hit
obje
ct
off r
oad
Hit
park
ed
vehi
cle
Hit
pede
stria
n
Hit
anim
al
Oth
er
Unk
now
n
total
Divisions, excluding Cities 1999 262 197 6 94 232 11 50 39 994 0 97 2 1984 2000 274 253 11 78 226 6 46 36 1074 3 122 0 2129 2001 207 187 4 69 211 14 31 37 834 1 92 1 1688 2002 307 235 29 109 248 36 65 76 917 24 110 24 2180 2003 329 248 7 106 265 14 53 61 1060 0 93 4 2240 2004 310 209 7 103 196 13 35 28 1025 0 64 4 1994
Cities 1
1999 26 71 4 19 12 1 2 1 302 0 10 0 448 2000 22 76 3 8 9 4 4 1 255 0 12 0 394 2001 25 66 10 1 14 1 5 0 211 0 8 0 341 2002 26 70 9 12 10 1 3 7 353 0 19 0 510 2003 28 66 5 10 9 0 5 6 363 0 20 0 512 2004 27 49 5 15 12 4 1 4 308 0 28 0 453
Bangladesh 1999 288 268 10 113 244 12 52 40 1296 0 107 2 2432 2000 296 329 14 86 235 10 50 37 1329 3 134 0 2523 2001 232 253 14 70 225 15 36 37 1045 1 100 1 2029 2002 333 305 38 121 258 37 68 83 1270 24 129 24 2690 2003 357 314 12 116 274 14 58 67 1423 0 113 4 2752 2004 337 258 12 118 208 17 36 32 1333 0 92 4 2447
1. Cities are Chittagong, Dhaka, Khulna and Rajshahi.
Table 4-5 : Fatality Rate by Type of Collision
collision type number of fatalities
number of fatal accidents fatality index
Head on 600 337 1.78 Rear end 318 258 1.23 Right angle 15 12 1.25 Side swipe 172 118 1.46 Overturned vehicle 380 208 1.83 Hit object in road 19 17 1.12 Hit object off road 58 36 1.61 Hit parked vehicle 41 32 1.28 Hit pedestrian 1369 1333 1.03 Hit animal 0 0 0 Other 100 92 1.09
Note: fatality index = no. fatalities / no. fatal accidents

Road Safety Cell, BRTA RTA Annual Report 2004
Page 19
Table 4-6 : Recorded Fatal Accidents by Type of Collision by District (Zilla)
number of fatal accidents collision type
Division and District
Hea
d on
Rea
r end
Rig
ht
angl
e
Side
sw
ipe
Ove
rturn
ed
vehi
cle
Hit
obje
ct
in ro
ad
Hit
obje
ct
off r
oad
Hit
park
ed
vehi
cle
Hit
pede
stria
n
Hit
anim
al
Oth
er
Unk
now
n total
Barisal Division Barguna 0 0 0 0 2 0 1 0 5 0 0 0 8 Barisal 2 2 0 0 1 0 1 2 9 0 0 0 17 Bhola 2 1 0 1 2 0 0 0 11 0 0 0 17 Jhalakati 1 0 0 0 2 0 0 0 4 0 0 0 7 Patuakhali 2 1 0 0 1 0 0 1 5 0 4 0 14 Pirojpur 0 0 0 0 1 0 1 0 2 0 0 0 4 Total 7 4 0 1 9 0 3 3 36 0 4 0 67 Chittagong Division Bandarban 1 1 0 1 2 0 0 0 1 0 0 0 6 Brahmanbaria 2 2 0 2 2 1 0 0 18 0 0 1 28 Chandpur 2 3 0 4 1 0 0 1 13 0 2 0 26 Chittagong District 29 8 0 4 10 0 0 4 50 0 1 0 106 Chittagong City 7 7 0 4 1 2 0 1 20 0 2 0 44 Comilla 36 9 1 9 10 1 6 4 40 0 7 2 125 Cox's Bazar 7 2 0 4 1 0 2 0 25 0 1 0 42 Feni 14 6 0 4 7 1 1 1 36 0 1 1 72 Khagrachhari 0 0 0 1 5 0 0 0 4 0 2 0 12 Lakshmipur 4 2 0 1 1 4 1 0 16 0 2 0 31 Noakhali 6 4 0 1 3 0 0 0 16 0 3 0 33 Rangamati 0 0 0 0 2 0 0 0 4 0 2 0 8 Total 108 44 1 35 45 9 10 11 243 0 23 4 533 Dhaka Division Dhaka District 9 10 0 0 5 0 0 0 32 0 0 0 56 Dhaka City 7 38 5 4 10 1 0 3 275 0 23 0 366 Faridpur 10 13 0 1 11 0 0 0 31 0 0 0 66 Gazipur 6 4 1 0 4 0 0 0 41 0 0 0 56 Gopalganj 5 6 0 1 4 0 0 1 15 0 1 0 33 Jamalpur 0 0 0 0 2 1 0 0 5 0 0 0 8 Kishoreganj 3 5 0 1 3 0 0 0 40 0 1 0 53 Madaripur 1 6 0 0 0 0 0 0 5 0 0 0 12 Manikganj 8 4 0 0 9 0 1 2 26 0 1 0 51 Munshiganj 6 4 0 2 4 0 0 1 35 0 1 0 53 Mymensingh 9 4 0 2 10 0 1 0 50 0 4 0 80 Narayanganj 15 15 1 2 5 1 0 0 60 0 2 0 101 Narsingdi 11 5 0 2 7 1 2 2 33 0 3 0 66 Netrokona 4 1 0 1 1 0 1 0 10 0 1 0 19 Rajbari 5 6 0 2 3 0 1 0 17 0 2 0 36 Shariatpur 1 0 0 0 2 0 0 0 4 0 1 0 8 Sherpur 1 6 0 0 2 0 0 0 16 0 0 0 25 Tangail 12 3 0 3 10 0 1 0 14 0 0 0 43 Total 113 130 7 21 92 4 7 9 709 0 40 0 1132
Table 4-6 continued on next page

Road Safety Cell, BRTA RTA Annual Report 2004
Page 20
Table 4-6, continued
number of fatal accidents collision type
Division and District
Hea
d on
Rea
r end
Rig
ht
angl
e
Side
sw
ipe
Ove
rturn
ed
vehi
cle
Hit
obje
ct
in ro
ad
Hit
obje
ct
off r
oad
Hit
park
ed
vehi
cle
Hit
pede
stria
n
Hit
anim
al
Oth
er
Unk
now
n total
Sylhet Division Hobiganj 3 5 1 2 7 0 1 0 27 0 3 0 49 Moulavibazar 7 2 0 1 1 1 1 0 14 0 0 0 27 Sunamganj 4 1 0 0 1 0 2 0 10 0 1 0 19 Sylhet 13 8 0 6 12 1 0 3 53 0 4 0 100 Total 27 16 1 9 21 2 4 3 104 0 8 0 195 Khulna Division Bagerhat 0 2 0 0 0 1 1 0 4 0 0 0 8 Chaudanga 0 0 0 0 0 0 0 0 0 0 0 0 0 Jessore 5 5 0 1 0 0 1 2 21 0 0 0 35 Jhenaidah 3 1 0 3 4 0 1 1 16 0 1 0 30 Khulna District 1 1 0 2 1 0 0 0 5 0 0 0 10 Khulna City 0 1 0 1 0 0 1 0 5 0 1 0 9 Kushtia 0 0 0 0 0 0 0 0 2 0 0 0 2 Magura 0 1 1 1 1 0 0 0 10 0 0 0 14 Maherpur 0 2 0 0 1 0 0 0 3 0 0 0 6 Narail 1 1 0 0 0 0 0 0 1 0 0 0 3 Satkhira 0 0 0 0 0 0 0 0 0 0 0 0 0 Total 10 14 1 8 7 1 4 3 67 0 2 0 117 Rajshahi Division Bogra 8 4 0 3 3 0 1 1 5 0 1 0 26 Dinajpur 4 5 0 1 1 0 1 0 17 0 2 0 31 Gaibandha 4 4 0 2 1 0 2 0 6 0 0 0 19 Joypurhat 2 0 0 3 1 0 0 0 4 0 0 0 10 Kurigram 3 1 0 3 1 0 1 1 15 0 0 0 25 Lalmonirhat 3 4 0 2 1 0 0 0 11 0 2 0 23 Natore 1 4 0 1 1 0 0 0 11 0 0 0 18 Nawabganj 1 1 0 0 0 0 2 0 5 0 1 0 10 Nilphamari 3 0 0 1 0 0 0 0 4 0 1 0 9 Naogaon 1 0 0 0 0 0 1 0 3 0 0 0 5 Pabhna 9 5 1 3 6 0 0 0 23 0 1 0 48 Panchgarh 2 2 0 1 1 0 0 0 6 0 0 0 12 Rajshahi District 4 10 1 7 4 0 0 0 22 0 1 0 49 Rajshahi City 13 3 0 6 1 1 0 0 8 0 2 0 34 Rangpur 3 3 0 5 4 0 0 1 17 0 1 0 34 Sirajganj 6 3 0 5 8 0 0 0 12 0 1 0 35 Thakurgaon 5 1 0 1 1 0 0 0 5 0 2 0 15 Total 72 50 2 44 34 1 8 3 174 0 15 0 403 TOTAL 337 258 12 118 208 17 36 32 1333 0 92 4 2447

Road Safety Cell, BRTA RTA Annual Report 2004
Page 21
5 CASUALTY ACCIDENTS BY TYPE OF JUNCTION.
Table 5-1 : Recorded Casualty Accidents by Type of Junction
Table 5-1 (a) : Fatal Accidents
number of accidents road environment road class junction type
urban rural total national regional feeder rural road city total Not at junction 396 1365 1761 895 224 266 109 280 1774 Cross junction 42 42 84 39 9 9 2 25 84 Tee junction 65 92 157 58 19 23 6 52 158 Off-set tee junction 13 15 28 8 5 3 4 8 28 Roundabout 30 1 31 2 1 0 0 29 32 Railway crossing 1 4 5 2 0 1 1 1 5 Other 81 213 294 134 36 55 24 52 301 Unknown 40 47 87 28 10 10 8 9 65 TOTAL 668 1779 2447 1166 304 367 154 456 2447 % total 27% 73% 100% 48% 12% 15% 6% 19% 100%
Figure 5-1 : Fatal Accidents by Type of Junction and Road Class
0
100
200
300
400
500
600
700
800
900
Num
ber o
f Fat
al A
ccid
ents
Not
at j
unct
ion
Cro
ss ju
nctio
n
Tee
junc
tion
Off-
set t
eeju
nctio
n
Rou
ndab
out
Rai
lway
cro
ssin
g
Oth
er
Unk
now
n
Type of Junction
national highwayregional highway feeder road rural road city road

Road Safety Cell, BRTA RTA Annual Report 2004
Page 22
Table 5-1 (b) : Grievous and Simple Injury Accidents
number of accidents
road environment road class junction type
urban rural total national regional feeder rural road city total
Not at junction 161 422 583 317 72 67 20 116 592
Cross junction 25 9 34 10 2 2 0 20 34
Tee junction 58 20 78 20 2 5 3 48 78
Off-set tee junction 4 4 8 3 2 1 0 2 8
Roundabout 17 4 21 4 0 0 0 17 21
Railway crossing 2 2 4 0 2 0 0 2 4
Other 56 59 115 37 16 15 7 41 116
Unknown 10 22 32 13 4 1 2 2 22
TOTAL 333 542 875 404 100 91 32 248 875
% total 38% 62% 100% 46% 11% 10% 4% 28% 100%
Table 5-1 (c) : Total Casualty Accidents
number of accidents
road environment road class junction type
urban rural total national regional feeder rural road city total
Not at junction 557 1787 2344 1212 296 333 129 396 2366
Cross junction 67 51 118 49 11 11 2 45 118
Tee junction 123 112 235 78 21 28 9 100 236
Off-set tee junction 17 19 36 11 7 4 4 10 36
Roundabout 47 5 52 6 1 0 0 46 53
Railway crossing 3 6 9 2 2 1 1 3 9
Other 137 272 409 171 52 70 31 93 417
Unknown 50 69 119 41 14 11 10 11 87
TOTAL 1001 2321 3322 1570 404 458 186 704 3322
% total 30% 70% 100% 47% 12% 14% 6% 21% 100%

Road Safety Cell, BRTA RTA Annual Report 2004
Page 23
Table 5-2 : Recorded Fatal Accidents by Type of Junction and by Division and City
number of fatal accidents junction type
Division or City
Not
at
junc
tion
Cro
ss
junc
tion
Tee
junc
tion
Off-
set t
ee
junc
tion
Rou
ndab
out
Rai
lway
cr
ossi
ng
Oth
er
Unk
now
n
total
Divisions, excluding Cities Barisal 48 2 10 1 0 0 6 0 67 Chittagong 266 18 37 6 1 2 118 41 489 Sylhet 109 6 10 1 1 0 53 15 195 Dhaka 728 3 15 3 0 0 16 1 766 Khulna 83 5 9 2 1 0 8 0 108 Rajshahi 263 22 25 6 0 2 51 0 369 total 1497 56 106 19 3 4 252 57 1994 Cities Chittagong City 24 9 6 2 1 0 2 0 44 Dhaka City 241 14 42 4 27 1 36 1 366 Khulna City 4 0 0 1 1 0 3 0 9 Rajshahi City 12 5 4 2 0 0 11 0 34 total 281 28 52 9 29 1 52 1 453 TOTAL 1778 84 158 28 32 5 304 58 2447
Table 5-3 : Recorded Fatal Accidents by Type of Junction and by Division and City as percentage of total fatal accidents in Division or City
% of total fatal accidents in Division or City junction type
Division or City total fatal accidents
Not
at
junc
tion
Cro
ss
junc
tion
Tee
junc
tion
Off-
set t
ee
junc
tion
Rou
ndab
out
Rai
lway
cr
ossi
ng
Oth
er
Unk
now
n
Divisions, excluding Cities Barisal 67 72% 3% 15% 1% 0% 0% 9% 0% Chittagong 489 54% 4% 8% 1% 0% 0% 24% 8% Sylhet 195 56% 3% 5% 1% 1% 0% 27% 8% Dhaka 766 95% 0% 2% 0% 0% 0% 2% 0% Khulna 108 77% 5% 8% 2% 1% 0% 7% 0% Rajshahi 369 71% 6% 7% 2% 0% 1% 14% 0% total 1994 75% 3% 5% 1% 0% 0% 13% 3%
Chittagong City 44 55% 20% 14% 5% 2% 0% 5% 0% Dhaka City 366 66% 4% 11% 1% 7% 0% 10% 0% Khulna City 9 44% 0% 0% 11% 11% 0% 33% 0% Rajshahi City 34 35% 15% 12% 6% 0% 0% 32% 0% total 453 62% 6% 11% 2% 6% 0% 11% 0% TOTAL 2447 73% 3% 6% 1% 1% 0% 12% 2%

Road Safety Cell, BRTA RTA Annual Report 2004
Page 24
Table 5-4 : Change in Recorded Fatal Accidents by Type of Junction, 1999 - 2004
number of fatal accidents junction type total
year
Not
at
junc
tion
Cro
ss
junc
tion
Tee
junc
tion
Off-
set t
ee
junc
tion
Rou
ndab
out
Rai
lway
cr
ossi
ng
Oth
er
Unk
now
n
Divisions, excluding Cities 1999 1765 35 101 10 4 1 67 1 19842000 1858 37 112 33 1 0 87 1 21292001 1441 41 77 15 2 0 107 5 16882002 1833 49 71 12 4 0 112 6 20872003 1744 45 123 21 2 0 244 62 20872004 1497 56 106 19 3 4 252 57 1994
Cities 1
1999 296 49 70 3 23 0 6 1 448 2000 292 39 51 1 3 4 3 1 394 2001 254 22 38 2 7 2 14 2 341 2002 335 39 72 4 12 4 32 14 512 2003 336 41 45 5 16 3 59 6 511 2004 281 28 52 9 29 1 52 1 453
Bangladesh 1999 2061 84 171 13 27 1 73 2 24322000 2150 76 163 34 4 4 90 2 25232001 1695 63 115 17 9 2 121 7 20292002 2168 88 143 16 16 4 144 20 25992003 2080 86 168 26 18 3 303 68 25982004 1778 84 158 28 32 5 304 58 2447
1. Cities are Chittagong, Dhaka, Khulna and Rajshahi.
Table 5-5 : Fatality Rate by Type of Junction
junction type number of fatalities
number of fatal accidents fatality index
Not at junction 2249 1778 1.26 Cross junction 90 84 1.07 Tee junction 203 158 1.28 Off-set tee junction 32 28 1.14 Roundabout 34 32 1.06 Railway crossing 7 5 1.40 Other 379 301 1.26
Note: fatality index = no. fatalities / no. fatal accidents

Road Safety Cell, BRTA RTA Annual Report 2004
Page 25
Table 5-6 : Recorded Fatal Accidents by Type of Junction by District (Zilla)
number of fatal accidents junction type
Division and
District N
ot a
t ju
nctio
n
Cro
ss
junc
tion
Tee
junc
tion
Off-
set t
ee
junc
tion
Rou
ndab
out
Rai
lway
cr
ossi
ng
Oth
er
Unk
now
n
total
Barisal Division Barguna 5 1 1 0 0 0 1 0 8 Barisal 15 0 1 0 0 0 1 0 17 Bhola 10 0 4 1 0 0 2 0 17 Jhalakati 4 0 2 0 0 0 1 0 7 Patuakhali 11 1 2 0 0 0 0 0 14 Pirojpur 3 0 0 0 0 0 1 0 4 total 48 2 10 1 0 0 6 0 67 Chittagong Division Bandarban 4 0 0 0 0 0 2 0 6 Brahmanbaria 15 0 1 0 0 0 8 4 28 Chandpur 17 2 1 1 0 0 2 3 26 Chittagong District 55 5 12 0 0 1 19 14 106 Chittagong City 24 9 6 2 1 0 2 0 44 Comilla 68 3 11 1 0 0 35 7 125 Cox's Bazar 21 0 4 1 0 0 11 5 42 Feni 39 6 4 2 1 1 13 6 72 Khagrachhari 5 0 0 1 0 0 5 1 12 Lakshmipur 16 1 2 0 0 0 11 1 31 Noakhali 21 1 2 0 0 0 9 0 33 Rangamati 5 0 0 0 0 0 3 0 8 total 290 27 43 8 2 2 120 41 533 Dhaka Division Dhaka District 52 0 4 0 0 0 0 0 56 Dhaka City 241 14 42 4 27 1 36 1 366 Faridpur 66 0 0 0 0 0 0 0 66 Gazipur 54 0 1 0 0 0 1 0 56 Gopalganj 31 0 0 1 0 0 1 0 33 Jamalpur 6 0 0 0 0 0 2 0 8 Kishoreganj 50 0 1 0 0 0 1 1 53 Madaripur 12 0 0 0 0 0 0 0 12 Manikganj 43 1 3 0 0 0 4 0 51 Munshiganj 49 2 2 0 0 0 0 0 53 Mymensingh 79 0 1 0 0 0 0 0 80 Narayanganj 94 0 2 0 0 0 5 0 101 Narsingdi 66 0 0 0 0 0 0 0 66 Netrokona 18 0 0 0 0 0 1 0 19 Rajbari 32 0 1 2 0 0 1 0 36 Shariatpur 8 0 0 0 0 0 0 0 8 Sherpur 25 0 0 0 0 0 0 0 25 Tangail 43 0 0 0 0 0 0 0 43 total 969 17 57 7 27 1 52 2 1132
Table 5-6 continued on next page

Road Safety Cell, BRTA RTA Annual Report 2004
Page 26
Table 5-6, continued
number of fatal accidents junction type
Division and
District N
ot a
t ju
nctio
n
Cro
ss
junc
tion
Tee
junc
tion
Off-
set t
ee
junc
tion
Rou
ndab
out
Rai
lway
cr
ossi
ng
Oth
er
Unk
now
n
total
Sylhet Division Hobiganj 28 1 2 0 1 0 14 3 49 Moulavibazar 16 0 0 0 0 0 11 0 27 Sunamganj 10 0 1 1 0 0 4 3 19 Sylhet 55 5 7 0 0 0 24 9 100 total 109 6 10 1 1 0 53 15 195 Khulna Division Bagerhat 5 0 1 0 0 0 2 0 8 Chaudanga 0 0 0 0 0 0 0 0 0 Jessore 27 1 3 1 0 0 3 0 35 Jhenaidah 27 1 2 0 0 0 0 0 30 Khulna District 6 2 1 0 0 0 1 0 10 Khulna City 4 0 0 1 1 0 3 0 9 Kushtia 1 0 1 0 0 0 0 0 2 Magura 11 0 0 0 1 0 2 0 14 Maherpur 3 1 1 1 0 0 0 0 6 Narail 3 0 0 0 0 0 0 0 3 Satkhira 0 0 0 0 0 0 0 0 0 total 87 5 9 3 2 0 11 0 117 Rajshahi Division Bogra 14 1 3 1 0 0 7 0 26 Dinajpur 23 3 2 0 0 0 3 0 31 Gaibandha 17 0 1 0 0 0 1 0 19 Joypurhat 5 0 1 2 0 0 2 0 10 Kurigram 11 2 2 1 0 0 9 0 25 Lalmonirhat 19 0 2 0 0 0 2 0 23 Natore 16 2 0 0 0 0 0 0 18 Nawabganj 6 0 0 0 0 0 4 0 10 Nilphamari 8 1 0 0 0 0 0 0 9 Naogaon 3 1 1 0 0 0 0 0 5 Pabhna 35 5 5 1 0 0 2 0 48 Panchgarh 6 0 0 1 0 0 5 0 12 Rajshahi District 35 1 4 0 0 1 8 0 49 Rajshahi City 12 5 4 2 0 0 11 0 34 Rangpur 24 3 2 0 0 1 4 0 34 Sirajganj 32 2 1 0 0 0 0 0 35 Thakurgaon 9 1 1 0 0 0 4 0 15 total 275 27 29 8 0 2 62 0 403 TOTAL 1778 84 158 28 32 5 304 58 2447

Road Safety Cell, BRTA RTA Annual Report 2004
Page 27
6 TYPES OF VEHICLE INVOLVED IN CASUALTY ACCIDENTS
Table 6-1 : Number of Vehicles by Type involved in Recorded Casualty Accidents by Road Environment and Road Class
Table 6-1 (a) : Fatal Accidents
number of vehicles road environment road class vehicle type
vehicles per
accident urban rural total national regional feeder rural road city total Bicycle 0 3 3 2 0 0 1 0 3 Rickshaw 0 1 1 1 0 0 0 0 1 Push cart 0 1 1 0 1 0 0 0 1 Motor cycle 9 57 66 8 16 21 15 6 66 Baby taxi 4 17 21 2 3 8 6 2 21 Tempo 1 56 57 14 13 19 9 2 57 Microbus 23 46 69 34 3 10 7 16 70 Minibus 75 124 199 59 21 42 9 69 200 Bus 142 401 543 313 79 52 14 91 549 Car 28 13 41 11 0 2 1 27 41 Jeep 3 29 32 9 2 8 10 3 32 Pick-up 14 33 47 17 8 7 4 13 49 Truck 13 55 68 24 6 21 11 6 68 Heavy truck 91 255 346 167 49 53 20 65 354 Artic truck 8 1 9 2 0 0 0 7 9 Oil tanker 4 7 11 4 4 0 0 3 11 Tractor 4 25 29 3 4 12 10 0 29 Animal drawn 1 1 2 1 1 0 0 0 2 Other 51 44 95 18 11 16 7 45 97 Unknown
one
29 60 89 50 2 1 6 10 69 Bicycle 25 61 86 41 8 22 6 10 87 Rickshaw 47 84 131 56 16 15 5 39 131 Push cart 5 1 6 3 1 0 0 3 7 Motor cycle 17 69 86 49 14 11 7 6 87 Baby taxi 15 43 58 31 6 9 4 9 59 Tempo 8 54 62 31 14 12 3 3 63 Microbus 6 46 52 40 3 8 1 1 53 Minibus 32 66 98 47 9 20 1 21 98 Bus 46 271 317 222 37 28 8 25 320 Car 15 30 45 30 1 1 0 13 45 Jeep 0 12 12 8 2 1 1 0 12 Pick-up 6 24 30 21 4 3 0 3 31 Truck 3 35 38 23 3 8 1 3 38 Heavy truck 71 246 317 215 25 32 13 33 318 Artic. truck 5 7 12 6 0 1 0 5 12 Oil tanker 0 5 5 3 0 1 1 0 5 Tractor 1 17 18 8 4 3 4 0 19 Animal drawn 0 0 0 0 0 0 0 0 0 Other 16 43 59 26 9 7 3 14 59 Unknown
two
or m
ore
25 61 86 41 8 22 6 10 87

Road Safety Cell, BRTA RTA Annual Report 2004
Page 28
Table 6-1 (b) : Grievous and Simple Injury Accidents
number of vehicles road environment road class vehicle type
vehicles per
accident urban rural total national regional feeder rural road city total Bicycle 0 1 1 0 0 1 0 0 1 Rickshaw 0 0 0 0 0 0 0 1 1 Push cart 0 1 0 1 0 0 0 0 1 Motor cycle 9 8 14 3 2 3 4 5 17 Baby taxi 7 1 8 2 1 0 1 4 8 Tempo 3 9 11 4 4 2 1 2 13 Microbus 9 16 17 14 4 2 1 4 25 Minibus 37 29 48 19 10 2 1 34 66 Bus 36 90 105 62 15 21 4 26 128 Car 24 12 12 11 0 3 1 23 38 Jeep 0 2 3 2 0 0 0 0 2 Pick-up 7 11 18 6 2 1 3 7 19 Truck 2 5 11 3 1 2 1 1 8 Heavy truck 19 54 56 37 7 14 2 13 73 Artic truck 1 0 0 0 0 0 0 1 1 Oil tanker 1 0 1 0 0 0 0 1 1 Tractor 2 2 3 1 1 2 0 0 4 Animal drawn 0 0 0 0 0 0 0 0 0 Other 5 10 9 7 1 1 1 5 15 Unknown
one
6 3 9 0 0 0 0 1 1 Bicycle 10 8 18 8 2 3 0 5 18 Rickshaw 36 32 68 21 10 6 3 28 68 Push cart 0 0 0 0 0 0 0 0 0 Motor cycle 23 30 53 21 8 5 2 17 53 Baby taxi 17 14 31 8 1 6 3 14 32 Tempo 7 30 37 17 7 4 5 5 38 Microbus 21 18 39 19 2 6 0 13 40 Minibus 40 29 69 22 7 6 1 35 71 Bus 51 136 187 115 25 13 7 30 190 Car 51 31 82 30 2 5 0 47 84 Jeep 3 12 15 6 5 1 2 1 15 Pick-up 10 24 34 25 4 1 0 4 34 Truck 4 24 28 15 6 4 1 2 28 Heavy truck 32 152 184 139 13 13 2 19 186 Artic. truck 2 3 5 3 0 0 0 2 5 Oil tanker 1 4 5 3 1 0 0 1 5 Tractor 0 7 7 5 0 2 0 0 7 Animal drawn 0 0 0 0 0 0 0 0 0 Other 18 18 36 12 5 3 0 16 36 Unknown
two
or m
ore
10 6 16 1 1 1 0 1 4

Road Safety Cell, BRTA RTA Annual Report 2004
Page 29
Table 6-1 (c) : Total Casualty Accidents
number of vehicles road environment road class vehicle type
vehicles per
accident urban rural total national regional feeder rural road city total Bicycle 0 4 4 2 0 1 1 0 4 Rickshaw 0 1 1 1 0 0 0 1 2 Push cart 0 2 2 1 1 0 0 0 2 Motor cycle 18 65 83 11 18 24 19 11 83 Baby taxi 11 18 29 4 4 8 7 6 29 Tempo 4 65 69 18 17 21 10 4 70 Microbus 32 62 94 48 7 12 8 20 95 Minibus 112 153 265 78 31 44 10 103 266 Bus 178 491 669 375 94 73 18 117 677 Car 52 25 77 22 0 5 2 50 79 Jeep 3 31 34 11 2 8 10 3 34 Pick-up 21 44 65 23 10 8 7 20 68 Truck 15 60 75 27 7 23 12 7 76 Heavy truck 110 309 419 204 56 67 22 78 427 Artic truck 9 1 10 2 0 0 0 8 10 Oil tanker 5 7 12 4 4 0 0 4 12 Tractor 6 27 33 4 5 14 10 0 33 Animal drawn 1 1 2 1 1 0 0 0 2 Other 56 54 110 25 12 17 8 50 112 Unknown
one
35 63 98 50 2 1 6 11 70 Bicycle 35 69 104 49 10 25 6 15 105 Rickshaw 83 116 199 77 26 21 8 67 199 Push cart 5 1 6 3 1 0 0 3 7 Motor cycle 40 99 139 70 22 16 9 23 140 Baby taxi 32 57 89 39 7 15 7 23 91 Tempo 15 84 99 48 21 16 8 8 101 Microbus 27 64 91 59 5 14 1 14 93 Minibus 72 95 167 69 16 26 2 56 169 Bus 97 407 504 337 62 41 15 55 510 Car 66 61 127 60 3 6 0 60 129 Jeep 3 24 27 14 7 2 3 1 27 Pick-up 16 48 64 46 8 4 0 7 65 Truck 7 59 66 38 9 12 2 5 66 Heavy truck 103 398 501 354 38 45 15 52 504 Artic. truck 7 10 17 9 0 1 0 7 17 Oil tanker 1 9 10 6 1 1 1 1 10 Tractor 1 24 25 13 4 5 4 0 26 Animal drawn 0 0 0 0 0 0 0 0 0 Other 34 61 95 38 14 10 3 30 95 Unknown
two
or m
ore
22 19 41 10 2 2 1 2 17

Road Safety Cell, BRTA RTA Annual Report 2004
Page 30
Table 6-2 : Types of Registered Vehicles in Bangladesh
registered vehicles vehicles involved in fatal single vehicle
accidents
vehicles involved in fatal multiple vehicle
accidents vehicle type
number % of total number % of total number % of totalMotor cycle 346,288 44.0% 66 3.9% 86 7.1% Baby taxi and Tempo 107,453 13.7% 78 4.6% 120 9.9% Microbus, Jeep and Pick-up 51,878 6.6% 148 8.7% 94 7.7% Minibus 33,986 4.3% 199 11.8% 98 8.1% Bus 31,474 4.0% 543 32.1% 317 26.1% Car/Taxi 133,078 16.9% 41 2.4% 45 3.7% Truck, Heavy truck, Artic. truck and Oil tanker 53,958 6.9% 434 25.6% 372 30.6% Other 28,487 3.6% 184 10.9% 84 6.9% total 786,602 1,693 1,216
Figure 6-1 : Comparison of motor vehicle types involved in fatal accidents
0.0
5.0
10.0
15.0
20.0
25.0
30.0
35.0
40.0
45.0
Vehi
cles
as
perc
enta
ge o
f num
ber
of v
ehic
les
in c
ateg
ory
Mot
or c
ycle
Bab
y ta
xi/
Tem
po
Mic
robu
s/Je
ep/
Pic
k-up Min
ibus
Bus
Car
/Tax
i
Truc
k/O
ilta
nker
/Arti
c.
Oth
er
1
2
3
Categories: 1 registered vehicles 2 vehicles involved in fatal single vehicle accidents 3 vehicles involved in fatal multiple vehicle accidents

Road Safety Cell, BRTA RTA Annual Report 2004
Page 31
Table 6-3 : Number of Vehicles by Type involved in Recorded Casualty Accidents by Type of Collision
Table 6-3 (a) : Fatal Accidents
number of vehicles collision type
vehicle type vehicles
per accident
Hea
d on
Rea
r end
Rig
ht
angl
e
Side
sw
ipe
Ove
rturn
ed
vehi
cle
Hit
obje
ct
in ro
ad
Hit
obje
ct
off r
oad
Hit
park
ed
vehi
cle
Hit
pede
stria
n
Hit
anim
al
Oth
er
total % total
Bicycle 0 0 0 0 1 0 0 0 2 0 0 3 0.2%Rickshaw 0 0 0 0 0 0 0 0 1 0 0 1 0.1%Push cart 0 0 0 0 0 0 0 0 1 0 0 1 0.1%Motor cycle 1 3 0 0 0 0 1 0 61 0 0 66 4.2%Baby taxi 0 1 0 1 5 0 0 0 11 0 3 21 1.3%Tempo 0 0 0 0 16 0 5 0 33 0 3 57 3.6%Microbus 1 1 0 0 0 0 0 0 65 0 3 70 4.5%Minibus 2 1 0 4 22 1 7 1 149 0 14 201 12.8%Bus 4 10 1 13 68 4 11 1 414 0 24 550 35.1%Car 2 0 0 0 2 0 2 0 33 0 2 41 2.6%Jeep 0 1 0 1 3 0 1 0 22 0 4 32 2.0%Pick-up 0 0 0 1 7 1 1 0 37 0 2 49 3.1%Truck 0 1 0 3 12 0 0 0 49 0 3 68 4.3%Heavy truck 3 6 1 2 49 2 5 0 279 0 8 355 22.7%Artic. truck 0 0 0 0 1 0 0 0 8 0 0 9 0.6%Oil tanker 0 1 0 0 1 0 0 0 9 0 0 11 0.7%Tractor 0 1 0 1 5 0 0 0 18 0 5 30 1.9%Animal drawn 0 0 0 0 0 0 0 0 2 0 0 2 0.1%Other 2 3 0 0 8 2 0 0 78 0 5 98 6.3%Unknown
one
0 0 0 0 1 0 1 0 62 0 0 64 4.1%Bicycle 27 42 0 13 0 2 0 1 0 0 2 87 5.6%Rickshaw 30 72 3 8 2 1 2 9 1 0 4 132 8.5%Push cart 1 5 0 0 0 1 0 0 0 0 0 7 0.5%Motor cycle 39 22 3 16 0 1 0 4 1 0 1 87 5.6%Baby taxi 33 13 1 7 1 0 0 4 0 0 1 60 3.9%Tempo 38 14 0 6 0 0 0 2 2 0 0 62 4.0%Microbus 26 13 1 8 0 0 0 5 0 0 0 53 3.4%Minibus 44 32 2 12 2 0 0 4 2 0 0 98 6.3%Bus 167 78 6 37 3 4 0 13 4 0 7 319 20.6%Car 25 12 1 1 0 0 0 2 1 0 3 45 2.9%Jeep 3 3 0 4 0 0 0 2 0 0 0 12 0.8%Pick-up 18 8 0 4 0 0 0 2 0 0 0 32 2.1%Truck 22 6 1 7 0 2 1 0 0 0 0 39 2.5%Heavy truck 147 100 0 44 2 1 1 14 3 0 6 318 20.5%Artic. truck 4 4 1 0 0 0 0 1 0 0 1 11 0.7%Oil tanker 2 2 0 1 0 0 0 0 0 0 0 5 0.3%Tractor 4 7 0 6 0 0 0 0 0 0 1 18 1.2%Animal drawn 0 0 0 0 0 0 0 0 0 0 0 0 0.0%Other 19 20 2 8 0 2 2 1 3 0 2 59 3.8%Unknown
two
or m
ore
0 0 1 0 0 0 0 0 6 0 6 13 0.8%

Road Safety Cell, BRTA RTA Annual Report 2004
Page 32
Table 6-3 (b) : Grievous and Simple Injury Accidents
number of vehicles collision type
vehicle type vehicles
per accident
Hea
d on
Rea
r end
Rig
ht
angl
e
Side
sw
ipe
Ove
rturn
ed
vehi
cle
Hit
obje
ct
in ro
ad
Hit
obje
ct
off r
oad
Hit
park
ed
vehi
cle
Hit
pede
stria
n
Hit
anim
al
Oth
er
total % total
Bicycle 0 0 0 0 0 0 0 0 1 0 0 1 0.2%Rickshaw 0 0 0 1 0 0 0 0 0 0 0 1 0.2%Push cart 0 0 0 0 0 0 0 0 1 0 0 1 0.2%Motor cycle 0 1 0 0 0 0 0 0 16 0 0 17 4.2%Baby taxi 0 0 0 0 1 0 0 0 5 0 2 8 2.0%Tempo 0 0 0 1 3 0 0 0 8 0 0 12 3.0%Microbus 0 0 0 1 1 0 2 0 20 0 1 25 6.2%Minibus 1 2 0 1 5 0 4 0 40 0 13 66 16.4%Bus 4 4 0 12 31 2 10 0 54 0 10 127 31.5%Car 0 0 0 0 0 1 3 0 29 0 5 38 9.4%Jeep 1 0 0 0 0 0 0 0 1 0 0 2 0.5%Pick-up 0 0 0 1 1 2 0 0 15 0 0 19 4.7%Truck 0 0 0 2 2 0 0 0 4 0 0 8 2.0%Heavy truck 4 1 0 2 14 0 6 0 39 0 6 72 17.9%Artic. truck 0 0 0 0 0 0 0 0 1 0 0 1 0.2%Oil tanker 0 0 0 0 0 0 0 0 0 0 1 1 0.2%Tractor 1 0 0 1 0 0 0 0 2 0 0 4 1.0%Animal drawn 0 0 0 0 0 0 0 0 0 0 0 0 0.0%Other 1 1 0 0 0 1 2 0 8 0 2 15 3.7%Unknown
one
0 0 0 0 0 0 0 0 4 0 0 4 1.0%Bicycle 1 11 0 4 0 1 0 0 0 0 1 18 2.0%Rickshaw 3 45 2 8 0 1 1 5 0 0 3 68 7.6%Push cart 0 0 0 0 0 0 0 0 0 0 0 0 0.0%Motor cycle 14 29 0 3 0 1 1 2 0 0 3 53 5.9%Baby taxi 13 8 1 3 0 0 0 5 0 0 2 32 3.6%Tempo 19 14 0 5 0 0 0 0 0 0 0 38 4.3%Microbus 12 15 2 8 0 0 0 3 0 0 0 40 4.5%Minibus 22 33 3 7 0 0 0 2 0 0 4 71 8.0%Bus 78 61 2 22 2 2 1 10 0 0 12 190 21.3%Car 24 43 5 3 0 0 1 3 0 0 5 84 9.4%Jeep 8 6 0 0 0 0 0 1 0 0 0 15 1.7%Pick-up 15 11 0 3 0 1 0 3 0 0 1 34 3.8%Truck 15 6 1 2 0 0 1 3 0 0 0 28 3.1%Heavy truck 84 47 6 24 2 2 1 16 0 0 4 186 20.8%Artic. truck 2 0 0 2 0 0 0 1 0 0 0 5 0.6%Oil tanker 3 2 0 0 0 0 0 0 0 0 0 5 0.6%Tractor 3 0 0 2 0 0 0 1 0 0 1 7 0.8%Animal drawn 0 0 0 0 0 0 0 0 0 0 0 0 0.0%Other 14 16 2 2 0 0 0 0 0 0 2 36 4.0%Unknown
two
or m
ore
0 0 0 0 0 0 0 0 4 0 0 0 0.0%

Road Safety Cell, BRTA RTA Annual Report 2004
Page 33
Table 6-3 (c) : Total Casualty Accidents
number of vehicles collision type
vehicle type vehicles
per accident
Hea
d on
Rea
r end
Rig
ht
angl
e
Side
sw
ipe
Ove
rturn
ed
vehi
cle
Hit
obje
ct
in ro
ad
Hit
obje
ct
off r
oad
Hit
park
ed
vehi
cle
Hit
pede
stria
n
Hit
anim
al
Oth
er
total % total
Bicycle 0 0 0 0 1 0 0 0 3 0 0 4 0.2%Rickshaw 0 0 0 1 0 0 0 0 1 0 0 2 0.1%Push cart 0 0 0 0 0 0 0 0 2 0 0 2 0.1%Motor cycle 1 4 0 0 0 0 1 0 77 0 0 83 4.2%Baby taxi 0 1 0 1 6 0 0 0 16 0 5 29 1.5%Tempo 0 0 0 1 19 0 5 0 41 0 3 69 3.5%Microbus 1 1 0 1 1 0 2 0 85 0 4 95 4.8%Minibus 3 3 0 5 27 1 11 1 189 0 27 267 13.6%Bus 8 14 1 25 99 6 21 1 468 0 34 677 34.4%Car 2 0 0 0 2 1 5 0 62 0 7 79 4.0%Jeep 1 1 0 1 3 0 1 0 23 0 4 34 1.7%Pick-up 0 0 0 2 8 3 1 0 52 0 2 68 3.5%Truck 0 1 0 5 14 0 0 0 53 0 3 76 3.9%Heavy truck 7 7 1 4 63 2 11 0 318 0 14 427 21.7%Artic. truck 0 0 0 0 1 0 0 0 9 0 0 10 0.5%Oil tanker 0 1 0 0 1 0 0 0 9 0 1 12 0.6%Tractor 1 1 0 2 5 0 0 0 20 0 5 34 1.7%Animal drawn 0 0 0 0 0 0 0 0 2 0 0 2 0.1%Other 3 4 0 0 8 3 2 0 86 0 7 113 5.7%Unknown
one
0 0 0 0 1 0 1 0 66 0 0 68 3.5%Bicycle 28 53 0 17 0 3 0 1 0 0 3 105 4.3%Rickshaw 33 117 5 16 2 2 3 14 1 0 7 200 8.2%Push cart 1 5 0 0 0 1 0 0 0 0 0 7 0.3%Motor cycle 53 51 3 19 0 2 1 6 1 0 4 140 5.7%Baby taxi 46 21 2 10 1 0 0 9 0 0 3 92 3.8%Tempo 57 28 0 11 0 0 0 2 2 0 0 100 4.1%Microbus 38 28 3 16 0 0 0 8 0 0 0 93 3.8%Minibus 66 65 5 19 2 0 0 6 2 0 4 169 6.9%Bus 245 139 8 59 5 6 1 23 4 0 19 509 20.8%Car 49 55 6 4 0 0 1 5 1 0 8 129 5.3%Jeep 11 9 0 4 0 0 0 3 0 0 0 27 1.1%Pick-up 33 19 0 7 0 1 0 5 0 0 1 66 2.7%Truck 37 12 2 9 0 2 2 3 0 0 0 67 2.7%Heavy truck 231 147 6 68 4 3 2 30 3 0 10 504 20.6%Artic. truck 6 4 1 2 0 0 0 2 0 0 1 16 0.7%Oil tanker 5 4 0 1 0 0 0 0 0 0 0 10 0.4%Tractor 7 7 0 8 0 0 0 1 0 0 2 25 1.0%Animal drawn 0 0 0 0 0 0 0 0 0 0 0 0 0.0%Other 33 36 4 10 0 2 2 1 3 0 4 95 3.9%Unknown
two
or m
ore
0 0 1 0 0 0 0 0 10 0 6 17 0.7%

Road Safety Cell, BRTA RTA Annual Report 2004
Page 34
Table 6-4 : Number of Vehicles by Type involved in Recorded Casualty Accidents by Road Environment and Road Class in Dhaka Metropolitan Area.
Table 6-4 (a): Fatal Accidents
number of vehicles collision type
vehicle type vehicles
per accident
Hea
d on
Rea
r end
Rig
ht
angl
e
Side
sw
ipe
Ove
rturn
ed
vehi
cle
Hit
obje
ct
in ro
ad
Hit
obje
ct
off r
oad
Hit
park
ed
vehi
cle
Hit
pede
stria
n Hit
anim
al
Oth
er
total % total
Bicycle 0 0 0 0 0 0 0 0 0 0 0 0 0.0%Rickshaw 0 0 0 0 0 0 0 0 0 0 0 0 0.0%Push cart 0 0 0 0 0 0 0 0 0 0 0 0 0.0%Motor cycle 0 0 0 0 0 0 0 0 4 0 0 4 1.3%Baby taxi 0 0 0 0 1 0 0 0 1 0 0 2 0.7%Tempo 0 0 0 0 0 0 0 0 0 0 0 0 0.0%Microbus 0 0 0 0 0 0 0 0 8 0 1 9 3.0%Minibus 0 0 0 0 0 1 0 0 53 0 6 60 19.7%Bus 0 0 0 0 0 0 0 0 74 0 7 81 26.6%Car 0 0 0 0 1 0 0 0 23 0 2 26 8.5%Jeep 0 0 0 0 0 0 0 0 3 0 0 3 1.0%Pick-up 0 0 0 0 1 0 0 0 10 0 1 12 3.9%Truck 0 0 0 0 0 0 0 0 2 0 0 2 0.7%Heavy truck 0 0 0 0 6 0 0 0 43 0 2 51 16.7%Artic. truck 0 0 0 0 0 0 0 0 7 0 0 7 2.3%Oil tanker 0 0 0 0 0 0 0 0 3 0 0 3 1.0%Tractor 0 0 0 0 0 0 0 0 0 0 0 0 0.0%Animal drawn 0 0 0 0 0 0 0 0 0 0 0 0 0.0%Other 0 0 0 0 1 0 0 0 43 0 1 45 14.8%Unknown
one
0 0 0 0 0 0 0 0 0 0 0 0 0.0%Bicycle 0 4 0 0 0 0 0 0 0 0 0 4 3.2%Rickshaw 4 18 3 0 0 0 0 2 0 0 1 28 22.2%Push cart 0 1 0 0 0 0 0 0 0 0 0 1 0.8%Motor cycle 0 1 0 0 0 0 0 0 0 0 0 1 0.8%Baby taxi 0 3 0 0 0 0 0 1 0 0 1 5 4.0%Tempo 1 1 0 1 0 0 0 0 0 0 0 3 2.4%Microbus 0 0 1 0 0 0 0 0 0 0 0 1 0.8%Minibus 2 8 2 4 0 0 0 0 1 0 0 17 13.5%Bus 2 8 2 1 0 0 0 1 1 0 2 17 13.5%Car 0 7 1 0 0 0 0 2 0 0 3 13 10.3%Jeep 0 0 0 0 0 0 0 0 0 0 0 0 0.0%Pick-up 1 0 0 1 0 0 0 0 0 0 0 2 1.6%Truck 0 0 0 0 0 0 0 0 0 0 0 0 0.0%Heavy truck 4 14 0 1 0 0 0 0 0 0 1 20 15.9%Artic. truck 1 2 1 0 0 0 0 0 0 0 0 4 3.2%Oil tanker 0 0 0 0 0 0 0 0 0 0 0 0 0.0%Tractor 0 0 0 0 0 0 0 0 0 0 0 0 0.0%Animal drawn 0 0 0 0 0 0 0 0 0 0 0 0 0.0%Other 0 9 1 0 0 0 0 0 0 0 0 10 7.9%Unknown
two
or m
ore
0 0 0 0 0 0 0 0 0 0 0 0 0.0%

Road Safety Cell, BRTA RTA Annual Report 2004
Page 35
Table 6-4 (b) : Grievous and Simple Injury Accidents
number of vehicles collision type
vehicle type vehicles
per accident
Hea
d on
Rea
r end
Rig
ht
angl
e
Side
sw
ipe
Ove
rturn
ed
vehi
cle
Hit
obje
ct
in ro
ad
Hit
obje
ct
off r
oad
Hit
park
ed
vehi
cle
Hit
pede
stria
n
Hit
anim
al
Oth
er
total % total
Bicycle 0 0 0 0 0 0 0 0 0 0 0 0 0.0%Rickshaw 0 0 0 0 0 0 0 0 0 0 0 0 0.0%Push cart 0 0 0 0 0 0 0 0 0 0 0 0 0.0%Motor cycle 0 0 0 0 0 0 0 0 5 0 0 5 4.8%Baby taxi 0 0 0 0 0 0 0 0 1 0 2 3 2.9%Tempo 0 0 0 0 0 0 0 0 0 0 0 0 0.0%Microbus 0 0 0 0 0 0 0 0 2 0 0 2 1.9%Minibus 0 0 0 0 0 0 0 0 23 0 7 30 28.8%Bus 0 0 0 0 0 0 0 0 19 0 3 22 21.2%Car 0 0 0 0 0 1 0 0 16 0 5 22 21.2%Jeep 0 0 0 0 0 0 0 0 0 0 0 0 0.0%Pick-up 0 0 0 0 0 0 0 0 5 0 0 5 4.8%Truck 0 0 0 0 0 0 0 0 1 0 0 1 1.0%Heavy truck 0 0 0 0 0 0 1 0 5 0 1 7 6.7%Artic. truck 0 0 0 0 0 0 0 0 1 0 0 1 1.0%Oil tanker 0 0 0 0 0 0 0 0 0 0 1 1 1.0%Tractor 0 0 0 0 0 0 0 0 0 0 0 0 0.0%Animal drawn 0 0 0 0 0 0 0 0 0 0 0 0 0.0%Other 0 0 0 0 0 0 0 0 4 0 1 5 4.8%Unknown
one
0 0 0 0 0 0 0 0 0 0 0 0 0.0%Bicycle 0 3 0 0 0 0 0 0 0 0 0 3 1.5%Rickshaw 0 24 1 0 0 0 0 1 0 0 0 26 12.7%Push cart 0 0 0 0 0 0 0 0 0 0 0 0 0.0%Motor cycle 1 13 0 0 0 0 0 0 0 0 1 15 7.4%Baby taxi 1 5 0 0 0 0 0 2 0 0 1 9 4.4%Tempo 0 2 0 0 0 0 0 0 0 0 0 2 1.0%Microbus 0 7 1 0 0 0 0 0 0 0 0 8 3.9%Minibus 1 21 3 4 0 0 0 2 0 0 2 33 16.2%Bus 3 17 1 1 0 0 0 1 0 0 0 23 11.3%Car 4 33 5 0 0 0 0 2 0 0 2 46 22.5%Jeep 0 1 0 0 0 0 0 0 0 0 0 1 0.5%Pick-up 0 3 0 0 0 0 0 1 0 0 0 4 2.0%Truck 0 1 0 0 0 0 0 1 0 0 0 2 1.0%Heavy truck 4 8 3 0 0 0 0 0 0 0 0 15 7.4%Artic. truck 1 0 0 0 0 0 0 0 0 0 0 1 0.5%Oil tanker 0 1 0 0 0 0 0 0 0 0 0 1 0.5%Tractor 0 0 0 0 0 0 0 0 0 0 0 0 0.0%Animal drawn 0 0 0 0 0 0 0 0 0 0 0 0 0.0%Other 3 9 2 1 0 0 0 0 0 0 0 15 7.4%Unknown
two
or m
ore
0 0 0 0 0 0 0 0 0 0 0 0 0%

Road Safety Cell, BRTA RTA Annual Report 2004
Page 36
Table 6-4 (c) : Total Casualty Accidents
number of vehicles collision type
vehicle type vehicles
per accident
Hea
d on
Rea
r end
Rig
ht
angl
e
Side
sw
ipe
Ove
rturn
ed
vehi
cle
Hit
obje
ct
in ro
ad
Hit
obje
ct
off r
oad
Hit
park
ed
vehi
cle
Hit
pede
stria
n
Hit
anim
al
Oth
er
total % total
Bicycle 0 0 0 0 0 0 0 0 0 0 0 0 0.0%Rickshaw 0 0 0 0 0 0 0 0 0 0 0 0 0.0%Push cart 0 0 0 0 0 0 0 0 0 0 0 0 0.0%Motor cycle 0 0 0 0 0 0 0 0 9 0 0 9 2.2%Baby taxi 0 0 0 0 1 0 0 0 2 0 2 5 1.2%Tempo 0 0 0 0 0 0 0 0 0 0 0 0 0.0%Microbus 0 0 0 0 0 0 0 0 10 0 1 11 2.7%Minibus 0 0 0 0 0 1 0 0 76 0 13 90 22.0%Bus 0 0 0 0 0 0 0 0 93 0 10 103 25.2%Car 0 0 0 0 1 1 0 0 39 0 7 48 11.7%Jeep 0 0 0 0 0 0 0 0 3 0 0 3 0.7%Pick-up 0 0 0 0 1 0 0 0 15 0 1 17 4.2%Truck 0 0 0 0 0 0 0 0 3 0 0 3 0.7%Heavy truck 0 0 0 0 6 0 1 0 48 0 3 58 14.2%Artic. truck 0 0 0 0 0 0 0 0 8 0 0 8 2.0%Oil tanker 0 0 0 0 0 0 0 0 3 0 1 4 1.0%Tractor 0 0 0 0 0 0 0 0 0 0 0 0 0.0%Animal drawn 0 0 0 0 0 0 0 0 0 0 0 0 0.0%Other 0 0 0 0 1 0 0 0 47 0 2 50 12.2%Unknown
one
0 0 0 0 0 0 0 0 0 0 0 0 0.0%Bicycle 0 7 0 0 0 0 0 0 0 0 0 7 2.1%Rickshaw 4 42 4 0 0 0 0 3 0 0 1 54 16.4%Push cart 0 1 0 0 0 0 0 0 0 0 0 1 0.3%Motor cycle 1 14 0 0 0 0 0 0 0 0 1 16 4.8%Baby taxi 1 8 0 0 0 0 0 3 0 0 2 14 4.2%Tempo 1 3 0 1 0 0 0 0 0 0 0 5 1.5%Microbus 0 7 2 0 0 0 0 0 0 0 0 9 2.7%Minibus 3 29 5 8 0 0 0 2 1 0 2 50 15.2%Bus 5 25 3 2 0 0 0 2 1 0 2 40 12.1%Car 4 40 6 0 0 0 0 4 0 0 5 59 17.9%Jeep 0 1 0 0 0 0 0 0 0 0 0 1 0.3%Pick-up 1 3 0 1 0 0 0 1 0 0 0 6 1.8%Truck 0 1 0 0 0 0 0 1 0 0 0 2 0.6%Heavy truck 8 22 3 1 0 0 0 0 0 0 1 35 10.6%Artic. truck 2 2 1 0 0 0 0 0 0 0 0 5 1.5%Oil tanker 0 1 0 0 0 0 0 0 0 0 0 1 0.3%Tractor 0 0 0 0 0 0 0 0 0 0 0 0 0.0%Animal drawn 0 0 0 0 0 0 0 0 0 0 0 0 0.0%Other 3 18 3 1 0 0 0 0 0 0 0 25 7.6%Unknown
two
or m
ore
0 0 0 0 0 0 0 0 0 0 0 0 0.0%

Road Safety Cell, BRTA RTA Annual Report 2004
Page 37
7 CASUALTIES
Table 7-1 : Recorded Casualties by Division and City
number of casualties population1 casualty rates severity (no. per 10,000 pop'n) Division or City
fatal grievous injury simple injury
total ('000,000)
fatalities total casualties
Divisions, excluding Cities Barisal 82 47 37 166 8.478 0.097 0.196 Chittagong 685 445 277 1407 21.734 0.315 0.647 Sylhet 215 113 48 376 8.256 0.260 0.455 Dhaka 975 584 347 1906 34.800 0.280 0.548 Khulna 124 119 39 282 14.313 0.087 0.197 Rajshahi 497 301 144 942 30.944 0.161 0.304 total 2578 1609 892 5079 118.524 0.218 0.429 Cities Chittagong City 71 26 36 133 3.347 0.212 0.397 Dhaka City 381 304 38 723 5.620 0.678 1.286 Khulna City 11 6 7 24 0.808 0.136 0.297 Rajshahi City 38 22 11 71 0.401 0.948 1.771 total 501 358 92 951 10.176 0.492 0.935 TOTAL 3079 1967 984 6030 128.700 0.710 1.363
Notes: 1. Year 2004 populations are derived from statistics published in the 2000 Statistical Yearbook and the Population Census 2001 Preliminary Report.
Figure7-1 : Casualty Rate by Division and Metropolitan Area
0.00
0.20
0.40
0.60
0.80
1.00
1.20
1.40
1.60
1.80
Cas
ualti
es p
er 1
0,00
0 po
p'n
Barisal Chittagong Sylhet Dhaka Khulna Rajshahi ChittagongCity
Dhaka City Khulna City RajshahiCity
Division and Metropolitan Areas

Road Safety Cell, BRTA RTA Annual Report 2004
Page 38
Table 7-2 : Change in Recorded Casualties, 1999 - 2004
number of casualties population 1 casualty rates severity (no. per 10,000 pop'n) year
fatal grievous injury simple injury
total (no. per 10,000 pop'n) fatalities total
casualties Divisions, excluding the Cities 1999 2416 1531 979 4926 110.057 0.220 0.448 2000 2638 1552 1079 5269 111.735 0.236 0.472 2001 2025 1221 840 4086 113.414 0.179 0.360 2002 2513 1556 1011 5080 115.092 0.218 0.441 2003 2786 1874 1173 5833 115.092 0.218 0.507 2004 2578 1609 892 5079 118.524 0.218 0.429 Cities 2 1999 473 634 322 1429 9.449 0.501 1.512 2000 420 718 136 1274 9.593 0.438 1.328 2001 363 440 64 867 9.738 0.373 0.890 2002 501 358 92 951 9.882 0.507 0.962 2003 548 547 146 1241 9.882 0.555 1.256 2004 501 358 92 951 10.176 0.492 0.935 Bangladesh 1999 2889 2165 1301 6355 119.506 0.242 0.532 2000 3058 2270 1215 6543 121.328 0.252 0.539 2001 2388 1661 904 4953 123.152 0.194 0.402 2002 3014 1914 1103 6031 124.974 0.241 0.483 2003 3334 2421 1319 7074 124.974 0.267 0.566 2004 3079 1967 984 6030 128.700 0.239 0.469
Notes: 1. Year 2004 populations are derived from statistics published in the 2000 Statistical Yearbook and the Population Census 2001 Preliminary Report.
2. Cities are Chittagong, Dhaka, Khulna and Rajshahi.
Figure7-2 : Casualty Rates, 1999 - 2004
0.00
0.20
0.40
0.60
0.80
1.00
1.20
1.40
1.60
Num
ber o
f Cas
ualti
es p
er 1
0,00
0po
p'n
Divisions (excluding Cities) Cities Bangladesh
199920002001200220032004

Road Safety Cell, BRTA RTA Annual Report 2004
Page 39
Table 7-3 : Recorded Casualties by District (Zilla)
number of casualties population1 casualty rates severity (no. per 10,000 pop'n)
Division and
District fatal grievous injury simple injury
total (no. per 10,000 pop'n) fatalities total
casualties Barisal Division Barguna 9 2 1 12 0.876 0.103 0.137 Barisal 18 34 7 59 2.436 0.074 0.242 Bhola 25 4 11 40 1.752 0.143 0.228 Jhalakati 8 0 0 8 0.727 0.110 0.110 Patuakhali 15 7 17 39 1.509 0.099 0.258 Pirojpur 7 0 1 8 1.177 0.059 0.068 Total 82 47 37 166 8.477984 0.097 0.196 Chittagong Division Bandarban 6 17 25 48 0.306 0.196 1.569 Brahmanbaria 37 40 19 96 2.471 0.150 0.389 Chandpur 31 43 14 88 2.308 0.134 0.381 Chittagong District 137 69 36 242 3.491 0.392 0.693 Chittagong City 71 26 36 133 3.345 0.212 0.398 Comilla 206 109 51 366 4.791 0.430 0.764 Cox's Bazar 56 20 17 93 1.835 0.305 0.507 Feni 106 89 53 248 1.249 0.848 1.985 Khagrachhari 15 18 12 45 0.548 0.274 0.821 Lakshmipur 39 12 16 67 1.545 0.252 0.434 Noakhali 42 15 6 63 2.646 0.159 0.238 Rangamati 10 13 28 51 0.530 0.189 0.963 Total 756 471 313 1540 25.065 0.302 0.614 Dhaka Division Dhaka District 72 46 26 144 3.342 0.215 0.431 Dhaka City 381 304 38 723 5.620 0.678 1.286 Faridpur 81 61 27 169 1.797 0.451 0.940 Gazipur 59 12 21 92 2.118 0.279 0.434 Gopalganj 37 24 16 77 1.183 0.313 0.651 Jamalpur 8 3 1 12 2.184 0.037 0.055 Kishoreganj 58 45 6 109 2.639 0.220 0.413 Madaripur 12 11 0 23 1.188 0.101 0.194 Manikganj 68 61 44 173 1.332 0.510 1.299 Munshiganj 72 24 33 129 1.352 0.533 0.954 Mymensingh 99 73 34 206 4.639 0.213 0.444 Narayanganj 121 92 42 255 2.235 0.541 1.141 Narsingdi 91 57 34 182 1.977 0.460 0.921 Netrokona 25 1 2 28 2.025 0.123 0.138 Rajbari 46 10 30 86 0.983 0.468 0.875 Shariatpur 8 10 7 25 1.105 0.072 0.226 Sherpur 29 11 3 43 1.303 0.223 0.330 Tangail 89 43 21 153 3.401 0.262 0.450 Total 1356 888 385 2629 40.421 0.335 0.650
Table 7-3 continued on next page

Road Safety Cell, BRTA RTA Annual Report 2004
Page 40
Table 7-3, continued
number of casualties population1 casualty rates severity (no. per 10,000 pop'n)
Division and
District fatal grievous injury simple injury
total (no. per 10,000 pop'n) fatalities total
casualties Sylhet Division Hobiganj 52 23 7 82 1.835 0.283 0.447 Moulavibazar 33 12 7 52 1.675 0.197 0.310 Sunamganj 19 11 4 34 2.056 0.092 0.165 Sylhet 111 67 30 208 2.684 0.414 0.775 Total 215 113 48 376 8.25057 0.261 0.456 Khulna Division Bagerhat 8 1 4 13 1.583 0.051 0.082 Chaudanga 0 0 0 0 1.031 0.000 0.000 Jessore 37 42 3 82 2.549 0.145 0.322 Jhenaidah 42 38 19 99 1.624 0.259 0.610 Khulna District 11 13 6 30 1.630 0.067 0.184 Khulna City 11 6 7 24 0.808 0.136 0.297 Kushtia 2 0 0 2 1.789 0.011 0.011 Magura 15 20 7 42 0.847 0.177 0.496 Maherpur 6 4 0 10 0.605 0.099 0.165 Narail 3 0 0 3 0.720 0.042 0.042 Satkhira 0 1 0 1 1.925 0.000 0.005 Total 135 125 46 306 15.111 0.089 0.202 Rajshahi Division Bogra 51 39 21 111 3.123 0.163 0.355 Dinajpur 43 25 15 83 2.736 0.157 0.303 Gaibandha 24 31 4 59 2.213 0.108 0.267 Joypurhat 22 4 1 27 0.883 0.249 0.306 Kurigram 32 8 5 45 1.863 0.172 0.242 Lalmonirhat 27 8 2 37 1.138 0.237 0.325 Natore 19 38 3 60 2.484 0.076 0.242 Nawabganj 11 16 0 27 1.590 0.069 0.170 Nilphamari 9 3 7 19 1.484 0.061 0.128 Naogaon 5 1 0 6 1.621 0.031 0.037 Pabhna 61 34 27 122 2.251 0.271 0.542 Panchgarh 12 0 5 17 0.867 0.138 0.196 Rajshahi District 58 46 22 126 1.963 0.295 0.642 Rajshahi City 38 22 11 71 0.401 0.948 1.771 Rangpur 51 21 18 90 2.649 0.193 0.340 Sirajganj 49 10 12 71 2.829 0.173 0.251 Thakurgaon 23 17 2 42 1.250 0.184 0.336 Total 535 323 155 1013 31.344 0.171 0.323 TOTAL 3079 1967 984 6030 128.700 0.239 0.469
Notes: 1. Year 2004 populations are derived from statistics published in the 2000 Statistical Yearbook and the Population Census 2001 Preliminary Report.

Road Safety Cell, BRTA RTA Annual Report 2004
Page 41
8 FATALITIES
Table 8-1 : Road Accident Fatalities by Age
age number of fatalities (years) driver passenger pedestrian total
0 - 5 0 17 67 84 6 - 10. 0 32 145 177
11 - 15. 4 29 69 102 16 - 20 13 54 76 143 21 - 25 40 93 79 212 26 - 30 39 103 80 222 31 - 35 37 74 66 177 36 - 40 30 63 53 146 41 - 45 15 47 46 108 46 - 50 7 33 57 97 51 - 55 4 13 30 47 56 - 60 2 24 51 77 61 - 65 0 13 35 48 66 - 70 0 9 33 42 71 - 75 0 3 6 9
> 75 0 2 8 10 unknown 240 533 605 1378
TOTAL 431 1142 1506 3079 % total 14% 37% 49% 100%
Figure 8-1 : Number of Road Accident Fatalities by Age
0
20
40
60
80
100
120
140
160
Num
ber o
f Fat
aliti
es
0-5 6 - 10. 11-15. 16-20 21-25 26-30 31-35 36-40 41-45 46-50 51-55 56-60 61-65 66-70 71-75 > 75
Age
driver
passenger
pedestrian

Road Safety Cell, BRTA RTA Annual Report 2004
Page 42
Table 8-2 : Passenger Fatalities by Age and Sex
age number of passenger fatalities (years) male female total
0 - 5 11 6 17 6 - 10. 20 12 32
11 - 15. 21 8 29 16 - 20 47 7 54 21 - 25 80 13 93 26 - 30 91 12 103 31 - 35 62 12 74 36 - 40 57 6 63 41 - 45 40 7 47 46 - 50 26 7 33 51 - 55 11 2 13 56 - 60 21 3 24 61 - 65 12 1 13 66 - 70 5 4 9 71 - 75 2 1 3
> 75 1 1 2 unknown 486 47 533 TOTAL 993 149 1142 % total 87% 13% 100%
Figure 8-2 : Number of Passenger Fatalities by Age and Sex
0
10
20
30
40
50
60
70
80
90
100
Num
ber o
f Fat
aliti
es
0-5 6 - 10. 11-15. 16-20 21-25 26-30 31-35 36-40 41-45 46-50 51-55 56-60 61-65 66-70 71-75 > 75
Age
male
female

Road Safety Cell, BRTA RTA Annual Report 2004
Page 43
Table 8-3 : Pedestrian Fatalities by Age and Sex
age number of pedestrian fatalities (years) male female total
0 - 5 36 31 67 6 - 10. 74 71 145
11 - 15. 56 13 69 16 - 20 59 17 76 21 - 25 66 13 79 26 - 30 65 15 80 31 - 35 49 17 66 36 - 40 46 7 53 41 - 45 36 10 46 46 - 50 39 18 57 51 - 55 24 6 30 56 - 60 36 15 51 61 - 65 27 8 35 66 - 70 26 7 33 71 - 75 4 2 6
> 75 7 1 8 unknown 538 66 605 TOTAL 1188 317 1506 % total 79% 21% 100%
Figure 8-3 : Number of Pedestrian Fatalities by Age and Sex
0
10
20
30
40
50
60
70
80
Num
ber o
f Fat
aliti
es
0-5 6 - 10. 11-15. 16-20 21-25 26-30 31-35 36-40 41-45 46-50 51-55 56-60 61-65 66-70 71-75 > 75
Age
male
female

Road Safety Cell, BRTA RTA Annual Report 2004
Page 44
Table 8-4 : Number of Motor Cycle Driver Fatalities by Age and Helmet
age number of fatalities Helmet
(years) Worn Not Worn Total
0 - 5 0 0 0 6 - 10. 0 0 0 11 - 15. 0 0 0 16 - 20 0 2 2 21 - 25 0 8 8 26 - 30 0 3 3 31 - 35 0 5 5 36 - 40 0 1 1 41 - 45 0 2 2 46 - 50 0 1 1 51 - 55 1 2 3 56 - 60 0 0 0 61 - 65 0 0 0 66 - 70 0 0 0 71 - 75 0 0 0
> 75 0 0 0 unknown 4 40 44 TOTAL 5 64 69 % total 7% 93% 100%
Figure 8-4 : Number of Motor Cycle Driver Fatalities by Age and Helmet
0
1
2
3
4
5
6
7
8
Driv
er F
atal
ities
0 -5
6 -10.
11 -15.
16 -20
21 -25
26 -30
31 -35
36 -40
41 -45
46 -50
51 -55
56 -60
61 -65
66 -70
71 -75
>75
Age
Worn
Not Worn

Road Safety Cell, BRTA RTA Annual Report 2004
Page 45
Table 8-5 : Number of Driver Fatalities by Age and Alcohol
age number of fatalities Alcohol (years)
Suspect Non Suspected Total 0 - 5 0 0 0
6 - 10. 0 0 0 11 - 15. 0 4 4 16 - 20 0 13 13 21 - 25 3 32 35 26 - 30 6 31 37 31 - 35 3 33 36 36 - 40 7 21 28 41 - 45 1 14 15 46 - 50 2 5 7 51 - 55 0 4 4 56 - 60 0 1 1 61 - 65 0 0 0 66 - 70 0 0 0 71 - 75 0 0 0
> 75 0 0 0 unknown 36 215 251 TOTAL 58 373 431 % total 13% 87% 100%
Figure 8-5 : Number of Driver Fatalities by Age and Alcohol
0
5
10
15
20
25
30
35
Driv
er F
atal
ities
0 - 5 6 -10.
11 -15.
16 -20
21 -25
26 -30
31 -35
36 -40
41 -45
46 -50
51 -55
56 -60
61 -65
66 -70
71 -75
> 75
Age
SuspectedNot Suspect

Road Safety Cell, BRTA RTA Annual Report 2004
Page 46
8 (I) FATALITIES IN DHAKA METROPOLITAN AREA Table 8-6 : Road Accident Fatalities by Age
age number of fatalities (years) driver passenger pedestrian total
0 - 5 0 1 9 10 6 - 10. 0 3 18 21 11 - 15. 0 2 19 21 16 - 20 1 5 28 34 21 - 25 9 8 37 54 26 - 30 6 4 35 45 31 - 35 6 1 29 36 36 - 40 3 5 26 34 41 - 45 1 1 7 9 46 - 50 1 2 16 19 51 - 55 1 0 6 7 56 - 60 0 1 11 12 61 - 65 0 2 4 6 66 - 70 0 0 10 10 71 - 75 0 0 0 0
> 75 0 1 3 4 unknown 10 8 41 59 TOTAL 38 44 299 381 % total 10% 12% 78% 100%
Figure 8-6 : Number of Road Accident Fatalities by Age
0
5
10
15
20
25
30
35
40
No.
of F
atal
ities
0 - 5 6 -10.
11 -15.
16 -20
21 -25
26 -30
31 -35
36 -40
41 -45
46 -50
51 -55
56 -60
61 -65
66 -70
71 -75
> 75
Age
driverpassengerpedestrian

Road Safety Cell, BRTA RTA Annual Report 2004
Page 47
Table 8-7 : Passenger Fatalities by Age and Sex
age number of passenger fatalities (years) male female total
0 - 5 0 1 1 6 - 10. 2 1 3
11 - 15. 2 0 2 16 - 20 4 1 5 21 - 25 8 0 8 26 - 30 4 0 4 31 - 35 0 1 1 36 - 40 4 1 5 41 - 45 1 0 1 46 - 50 2 0 2 51 - 55 0 0 0 56 - 60 1 0 1 61 - 65 2 0 2 66 - 70 0 0 0 71 - 75 0 0 0
> 75 0 1 1 unknown 6 2 8 TOTAL 36 8 44 % total 82% 18% 100%
Figure8-7 : Number of Passenger Fatalities by Age and Sex
0
1
2
3
4
5
6
7
Num
ber o
f Fat
aliti
es
0 - 5 6 -10.
11 -15.
16 -20
21 -25
26 -30
31 -35
36 -40
41 -45
46 -50
51 -55
56 -60
61 -65
66 -70
71 -75
> 75
Age
malefemale

Road Safety Cell, BRTA RTA Annual Report 2004
Page 48
Table 8-8 : Pedestrian Fatalities by Age and Sex
age number of pedestrian fatalities (years) male female total
0 - 5 1 8 9 6 - 10. 12 6 18
11 - 15. 16 3 19 16 - 20 20 8 28 21 - 25 28 9 37 26 - 30 30 5 35 31 - 35 20 9 29 36 - 40 24 2 26 41 - 45 5 2 7 46 - 50 11 5 16 51 - 55 5 1 6 56 - 60 8 3 11 61 - 65 3 1 4 66 - 70 8 2 10 71 - 75 0 0 0
> 75 3 0 3 unknown 30 11 41 TOTAL 224 75 299 % total 75% 25% 100%
Figure 8-8 : Number of Pedestrian Fatalities by Age and Sex
0
5
10
15
20
25
30
No.
of D
eath
0 -5
6 -10.
11 -15.
16 -20
21 -25
26 -30
31 -35
36 -40
41 -45
46 -50
51 -55
56 -60
61 -65
66 -70
71 -75
>75
Age
malefemale

Road Safety Cell, BRTA RTA Annual Report 2004
Page 49
9 NATIONAL HIGHWAY ROAD NETWORK : SAFETY PROFILE
Table 9-1 on the following pages describes the traffic and safety performance profile of links on the
National Highway network. Forty Five links (total length, 2,015.3 kilometres) are detailed in Table 9-1
and there was a total of 484 fatal accidents on these links in the year 2004. This is 25% of all fatal
accidents which occurred outside the four main cities, or 22% of all fatal accidents in Bangladesh.
9.1 TRAFFIC PROFILE
The National Highway network carries a large volume of motorised and non-motorised traffic.
Of the motorised traffic, on average,
• 55% are heavy vehicles (trucks and large buses), and
• 26.4% are two or three wheeled vehicles (CNG or baby taxis (Mishuks) and motor cycles).
The remainder (18.6%) are light vehicles (mini-buses, micro-buses, utilities and cars).
The volume of non-motorised traffic on the National Highways is on average 25% of the motorised
traffic. Non-motorised traffic is bicycles, rickshaws, rickshaw vans and push-carts.
The capacity of a road to accommodate this mix of traffic will affect its safety performance. Based
on the criteria specified in the RHD Geometric Design Standards (July, 2001), of the 60 links listed in
Table 9-1, 31 links warrant separation of the non-motorised traffic.
9.2 SAFETY PERFORMANCE PROFILE
The safety performance profile includes measures of fatal accident rate and fatality index. These
measures are designed to provide a criteria for ranking and selection of road sections (links) for road
safety improvement.
Fatal accident rate is measured in units of fatal accidents per one hundred million (108) motor
vehicle-km per year. It can be confidently used to compare the safety performance of different road
sections and to prioritise and select sites (road sections) for safety improvements. Features of using
the fatal accident rate as a performance measure for site selection are:
• identifies links where safety improvement works can yield a high reduction in the number of
fatal accidents on the road section;

Road Safety Cell, BRTA RTA Annual Report 2004
Page 50
• improvement works on several sections can have a noticeable effect on the overall reduction
of fatal accidents on the network;
• improvement works are likely to have a high economic return.
From Table 9-1, the ten National Highway links with the highest fatal accident rate are:
• N2 Link 17 Ashuganj-Sarail
• N7 Link 7 Magura-Jhenaidah
• N84 Link 65 Faridpur-Bhanga
• N58 Link 45 Dinajpur-Beldanga
• N14 Link 11 Feni-Noakhali
• N56 Link 44 Rangpur-Kurigram
• N1 Link 8 Coxs Bazar-Teknaf
• N1 Link 4 Comilla(Mainamati)-Feni
• N5 Link 38 Bogra-Gobindaganj
• N6 Link 46 Natore-Rajshahi
The fatality index of a road section is the number of fatalities per fatal accident occurring on the
section. Sites selected using the fatality index as a performance measure will be road sections
where fatal accidents are more likely to involve multiple fatalities. These will probably be sites with a
high proportion of “cross-centreline” or “off-road” type accidents resulting from dangerous overtaking
and/or over-speeding.
From Table 9-1, the five National Highway links with the highest fatality index are:
• N5 Link 34 Manikjanj-Aricha
• N52 Link 43 Bogra(Jahangirabad)-Natore
• N5 Link 342 Beldanga-Panchagarh
• N2 Link 17 Ashuganj-Sarail
• N1 Link 3 Daudhkandi-Mainamati

Road Safety Cell BRTA RTA Annual Report 2004
Page 51
Table 9-1 : A Safety Profile of the National Highways
ROAD DESCRIPTION TRAFFIC PROFILE SAFETY PROFILE
Road No Link No Road Name length AADT % HV % 2/3WV ratio
NMV/MV Fatal
Accidents (2003)
Fatalities (2003)
fatal accident
rate
fatality index fatal accident collision type
(km) (mv/day) (%) (%) (ratio) (No.) (No.) (note 3) (note 4) ped. head on rear end other
N1 1 Jatrabari-Katchpur 8.0 23,865 26.0% 18.8% 0.12 7 9 10.0 1.3 3 0 2 2 N1 2 Katchpur-Daudkandi 30.0 5,466 51.2% 1.4% 0.00 * 3 4 5.0 1.3 0 2 0 1 N1 3 Daudkandi-Mainamati 45.0 9,735 43.2% 18.2% 0.16 29 53 18.1 1.8 8 12 3 6 N1 4 Comilla (Mainamati)-Feni 64.0 6,920 69.6% 6.2% 0.03 * 42 69 26.0 1.6 17 9 2 14 N1 5 Feni-Chittagong 89.0 17,255 51.4% 14.5% 0.06 * 55 88 9.8 1.6 21 16 4 14 N1 6 Chittagong-Keranirhat 51.0 5,175 35.4% 32.3% 0.28 * 18 25 18.7 1.4 11 5 1 1 N1 7 Keranirhat-Coxs Bazar 100.0 6,051 33.2% 33.6% 0.29 * 33 38 14.9 1.2 17 9 3 4 N1 8 Coxs Bazar-Teknaf 79.0 1,233 27.7% 22.2% 1.63 10 14 28.1 1.4 7 0 0 3 N14 11 Feni-Noakhali 49.0 5,528 40.0% 24.7% 0.24 * 29 35 29.3 1.2 17 5 3 4 N16 12 Chittagong-Hathazari 12.0 16,497 33.7% 28.1% 0.25 5 7 6.9 1.4 3 1 1 0 N16 13 Hathazari-Rangamati 66.0 4,173 33.1% 31.2% 0.39 5 5 5.0 1.0 3 1 0 1 N18 14 Keranirhat-Bandarban 22.4 4,859 48.5% 17.1% 0.08 2 2 5.0 1.0 2 0 0 0 N2 15 Katchpur-Shahepratap 35.0 9,494 44.8% 11.6% 0.22 * 2 2 1.6 1.0 0 1 0 1 N2 16 Shahepratap-Bhairab 38.9 6,182 38.7% 17.2% 0.21 * 2 2 2.3 1.0 0 1 0 1 N2 17 Ashuganj-Sarail 12.0 3,707 50.1% 22.3% 0.12 * 10 19 61.6 1.9 6 1 1 2 N2 18 Sarail-Sreemangal 97.6 4,419 38.4% 23.4% 0.26 * 15 18 9.5 1.2 9 4 1 1 N2 19 Sreemangal-Moulvibazar 18.0 6,006 35.8% 33.5% 0.13 5 5 12.7 1.0 1 2 0 2 N2 20 Moulvibazar-Sylhet 62.0 5,207 39.8% 23.3% 0.10 * 4 4 3.4 1.0 1 2 1 0 N3 24 Tongi-Joydevpur 12.5 28,420 39.7% 14.1% 0.62 3 3 2.3 1.0 2 0 1 0 N3 25 Joydevpur-Mymensingh 90.0 3,674 47.7% 29.1% 0.48 3 5 2.5 1.7 2 0 1 0 N4 27 Kaliakoir-Tangail 43.0 10,747 48.1% 18.4% 0.29 5 5 3.0 1.0 4 1 1 1 N41 31 Mymensingh-Madhupur 48.0 14,172 13.4% 72.0% 0.13 2 3 0.8 1.5 0 1 0 1 N5 32 Mirpur Bridge-Nabinagar 22.0 10,960 32.0% 16.9% 0.09 * 7 7 8.0 1.0 4 1 1 1
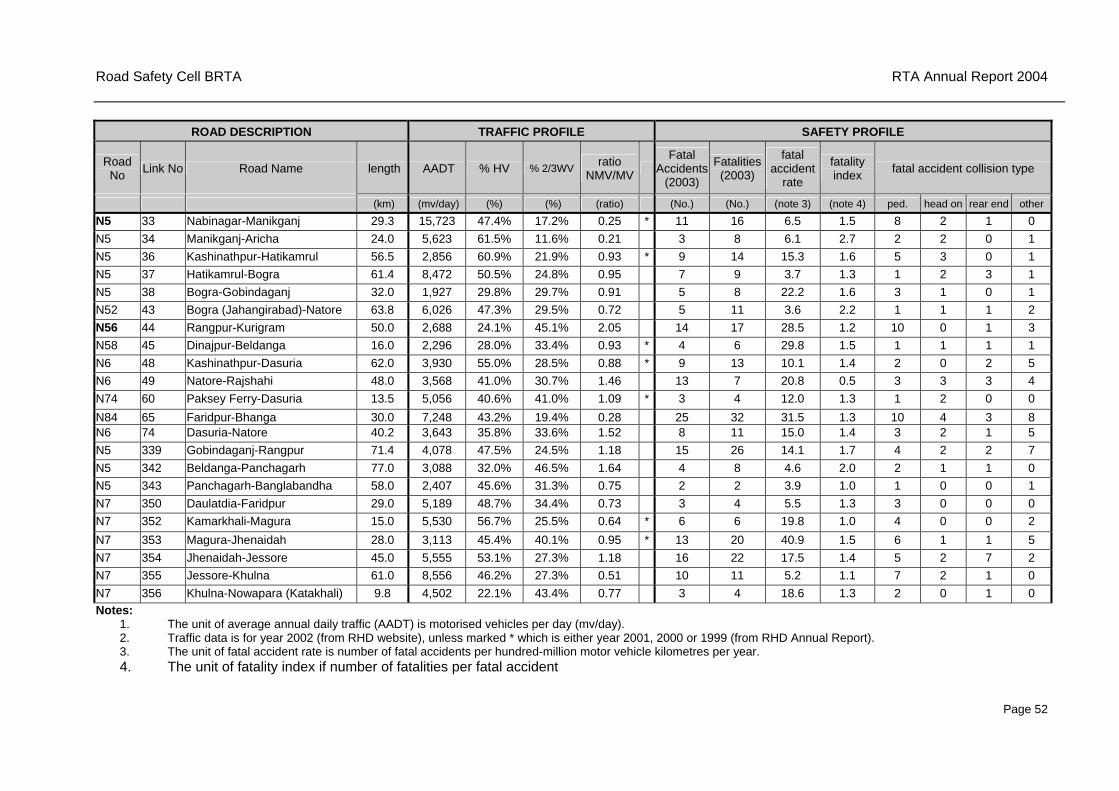
Road Safety Cell BRTA RTA Annual Report 2004
Page 52
ROAD DESCRIPTION TRAFFIC PROFILE SAFETY PROFILE
Road No Link No Road Name length AADT % HV % 2/3WV ratio
NMV/MV Fatal
Accidents (2003)
Fatalities (2003)
fatal accident
rate
fatality index fatal accident collision type
(km) (mv/day) (%) (%) (ratio) (No.) (No.) (note 3) (note 4) ped. head on rear end other N5 33 Nabinagar-Manikganj 29.3 15,723 47.4% 17.2% 0.25 * 11 16 6.5 1.5 8 2 1 0 N5 34 Manikganj-Aricha 24.0 5,623 61.5% 11.6% 0.21 3 8 6.1 2.7 2 2 0 1 N5 36 Kashinathpur-Hatikamrul 56.5 2,856 60.9% 21.9% 0.93 * 9 14 15.3 1.6 5 3 0 1 N5 37 Hatikamrul-Bogra 61.4 8,472 50.5% 24.8% 0.95 7 9 3.7 1.3 1 2 3 1 N5 38 Bogra-Gobindaganj 32.0 1,927 29.8% 29.7% 0.91 5 8 22.2 1.6 3 1 0 1 N52 43 Bogra (Jahangirabad)-Natore 63.8 6,026 47.3% 29.5% 0.72 5 11 3.6 2.2 1 1 1 2 N56 44 Rangpur-Kurigram 50.0 2,688 24.1% 45.1% 2.05 14 17 28.5 1.2 10 0 1 3 N58 45 Dinajpur-Beldanga 16.0 2,296 28.0% 33.4% 0.93 * 4 6 29.8 1.5 1 1 1 1 N6 48 Kashinathpur-Dasuria 62.0 3,930 55.0% 28.5% 0.88 * 9 13 10.1 1.4 2 0 2 5 N6 49 Natore-Rajshahi 48.0 3,568 41.0% 30.7% 1.46 13 7 20.8 0.5 3 3 3 4 N74 60 Paksey Ferry-Dasuria 13.5 5,056 40.6% 41.0% 1.09 * 3 4 12.0 1.3 1 2 0 0 N84 65 Faridpur-Bhanga 30.0 7,248 43.2% 19.4% 0.28 25 32 31.5 1.3 10 4 3 8 N6 74 Dasuria-Natore 40.2 3,643 35.8% 33.6% 1.52 8 11 15.0 1.4 3 2 1 5 N5 339 Gobindaganj-Rangpur 71.4 4,078 47.5% 24.5% 1.18 15 26 14.1 1.7 4 2 2 7 N5 342 Beldanga-Panchagarh 77.0 3,088 32.0% 46.5% 1.64 4 8 4.6 2.0 2 1 1 0 N5 343 Panchagarh-Banglabandha 58.0 2,407 45.6% 31.3% 0.75 2 2 3.9 1.0 1 0 0 1 N7 350 Daulatdia-Faridpur 29.0 5,189 48.7% 34.4% 0.73 3 4 5.5 1.3 3 0 0 0 N7 352 Kamarkhali-Magura 15.0 5,530 56.7% 25.5% 0.64 * 6 6 19.8 1.0 4 0 0 2 N7 353 Magura-Jhenaidah 28.0 3,113 45.4% 40.1% 0.95 * 13 20 40.9 1.5 6 1 1 5 N7 354 Jhenaidah-Jessore 45.0 5,555 53.1% 27.3% 1.18 16 22 17.5 1.4 5 2 7 2 N7 355 Jessore-Khulna 61.0 8,556 46.2% 27.3% 0.51 10 11 5.2 1.1 7 2 1 0 N7 356 Khulna-Nowapara (Katakhali) 9.8 4,502 22.1% 43.4% 0.77 3 4 18.6 1.3 2 0 1 0 Notes:
1. The unit of average annual daily traffic (AADT) is motorised vehicles per day (mv/day). 2. Traffic data is for year 2002 (from RHD website), unless marked * which is either year 2001, 2000 or 1999 (from RHD Annual Report). 3. The unit of fatal accident rate is number of fatal accidents per hundred-million motor vehicle kilometres per year. 4. The unit of fatality index if number of fatalities per fatal accident

BRTA Road Safety Cell RTA Annual Report 2004
Page 53
10 COMMENTS AND DISCUSSION
10.1 FATAL PEDESTRIAN ACCIDENTS
The statistics contained in this report show that for roads in either an urban or rural environment the
main cause of fatal accidents is a vehicle hitting a pedestrian (Figure 4-1). The pattern of half of all
fatal accidents being collisions where a vehicle hits a pedestrian is evident in all Divisions and Cities.
That type of accident accounts for 54% of all fatal accidents on average. The range is 24%-76%.
Dhaka City (76%) and Khulna City are the upper end of this range (refer Table 4-3).
The statistics show that over half of the fatal victims of road accidents are pedestrians (refer Table
8-1), and measures to create a safer environment for pedestrians (e.g. speed limit zones) or safer
pedestrian facilities (e.g. footpaths, full width shoulders, pedestrian over-bridges) should be
provided.
10.2 MULTIPLE FATALITY ACCIDENTS
Following pedestrian fatalities, head-on, rear end and overturning are other major collision types in
the rural areas that account for a high proportion of fatal accidents (Figure 4-1). Dangerous driving,
reckless overtaking and over-speeding are some of the factors responsible for these types of
accidents.
The high numbers of persons killed on average in head-on and overturned vehicle types of fatal
collisions (Table 4-5, high fatality index), with the high occurrence of these fatal collision types,
means that dangerous driving, reckless overtaking and over-speeding are issues to be targeted in
road safety driver education and enforcement programmes.
10.3 BUSES AND HEAVY VEHICLES
Table 6-2 demonstrates that a disproportionate number of fatal accidents involve mini-buses, buses
and trucks; and that they are the predominant types of vehicles involved in fatal accidents.
To target this feature of accident occurrence, driver and helper education programmes should target
companies and organisations operating and plying buses and heavy vehicle.

BRTA Road Safety Cell RTA Annual Report 2004
Page 54
11 CONCLUSION
11.1 ROAD SAFETY INITIATIVES
The profile of fatal road accidents remains similar to the profile reported in previous years, namely:
• Fatal accidents mainly occur on national highways;
• Predominantly, fatal accidents involve vehicles hitting pedestrians;
• The greatest number of fatal accidents by far involve heavy vehicles and buses;
• The highest number of fatalities per accident occurs when vehicles collide head on;
• Persons who are killed as the result of a road accident are predominantly young pedestrians (children less than 10 years old), adult male pedestrians, and passengers.
Whilst the profile of fatal road accidents remains more or less as before, there will be no change in the recommendations for road safety initiatives to that reported in previous annual reports.
Table 11-1 on the following page is a list of recommended road safety initiatives which focus on
providing safer roads, safer people and safer vehicles. These initiatives can be applied nationally
across all parts of the network, but it is recommended, because resources are limited, that their
application be targeted to sections of the network which will yield the greatest benefit in terms of
potential accident reduction. Section 9 herein outlines a targeting process for National Highways. The
process can be applied to other parts of the road network.
11.2 ACCESS TO THE RTA DATABASE
The National Road Traffic Accident (RTA) database contains several fields of coded information with
each field having several filed values. Full details of the database coded data fields and field values
are presented in the National RTA Report 2004.
The RTA database is available for general use. It can be accessed by making a request to The
Manager of the Road Safety Cell (address details are on the following page). Requests should be
marked for the attention of the Accident Data Analyst.

BRTA Road Safety Cell RTA Annual Report 2004
Page 55
Table 11-1 : Recommendations for Road Safety Initiatives Road Safety
Attribute Recommended Road Safety Initiatives Comment
a. Rationalisation of inappropriate activities on, adjacent to or near the road
Different parts of the road are designed for different purposes. Inappropriate activities are those which reduce the capacity of any part of the road to serve its design purpose.
b. Provision of facility where appropriate for conflicting road uses
Conflicting road uses are ,for example, turn and through traffic; stopped and through traffic; non-motorised and motorised traffic; slow and faster traffic; pedestrians and vehicles.
c. Establishment of speed limit zones where warranted
Speed limit zones can only be established where the nature and extent of adjacent activities warrants reduced vehicle speed. In other cases, initiative (a) applies.
Safer Roads
d. Provision of road signs and pavement markings throughout the network, and removal of any obstruction to the placement and effective visibility of signs
The BRTA Traffic Signs Manual contains the standards for road signs and pavement markings.
e. Education of pedestrians, particular children, on safe practices when near the road
An education programme should focus in communities near the national highways.
f. Education of drivers, particularly heavy vehicle and bus drivers, on road rules and safe driving practices
Sustainable education requires production of a highway code in a format appropriate for all road users. Safer People
g. Increased enforcement of Regulations regarding excessive speed (especially in speed limit zones) and reckless or dangerous driving
Sections 142 (Driving at excessive speed) and 143 (Driving recklessly or dangerously) of MVO 1983 apply.
Safer Vehicles
h. Increased enforcement of Regulations regarding unsafe vehicle condition and overloading.
Sections 86 (Limits of weight) and 149 (Using vehicle in unsafe condition) of MVO 1983 apply.
Road Safety Cell Bangladesh Road Transport Authority Old Airport Road Allenbari, Tejgoan Dhaka Bangladesh