Embed Size (px)
Citation preview

Road Maintenance in the PAG Region: Challenges and Opportunities
Pima Association of Governments
February 22, 2013
FINAL REPORT

Road Maintenance in the PAG Region: Challenges and Opportunities
Pima Association of Governments
177 N. Church Avenue, # 405
Tucson, AZ 85701
John Liosatos, PAG Project Manager
520-792-1093
Curtis Lueck & Associates 5460 West Four Barrel Court
Tucson, AZ 85743 520-743-8748
CLA Project No. 2012.10
February 22, 2013
Final Report
This document does not constitute a standard or specification.
TABLE OF CONTENTS
1: INTRODUCTION ............................................................................................................. 1
Overview ......................................................................................................................... 1
2: ROAD MAINTENANCE IN THE REGION ....................................................................... 3
Why is Road Maintenance Important? ............................................................................ 3
Current Status of Roadways ........................................................................................... 6
PAG’s Role in Roadway Maintenance and Data Collection ............................................ 8
Legal Authority and Duty for Road Maintenance in Arizona ......................................... 11
3: BEST PRACTICES ....................................................................................................... 13
Cities and Towns .......................................................................................................... 16
Bay Area Metropolitan Transportation Commission ..................................................... 19
ADOT-FHWA Stewardship Agreement ........................................................................ 20
4: SURVEY AND LITERATURE SEARCH ....................................................................... 21
Agency Survey Summary ............................................................................................. 22
Recent Research on Road Maintenance and Asset Management ............................... 23
5: FUNDING FOR ROADWAY MAINTENANCE .............................................................. 28
Federal Funds ............................................................................................................... 28
State Funds .................................................................................................................. 29
HURF Bonds and Outstanding Debt Service ................................................................ 31
Local Funds .................................................................................................................. 33
Improvement Districts and Community Facility Districts ............................................... 34
6: RECOMMENDATIONS ................................................................................................. 36
Quantify Pavement Conditions in the Region ............................................................... 36
Continue to Investigate Maintenance Needs and Funding Options .............................. 36
Emphasize Life-Cycle Programming .......................................................................... 386
Set Aside Funding for Maintenance ............................................................................ 387
Expand In-House Resources in Pavement Management ......................................... 387
Involve PAG Members in Pavement Management Discussions ................................. 398
Regional Asset Management/Pavement Management Programming ........................ 398
Appendix A – Suggested Reading
Appendix B - Survey Results
Appendix C – FHWA Primer on Road Maintenance

1
1: INTRODUCTION
Overview
This white paper has been prepared to address the current state of road maintenance in the
region, with emphasis on effective strategies and funding availability. It describes current
pavement management activities in the PAG region, the general condition of public streets, and
proposes recommendations for a regional roadway maintenance program to be administered or
facilitated by PAG. Examples of good and efficient pavement management techniques, both here
and elsewhere, are provided. Current and potential funding sources are identified for this
purpose, and general policy recommendations for budgeting, administration and implementation
of a regional plan are provided. The bottom line is that road maintenance is currently
underfunded which will cost us all much more in the long run. Additional analysis will be provided
following direction from the Regional Council.
The PAG region includes almost 1 million residents in unincorporated Pima County and the
communities of Tucson, Oro Valley, South Tucson, Marana, and Sahuarita, the Pascua Yaqui Tribe
and the Tohono O’odham Nation. Due to severe funding constraints, road maintenance has
slipped to the point that some roads are now beyond repair and need total reconstruction.
Although some of the jurisdictions have done a better job than others at road maintenance,
public outcry is for fewer potholes and smoother roads. This is common in today’s economy, yet
the disrepair is also a disincentive to economic recovery.
Although PAG “owns” no roadways, they are involved in maintenance nonetheless. For instance,
PAG has shown a leadership role by facilitating regionwide pavement condition data collection.
The regional Pavement Management System (PMS) program does include assistance in the
development of capital programs for pavement maintenance of individual jurisdictions at the
2
request of the jurisdiction. As an example, the Town of Oro Valley, with assistance from regional
TDOT staff developed a 5 year capital program for pavement maintenance.1
Further, the distribution of state and federal highway funds is facilitated through PAG’s
committee structure. PAG recognizes the need to enhance investment in road maintenance
regionally, and to investigate strategies to optimize maintenance funding and programming.
Their coordinating role can be expanded, as witnessed successfully in other regions, especially
the San Francisco Bay area.
1 See http://www.orovalleyaz.gov/Assets/Pavement+Management+Presentation.pdf which illustrates how a
reasonable maintenance level minimizes overall maintenance costs.
3
2: ROAD MAINTENANCE IN THE REGION
All roads deteriorate over time due to environmental conditions and the volume and type of
traffic using the roadway. Without proper maintenance, roadways wear out prematurely. The
rate at which deterioration occurs is a function of these factors, as well as the nature and
frequency of preventative maintenance (PM) activities.
Road maintenance can be defined as follows:
Road maintenance is broadly defined as work accomplished to preserve or extend
the roadway’s life until major rehabilitation or complete reconstruction is
performed. Maintenance is classified by function as either routine or preventive.
Preventive maintenance preserves rather than improve the capacity or strength of
the pavement structure. In order for preventive maintenance to be effective, it
should be applied to structurally sound pavement, before the pavement displays
significant amount of environmental distress such as raveling, oxidation, and block
cracking. Timely treatments prove to be the most cost effective. Routine
maintenance more typically consists of pothole repair, patching, sweeping, sign
repair and restriping, and storm damage mitigation.2
Why is Road Maintenance Important?
Investing in repair and preservation actively reduces the scale of future costs. According to the
American Association of State Highway and Transportation Officials (AASHTO), every $1 spent to
keep a road in good condition avoids $6-14 needed later to rebuild the same road once it has
deteriorated significantly.3
2Adapted from “State of the System, Roadway Management System, FY 2011”, Maricopa County 3 American Association of State Highway and Transportation Officials (AASHTO) and The Road Information Project. (2009). “Rough Roads Ahead: Fix Them Now or Pay for It Later.” http://roughroads.transportation.org , as cited in http://www.smartgrowthamerica.org/documents/repair-priorities.pdf

4
The value of pavement maintenance to a public works department and its jurisdiction is easily
discerned. The safety of the traveling public, the economic benefit of a good road system and
the life cycle costs of the pavement are the major considerations in establishing and maintaining
a quality and cost-saving pavement management system.
Road maintenance emphasizes asset preservation, not upgrades. It is important from many
perspectives. First and foremost is public safety, which declines as surface conditions degrade,
road cleanliness diminishes, and the condition of traffic signs and markings fade. Properly timed
maintenance decreases overall life cycle cost of the infrastructure investment, allowing more to
be spent in the long run on capacity and upgrade projects. Roads in good condition have higher
capacity, are quieter, safer for all users, and decrease pollution. The appendix contains a brief
primer on pavement management authored by the Federal Highway Administration. 4
From a landowner’s view point, poorly maintained roads impact property values, which can have
a deleterious impact on local property taxes. Poor roads discourage economic development,
especially when developers have a choice of regions with better roads. From the road users’
perspective, poorly maintained roads add to vehicle operating costs. AAA, AASHTO, and others
claim that rough roads can add $400 to $750 per year to the cost of vehicle operation. Closer to
home, data from a national report shows that Tucson area drivers pay $288 more per year to
operate their cars than Phoenix drivers, all because our roads have a lesser state of repair.5
In urban areas with a concentration of rough roads, extra vehicle operating costs are higher, and
larger vehicles will see a greater increase in operating costs due to rough roads.6 According to a
very recent report, 7
4 Obtained from http://www.fhwa.dot.gov/infrastructure/asstmgmt/pmprimer.pdf 5 America's Roughest Rides and Strategies to make our Roads Smoother – September 2010, available at http://www.tripnet.org/national-info-reports.php 6 Transportation California, “Poor Road Quality Imposes Hidden Tax on California Motorists”, 2004; Rough Roads
Ahead – Fix Them Now or Pay for it Later, AASHTO, 2009. 7 NCHRP Report 720, Estimating the Effects of Pavement Condition on Vehicle Operating Costs, 2012

5
“Vehicle operating costs are part of the costs that highway agencies must
consider when evaluating pavement-investment strategies. For conventional
vehicles, these costs are related to fuel and oil consumption, tire wear, repair
and maintenance, and depreciation; emerging vehicle technologies may involve
other cost items. These costs depend on the vehicle class and are influenced by
vehicle technology, pavement-surface type, pavement condition, roadway
geometrics, environment, speed of operation, and other factors. “
An Inside Tucson Business opinion by former City of Tucson councilperson Carol West describes
recent challenges the City of Tucson experienced. She stated that,
“For years, we have neglected the city’s infrastructure in favor of projects more
visible to the public. This has been to our detriment. Rapid growth caused more
focus on new public streets in suburban areas, leaving fewer dollars for midtown
Tucson streets in need of maintenance and repair. Also, various utility companies
cut streets to make repairs, and the pavement replacements sometimes are not up
to city standards.”
“There have been suggestions the private sector voluntarily pay to repair some
potholes. Others have thought about taking money from transit for street
repairs. But some people who once drove to work are now helping to diminish
wear-and-tear on local streets because they now ride Sun Tran.”
“Lessons for elected officials: neglecting infrastructure improvements hampers
public safety on our streets...as the economy begins to turn around,
neighborhood streets must be a priority.”8
8 http://www.insidetucsonbusiness.com/opinion/columnists/carol_west/potholes-r-us---city-s-street-management-
plan/article_07047300-5117-51a0-b83d-4e1b903ebfad.html

6
Current Status of Roadways
Road maintenance, reconstruction, and new construction projects compete for available funding.
This competition is intensified by funding limitations resulting in part from the global economic
downturn. Maintenance often is delayed until ride quality becomes unbearable, resulting in
public outcry followed by governmental response.
Deferred maintenance is a false economy because “catch up” repairs are much more expensive
than strategic investments. For instance, the cost to return asphaltic pavement to excellent
condition rises exponentially over time. The chart at below shows that it costs about a fourth as
much to
rehabilitate a ten
year old facility as
a 17 year old road
and only about 2%
as much as a 30
year old road. 9
Tucson staff
indicated that 25
percent of major
roadways and 55 percent of residential streets are failed or failing.10 Repairs would cost about
$850 million over the next ten years to bring these streets up to excellent condition. In response,
the City asked voters to approve a $100 million General Obligation bond program for road
maintenance. Termed “Proposition 409”, it was narrowly approved by a 50.3% margin in the
9 Source – RTA presentation to APWA, January 2012
10 Inside Tucson Business, referenced from http://www.insidetucsonbusiness.com/news/top_stories/more-than-
half-of-tucson-streets-in-poor-condition-how/article_b66a4c5e-8a35-11e1-9494-0019bb2963f4.html

7
November 6, 2012 general election. 11 Tucson staff is now implementing the repair program
through a bond oversight committee.
Pima County staff recently updated the pavement condition analysis of all County roads using
historic data from 2009 through 2011. Findings were reported to the County Administrator, and
they clearly show that 1,192
of 1,803 road miles (i.e.,
66%) were in poor-to-failed
condition. 12 The County
Administrator subsequently
transmitted a memorandum
to the Board of Supervisors
indicating that, “The
condition of our paved
highways is mixed to
poor....we also have a
significant number of
arterial and collector
roadways that are in need of major maintenance and repair. In addition, most local paved streets
have not had adequate maintenance in the last 10 years. Significant investments are necessary
to keep our paved highway transportation system from deteriorating further.13
The City of South Tucson relies on limited funding for roadway maintenance because of its small
area and population, but has received pavement improvements as a part of the 1997 Pima
County Bond Program which specifically included South Tucson street repairs. Marana, Oro
11 See http://tucsoncitizen.com/community/2012/11/19/prop-409-bonds-for-city-street-improvement-passes-by-954-votes/ 12 See http://www.pima.gov/cob/e-agenda/04102012/Ra-6%20Late%20Material.pdf 13
County Administrator BOS Memorandum, April 10, 2012;” Need for Increased Investment in Transportation and Highway Maintenance”

8
Valley, and Sahuarita also seem to have provided a higher level of maintenance, as discussed
later in the report and as noted in response to a survey conducted for this study. Other
jurisdictions, including Maricopa County, have managed to maintain their roadway system better
because their funding position is stronger and they have consistently made maintenance a high
priority.
Currently, each PAG jurisdiction determines its own needs. This can become obvious at a
jurisdictional boundary where a road is in different state-of-repair on each side of the line. One
way to remedy this would be to establish a regional process by which roadways can be evaluated
for improvement, and then assigning priorities to improve roadways in a coordinated manner
based on need.
PAG’s Role in Roadway Maintenance and Data Collection
PAG’s comprehensive regional planning program is implemented through its Overall Work
Program (OWP). The OWP promotes efficient system management and operations, and
emphasizes the preservation of the existing transportation system. The Regional Transportation
Plan identifies and monitors resources available for maintenance and development of the
regional transportation system including strategies for developing additional resources. This is

9
accomplished, in part through Task 92 – Regional Pavement Management and Systems Data.
Task 92 is provided to the region as a “pass-through-funding” activity conducted by the City of
Tucson. The PAG Regional Transportation Plan (RTP) specifically identifies ongoing requirements
for annual average maintenance and operations (M&O) expenses as well as project specific
requirements associated with the development of new or improved transportation facilities. The
RTP includes maintenance of effort provisions in the financial constraint analysis. Increased levels
of M&O also have been included in the mix of new expenditures evaluated in the Plan14
PAG has taken an assertive role in helping its member jurisdictions monitor pavement
conditions. The PAG Roadway Maintenance program assists them by providing data and tools for
assessing roadway conditions. Pavement data is collected for all federal-aid roadways and local
streets within the region with the City of Tucson’s Automated Road Analyzer, or ARAN, van. The
series 4300 van collects data at 15 mph, including ride quality, rutting, concrete pavement
faulting, grade and cross-slope, real time video imagery, and road right-of-way features. Video
logs are also integrated into the TDOT’s online map service for users to view. More information
about the ARAN van housed and maintained by the City of Tucson is available at
Transview.org/aran.”15
The ARAN van is able to
accomplish this by using
a variety of sensors, a
sub-meter global
positioning system,
video and machine vision systems, and onboard computers. The data is provided to jurisdictions
based on common standards such as the International Roughness Index (IRI), and Photographic
Analysis of Asphalt Surfaces for Survey Evaluation Ratings (PA²S²ER) of distresses, based on
14 Source, PAG FY 2012-2013 Overall Work Program and Budget
15 Also see the manufacturer’s website: - http://www.roadware.com/

10
windshield surveys. The van has been used so far by all jurisdictions except for the Tohono
O’odham nation. Jurisdictions can schedule use of the van according to established procedures.
Three TDOT staff members are committed to this program, and there is budget capacity for a
fourth staff member. Staff collects the data, and coordinates the information for use by the
jurisdictions. STP funding (pass-through money from PAG) pays for the program at about
$450,000 per year. There is a 5.7% City of Tucson matching amount.
The asset management software used by TDOT is “Cartegraph”, and all jurisdictions receive their
pavement data through this program. Each jurisdiction has its own site license for the software.
Other assets such as signs and signals can also be inventoried with this software. 16
A new ARAN 9000 van was recently purchased by PAG for regional use. It will be utilized soon for
limited data collection, and will be
fully active in about a year. Both
the original and the new vans will
be available for data collection.
Because of liability issues, a
trained TDOT employee must
operate the vans regardless of the
jurisdiction to be evaluated.
Data collection is crucial to
establishing a pavement
management system. The FHWA
indicates that several cycles of data collections are needed to establish a condition trend line,
which can then be used for cost effective maintenance investments.
16 For more information, see http://www.cartegraph.com/index.php/solutions/pavementview

11
Due to extreme funding limitations and other factors, there is a need to examine a more
integrated and regionalized effort to preserve roads of all functional classification, including those
corridors that cross jurisdictional boundaries. Since PAG already acts as a data clearinghouse and
provider of transportation data, its continuing leadership role in pavement management is
crucial. From PAG’s website: “The Regional Pavement Management System provides PAG
member agencies with the appropriate tools and data to assess the deterioration of publicly
owned roadways and other roadway infrastructure. Accurate management of the multi-billion
dollar roadway infrastructure is essential for allocating and optimizing the impact of available
maintenance budgets.”17 Although PAG does serve as a technical resource in pavement
management for the region, it does not coordinate maintenance activities by and between its
member jurisdictions.
Legal Authority and Duty for Road Maintenance in Arizona
Arizona municipalities and counties are empowered to plan, open, and maintain public streets
pursuant to ARS §9-240 and ARS §11-251, respectively. The statutes further define funding
options, including general obligation bonds, but there is no apparent mandate to maintain roads
to a given performance standard. Instead, the presumption for adequate maintenance and safe
conditions results from tort liability (law suits) and risk management practices. According to one
source, the total dollar amount of claims against US highway agencies in a typical year is between
$50 billion and $60 billion. 18 This can be minimized by managing risk including preserving
pavement conditions.
To minimize liability, transportation departments and elected officials must be aware of their
duty to maintain the roadway systems in a condition reasonably safe for public travel by road
users who are themselves exercising ordinary care. As a further condition for recovery it is
17Pima Association of Governments Regional Pavement Management, referenced at: http://www.pagnet.org/Programs/TransportationPlanning/RegionalSafetyandOperations/RegionalPavementManagementSystem/tabid/365/Default.aspx 18 “Tort Liability and Risk Management”, in FHWA Course on Bicycle and Pedestrian Transportation, 1998

12
necessary to establish that the State or subordinate governmental agency had either actual or
constructive notice of the defect and that they responded in a reasonable time to take remedial
action. 19 Local jurisdictions, therefore, have a duty to effectively program and fund road
maintenance, and to be ready to make prompt repairs when deficiencies become apparent.
19 Road Management and Engineering Journal; NCHRP 20-6, Legal Problems Arising Out of Highway Programs

13
3: BEST PRACTICES There are abundant technical literature and software tools for asset management, including
pavement management. The Federal Highway Administration has a website dedicated
exclusively to this discipline, and they offer conferences and local courses for practitioners.20
This is such an important topic across the country that the first national conference on
pavement preservation was held late this summer in Nashville. 21 Both the FHWA website and
the conference discuss best practices, including regional partnerships in pavement
management. In addition, scheduled sessions include topics such as flexible and rigid
pavements; existing and innovative materials; communications and marketing; and short-term
and long-term planning. Local agency delegates will be particularly interested in two sessions
specially planned for them – “Best Local Agency Practices” and “Implementing a Local Agency
Program”. Proceedings of the conference should be available by the end of the year.
More locally, several communities in Arizona have Pavement Management Systems (PMS) in
place, through which pavement preservation, rehabilitation or reconstructions are prioritized,
funded and scheduled based on adopted pavement condition criteria. Maricopa County, the
City of Chandler and the City of Phoenix have well-established pavement management systems
by which they regularly schedule maintenance activities to reduce the amount of roadway
reconstruction.
Interestingly, most communities in the PAG region do have robust tools to manage pavement
life-cycle costs. The City of Tucson, for example, began a sustainability program for this
purpose a few years ago, but this program was discontinued due to dwindling, and
reprioritization of funds. Pavement conditions have slipped due to lack of adequate funding,
not lack of awareness.
20 See for example http://www.fhwa.dot.gov/asset/index.cfm 21 See http://nationalpavement2012.org

14
Maricopa County
Maricopa County prepares a State of the System (SOS) report every year which documents the
quality of roadway infrastructure and operational conditions of the County roadways. The most
recent report is for FY 2011 and indicates that over 80% of the County’s roadways were rated
Excellent to Good on their Pavement Condition Rating (PCR), with less than 1% rated fair to
poor.22
According to the 2011 SOS report, “The Road Management Section evaluates pavement
conditions for surface distress every 12-18 months for arterial roads and every other year for
local roads. Half of the local roads are evaluated each year. The ratings range from 0 to 100
with 100 being a new pavement with no distress. The result allows for quantifying the overall
pavement condition of the road network. “
MCDOT also evaluates roadways based on the International Roughness Index (IRI). MCDOT uses
a Laser Road Profiler (LRP) equipped with triple (3) lasers, one in each wheel track and one in
the mid-lane to collect IRI data. Annually the MCDOT Road Management Section collects the IRI
for each arterial road segment with a length greater than a quarter of a mile. The IRI values are
scored for each road segment on a scale from 1 to 500 with 500 representing an extremely
rough road. IRI values are categorized by performance subgroups and the percentage of each
group can be seen in Figure 2; IRI Ratings. MCDOT utilizes the PCR and IRI ratings to forecast
preventive maintenance programs and Transportation Improvement Program (TIP) planning.
The Road Management Section collects most of the details for each arterial road segment. The
sufficiency rating identifies how well each road segment compares to the MCDOT Roadway
Design Manual (RDM) standards. Ratings for each category are combined per road segment and
scored on a scale from 0 to 100, 100 representing a road in compliance with the RDM
standards.
22 http://www.mcdot.maricopa.gov/technical/eng-manuals/2011_SOS_Report.pdf

15
The sufficiency ratings of arterial roads are updated only after major improvements or
reconstruction of the road. New construction, widening, or significant improvement to the
safety issues such as, bottleneck, drainage, vertical and horizontal sight distance are required to
impact the rating.
Pinal County
Pinal County, through its Department of Public Works, maintains a transportation system of
over 2,000 miles including established county highways, roads dedicated to the county through
an approved plat, and non‐standard public roads constructed prior to 1975. There are many
unpaved roads (over half of all roads) throughout Pinal County, and typical roadway
maintenance includes the application of dust palliative for dust control. Pinal County has a
specific process for roadway surfacing projects.
Source: Pinal County

16
Cities and Towns
Town of Oro Valley
Oro Valley staff conducted detailed analysis using ARAN van data and recommended an
investment strategy to its Mayor and Council. The analysis showed that the optimal payment
condition was achieved at an “Overall Condition Index” of 80. This was achievable with an
average annual expense of $1.2 million. If the roads were maintained at a lower level, costs
increased and ride quality suffered. If maintained at a higher level, cost also would rise without
a perceptible increase in pavement quality. Staff also determined the cost-to-cure after five
years of lesser maintenance. For OCI 80, spending only $500,000 per year results in a $25
million cost-to-cure at the end of five years. If maintenance funding is eliminated entirely for
five years, the cost to cure
is $65 million. Because of
the analysis and
presentations to elected
officials, the Town has
invested regularly to
maintain the
recommended OCI 80
pavement condition.

17
Flagstaff
According to Flagstaff’s website, “The Street Maintenance Program includes street overlay, chip
seal and crack sealing construction to preserve and maintain existing asphalt street and parking
lot pavements. The contract work also includes removal and replacement of curb returns and
sidewalks at many locations on the streets overlaid to bring these streets into compliance with
the Americans with Disabilities Act (ADA). Traffic signal detection modifications may be
required where the work disturbs existing detection equipment. Utility adjustments and
pavement marking are also included in the work.
The goal of the Street Maintenance Program is to use the available funds in the most efficient
manner to lengthen the service life of the City street pavements and avoid costly pavement
reconstruction. The ADA improvements provide improved access for disabled citizens and
visitors along existing streets and provide compliance with Federal requirements.
Street Maintenance is responsible for the safe passage of all City-owned streets. The Street
Section maintains 634 lane-miles of asphalt streets and 28 lane-miles of dirt roads. The City is
not responsible for maintenance on state roadways, except for 89N from Fanning to Trails End
and East Route 66 (behind the mall).”23
Mesa
According to the official website of Mesa, Arizona, “The Pavement Management Program is an
Information Management System, which allows the City to track the history, surface condition
and distresses of every street in Mesa. Pavement condition surveys are performed each year on
over 1,200 miles of streets. Information from the annual surveys identifies specific areas where
various types of preventive maintenance treatment, such as slurry seal, acrylic seal or other
sealcoats, can be applied. The surveys also identify areas requiring more aggressive
rehabilitation projects like a rubberized asphalt overlay or partial reconstruction.”
23 http://www.flagstaff.az.gov/index.aspx?NID=1518

18
“Each year over 6,000,000 square yards of needed work is identified, prioritized and delegated.
One goal is to establish a balanced treatment forecast plan for the street repair and preventive
maintenance program that will help to maintain targeted pavement condition levels. These
levels are based on a Pavement Condition Index (PCI) of 0 to 100, with 100 being excellent and
0 being failed. The PCI is calculated from data collected during the annual pavement condition
survey. The City has been collecting pavement condition, inventory and maintenance history
information on Mesa streets for over 18 years with details and quality of data improving with
each year.”24
Goodyear
The City utilizes a pavement management process that begins with assessing the condition and
determining the PCI rating of each street. Ratings range from 0 to 100 (a perfect street has a
100 rating) and is established by considering several technical conditions. Each PCI rating
indicates a specific type of "treatment" for each road.
There are three general categories of treatment: 1) seals, 2) overlays, and 3) reconstructions
(the complete rebuilding of the pavement roadway). The City uses a Pavement Management
System software to prioritize street needs and to determine the most efficient and effective use
of funds. They decide what kind of treatment is used based on a number of factors, including
street type, street use (i.e., number of lanes, total traffic volumes and heavy truck volumes), PCI
rating and cost. The result of this analysis is a five-year list of roadways and treatment
schedules that maximizes citywide pavement life using available and anticipated funding.
Addressing the pavement needs with appropriate, less costly treatments can extend the
lifespan of a roadway and postpone treatments that add cost.
The current average PCI rating for all City streets is 75. Maintaining this rating would require
annual funding of $2 million per year. The City focuses on the most cost-effective strategies to
maintain the best pavement condition Citywide, based on the funds available.
24 http://mesaaz.gov/transportation/asphalt.aspx

19
As the number of lane-miles of City streets increases and the street inventory ages, additional
funding will be needed to maintain the average PCI rating. If funding is deferred, the cost of
restoring the average PCI grows even larger, in proportion to the length of time that
maintenance is postponed.
Bay Area Metropolitan Transportation Commission
The Metropolitan Transportation Commission (MTC), the regional MPO in the nine-county San
Francisco Bay area, uses such a system for pavement management through their Regional
Streets and Roads Program.25 The MTC manages pavement improvements in 109 communities
through their Regional Streets and Roads Program. Through their Regional Streets and Roads
Program, the MTC has applied a regional process to managing pavement asset and prioritizing
improvements since 1986. All participating jurisdictions rely on data from the “StreetSaver”
decision making software program to assess pavement conditions within the MTC area.
StreetSaver was developed by the MTC and is now in its ninth version.
According to the MTC, the benefits of using StreetSaver include the following26:
Local governments can predict the future condition of their pavement for different levels of funding and show the effects of under-funded road programs.
StreetSaver works as an effective tool for local jurisdictions to both manage and generate street and road revenues.
On a regional level, as more and more jurisdictions complete their pavement needs analysis using StreetSaver, MTC is able to document the Bay Area's needs and shortfalls and use the data to build support in the state Legislature for increased funding.
Jurisdictions that have a PMS program in place will be ready to put any available new moneys to their most cost-effective use immediately.
A report on the program indicates that “It also allows for the setting of performance targets
and the measuring of progress towards those targets. Further, the use of a common pavement
management system by all Bay Area local jurisdictions allows MTC to monitor maintenance
activities and credit local agencies that employ positive preventive maintenance strategies.” An
25 Regional Asset Management Efforts and a Performance-Based Approach to Local Streets and Roads Funding Allocation, Romell, Metropolitan Transportation Commission, Oakland, California, Compendium of Papers from the First International Conference on Pavement Preservation, 2010. 26 See http://www.mtc.ca.gov/services/pmp

20
additional report summarizes the PCI for all jurisdictions using a three-year moving average.
This strategy could serve as an example to PAG on how it could coordinate regional data
collection and analysis. 27
The true benefit of this program is that it consistently evaluates pavement conditions within its
jurisdictions. Roadways in all participating cities, towns and counties are assessed by the
program in a similar and coordinated fashion.
ADOT-FHWA Stewardship Agreement
In 2010, ADOT and the FHWA’s Arizona Division entered an agreement regarding the
stewardship of the federal-aid routes in the State.28 Key elements of the agreement for
maintenance include:
Ensuring the federal-aid highway system is being adequately maintained by ADOT
Both the STIP and TIP must include a financial plan to demonstrate adequate operations and maintenance of federal-aid highways
Utilization of a Pavement Management System
Implementation of an ADOT Quality Assurance Program
Establishes a performance measure for 95% ride quality with “Present Service Rating” higher than 3.2.
The stated purpose of the agreement is to provide a roadmap to effectively manage all federal-
aid routes in terms of programming, project delivery, operations and maintenance. It defines
roles and responsibilities, outlines authorities, and most of all assures accountability.
27 See http://www.mtc.ca.gov/library/pothole_report/Bay_Area_PCI-2006-10.pdf
28 See http://www.fhwa.dot.gov/azdiv/stew.pdf

21
4: SURVEY AND LITERATURE SEARCH On two occasions, PAG and CLA surveyed communities and counties in Arizona via “Survey
Monkey”. They were first asked about pavement management, and the follow-up survey was
directed more at funding strategies.
For the initial survey, the goal was to obtain an understanding of the use of pavement
management practices and the state of pavement condition in selected jurisdictions. The
questions included:
Are your roads in better or worse physical condition today as measured by a pavement conditions index or other metric) than ten years ago?
Briefly describe your Pavement Management System and major funding sources.
Are life-cycle costs considered in estimating costs for roadway projects? Please describe.
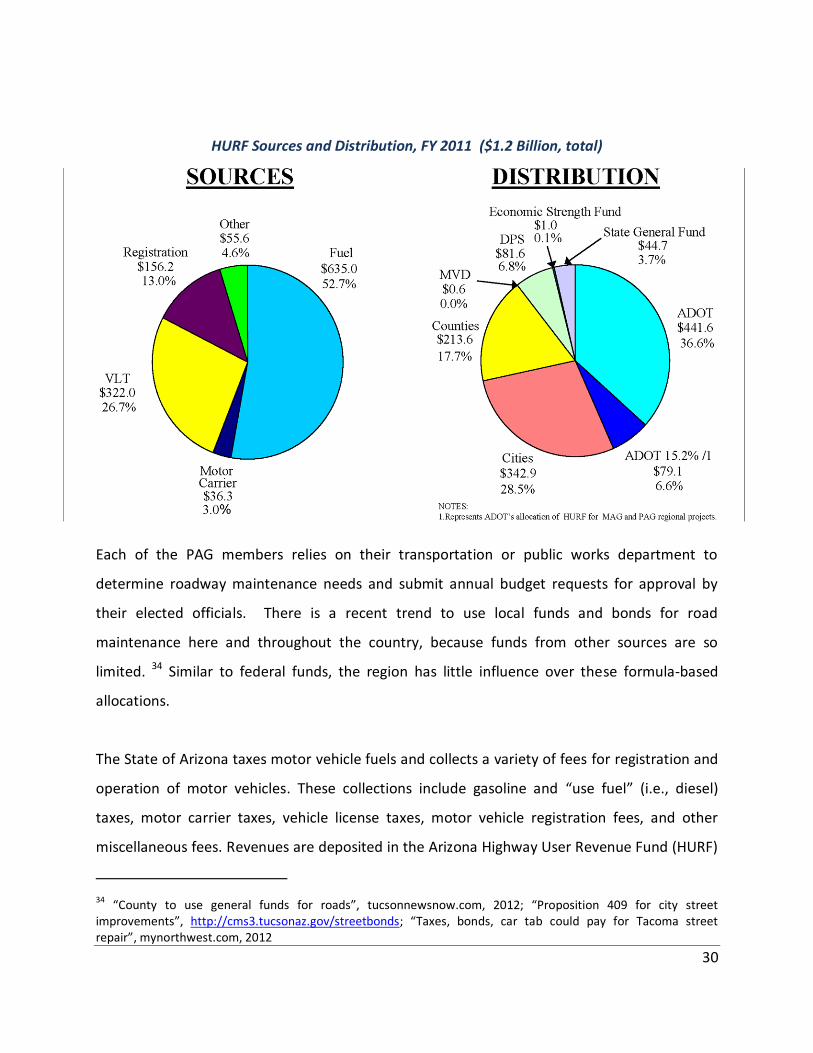
Does your agency/department include the consideration of life-cycle costs in SOQs/RFPs for roadway design and reconstruction projects?
How are pavement preservation project priorities set in your jurisdiction? For example, are your roads in poorest condition dealt with first (through major overlays or reconstruction),or do you maintain good to fair roads to extend their lives first?
What technical criteria does your jurisdiction use to evaluate pavement condition (e.g., Pavement Condition Index, International roughness Index)?
What criteria or processes (if any) are used to distribute maintenance dollars?
Has there been escalating pressure from the public and/or elected officials for your agency/department to improve roadway pavement conditions? Please explain.
Is your budget for pavement preservation considered sufficient to maintain the standard set by your jurisdiction’s pavement preservation program?
What are the greatest budgetary challenges to funding pavement preservation?
Have you used HURF revenue bonds for the following: Roadway Maintenance, Construction Projects?
Does your jurisdiction currently have HURF bond debt service?
Besides HURF, what other funding sources are used for pavement preservation? Examples include construction sales tax, improvement districts, special assessments, impact fees, etc.
What is the current outlook for pavement preservation funding for the next 20 years for your jurisdiction?
22
Agency Survey Summary
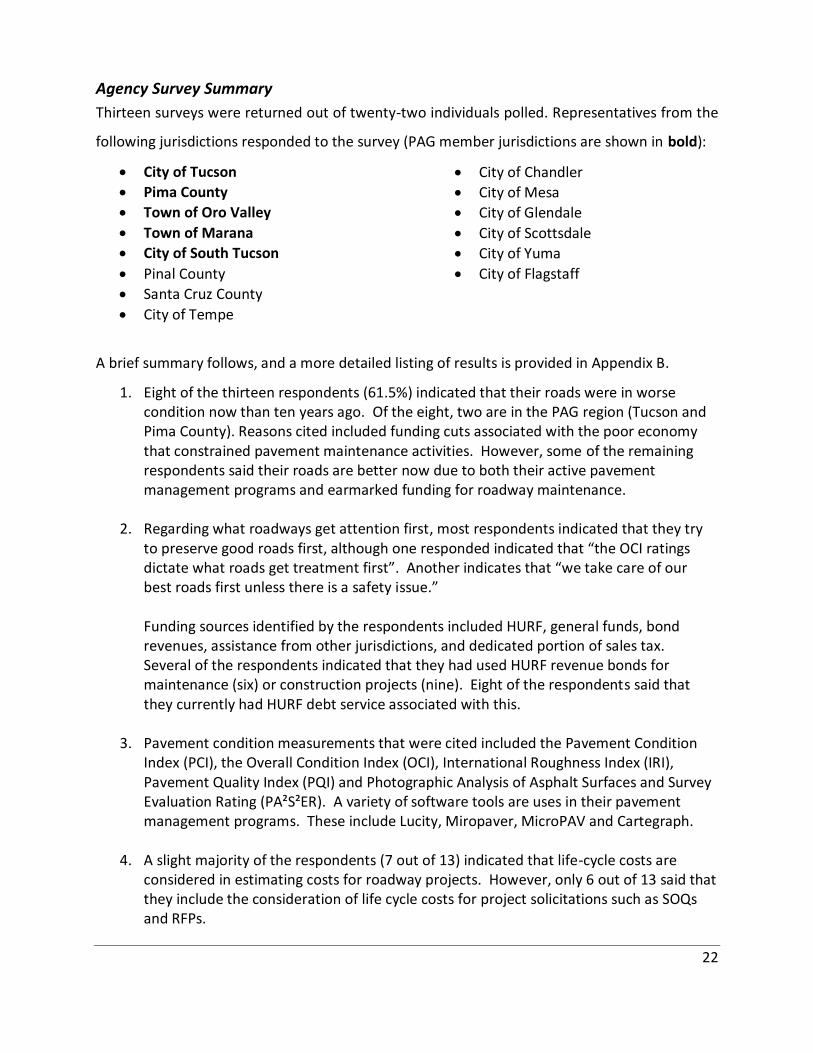
Thirteen surveys were returned out of twenty-two individuals polled. Representatives from the
following jurisdictions responded to the survey (PAG member jurisdictions are shown in bold):
City of Tucson
Pima County
Town of Oro Valley
Town of Marana
City of South Tucson
Pinal County
Santa Cruz County
City of Tempe
City of Chandler
City of Mesa
City of Glendale
City of Scottsdale
City of Yuma
City of Flagstaff
A brief summary follows, and a more detailed listing of results is provided in Appendix B.
1. Eight of the thirteen respondents (61.5%) indicated that their roads were in worse condition now than ten years ago. Of the eight, two are in the PAG region (Tucson and Pima County). Reasons cited included funding cuts associated with the poor economy that constrained pavement maintenance activities. However, some of the remaining respondents said their roads are better now due to both their active pavement management programs and earmarked funding for roadway maintenance.
2. Regarding what roadways get attention first, most respondents indicated that they try to preserve good roads first, although one responded indicated that “the OCI ratings dictate what roads get treatment first”. Another indicates that “we take care of our best roads first unless there is a safety issue.” Funding sources identified by the respondents included HURF, general funds, bond revenues, assistance from other jurisdictions, and dedicated portion of sales tax. Several of the respondents indicated that they had used HURF revenue bonds for maintenance (six) or construction projects (nine). Eight of the respondents said that they currently had HURF debt service associated with this.
3. Pavement condition measurements that were cited included the Pavement Condition Index (PCI), the Overall Condition Index (OCI), International Roughness Index (IRI), Pavement Quality Index (PQI) and Photographic Analysis of Asphalt Surfaces and Survey Evaluation Rating (PA²S²ER). A variety of software tools are uses in their pavement management programs. These include Lucity, Miropaver, MicroPAV and Cartegraph.
4. A slight majority of the respondents (7 out of 13) indicated that life-cycle costs are considered in estimating costs for roadway projects. However, only 6 out of 13 said that they include the consideration of life cycle costs for project solicitations such as SOQs and RFPs.
23
5. The respondents mentioned several methods for allocating maintenance funds. These include applying the money to maintenance on high volume major streets, using the OCI ratings, projects that can be implemented by in-house labor, and from consultant advice.
6. Sixty-one percent of the respondents indicated that there has been increasing pressure
from the public and/or public officials to improve pavement conditions.
7. Only one respondent indicated that there was sufficient funds to maintain the pavement system to standards (set by their jurisdictions), and most indicted that the greatest challenges for maintaining the system were the lack of money and the reallocation of state-provided revenue, typically provided for roadway improvements, to other uses. Responses to the question, “What is the current outlook for pavement preservation funding for the next 20 years for your jurisdiction?” were varied, although, as shown below, most indicated that the outlook was not positive.
If city sees increase in revenue, tax base, etc. may be able to implement program for time being rely on other funding sources to accomplish goals.
This is entirely dependent on the economy, so it's anyone's guess.
We have programmed $2 million annually for expenditure.
Under funded
If the market and economy stabilizes the current sales tax will meet our needs, but the referendum expires in 20 years. If the economy and market do not turn around then we will need to re-evaluate how we approach our program.
Not very good. However, if the proposed $100 million GO bond election passes in November 2012, it would fund next 5 years.
If we do not find consistent funding sources the long term outlook for our pavement management program is questionable.
There is a planned one time increase in rehabilitation funds for the next five years (FY 12/13 to FY 16/17). Maintenance funding will remain the same.
Bleak. The citizens will not accept another tax or fee to pay for government operations. The State must restore funding road maintenance funds.
Unless our funding is drastically improved our outlook is very very bleak.
About $500K/yr For the follow-up survey on funding, jurisdictions were asked the following questions:
“Earlier this year, we sent you a survey asking about your current pavement maintenance programs. As a follow up to this, PAG is seeking additional information to identify funding sources that transportation agencies use for pavement maintenance. Typical sources include general funds, Highway User Revenue Funds (HURF), transportation sales taxes, general obligation bonds, secondary property taxes, construction sales taxes, GO and revenue bonds, improvement districts, community facilities districts, and road taxes. You

24
probably are using some of these sources, and perhaps others you can tell us about. We are hoping that you will be able to assist us in this effort by answering the following questions: 1. What funding sources does your agency/jurisdiction currently use to pay for roadway maintenance activities? 2. Which of these funding sources do you consider the most reliable, and why? 3. If you use general funds, approximately what percentage of your pavement maintenance expenditures are funded by your General Fund? 4. What is the breakdown of funding from other sources used for your pavement maintenance expenditures?”
Nine jurisdictions responded with a commitment that their responses would remain
anonymous. All answered the first question and seven the second. Only two each provided
responses to questions 3 and 4.
Question 1: Funding Sources used for Pavement Maintenance (Nine responses total): HURF (8) Construction Sales Tax (1) Future Bond (1) ADOT Overweight Vehicles Program (1) Capital Construction Funds (1) GO Bond Funding (2) General Fund (1) Sales Tax (3) Secondary Property Tax (1)
Question 2: Most Reliable Funding Sources used for Pavement Maintenance (Seven responses total): HURF (4) Minimum Set By City Council from General Fund (1) GO Bond Funding (1) Secondary Property Tax (1)
Question 3: Percentage of General Funds used for Pavement Maintenance (Two responses): $300,000/year (1) $300K to $400K/year (1)

25
Question 4: Breakdown of Funding (Two responses): 80% - HURF; Capital Construction Funds 20% (1) 60% - HURF; Sales Tax 40% (1)
The jurisdictions clearly rely heavily on HURF for pavement maintenance, with other funding
sources varying by jurisdiction. Sales tax is used by three of the responding jurisdictions, and
general obligation funding is applied by two others. Interestingly, of the seven jurisdictions that
provided an answer to the questions of what funding source was the most reliable, HURF was
only considered the most reliable by four, i.e., 57%.
Recent Research on Road Maintenance and Asset Management
Web-based research was conducted on road maintenance and asset management. A large
number of web pages discuss pavement management, life-cycle cost studies of roadway-based
assets, good practices in asset management and other related topics. For this project, we
focused on the current accepted practices in the US, although there is extensive literature from
Europe and Africa. One of the most important reports is discussed below. Other documents
are listed in Appendix A – Suggested Reading.
AASHTO and TRB
NCHRP 688 – Determining Highway Maintenance Costs
This 2010 report summarizes the actual costs to an agency for maintaining the roadways under
its jurisdiction. Roadway maintenance costs typically include labor and materials, but agencies
funding sources for maintenance services: Traditional, non-traditional (outsourcing, public-
private partnerships), some of the elements making up the total agency cost of an activity
associated with highway maintenance are not included or considered in budgeting evaluations.
Line Maintenance Costs
Labor (wages, salaries, overtime, SS, Medicare, fringe benefits)
Equipment (usually structured as rental rates for depreciation purposes)
Material materials that are maintained in agency inventories or stockpiles, the use of
materials fabricated in agency shops, or materials purchased specifically from outside
vendors to complete a particular maintenance job
Other (utility charges, private equipment rental, i.e., not part of the agency fleet and the
sum of payments made to contractors to complete maintenance jobs in cases where

26
maintenance activities are delivered through a combination of agency and contractor
resources.
Maintenance Agency Support Costs
Program management and field supervision – staff responsible for managing the maintenance program (maintenance engineer, regional manager, other managers and supervisors.
Program administration – office personnel, equipment and supplies
Buildings, facilities and grounds – building leasing, rentals, depreciation, grounds maintenance, utilities, communications.
Training – maintenance personnel at training and costs of providing training (sessions and materials).
Material stores/inventory operations
Fabrication shops and laboratories – signs, pavement materials testing
Enterprise Support Costs
In the same way that a maintenance program comprises line and support activities, the
operations of a transportation agency comprise line and support programs and cost items.
Typical agency line programs include construction, maintenance, safety, environmental
protection/mitigation, and other investment and operations categories of work across different
modes. These programs are supported by a number of enterprise support functions that
typically include the following:
Agency executive management;
Planning, programming, and research;
Financial accounting, budgeting, payroll, and procurement;
Legal and audit divisions;
Human resources;
Information technology;
Central office buildings, facilities, and grounds, including utilities and communications services;
Shops, laboratories, and other support functions and cost items that have not already been included in the program support category; and
Support of the DOT provided by external agencies (e.g., the state attorney general’s office or the state auditor’s office).
As with the program support costs, the key objectives regarding enterprise support costs are (1)
to identify the complete set of enterprise support costs, and (2) to allocate an appropriate
27
share of these enterprise support costs to maintenance line costs to complete the cost
determination process.

28
5: FUNDING FOR ROADWAY MAINTENANCE Roadway maintenance funding is provided by federal, state and local agencies, through quasi-
private improvement districts, and through development exactions. The sources are already
well described in prior PAG studies, and in the Regional Transportation Plan. This section
discusses recent changes that should be considered moving forward.
Federal Funds
As an MPO, PAG receives and programs federal funds allocated by programs defined in federal
transportation legislation. Since 1991, there have been a series of sweeping changes in the
allocation and allowable uses for federal funds. As a recipient of funds allocated by formula,
the region has little influence over the amount available.
Federal transportation law changed very recently after substantial debate in Congress. “Moving
Ahead for Progress in the 21st Century” was passed on June 29, 2012, one day prior to the
expiration of SAFETEA-LU. Called MAP-21, the legislation preserves yet consolidates most of
the prior programs. It includes notable cuts in some alternate mode programs. 29
Key elements of MAP-21 include:
Establishes an outcome-driven approach that tracks performance and will hold states and MPOs such as PAG accountable for improving the conditions and performance of their transportation assets
Reauthorizes the Federal-aid highway program at the current funding levels plus inflation—for two fiscal years
Consolidates the number of Federal programs by two-thirds, from about 90 programs down to less than 30, to focus resources on key national goals and reduce duplicative programs
Eliminates earmarks
Expedites project delivery while protecting the environment
Creates a new title called “America Fast Forward,” which strengthens the Transportation Infrastructure Finance and Innovation Program (TIFIA)
29 See for example http://www.thirteen.org/metrofocus/2012/07/the-federal-transportation-bill-and-new-york
29
MAP-21 has a renewed emphasis on system preservation, maintenance, and fiscal
accountability. Interestingly, MAP-21 emphasizes asset management and for the first time
includes a definition of the term as “a strategic and systematic process of operating,
maintaining, and improving physical assets, with a focus on both engineering and economic
analysis based upon quality information, to identify a structured sequence of maintenance,
preservation, repair, rehabilitation, and replacement actions that will achieve and sustain a
desired state of good repair over the lifecycle of the assets at minimum practicable cost.” A
fact sheet on MAP-21 is available on-line. 30 The legislation itself is available as well. 31
Additional Federal funds were available under American Recovery and Reinvestment Act of
2009 (ARRA)32. In 2009, the federal government authorized the expenditure of over $800
billion for improving infrastructure and various other purposes. Roughly $50 billion was
earmarked for transportation, of which $27.5 billion went for highway and bridge projects.
This program has not been extended.
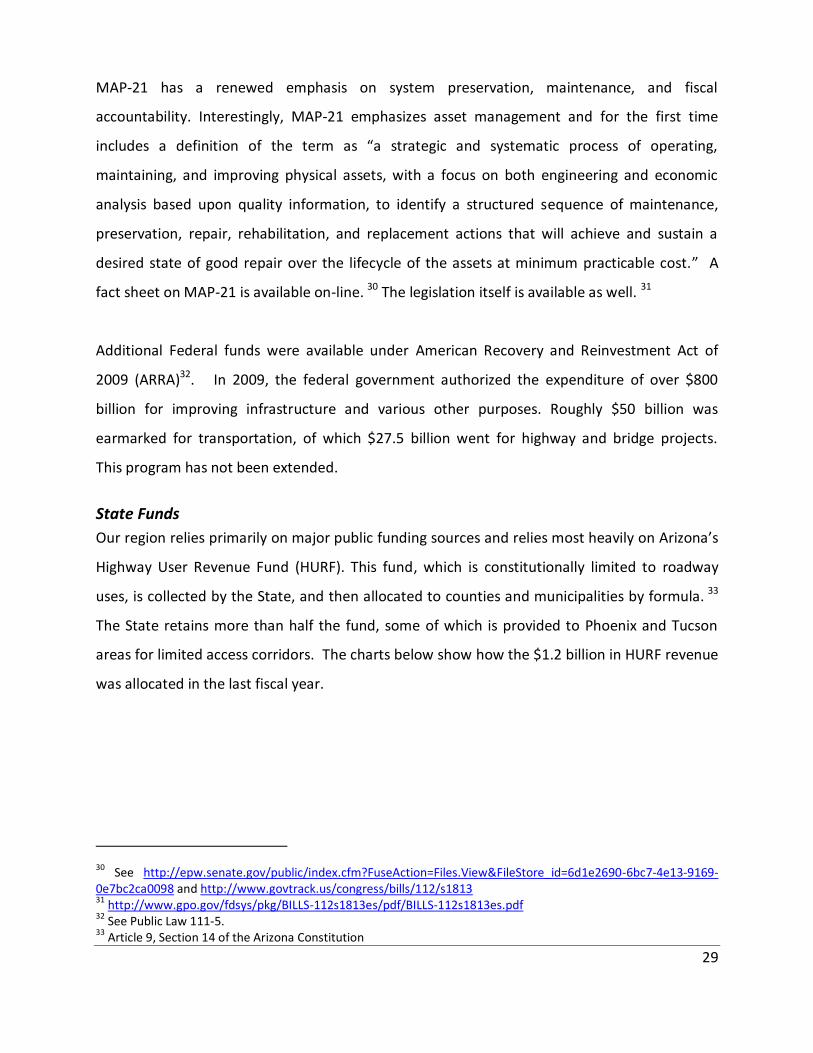
State Funds
Our region relies primarily on major public funding sources and relies most heavily on Arizona’s
Highway User Revenue Fund (HURF). This fund, which is constitutionally limited to roadway
uses, is collected by the State, and then allocated to counties and municipalities by formula. 33
The State retains more than half the fund, some of which is provided to Phoenix and Tucson
areas for limited access corridors. The charts below show how the $1.2 billion in HURF revenue
was allocated in the last fiscal year.
30 See http://epw.senate.gov/public/index.cfm?FuseAction=Files.View&FileStore_id=6d1e2690-6bc7-4e13-9169-0e7bc2ca0098 and http://www.govtrack.us/congress/bills/112/s1813 31
http://www.gpo.gov/fdsys/pkg/BILLS-112s1813es/pdf/BILLS-112s1813es.pdf 32
See Public Law 111-5. 33 Article 9, Section 14 of the Arizona Constitution
30
HURF Sources and Distribution, FY 2011 ($1.2 Billion, total)
Each of the PAG members relies on their transportation or public works department to
determine roadway maintenance needs and submit annual budget requests for approval by
their elected officials. There is a recent trend to use local funds and bonds for road
maintenance here and throughout the country, because funds from other sources are so
limited. 34 Similar to federal funds, the region has little influence over these formula-based
allocations.
The State of Arizona taxes motor vehicle fuels and collects a variety of fees for registration and
operation of motor vehicles. These collections include gasoline and “use fuel” (i.e., diesel)
taxes, motor carrier taxes, vehicle license taxes, motor vehicle registration fees, and other
miscellaneous fees. Revenues are deposited in the Arizona Highway User Revenue Fund (HURF)
34 “County to use general funds for roads”, tucsonnewsnow.com, 2012; “Proposition 409 for city street
improvements”, http://cms3.tucsonaz.gov/streetbonds; “Taxes, bonds, car tab could pay for Tacoma street repair”, mynorthwest.com, 2012

31
and are then distributed to the cities, towns and counties and to the State Highway Fund. These
taxes represent a primary source of revenues available to the state for highway construction,
improvements and other related expenses. Prior analysis by CLA and others shows that buying
power of HURF has declined appreciably due to inflation and the Legislature’s refusal to
increase the state gas tax, among other reasons. The chart below shows in normalized dollars
how the fund
generates about
$88 per capita now
compared to about
$108 in 2007. This
is an 18% decline in
purchasing power.
When assessed
over a longer
period, the decline
in purchasing power is more than 50%.
Over the past several years, the Arizona legislature diverted some HURF revenue to the Arizona
Department of Public Safety, and thus reducing the amount allocated to counties and
municipalities. The recent trends in HURF distribution to PAG jurisdictions are shown in the
chart below, using FY 2006/07 as the benchmark. HURF was increasing prior to the benchmark
year, but afterwards it declines due in part to diminishing income, but mostly due to revenue
diversion. This revenue decline has obvious implications on transportation projects at the local
level, including maintenance projects.
HURF Bonds and Outstanding Debt Service
Bonds, sold to investors in a public market, are the chief mechanism used by municipalities to
finance capital facilities. Such bonds are often called “municipal” bonds even though many are
issued by state governments and special purpose districts. Through the State Transportation

32
Arizona HURF Diversion Analysis FY 2006/07 Benchmark (Pima County)
Arizona HURF - Distribution to Pima County and Municipalities within Pima County
FY Pima County Marana Oro Valley
South Tucson Tucson Sahuarita Total
Cumulative Loss
2002/03 $37,716,916 $1,043,282 $2,283,594 $422,000 $44,383,949 $249,135 $86,098,874
2003/04 $39,829,979 $1,092,521 $2,560,691 $442,282 $46,712,006 $261,322 $90,898,801
2004/05 $41,755,890 $1,141,523 $2,688,528 $461,892 $48,864,152 $273,124 $95,185,109
2005/06 $43,291,930 $1,254,679 $2,798,398 $473,220 $50,527,993 $351,596 $98,697,815
2006/07 $44,565,617 $2,067,895 $3,031,223 $432,071 $49,548,012 $1,088,363 $100,733,180 (Benchmark)
2007/08 $44,060,131 $2,035,849 $3,002,828 $429,747 $48,966,864 $1,067,285 $99,562,705 ($1,170,475)
2008/09 $41,209,550 $1,936,369 $2,855,668 $408,550 $45,965,674 $1,014,642 $93,390,453 ($7,342,727)
2009/10 $38,739,414 $1,808,963 $2,667,797 $381,679 $43,086,356 $947,901 $87,632,109 ($13,101,071)
2010/11 $38,973,544 $1,869,483 $2,693,145 $384,046 $43,300,823 $1,021,736 $88,242,777 ($12,490,403)
Cumulative Decline Since FY 2006/07 ($34,104,676)
Source: Office of Pima County Administrator

33
Board, counties and cities are authorized to issue HURF bonding if approved at a local election.
In November 1997, a $350 million HURF bond authorization was approved by Pima County
voters, and this was applied to several capital improvements within Pima County, including
some in the incorporated areas. As a result, there is existing debt service that reduces the
availability of funds for pavement maintenance activities. Other communities and counties in
the state have also pursued HURF bonding, and as a result are repaying the associated debt.
Local debt policies are useful in making decisions about paying for maintenance with either GO
or revenue bonds. Bond advisors routinely recommend that jurisdictions adopt debt policies.
Such principles should be written in a flexible enough way to allow for the under-funding of
infrastructure during hard economic times, although from the public works perspective this
might be seen as lack of commitment. 35
Local Funds
In contrast to federal and state funding, local funds authorized by statute and municipal charter
are under the total control of local governments and the electorate. The types of funding
available are mainly restricted to sales taxes and primary and secondary property taxes. A
recent example is Tucson voters’ approval of a property tax funded bond program for street
repair. Local agencies cannot impose cents-per-gallon fuel taxes, a sales tax on fuel, and myriad
other taxes and fees available in other parts of the country.
This section describes taxes and fees currently authorized by statute; however, many other
options could become available if the State Legislature would pass implementing legislation.
Additional options will be explored in more detail by staff upon direction of the Regional
Council.
Current Local Funds for Transportation
Local funds dedicated to transportation in the PAG region include the RTA’s ½¢ sales tax,
Proposition 409 road repair revenues, and road impact fees collected by all jurisdictions except
South Tucson and Sahuarita. A construction sales tax is levied in Oro Valley, Marana, and
35 http://www.lincolninst.edu/subcenters/teaching-fiscal-dimensions-of-planning/materials/elmer-bonds.pdf

34
Sahuarita and can be used for maintenance if the Town Councils choose to do so. The City of
Tucson briefly considered a CST, and Pima County is prohibited from its use. Both the City of
Tucson and Pima County use some of their general funds for transportation, especially for
transit operations, and occasionally for road maintenance.
Potential Local Funds for Transportation
At the local level, additional revenues for maintenance can be provided by further increasing
sales and property taxes within statutory limits.
Pima County General Funds
Pima County currently spends about $13 million on maintenance, all from HURF. The Board of
Supervisors authorized some additional funding from reserve. This includes $10 million this
fiscal year and $20 million next year.
Improvement Districts and Community Facility Districts
Improvement districts and community facility districts are special taxation districts allowed by
statute. A fundamental difference is IDs usually are applied to existing development, whereas
CFDs are applied to developing land during the planning process.
The laws for creating IDs are different for counties and municipalities, but both allow
maintenance expenditures. The Districts, once formed, have a governing body which is usually
the local elected body. ID projects are paid for by property owners of the district, either as a
separate levy or as an additional line item on their property tax bill. Cities use IDs more than
counties because of the comparative ease of implementation, frequently to add sidewalks and
lighting, for maintenance, and to help pay for a portion of adjacent street widening.
In Pima County, for example, the Tucson Country Club Estates neighborhood created a paving
and sewer improvement district formed in 1994 for reconstructing the streets, highways and
sewers. Property owners spent $4.27 million to improve their streets, highways and sewers.
The County notes that this model is available to anyone who wishes to form an improvement

35
district. It requires a majority of the property owners within the district or the owners of 51
percent of the real property within the district to agree to pay for the work. To incentivize the
use of improvements districts for street and highway improvements, the County could offer to
fund a portion of the costs with the balance paid for by the district. A similar policy could be
adopted in the municipalities.

36
6: RECOMMENDATIONS
Quantify Pavement Conditions in the Region
Using available data from the ARAN van and other resources, prepare an overview of pavement
conditions in the region. Make this available for all jurisdictions to aid decision-making about
transportation investments.
Recommendation: Provide a regional pavement condition overview, showing various
metrics that track the condition of roadways in the region to help make informed investment
decisions.
Continue to Investigate Maintenance Needs and Funding Options
This report identifies some of the administrative and funding challenges confronted by PAG
members. One of the key issues is identifying funding needed for maintenance and then
allocating enough funds during an economic downturn. Both the City of Tucson and Pima
County are using general funds for maintenance, which can detract from competing services
that must rely exclusively on general funds.
Accordingly, more detailed examinations of immediate, short-term, and long-term maintenance
needs and funding is required. We noted during our research that several communities
including Tacoma used a task force to examine the options, which also seems appropriate in
our region. The RTA could be represented through its CART or TMC. This report and its
supporting documents could be used as a resource and starting point for such a task force.
Recommendation: Using this report as a resource, establish a regional task force,
perhaps through the PAG Management Committee or TPC, to prioritize maintenance funding
options for implementation across the region.
Emphasize Life-Cycle Programming
MAP-21, the new federal transportation legislation emphasizes asset management and fiscal
stewardship. The USDOT recognizes that one way to avoid pavement neglect is to integrate
maintenance with capital programming and project design. Life-cycle programming for
roadway preservation should be considered during the planning and design phase of new

37
roadways and major rehabilitation projects. Typical procedures for planning include designing
the project based on established standards, but may not include the consideration of
minimizing future maintenance costs. In general, design consultants are selected based on
their project understanding, professional team, and estimated fee. Competing firms base their
fees on the type of project, estimated number of plan sheets, standards required and
experience. However, while creative in their proposals, they understand the competiveness in
the bid process. They may not propose solutions that maximize service life/minimize life cycle
costs of a project, instead recommending less costly options that lower initial construction costs
while increasing future operations and maintenance costs.
Recommendation: Integrate life-cycle planning and programming into PAG’s procedures.
Set Aside Funding for Maintenance
There currently is no fixed minimum amount available for road maintenance. This can be
accomplished and integrated into the annual TIP.
Recommendation: Through discussions with all PAG member jurisdictions, define a set-
aside amount for pavement management in the TIP. This has been previously discussed as a
potential strategy but not pursued further. If all jurisdictions support such a move, it has a
higher likelihood of being supported through the committee process.
Expand In-House Resources in Pavement Management and Life-Cycle Programming
Due to the renewed emphasis in asset management and potential funding opportunities
contained in MAP-21, we recommend that PAG emphasize its in-house resources in pavement
management and life-cycle programming. This can be accomplished - in order of priority -- by
providing further training to current staff, augmenting staff, or retaining outside assistance. A
small in-house work group can be assigned to this topic.
Recommendation: In preparation for MAP-21, expand and emphasize in-house
resources and establish an in-house workgroup tasked with pavement and asset management
responsibilities. This can become a recurring element in PAG’s annual Overall Work Program.

38
Involve PAG Members in Pavement Management Discussions
It is apparent that a continuing discussion with member jurisdictions will enhance pavement
management regionally for the benefit of road users, property owners, businesses, and for
improved economic competitiveness. PAG has a broad committee structure, so it is possible to
rely on a subcommittee of the TPC or TIP to forward this issue. It is also advisable to conduct a
PAG “ThinkTank” session(s) with senior management staff (for funding and prioritization issues)
and technical staff (for tools, interagency planning, data, and resources) to address important
questions such as:
1. How can PAG facilitate asset management, pavement management, and pavement preservation regionally to assist member jurisdictions?
2. What technical tools are needed at the local and MPO level to enhance pavement management?
3. How can agencies work together to minimize the cost labor, equipment, and materials? 4. What can be done to minimize tort liability associated with street maintenance? 5. What levels and types of funding are needed to obtain a higher standard of
performance? 6. How can we better inform the public and elected officials about the challenges and
needs of pavement management? Recommendation: Continue regional discussion about pavement and asset management
utilizing PAG’s “ThinkTank” program.
Regional Asset Management/Pavement Management Programming
PAG members manage their jurisdiction’s pavement in different ways. Because each relies on
federal and state aid, in addition to local funds, there should be a common implementation
system for pavement maintenance activities. The Metropolitan Transportation Commission
(MTC), the MPO in Oakland, California, has applied a regional process to managing pavement
asset and prioritizing improvements for many years. All participating jurisdiction rely on data
from the STREETSAVER software program to assess pavement conditions within the MTC area.
MAP-21 will likely include performance measures associated with roadway activity funding.
There also appears to be an expansion of the National Highway System (NHS) which may affect
pavement inventory and asset management activities, which can be .addressed under this
strategy.

39
Recommendation: PAG staff should investigate the successes of the MTC and determine
if MTC can be a model program for local adoption, and help support new opportunities under
MAP-21.
.
.

A-1
Appendix A: Recommended Reading
1. Regional Asset Management Efforts and a Performance-Based Approach to Local Streets and Roads Funding Allocation, Theresa Romell and Sui Tan, Metropolitan Transportation Commission, Oakland, California, United States, Compendium of Papers from the First International Conference on Pavement Preservation, April 2010 http://www.techtransfer.berkeley.edu/icpp/papers/70_2010.pdf
2. State of the System Report FY 2012, Maricopa County, June 2012
http://www.mcdot.maricopa.gov/technical/eng-manuals/2012-SOS-Report.pdf
3. Asphalt Roadway Rehabilitation Alternatives, A Training Course, Publication Number FHWA-SA-97-048, FHWA http://isddc.dot.gov/OLPFiles/FHWA/013560.pdf
4. Maximizing Customer Benefits as the Ultimate Goal of Pavement Management, Paper
No. 42 for Presentation and Publication to, Fifth International Conference on Managing Pavements, Seattle, Washington, August 11-14, 2001 http://pavementmanagement.org/ICMPfiles/2001016.pdf
5. Evaluation of the Cost Benefits of Continuous Pavement Preservation Design Strategies Versus Reconstruction Final Report 491, K.L. Smith, L. Titus-Glover, M.I. Darter, H.L. Von Quintus, R.N. Stubstad, and J.P. Hallin, Applied Research Associates, September 2005, Prepared for Arizona Department of Transportation. http://www.azdot.gov/TPD/ATRC/publications/project_reports/PDF/AZ491.pdf
6. Arizona State Senate Issue Brief, Highway Funding and Construction, December 20, 2010, State of Arizona http://www.azleg.gov/briefs/Senate/HIGHWAY%20FUNDING%20AND%20CONSTRUCTION.pdf 7. Optimal Timing of Pavement Preventive Maintenance Treatment Applications, NCHRP Report 523, D.G. Peshkin, T.E. Hoerner, K.A. Zimmerman, 2004 http://onlinepubs.trb.org/Onlinepubs/nchrp/nchrp_rpt_523.pdf 8. Determining Highway Maintenance Costs, NCHRP Report 688, Cambridge Systematics, Inc., 2011 http://onlinepubs.trb.org/onlinepubs/nchrp/nchrp_rpt_688.pdf 9. Board of Supervisors Memorandum, Need for Increased Investment in Transportation and Highway Maintenance, April 10, 2012 http://www.pima.gov/administration/documents/pdfs/bos-increased.transportation.investment_20120328112303_785934.pdf

B- 1
Appendix B – Survey Results
Are your roads in better or worse physical condition today as measured by a pavement conditions index or other metric) than ten years ago?
Eight of the thirteen respondents (61.5%) indicated that the roads were worse than over the
last ten years. For those that responded “better”, the following comments were provided:
Recent reconstruction and mill/overlay of all major roadways.
On the whole they would have to be considered better because we have added so many new lane miles, mainly from private development.
The Town of Marana has a robust and aggressive pavement preservation program. Although it is not fully funded, it is funded enough to keep up with the demand of needed preservation. Currently our OCI Town wide is about 79 out of 100
We have had dedicated sales tax paired with a preventative maintenance program for the last 25 years.
We have an active pavement management program and have rebuilt most of our arterial roads.
For those that responded “worse”, the following comments were provided:
Have not had the available funding for repairs.
Due to poor economics and budget shortfalls, there has been little money for pavement preservation.
Chandler has approximately 2,000 lane miles of streets but current budget only allows preventative maintenance on 100 to 150 lane miles.
Reduction in funding.
38.5%
61.5%
Are your roads in better or worse physical condition today (as measured by a pavement condition index, or other metric) than 10 years ago?
Better
Worse

B-2
Funding cuts have compromised our maintenance schedule.
Briefly describe your Pavement Management Program and major funding sources.
Assistance from PCDOT, COT. Funding- RTA, 12.6, PC Bond
Currently, problem areas are identified with maintenance foremen and addressed. In the future we will use a PMS (Lucidity) that will be integrated with our GIS. The major funding source comes from our half-cent sales tax.
We use Lucity as a software to aid in the management of the pavement. Our funding is mostly Highway User Revenue Funding.
Most of our funding comes from the State allocation of HURF funds. We have revised and updated our pavement preservation program this year 2012 to include a maximum of 4 year rotation on all of our roads. Some roadway sections will get an increase in application rates than others.
Our major funding sources are, Sales Tax and HURF. We utilize MicroPAV a custom version of the Micropaver software created by the Army Corps of Engineers. Mesa has been a staunch believer in preventative maintenance and cycle treatments relating to the right treatment for the right road at the right time to extend the life cycle of the county roadways.
The City of Tucson’s Pavement Management System (PMS) utilizes methods and philosophies developed by the Army Corps of Engineers (ACE). In particular, the publication Pavement Management for Airports, Roads, and Parking Lots by M. Y. Shahin has been the foundation of this program. Currently, pavement surfaces are rated using a combination of Pavement Condition Index (PCI) scores, International Roughness Index (IRI) measurements, and Photographic Analysis of Asphalt Surfaces and Survey Evaluation Rating (PA²S²ER). PCI inspections (ACE method of analyzing asphalt concrete conditions) are conducted on 10% of all asphalt concrete roadways by measuring and recording 19 different distresses at three severity levels. IRI is measured utilizing an ARAN (Automated Roadway Analyzer) van http://transview.org/aran. PA²S²ER is actually a modified version of the University of Wisconsin-Madison’s PASER system http://tic.engr.wisc.edu/Publications.lasso, adapted to be a behind-the-windshield visual survey performed while collecting IRI data with the ARAN. All PCI and PA²S²ER condition data is stored within a historical database. This data has typically been used to track conditions of city streets over time. Major Streets and Routes are updated within the database on a three year cycle, and residential roadways are on a five year cycle. In addition to this data, PMS is tasked with satisfying local regional requirements stipulated by the Highway Performance Monitoring System (HPMS). The City’s PMS program is grant funded: 94.3% Federal Highway Administration (FHWA) Surface Transportation Funding (STP) with a 5.7% City of Tucson local-match. It works in conjunction with Pima Associations of Governments (PAG), but is exclusively maintained by the City of Tucson. From PAG’s website, “The Regional Pavement Management System provides PAG member agencies with the appropriate tools and data to assess the deterioration of publicly owned roadways and other roadway infrastructure.

B-3
Accurate management of the multi-billion dollar roadway infrastructure is essential for allocating and optimizing the impact of available maintenance budgets.” Major funding sources: Limited HURF and FHWA when available.
We use Cartegraph pavement management software and have dedicated staff to manage the program. Our funding sources are construction sales tax and local HURF funds.
Chandler uses crack seal, Tire Rubber Modified Surface Seal (TRMSS), Slurry Seal, Micro Surface and Mill and Overlay. Major funding sources are HURF, General Fund and Bond Revenue.
Utilize traditional preventative maintenance measures. HURF only source.
Our program consists primarily of preventative maintenance applications (seal coat, slurry, microseal, crack seal, chip seal, mill and overlay). CIP is funded primarily through our General Fund (bonds).
PMP is currently being developed. HURF is the primary source.
Are life-cycle costs considered in estimating costs for roadway projects? Please describe.
They will be once our PMS is fully online.
See our pavement management preservation manual.
Every Capital Improvement Project (CIP) that adds an asset has a maintenance component incorporated in the analysis of the life cycle cost to cover the increase in maintenance costs over the life cycle of the roadway.
We attempt to budget for O&M costs as a part of our 5 Year Capital Improvement Program, but there are no funds to retain O&M costs in the program.
We design our new roadways for a 20-year life cycle.
Cheapest, longest lasting, and most effective treatment is used.
46.2%
53.8%
Are life-cycle costs considered in estimating costs for roadway projects?
Yes
No
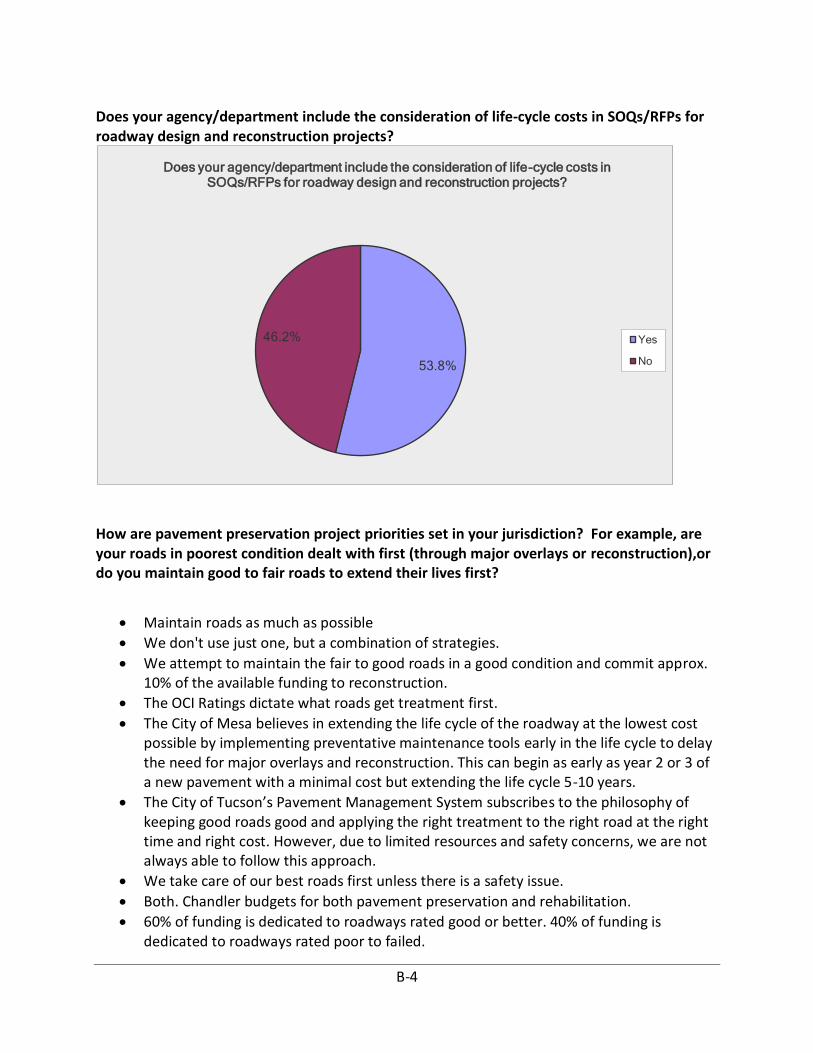
B-4
Does your agency/department include the consideration of life-cycle costs in SOQs/RFPs for roadway design and reconstruction projects?
How are pavement preservation project priorities set in your jurisdiction? For example, are your roads in poorest condition dealt with first (through major overlays or reconstruction),or do you maintain good to fair roads to extend their lives first?
Maintain roads as much as possible
We don't use just one, but a combination of strategies.
We attempt to maintain the fair to good roads in a good condition and commit approx. 10% of the available funding to reconstruction.
The OCI Ratings dictate what roads get treatment first.
The City of Mesa believes in extending the life cycle of the roadway at the lowest cost possible by implementing preventative maintenance tools early in the life cycle to delay the need for major overlays and reconstruction. This can begin as early as year 2 or 3 of a new pavement with a minimal cost but extending the life cycle 5-10 years.
The City of Tucson’s Pavement Management System subscribes to the philosophy of keeping good roads good and applying the right treatment to the right road at the right time and right cost. However, due to limited resources and safety concerns, we are not always able to follow this approach.
We take care of our best roads first unless there is a safety issue.
Both. Chandler budgets for both pavement preservation and rehabilitation.
60% of funding is dedicated to roadways rated good or better. 40% of funding is dedicated to roadways rated poor to failed.
53.8%
46.2%
Does your agency/department include the consideration of life-cycle costs in SOQs/RFPs for roadway design and reconstruction projects?
Yes
No

B-5
We extend the better to fair roads as long as we can and hold the failed roads together until we get a windfall of money. Still waiting on the windfall.
Priority is given to roads based on ADT's.
What technical criteria does your jurisdiction use to evaluate pavement condition (e.g., Pavement Condition Index, International roughness Index)?
PCI
PCI
Pavement Condition Index - Better known as "Overall Condition Index" (OCI)
We currently utilize the Pavement Condition Index in accordance with ASTM D 6433.
See #2 above. The City’s PMS uses three types of technical criteria: Pavement Condition Index (PCI), IRI (International Roughness Index) and Photographic Analysis of Asphalt Surfaces and Survey Evaluation Rating (PA²S²ER).
We use the USACOE pavement condition index.
Chandler uses Pavement Quality Index (PQI) based on Stantec's RoadMatrix program. PQI (0 to 100) is a function of Ride Comfort, Surface Distress and Structural Adequacy.
Staff utilizes Cartegraph Pavement Management software. PCI index are formatted within, types of treatments, history, etc.
Pavement Quality Index (PQI)
N/A
What criteria or processes (if any) are used to distribute maintenance dollars?
We are currently implementing a Pavement Management System (Lucidity) to target areas and/or road types for future projects.
See our pavement management preservation manual.
We focus our in-house crew projects first, they represent the core functions of the city maintenance program. We then distribute the additional funding based on prioritization of need and overall roadway performance increase.
Due to budget constraints and lack of a dedicated funding source the City is focusing maintenance dollars primarily on major streets that carry a lot of traffic and safety concerns. There have been efforts for maintenance prioritized by OCI, ADT, age, location, and design.
We use the OCI, overall condition index, as a means to appropriate funds.
See answer 5, all are coordinated with PCI.
We hire a consultant who objectively evaluates the road using a specially designed vehicle. The condition is plugged into a software program that calculates the PQI>
Has there been escalating pressure from the public and/or elected officials for your agency/department to improve roadway pavement conditions? Please explain.

B-6
recent improvements have kept public/elected officials satisfied
Only to a small degree. The most pressure is to add capacity.
Public Safety (police and fire) are the priorities.
We have a great system. The Town of Marana keeps up on our roadway system, so that our constituents do not have to worry about calling in to complain about our roadway system condition.
The pressure has been focused on economic development areas as opposed to areas that are not performing or in need based upon performance criteria.
Currently, the City is in the process of soliciting a 5-year General Obligation bond that will allocate $20 million per year towards roadway maintenance and rehabilitation. Please see the following link for more information: http://cms3.tucsonaz.gov/home/announcement/street-maintenance.
We have educated our elected officials on the importance of pavement management and have their support.
Only from the public.
Is your budget for pavement preservation considered sufficient to maintain the standard set by your jurisdiction’s pavement preservation program?
61.5%
38.5%
Has there been escalating pressure from the public and/or elected officials for your agency/department to improve roadway pavement conditions?
Yes
No

B-7
minimal funding received to maintain standalone program
For this year and the next yes, but future years no unless revenues increase.
Even though we have a robust system in place, we are not fully funded. Our program currently is based upon a $2 million a year investment. Currently the Town is only funding $500,000 per year.
With the decrease in sales tax revenue and HURF, we are still playing catch up to maintian the high quality of roads that Mesa has been expected to deliver. We however are adapting to this change and are attempting to maintain a high standard given the current condition of funding.
We are responsible for maintaining 1,900 lane-miles of major streets of which 52% are in failed, poor, and fair condition and requires $215 million to bring those streets to a good or better condition. There are 3,500 lane-miles of residential streets of which 86% are in failed, poor, and fair condition and requires over $400 million to bring those streets to an acceptable level.
WIth less construction sales tax revenue and the reduction of local HURF we have had to use our contingency funds to close the gap. This is not a sustainable practice in the near and long terms.
Not even close. We need $6-8 million annually and need a lump sum of approx $50 million to get our streets to a PQI of 70.
What are the greatest budgetary challenges to funding pavement preservation?
With a small jurisdiction other priorities come to the forefront.
7.7%
92.3%
Is your budget for pavement preservation considered sufficient to maintain the standard set by your jurisdictions pavement preservation program?
Yes
No

B-8
Increasing oil and aggregate prices, additional lane-miles added to the system, and flat revenues.
Competing with other needs for very little money
Not enough money to cover all the expenses.
Steady revenue sources and the cost benefit analysis.
HURF funding to the City has declined 26% since 2008 and City General Fund revenues have dropped dramatically. A new funding source or sources must be identified.
The poor economy and the HURF sweeps by the State Legislature.
State of Arizona continues to sweep HURF away from the Cities and Towns to fund DPS.
Getting elected officials and our Finance Department to understand how critical preventative maintenance is.
HURF declining
Have you used HURF revenue bonds for the following: Roadway Maintenance, Construction Projects?
Does your jurisdiction currently have HURF bond debt service?
6
9
0
2
4
6
8
10
12
14
Roadway Maintenance Construction Projects
Have you used HURF revenue bonds for the following?
Yes
No
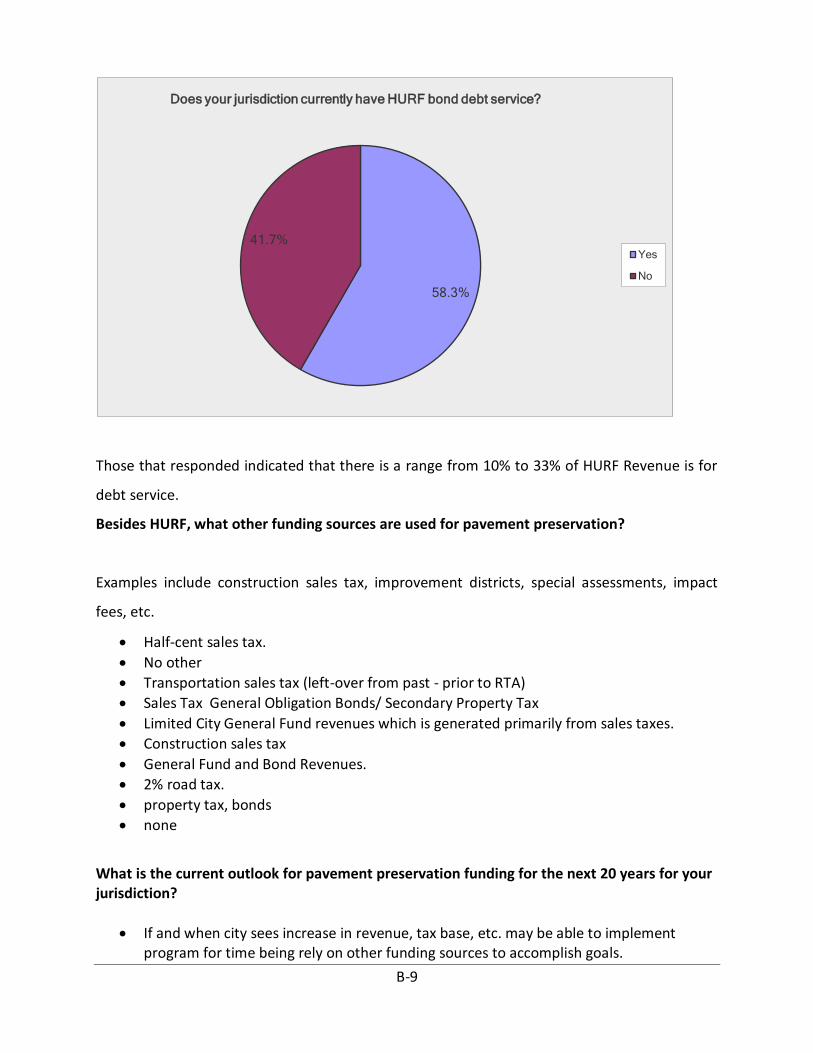
B-9
Those that responded indicated that there is a range from 10% to 33% of HURF Revenue is for
debt service.
Besides HURF, what other funding sources are used for pavement preservation?
Examples include construction sales tax, improvement districts, special assessments, impact
fees, etc.
Half-cent sales tax.
No other
Transportation sales tax (left-over from past - prior to RTA)
Sales Tax General Obligation Bonds/ Secondary Property Tax
Limited City General Fund revenues which is generated primarily from sales taxes.
Construction sales tax
General Fund and Bond Revenues.
2% road tax.
property tax, bonds
none
What is the current outlook for pavement preservation funding for the next 20 years for your jurisdiction?
If and when city sees increase in revenue, tax base, etc. may be able to implement program for time being rely on other funding sources to accomplish goals.
58.3%
41.7%
Does your jurisdiction currently have HURF bond debt service?
Yes
No

B-10
This is entirely dependent on the economy, so it's anyone's guess.
We have programmed $2 million annually for expenditure.
Under funded
If the market and economy stabilizes the current sales tax will meet our needs, but the referendum expires in 20 years. If the economy and market do not turn around then we will need to re-evaluate how we approach our program.
Not very good. However, if the proposed $100 million GO bond election passes in November 2012, it would fund next 5 years.
If we do not find consistent funding sources the long term outlook for our pavement management program is questionable.
There is a planned one time increase in rehabilitation funds for the next five years (FY 12/13 to FY 16/17). Maintenance funding will remain the same.
Bleak. The citizens will not accept another tax or fee to pay for government operations. The State must restore funding road maintenance funds.
Unless our funding is drastically improved our outlook is very, very bleak.
about $500K/yr
Please provide any other comments or links to relevant documents. - Open-Ended Response
http://cms3.tucsonaz.gov/home/announcement/street-maintenance.
For every dollar spent on pavement management today saves $6 to $10 in the future.
HURF was established for the maintenance of roadways. However, in 1999 the state passed a new law to fund the enforcement of traffic laws. Thus, relieving the states responsibility to fund DPS. Today, DPS is now fully funded by HURF.
C- 1
FHWA PRIMER ON ROAD MAINTENANCE