Embed Size (px)
DESCRIPTION
The South African National Roads Agency Limited. Road Infrastructure Roll-Out Presentation to the Portfolio Committee Wednesday 6 November 2002 Cape Town. Contents. Network Strategic Objectives Challenges Non-Toll Roads Proposed 5 Year MTEF SANRAL Contribution to Poverty Relief - PowerPoint PPT Presentation
Citation preview

1Portfolio Committee 6/11/2002
Road Infrastructure Roll-Out
Presentation to the Portfolio Committee
Wednesday 6 November 2002Cape Town
The South AfricanNational Roads Agency Limited

2Portfolio Committee 6/11/2002
Contents
NetworkStrategic ObjectivesChallengesNon-Toll RoadsProposed 5 Year MTEFSANRAL Contribution to Poverty ReliefProgress
Toll RoadsConcession Contracts

3Portfolio Committee 6/11/2002
National Roads (7,200km) National Routes (5,300km) – 12,500km Strategic Network (7,500km) – 20,000km Primary Network (18,000km) – 38,000km

4Portfolio Committee 6/11/2002
STRATEGIC NETWORK
KMS
Existing National Road Network 7,200
Provincial Roads-Transfer Already Agreed:
- Free State 760
- Eastern Cape 850
- Western Cape 600
- Limpopo Province 1,950
Provincial Roads-Transfer to be Finalised 8,640
TOTAL STRATEGIC NETWORK 20,000

5Portfolio Committee 6/11/2002
STRATEGIC OBJECTIVES
To provide and manage a sustainable National Road Network
Minimise the cost of road transport Stimulate economic growth Promote Black economic empowerment and
value for moneys Be sensitive to the environment Meet the needs of our road users and
investors Inspire innovative and effective research and
development

6Portfolio Committee 6/11/2002
CHALLENGES
Capacity of delivery institutions (Private and Public) Use existing capacity within Govt Institutional fragmentation
Network layout and responsibilitiesDevelopment of Human Capital
Within the Agency Within the industry sector
Sources of funding

7Portfolio Committee 6/11/2002
Non-TollMTEF Submission 2003-05 (R Mill)
2003/04 2004/052005/06
Baseline fm 2002/03 1,171 1,241 1,315
Depreciation ZAR 117 124 132
Border posts 62 47 5
Traffic Control 180 220 200
Network Expansion 325 880 1,650
TOTAL 1,855 2,512 3,122

8Portfolio Committee 6/11/2002
PROPOSED 5 YEAR MTEF National and Provincial Roads
7
AdditionalFunding
AdditionalAbsorptionCapacity
Stagnation
Poor CompetitionJob & Skills shortagesPoor QualityJob Creation not SustainablePoor Asset Investment
Competitive IndustrySustainable Job CreationGood QualityBalanced Asset InvestmentBalanced Capacity Expansion
Very competitive – loss of capacityMore Value for MoneyAsset lossEmpowerment Stagnation
•Stable flow of funding is important
Macro Impacts of Funding Levels

9Portfolio Committee 6/11/2002
PROPOSED 5 YEAR MTEF National and Provincial Roads
Ideal situation 5-10% poor to very poor condition Maintain rest between fair and very
good condition
Match to capacity Earmarked allocation for
rural/community roads, +/- R3 bn

10Portfolio Committee 6/11/2002
PROPOSED 5 YEAR MTEF National and Provincial Roads
National and Provincial road condition under this scenario
Good FairVery PoorGood Very
Poor
Con
ditio
n

11Portfolio Committee 6/11/2002
PROPOSED 5 YEAR MTEF National and Provincial Roads
WHAT WE ACHIEVE Growth of backlog halted/slowed Rural (inter/intra village) roads boosted
– increase economic growth Many opportunities for jobs, SMMEs
and ABEs Stabilise & grow sector Retain skills Develop Human Capital

12Portfolio Committee 6/11/2002
PROPOSED 5 YEAR MTEF National and Provincial Roads
Rural (village) roads; R150-300k/km to upgrade rural roads Labour; 30-40% of construction in community
pockets Every R100m/year on construction;
513 000 – 684 000 person days on directly employed 300-600 km upgraded per year
=>R3bn over 5 years; 11,5 – 15,4 million person days over 5 years Upgrade 7500-15000km of rural roads Leave R670 – R900m in rural economy over 5 years Excludes multiplier effect of 4 - 6

13Portfolio Committee 6/11/2002
PROPOSED 5 YEAR MTEF National and Provincial Roads
Immediate Strategy;
Use MTEF funds to build Govt and industry capacity
Adapt spending to maintain good roads and prevent further deterioration
Ring fence 10-15%/year for rural (inter/intra village) roads for socio-economic improvement

14Portfolio Committee 6/11/2002
SANRAL CONTRIBUTION TO POVERTY RELIEF
107 Projects in rural areas R230 million allocated of R294 million Estimated employment 950 600 person
days R51,6million on labour Skills development Types of project;
Weed eradication Nurseries for indigenous plants Roads safety projects (education, infrastructure) Roads and Bridges

15Portfolio Committee 6/11/2002
SANRAL CONTRIBUTION TO POVERTY RELIEF
SDI’s; Lebombo: Hluhluwe-Kosi Bay (85%)
St Lucia Wetlands Park (98%)
Total Investment R310,2 million 3900 Jobs created

16Portfolio Committee 6/11/2002
PROGRESS-TOLL ROADS
Funding of roads has always been a controversial subject. This is not only true from a fiscal point of view – tax based revenues need to serve a large number of disparate demands – but also from a road user point of view in having to pay tolls.
It is important to note that the Agency manages approximately 80% of its total network as non-toll roads. This places a large financial burden not only on the Agency but also on National Treasury.
It is for this reason that alternative funding instruments be used and developed to address the infrastructural needs of our country while at the same time reducing the stresses
on tax based revenues.

17Portfolio Committee 6/11/2002
PROGRESS-TOLL ROADS
We are mindful that the implementation of toll roads
hinges on many political, economic and social
concerns. They are not simply a matter of capital
augmentation but also depend on such deeply
embedded societal concerns, such as:
Equity
Income transfer
Environmental issues
Attitude towards taxation
Role of Government

18Portfolio Committee 6/11/2002
PROGRESS-TOLL ROADS
In terms of public sentiment towards toll roads there is seldom a distinction drawn between Agency toll roads and toll roads operated by the private sector under concession agreement.

19Portfolio Committee 6/11/2002
PROGRESS-TOLL ROADS
Extension to existing toll routesRoute Kms Status
N1 Great North 108 - Construction underway,
completion due early 2003
N2 Tsitsikamma 54 - Final environmental approval awaited
N3 Mariannhill 86 - Process anticipated to commence mid 2003
N4 Pretoria 71 - Construction commenced,
completion expected mid 2004
N17 Springs-Ermelo 170 - Pending proclamation of national roads
20Portfolio Committee 6/11/2002
PROGRESS-TOLL ROADS
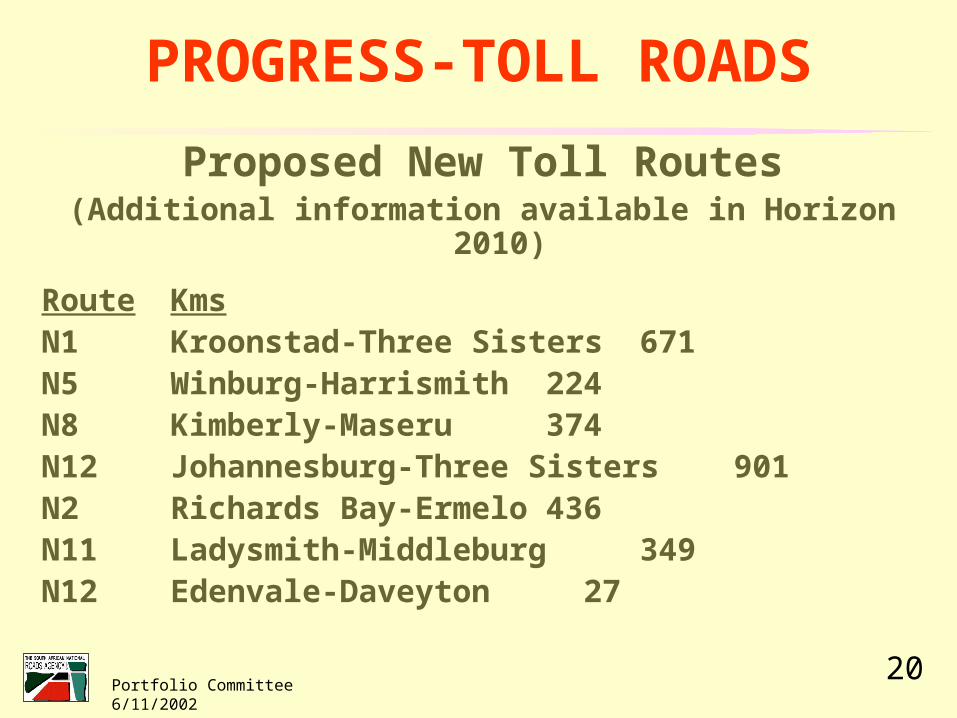
Proposed New Toll Routes(Additional information available in Horizon 2010)
Route KmsN1 Kroonstad-Three Sisters 671N5 Winburg-Harrismith 224N8 Kimberly-Maseru 374N12 Johannesburg-Three Sisters 901N2 Richards Bay-Ermelo 436N11 Ladysmith-Middleburg 349N12 Edenvale-Daveyton 27

21Portfolio Committee 6/11/2002
PROGRESS-TOLL ROADS
Proposed New Toll Routes
The feasibility studies are underway and the Public Participation Process is
currently being designed.
Please refer to “Horizon 2010” for further details

22Portfolio Committee 6/11/2002
PROGRESS-CONCESSIONS
Existing Concession ContractsMaputo Development Corridor (100%)N3 Jhb to Cedara (95%)Platinum (60%)
Total Investment R9.7bn Direct foreign investment R 1bn Jobs created - 10200

23Portfolio Committee 6/11/2002
PROGRESS-CONCESSIONS
Works in the near future;Wild Coast Development Corridor–
commences 2003N1/N2 Development Corridor in
Western Cape – commences 2003/2004
Estimated Investment R3,8bn Estimate of Jobs 8000

24Portfolio Committee 6/11/2002
Proposal for sustaining expanded non-toll network
Proposed total network
TOTAL
20 000 km
NON-TOLL
13 200 km
TOLL
4 000 km
CONCESSION
2 800 km
(1) Current MTEF funding 2002 (5 300kms) 1 061 1 061
(2) Annual expenditure requirement, current toll & concession network
725 370 355
(3) Annual expenditure requirement toll & concession expansion
2 500 2 100 400
(4) TOTAL NATIONAL ROAD NETWORK
ANNUAL EXPENDITURE (1+2+3) 4 286 1 061 2 470 755
(5) Total private sector contribution to annual expenditure requirement (public sector saving) (2+3)
3 225 2 470 755
(6) Reallocation of 65% of public sector saving (5x65%)
0 2 100 -1 600 -500
(7) REVISED PUBLIC SECTOR FUNDING (1+6) 3 161 3 161
(8) Available for other uses (5-6) 1 125
Of the total “saving” to the fiscus, it is proposed that 65% be consolidated into the treasury funding of non-toll roads in order to susin the expansion in the non-toll network and the remaining 35% put to other uses.