Embed Size (px)
Citation preview
ROAD CLASSIFICATION AND CONDITION DETERMINATION USING
HYPERSPECTRAL IMAGERY
M. Mohammadi
Department of Geomatics, Computer Science and Mathematics, University of Applied Sciences Stuttgart
Schellingstraße 24, D-70174 Stuttgart, Germany – [email protected]
KEY WORDS: Hyperspectral, Urban, ALK vector data, Classification, Condition
ABSTRACT:
Hyperspectral data has remarkable capabilities for automatic identification and mapping of urban surface materials because of its high
spectral resolution. It includes a wealth of information which facilitates an understanding of the ground material properties. For
identification of road surface materials, information about their relation to hyperspectral sensor measurements is needed. In this study an
approach for classification of road surface materials using hyperspectral data is developed. The condition of the road surface materials, in
particular asphalt is also investigated. Hyperspectral data with 4m spatial resolution of the city of Ludwigsburg, Germany consisting of
125 bands (wavelength range of 0.4542µm to 2.4846 µm) is used. Different supervised classification methods such as spectral angle
mapper are applied based on a spectral library established from field measurements and in-situ inspection. It is observed that using the
spectral angle mapper approach with regions of interest is helpful for road surface material identification. Additionally, spectral features
are tested using their spectral functions in order to achieve better classification results. Spectral functions such as mean and standard
deviation are suitable for discriminating asphalt, concrete and gravel. Different asphalt conditions (good, intermediate and bad) are
distinguished using the spectral functions such as mean and image ratio. The mean function gives reliable results. Automatisierte
Liegenschaftskarte (ALK) vector data for roads is integrated in order to confine the analysis to roads. Reliable reference spectra are useful
in evaluation of classification results for spectrally similar road surface materials. The classification results are assessed using
orthophotos and field visits information.
1. INTRODUCTION AND RELATED RESEARCH
Comprehensive information about road networks as one of the
transportation features is helpful for assessment and planning of
transportation (routing). Retrieval of road information such as
road surface material and pavement type condition is one of the
essential issues in urban areas. This is done with either traditional
surveying or remote sensing (RS) (Zhang and Couloigner,
2004).The former needs more labour and is more time consuming
in comparison to the latter. Hyperspectral imagery, also known as
imaging spectrometry, is the acquisition of data in many narrow,
contiguous spectral bands (Goetz et al., 1985). It provides more
detailed information in comparison to other remote sensing
techniques. Different chemical materials such as asphalt and
gravel by their corresponding physical (absorption, albedo,
reflectivity etc) properties can be derived on a very detailed level
from the hyperspectral imagery. This characteristic is helpful in
discrimination and extraction of urban area objects especially
those with similar spectral properties. Road surface materials can
be identified with hyperspectral imagery with less cost compared
to field surveying. Most of the available methods for mapping
roads are either manual or semi-automatic. However, these
approaches are time consuming and expensive. In particular, that
they may involve a lot of field work and interpretation of aerial
imagery from which only
limited information can be acquired. Hyperspectral data has
significant potential in terms of automatic identification of road
surface materials. However, no standard approach for mapping
road surfaces and identifying the condition of road surface
materials exists up to date. Most of the methods that exist were
originally developed for mineral detection. Thus it is a challenge
to use these methods in identifying road surface materials due to
the variation of these materials in relatively small regions in the
case of roads.
In recent times there has been an increase in the demand to find
economical automated methods to extract information from
hyperspectral data due to the fast developments in urban areas.
Noronha et al., (2002) focus on extraction of road centerlines,
detecting pavement condition and developing a spectral library.
The analysis of hyperspectral data is done using MultiSpec
software and maximum likelihood classification is applied.
Bhattacharyya distance is used for separability analysis between
road materials and roof types. For better discrimination of roofs
and roads, an object-oriented image classification technique is
used. This technique tries to analyse the homogenous image object
rather than independent pixels. A multispectral sensor (IKONOS)
is used as an ancillary sensor. Comparison of configuration for
urban target separation in spectrometry and multispectral remote
sensing shows that some of the features are not determined in the
latter. This is due to the broadness and location of the bands.
Moreover, its broad band channels do not resolve small-scale
spectral absorption features which are unique for several built up
areas. According to the separability analysis results, concrete and
International Archives of the Photogrammetry, Remote Sensing and Spatial Information Sciences, Volume XXXIX-B7, 2012 XXII ISPRS Congress, 25 August – 01 September 2012, Melbourne, Australia
141
gravel roads are easily distinguishable from asphalt roads. It is not
easy to differentiate between some roads and roof types such as
dark new roads and dark tile roofs. However, there are specific
absorption features for each urban object in the short wave
infrared which help in differentiating them. Segl et al. (2003)
confirm that it is a challenge to use these methods in identifying
urban surface materials due to the variation of these materials in
relatively small regions. A hyperspectral pixel in an urban scene is
generally a mixture of different material components which makes
it difficult to discriminate successfully between certain classes of
materials (Bhaskaran and Datt 2000).
Most of recent methods for analysis of hyperspectral data do not
directly determine the materials and just define how similar the
unknown material is to the known material. There are other
techniques which are able to directly identify the material using
spectral features. A lot of research has been done for applying
these techniques to image spectrometry to have better
classification results. Freek van der Meer (2004) develops a
method for the analysis of hyperspectral images using absorption
band depth and position over mainly mineral material. This
method consists of a simple linear regression formula to estimate
absorption-band parameters from hyperspectral image data which
is easily implemented in ENVI tools for those users that are not
familiar with programming languages. The sensitivity analysis
shows that more reliable results would be achieved by more
accurate absorption band parameters (shoulders, absorption
points). Heiden et al. (2007) develop an approach for urban
feature identification using specific robust characteristics. These
spectral characteristics include absorption bands (depth and
position) or sharp increase and decrease of reflectance.
Separability analysis is used to evaluate the robustness of spectral
features. It is concluded that urban materials need to be described
by more than one type of feature. A similar approach is followed
in this research. It could be helpful in identifying road surface
materials since the focus is on special features such as absorption
depth which may be unique for a particular material. For a
comprehensive review of related work please refer to Mohammadi
(2011). So far there is no standard approach to produce reasonable
results. The analysis techniques for hyperspectral data can be
unsupervised or supervised. Supervised techniques include
similarity measures such as spectral angle mapper (SAM), spectral
information divergence (SID) and spectral correlation mapper
(SCM). Spectral similarity measures are used to identify unknown
spectra based on a comparison with reference spectra. In addition,
unique spectral characteristics within certain wavelength ranges of
some spectra can be used directly to identify materials.
In the following chapters the data of the study area are described.
For the classification of roads using hyperspectral data various
methods have been investigated but only those which led to most
successful experimental results are discussed. The analysis on the
road surface condition is focused on asphalt roads with good
success in identifying roads with good, intermediate and bad
surface condition.
2. STUDY AREA; HYPERSPECTRAL IMAGE DATA
AND PREPROCESSING
The analysis of hyperspectral data to support road surface material
classification is done for a case study in the city of Ludwigsburg.
This city is situated in Baden-Württemberg, Germany, in
particular in the north part of Stuttgart region, near to river
Neckar. The imagery data covers the urban area extending
approximately 11 km x 16 km of this city. The hyperspectral data
was acquired during the HyMap campaign on 20th August, 2010
by German Aerospace Center (DLR) and consists of six strips.
The data consists of 125 bands (ranging from 0.4 µm to 2.5 µm)
and has a ground sample distance of 4 m. ALK vector data for
roads is provided by Fachbereich Stadtplanung und Vermessung
der Stadt Ludwigsburg. The vector data is used for limiting the
analysis to roads. Information on road condition based on field
visits is available from the municipality of Ludwigsburg and the
Vermessungsbüro Praxl und Partner GmbH. The preprocessing of
the hyperspectral data has been done by DLR. The data is
corrected for radiometric, geometric and atmospheric effects. A
high resolution LiDAR surface model of Ludwigsburg with 2 m
raster size was made available for this purpose.
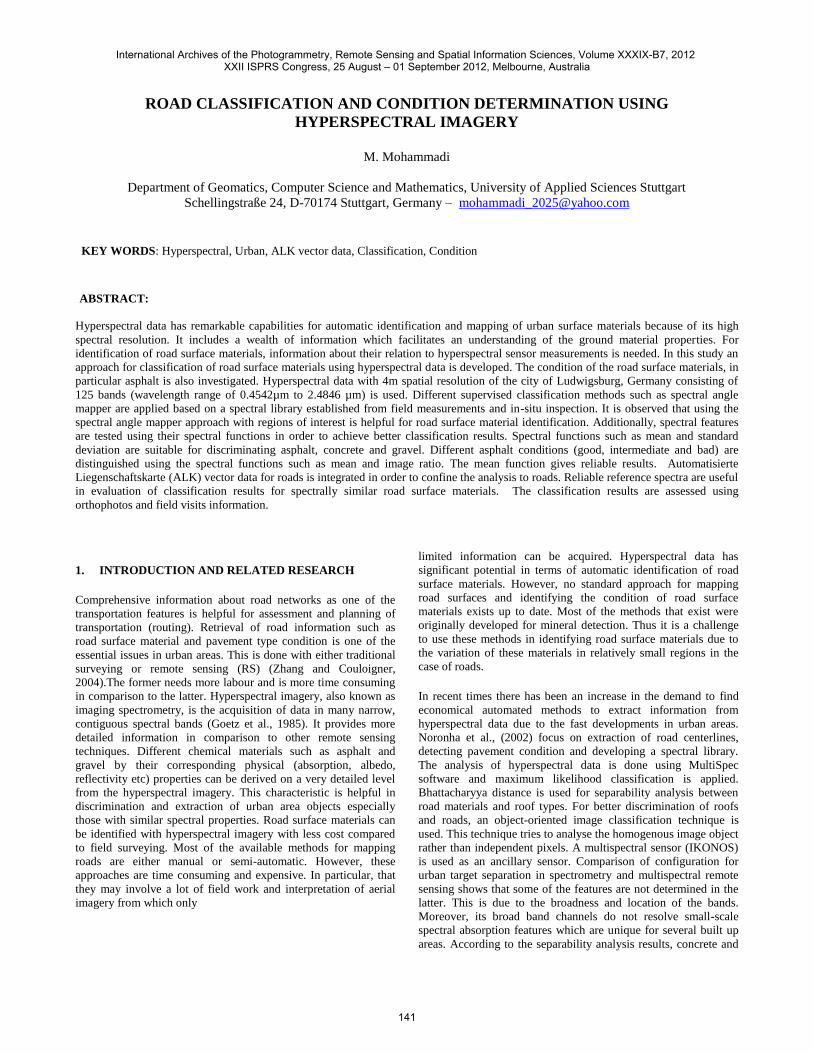
Figure 1 . Research area, Ludwigsburg.
In order to determine how well the HyMap and vector data fit, the
two data sets are overlaid. It is observed that there is a shift
between the two data sets in the order of 10 m. The vector layer
for roads is selected as a source of ground control points. The
GCPs are used to georeference or correct the geographic location
of the HyMap data. After performing an affine transformation, it
is observed that an overall RMS error of about 0.7 pixels is
obtained. A road mask is created from the road vector data.
However, it is observed that the road mask also covers some areas
with vegetation and thus these areas have to be eliminated.
Vegetation spectra for different areas in the HyMap data are
collected and used to create a spectral library. The HyMap data is
classified using the spectral library in order to identify vegetation
areas. A mask is created from the output classification map. This
mask is subtracted from the road mask in order to obtain a mask
limiting subsequent analyses to road surfaces only.
International Archives of the Photogrammetry, Remote Sensing and Spatial Information Sciences, Volume XXXIX-B7, 2012 XXII ISPRS Congress, 25 August – 01 September 2012, Melbourne, Australia
142
3. METHODS AND RESULTS
In order to identify road material types, different supervised
classification approaches are tested. The investigation is in two
parts. The first part discusses the methods and results obtained for
roads surface material identification while the second part focuses
on conditions determination.
3.1 Road surface material identification
Asphalt or more specifically bituminous asphalt is the most used
surface material of road surfaces (pavements) in Ludwigsburg. It
is a composite material of construction aggregate (e.g. gravel,
crushed stone, stand, etc.) and asphalt which serves as a binder.
The mixing is formed in various ways which leads to a certain
“asphalt variety” within classification. Other surfaces in the city
are concrete surfaces, in particular the concrete pavers, and gravel
surfaces. These three main classes, simply called ‘asphalt’,
‘concrete’ and ‘gravel’ are taken into account for road material
identification. In order to map these materials, the SAM criterion
and the brightness spectral feature are used. Training regions are
selected over the calibration sites for the three materials. Each
training region defines a spectrum as an ROI average. Using the
ROI spectra, the roads within the investigation area are classified
based on SAM with the default threshold setting (ENVI) of 0.1
radian. Angles between two spectra larger than this threshold lead
to unclassified pixels. In addition to 0.1 two more spectral angle
thresholds are tested: 0.08 and 0.15 (radians). Best classification
results have been achieved with the lowest threshold of 0.08 but at
the cost of a high percentage of unclassified pixels. The output
classification map based on the threshold of 0.08 is shown in
figure 2. Four different subclasses are defined for asphalt which
are combined to form one asphalt class.
Figure 2. SAM classification using threshold of 0.08 (radians).
In the classification results (excluding non-road pixels), about
29% of the pixels are identified as asphalt, 2% as concrete, 3% as
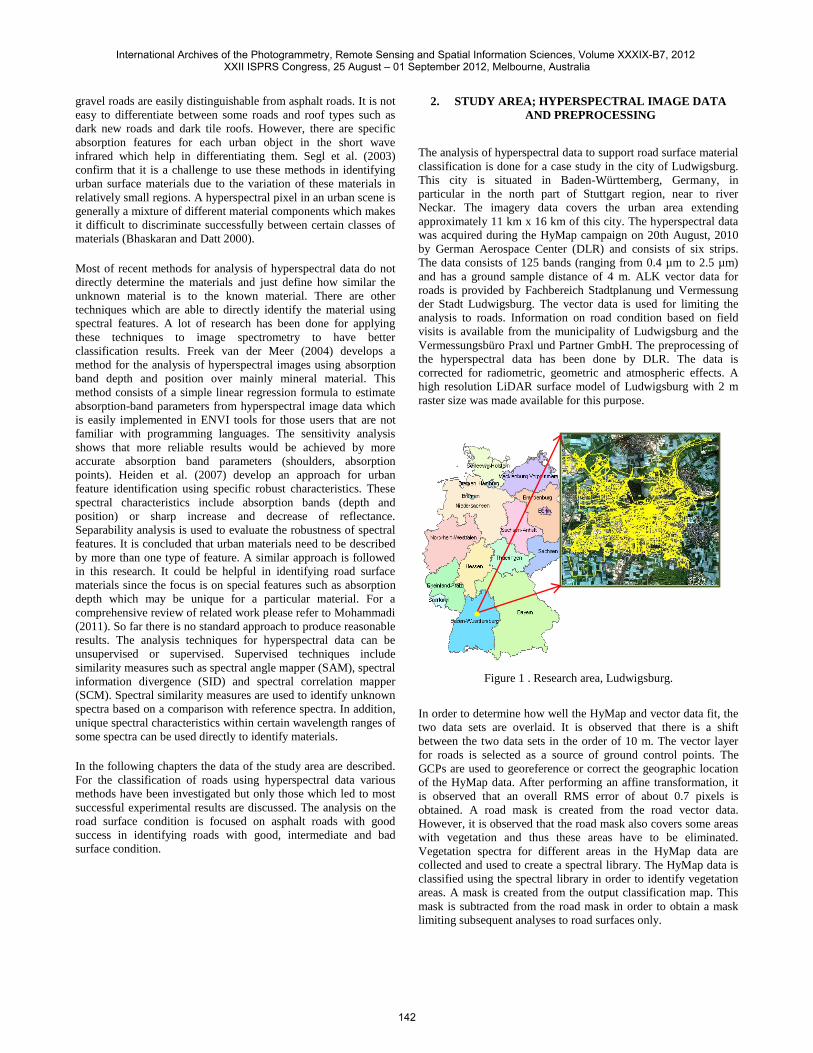
gravel and 66% of the pixels are unclassified. Figure 3 is an
example of an area that shows a road segment of concrete pavers
which is correctly classified. The corresponding spectra (Figure 3)
indicate that the SAM similarity measure is relatively insensitive
to illumination and albedo effects. Besides, field visits confirm
that the material is concrete.
.
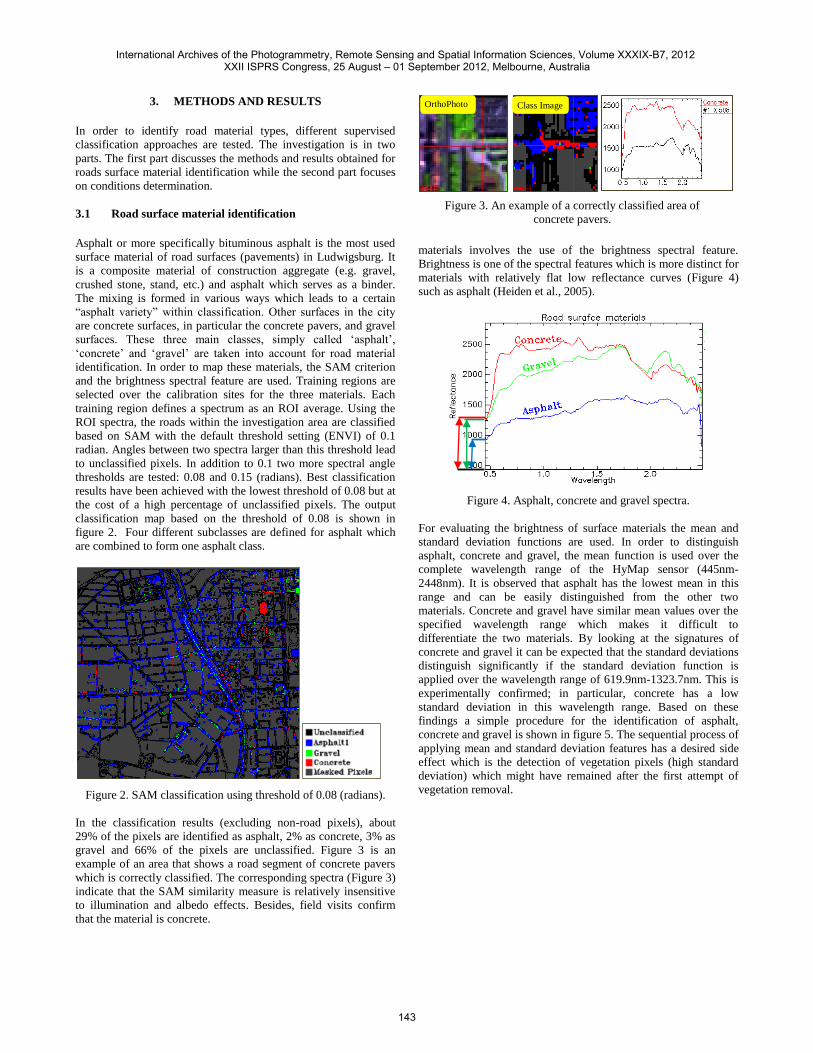
Another approach used in the identification of road surface
materials involves the use of the brightness spectral feature.
Brightness is one of the spectral features which is more distinct for
materials with relatively flat low reflectance curves (Figure 4)
such as asphalt (Heiden et al., 2005).
Figure 4. Asphalt, concrete and gravel spectra.
For evaluating the brightness of surface materials the mean and
standard deviation functions are used. In order to distinguish
asphalt, concrete and gravel, the mean function is used over the
complete wavelength range of the HyMap sensor (445nm-
2448nm). It is observed that asphalt has the lowest mean in this
range and can be easily distinguished from the other two
materials. Concrete and gravel have similar mean values over the
specified wavelength range which makes it difficult to
differentiate the two materials. By looking at the signatures of
concrete and gravel it can be expected that the standard deviations
distinguish significantly if the standard deviation function is
applied over the wavelength range of 619.9nm-1323.7nm. This is
experimentally confirmed; in particular, concrete has a low
standard deviation in this wavelength range. Based on these
findings a simple procedure for the identification of asphalt,
concrete and gravel is shown in figure 5. The sequential process of
applying mean and standard deviation features has a desired side
effect which is the detection of vegetation pixels (high standard
deviation) which might have remained after the first attempt of
vegetation removal.
Figure 3. An example of a correctly classified area of
concrete pavers.
OrthoPhoto Class Image
International Archives of the Photogrammetry, Remote Sensing and Spatial Information Sciences, Volume XXXIX-B7, 2012 XXII ISPRS Congress, 25 August – 01 September 2012, Melbourne, Australia
143
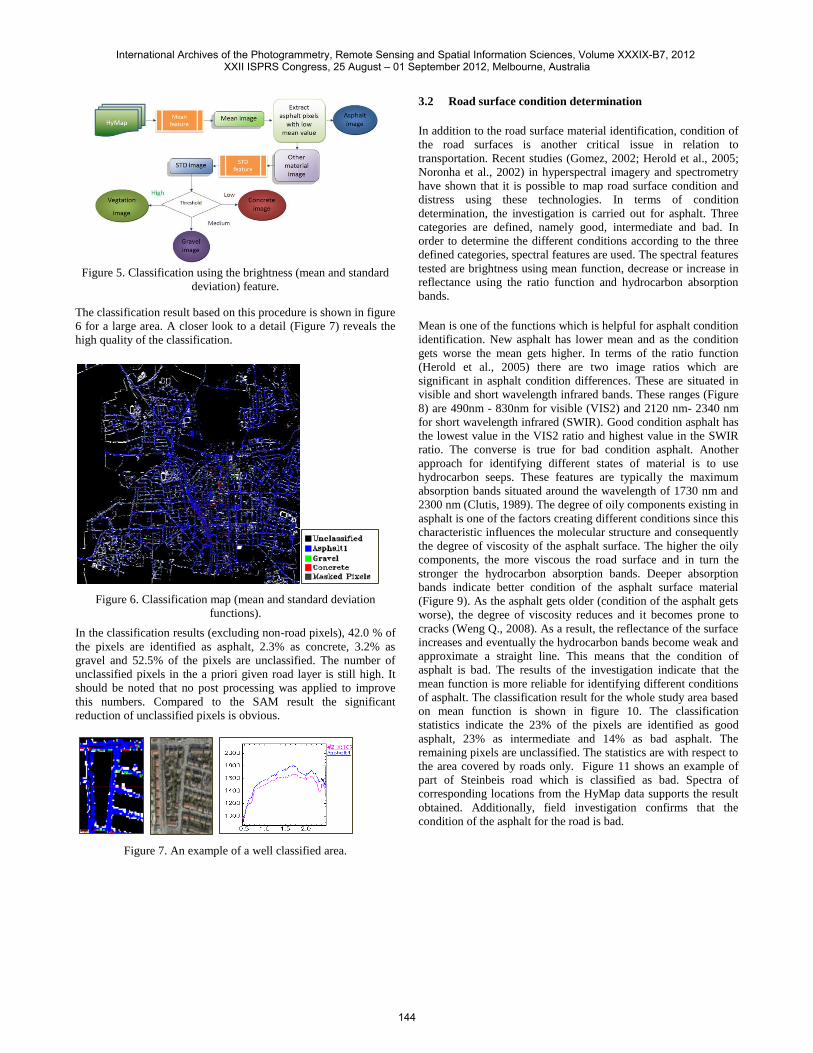
Figure 5. Classification using the brightness (mean and standard
deviation) feature.
The classification result based on this procedure is shown in figure
6 for a large area. A closer look to a detail (Figure 7) reveals the
high quality of the classification.
In the classification results (excluding non-road pixels), 42.0 % of
the pixels are identified as asphalt, 2.3% as concrete, 3.2% as
gravel and 52.5% of the pixels are unclassified. The number of
unclassified pixels in the a priori given road layer is still high. It
should be noted that no post processing was applied to improve
this numbers. Compared to the SAM result the significant
reduction of unclassified pixels is obvious.
Figure 7. An example of a well classified area.
3.2 Road surface condition determination
In addition to the road surface material identification, condition of
the road surfaces is another critical issue in relation to
transportation. Recent studies (Gomez, 2002; Herold et al., 2005;
Noronha et al., 2002) in hyperspectral imagery and spectrometry
have shown that it is possible to map road surface condition and
distress using these technologies. In terms of condition
determination, the investigation is carried out for asphalt. Three
categories are defined, namely good, intermediate and bad. In
order to determine the different conditions according to the three
defined categories, spectral features are used. The spectral features
tested are brightness using mean function, decrease or increase in
reflectance using the ratio function and hydrocarbon absorption
bands.
Mean is one of the functions which is helpful for asphalt condition
identification. New asphalt has lower mean and as the condition
gets worse the mean gets higher. In terms of the ratio function
(Herold et al., 2005) there are two image ratios which are
significant in asphalt condition differences. These are situated in
visible and short wavelength infrared bands. These ranges (Figure
8) are 490nm - 830nm for visible (VIS2) and 2120 nm- 2340 nm
for short wavelength infrared (SWIR). Good condition asphalt has
the lowest value in the VIS2 ratio and highest value in the SWIR
ratio. The converse is true for bad condition asphalt. Another
approach for identifying different states of material is to use
hydrocarbon seeps. These features are typically the maximum
absorption bands situated around the wavelength of 1730 nm and
2300 nm (Clutis, 1989). The degree of oily components existing in
asphalt is one of the factors creating different conditions since this
characteristic influences the molecular structure and consequently
the degree of viscosity of the asphalt surface. The higher the oily
components, the more viscous the road surface and in turn the
stronger the hydrocarbon absorption bands. Deeper absorption
bands indicate better condition of the asphalt surface material
(Figure 9). As the asphalt gets older (condition of the asphalt gets
worse), the degree of viscosity reduces and it becomes prone to
cracks (Weng Q., 2008). As a result, the reflectance of the surface
increases and eventually the hydrocarbon bands become weak and
approximate a straight line. This means that the condition of
asphalt is bad. The results of the investigation indicate that the
mean function is more reliable for identifying different conditions
of asphalt. The classification result for the whole study area based
on mean function is shown in figure 10. The classification
statistics indicate the 23% of the pixels are identified as good
asphalt, 23% as intermediate and 14% as bad asphalt. The
remaining pixels are unclassified. The statistics are with respect to
the area covered by roads only. Figure 11 shows an example of
part of Steinbeis road which is classified as bad. Spectra of
corresponding locations from the HyMap data supports the result
obtained. Additionally, field investigation confirms that the
condition of the asphalt for the road is bad.
Figure 6. Classification map (mean and standard deviation
functions).
International Archives of the Photogrammetry, Remote Sensing and Spatial Information Sciences, Volume XXXIX-B7, 2012 XXII ISPRS Congress, 25 August – 01 September 2012, Melbourne, Australia
144
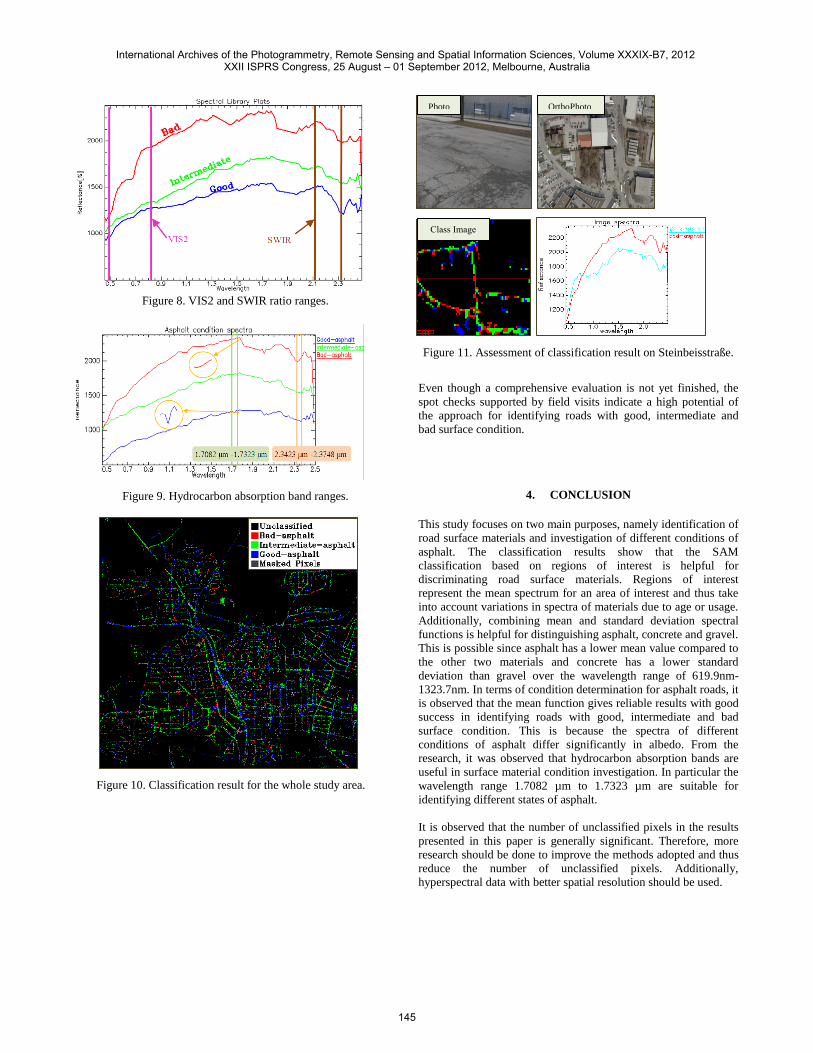
Figure 8. VIS2 and SWIR ratio ranges.
Figure 9. Hydrocarbon absorption band ranges.
Figure 10. Classification result for the whole study area.
Figure 11. Assessment of classification result on Steinbeisstraße.
Even though a comprehensive evaluation is not yet finished, the
spot checks supported by field visits indicate a high potential of
the approach for identifying roads with good, intermediate and
bad surface condition.
4. CONCLUSION
This study focuses on two main purposes, namely identification of
road surface materials and investigation of different conditions of
asphalt. The classification results show that the SAM
classification based on regions of interest is helpful for
discriminating road surface materials. Regions of interest
represent the mean spectrum for an area of interest and thus take
into account variations in spectra of materials due to age or usage.
Additionally, combining mean and standard deviation spectral
functions is helpful for distinguishing asphalt, concrete and gravel.
This is possible since asphalt has a lower mean value compared to
the other two materials and concrete has a lower standard
deviation than gravel over the wavelength range of 619.9nm-
1323.7nm. In terms of condition determination for asphalt roads, it
is observed that the mean function gives reliable results with good
success in identifying roads with good, intermediate and bad
surface condition. This is because the spectra of different
conditions of asphalt differ significantly in albedo. From the
research, it was observed that hydrocarbon absorption bands are
useful in surface material condition investigation. In particular the
wavelength range 1.7082 µm to 1.7323 µm are suitable for
identifying different states of asphalt.
It is observed that the number of unclassified pixels in the results
presented in this paper is generally significant. Therefore, more
research should be done to improve the methods adopted and thus
reduce the number of unclassified pixels. Additionally,
hyperspectral data with better spatial resolution should be used.
Photo OrthoPhoto
Class Image
International Archives of the Photogrammetry, Remote Sensing and Spatial Information Sciences, Volume XXXIX-B7, 2012 XXII ISPRS Congress, 25 August – 01 September 2012, Melbourne, Australia
145
References
Bhaskaran, S. & Datt, B., 2000. Applications of hyperspectral
remote sensing in urban regions.
http://www.gisdevelopment.net/aars/acrs/2000/ps1/ps112pf.htm
(24 Nov. 2011).
Clutis, E.A.,1989. Spectral reflectance properties of hydrocarbons,
remote sensing implementation. Science, Vol. 245, no.4914,
pp.165-168.
Goetz, A.F.H., Vane, G., Solomon, J.E. & Rock, B.N., 1985.
Imaging spectrometry for earth remote sensing: Science, Vol. 228
(4704), pp. 1147-1153.
Heiden, U., Segl, K., Rossner, S. & Kaufmann, H., 2007.
Determination of robust spectral features for identification of
urban surface materials in hyperspectral remote sensing data,
Remote Sensing of Environment, 111(4), pp. 537-552.
Heiden, U., Segl, K., Rossner, S. & Kaufmann, H., 2005.
Determination and verification of robust spectral features for an
automated classification of sealed urban surfaces. In: Zagajewski,
B. and Sobczak, M., (Eds.), Imaging Spectroscopy: New quality
in environmental studies, pp.165-174.
Herold, M., & Roberts, D., 2005: Spectral characteristics of
asphalt road aging and deterioration: implications for remote-
sensing applications. Applied Optics, 44(20), pp.4327-4334.
Mohammadi, M., 2011. Road Classification and Condition
Determination using Hyperspectral Imagery. Master thesis,
University of Applied Sciences Stuttgart, Germany.
Noronha, V., Herold, M., Gardner, M. & Roberts, D.A., 2002.
Spectrometry and Hyperspectral Remote Sensing for Road
Centerline Extraction and Evaluation of Pavement Condition.
Proceedings of the Pecora Conference, Denver, CO.
Segl, K., Heiden, U., Mueller, M. & Kaufmann, H., 2003.
Endmember detection in urban environments using hyperspectral
HyMap data. Third EARSeL Workshop on Imaging
Spectroscopy,Herrsching.
Van der Meer, F., 2004. Analysis of spectral absorption features
in hyperspectral imagery. International Journal of Applied Earth
Observation and geoinformation, 5(1), pp. 55-68.
Weng, Q., 2008. Remote sensing of impervious surfaces. CRC
Press/Taylor and Francis in press, United States of America, pp.
238-241.
Zhang, Q. & Couloigner, I., 2004. A Framework for Road
Change Detection and Map Updating. In: International Archives
of the Photogrammetry, Remote Sensing and Spatial Information
Sciences, Istanbul, Turkey, Vol. 35, Part B2, pp.720-734.
International Archives of the Photogrammetry, Remote Sensing and Spatial Information Sciences, Volume XXXIX-B7, 2012 XXII ISPRS Congress, 25 August – 01 September 2012, Melbourne, Australia
146