Embed Size (px)
Citation preview

ROAD ACCIDENT DATA COLLECTION FORM DESIGN RESEARCH PROJECT L. Smith, K. Fernández-Medina, J. Scoons, G. Beard,
K. McRae-McKee, L. Durrell and R. Hutchins (TRL)

The views expressed in this report are those of the researchers and do not necessarily represent those of Transport Scotland, the Scottish Government or Scottish Ministers.

Contents
Executive summary 1
1 Introduction 4
2 Methodology 6
3 Literature review 7
Purpose and scope 7
Background on the STATS19 form and previous revisions 7
Contributory factor system 8
The Middlesex University form 9
Limitations of the STATS19 form 10
Design of forms for non-data specialists 11
Summary 14
4 Consultation 15
Aims 15
Issues known to Transport Scotland 15
Method 15
Analysis 18
Findings 18
Summary 27
5 Draft form design 29
Methodology 29
General use of the form 29
Details of revised form design 30
Summary 36
6 Vignette study 37
Methodology 37
Content 37
Results 38
Feedback from use of revised form 42
Summary and revisions to form 43

7 Summary and recommendations 45
Summary 45
Recommendations 48
Bibliography 51
Appendices 53

Road accident data collection – form design research project
1
Executive summary
STATS19 is a standard set of data that are collected by the police following personal injury accidents on the public road. The data are collated by local authorities, Transport Scotland and the Department for Transport and are used nationally to monitor trends, inform policy and to identify areas for action. There is no national data collection form; the protocol simply describes what data should be collected and how it should be submitted. In 2013 eight legacy police forces in Scotland merged and formed Police Scotland, and therefore there are likely to be differences to the data collection across the force.
The aim of this project was to review the currently used versions of the STATS19 form by the legacy police forces in Scotland and produce a new form that incorporates recommendations for improvement that could be potentially rolled out nationally to help improve the quality of the personal injury road accident data collected in Scotland.
The content of the STATS19 data is reviewed every five years as part of the quinquennial review across Great Britain, meaning that variables and the information collected could not be considered as part of this work. Therefore, this project focussed on the design of the form and any changes that could be made to improve the completeness and accuracy of the data collected in Scotland.
In order to review and provide recommendations for an improved STATS19 form, a four-stage methodology was undertaken which involved:
reviewing known literature in the field of form design and data quality which could inform a redesign of the STATS19 form
engaging with those who use the STATS19 forms and/or data at all stages of the process (Police Officers, Local Authorities and Transport Scotland statisticians) to understand how the forms and/or data are used, what works well and what they thought could be improved
using the feedback gathered, and with guidance from field experts to develop a revised form
testing and adapting the revised form with potential users to explore the impact of the modifications on user-friendliness, accuracy of data input and consistency
Literature review The STATS19 data collection system was created in 1979, and since then, the design, content and appearance of the system has changed many times as part of quinquennial reviews. The form’s key limitations and inconsistencies have been identified in previous research which suggested that improvements could be made to

Road accident data collection – form design research project
2
the form design, as well as standardisation and training on how STATS19 data should be collected and recorded.
Literature about form design for non-specialists suggests that any form should be tailored around the user and form purpose. Some designs are quicker for users to complete whereas others tend to lead to a better quality of data. Most studies found that participants preferred tick lists or free text boxes to drop down lists and other more interactive input modes but agreed that drop down lists lead to fewer data entry errors. The literature also agreed that participants find forms where the label is above the answer box or to the left of the answer box with right alignment the most comfortable as well as the quickest to use.
Consultation Telephone interviews were undertaken with eighteen stakeholders from Police Scotland, Local Authorities, and Transport Scotland. All eight of the legacy Scottish Police force areas, believed to be using different STATS19 recording systems were represented in the consultation (seven legacy forces were represented by Police contacts, while the eighth was covered at Local Authority level).
Generally the types of form used, the processes followed and user perceptions varied. It became clear throughout the interviews that no consistent approach is used, despite widespread agreement that consistency is desirable. One legacy force used a PDA to report data; the other respondents wrote notes in their notebook and completed a STATS19 form later at the Police station. Different stakeholders also had different ideas as to why the data were collected and how it was used.
Local Authority representatives described one of the challenges that they face is related to errors about location data provided by Police Officers via the STATS19 forms. This data was viewed as critical for them to reach their road safety goals, particularly in terms of identifying problematic contributory factors or high frequency accident areas.
The consultation revealed that while Police Officers did not identify any specific areas of improvement, they did raise a number of small, usability issues. These mostly related to user friendliness and adding information or options to facilitate more accurate data input. None of the participants identified specific redundant or less useful variables, even though they suggested shortening the form to make it more user-friendly.
Form design and vignettes The revised STATS19 form was developed using insights from the literature review and the consultation as well as expert opinion. The form was designed to ensure that it was in a usable format for the Police or other users. Based on the information about the way in which accident data was collected from the consultation, a paper-

Road accident data collection – form design research project
3
based form was not felt to be the most appropriate format, therefore the revised form was developed using Microsoft Excel.
The revised Excel form was designed to reduce or eliminate some of the accuracy issues highlighted in earlier tasks, while also incorporating any relevant best practice guidelines identified in the literature to enhance its layout and design. Some of the feedback on the draft revised form, as well as information obtained from the literature review and the results of the analysis of the data received relating to the vignettes, described below, were used to make further amendments to the form.
Four vignettes (fictional accident case studies) were developed, refined and tested with Police Officers who had participated in the consultation. They were designed to include collision types known to cause confusion or result in inconsistencies as identified in the consultation and literature review. The revised form yielded more accurate and more consistent results than the forms that the Police Officers were used to completing and qualitative feedback from users indicated that the revised form was well-received. Some of the feedback and findings were used to make further amendments to the revised form before it was finalised.
Findings and outputs The output from this project has been the successful development of a suggested revised example STATS19 form, based on evidence from users of the form that may lead to improved data quality. Developing the form in Microsoft Excel was considered to be an improvement in terms of the accuracy and ease of completing, and respected Transport Scotland’s requirement for a solution that did not need large scale IT resources, hardware and training.
Alongside the development of the revised form, a number of future recommendations were identified relating to the data collection process, options for training and enhancing user engagement with the form, as well as modifications or refinements to variables and data collection items.

Road accident data collection – form design research project
4
1 Introduction STATS19 is a standard set of data that are collected by the police following personal injury accidents on the public road. The data are collated by local authorities, Transport Scotland and the Department for Transport and are used nationally to monitor trends, inform policy and to identify areas for action. There is no national data collection form; the protocol simply describes what data should be collected and how it should be submitted. In 2013 eight legacy police forces in Scotland merged and formed Police Scotland and therefore there are likely to be differences to the data collection across the force.
The aim of this project was to review the currently used versions of the STATS19 form across the different legacy Police forces in Scotland and produce a new form that incorporates recommendations for improvement. The form could potentially be rolled out nationally by Police Scotland to help improve the quality of the personal injury road accident data collection process in Scotland. The content of the STATS19 data is reviewed every five years as part of the quinquennial review across Great Britain, meaning that variables and the information collected could not be considered as part of this work. Therefore, this project was focussed on the design of the form and any changes that could be made to improve the completeness and accuracy of the data collected in Scotland.
In order to achieve this aim, a four-stage approach was used beginning with an evaluation of existing evidence relating to both general form design for non-specialists and the design and use of the STATS19 form as well as a consultation with stakeholders. The information gathered in these two stages, supplemented by an internal expert workshop informed the design of a revised STATS19 form. The final stage of the project was to test the form. This was achieved by developing a series of vignettes (fictional accident case studies) and approaching the Police
Officers from the consultation to complete them based on the revised form and the form that they currently use. This enabled us to review the impact the revised form had on accuracy and consistency of data input.
Following feedback on the revised form and the analysis of the data received relating to the vignettes, the output from this project is a tested, revised version of the STATS19 form designed (based on user feedback) to have an improved, more user-friendly layout that can help unify the data collection and recording process among Police Officers in Scotland hopefully leading to greater data quality.
In this report, we present results from all phases of the work. Section 2 presents the overall methodology for this research project. Section 3 provides the results for the literature review, Section 4 details results from the consultation with STATS19 users including issues known to Transport Scotland about the forms. Section 5 details of the methodology employed for the development of the revised form and the format of a series of vignettes to test the revised form. The results of this testing (both

Road accident data collection – form design research project
5
quantitative and qualitative) can be found in Section 6. Finally, conclusions and recommendations are discussed in Section 7.

Road accident data collection – form design research project
6
2 Methodology In order to achieve the aims of this project, we employed a methodology comprised of four tasks:
Task 1 – An evidence review of the most up to date existing evidence relating to both general form design for non-specialists and the design and use of the STATS19 forms
Task 2 – A detailed consultation phase collating views and experiences from a range of STATS19 stakeholders in Scotland. This included members of Police Scotland, Transport Scotland and Scottish Local Authorities
Task 3 – Based on the information gathered from Tasks 1 and 2, and the results of a workshop involving members of the team and field experts, we designed a revised STATS19 form for collection of the relevant data
Task 4 – Testing the revised collection form was vital to ensure that it is useful and usable. The final stage included a reliability study using a series of vignettes to explore whether the form could be understood and used correctly to produce accurate STATS19 records. Qualitative data from users was also obtained as part of this task
Figure 1 shows how these tasks fit together to achieve the project aim.
Figure 1: Summary of method adopted

Road accident data collection – form design research project
7
3 Literature review Purpose and scope The purpose of Task 1 was to review known literature to identify relevant knowledge in the field of form design and data quality which could inform a redesign of the STATS19 form, and the historical changes to the design and use of the STATS19 system. Literature was identified from the following sources:
documents specified in the Invitation to Tender
known references recommended by TRL STATS19 experts
references provided by a Local Authority representative during engagement with stakeholders
relevant references identified through a literature search by the TRL information centre
Background on the STATS19 form and previous revisions The term STATS19 was first introduced in 1979 following the development of a new injury collision reporting system in the late 1970s.
The STATS20 documentation (Department for Transport, 2011) details exactly what data are required to be collected by the Police as part of the STATS19 system. This includes data on all road collisions they attend or are made aware of in which at least one person is killed or injured. The data cover the circumstances of the collision (e.g. road layout, speed limit, weather conditions), the vehicles involved (e.g. types, manoeuvres, driver details) and the casualties resulting from the collision (casualty ages, severity of injury, whether they were a driver, passenger or pedestrian).
STATS20 and STATS21 provide instructions for the completion of the STATS19 data, and details of the validity checking processes, respectively. In order to aid systematic collection of the STATS19 data, the Department for Transport (DfT) and Transport Scotland produce illustrative STATS19 forms. Use of the illustrative forms is not mandatory and indeed many Police force areas choose to use alternative data collection methods, for example some Police forces design their own paper forms (e.g. Tayside, see D.1) and some collect data via a form on a PDA (e.g. Ayrshire see D.2).
The criteria for the collection of data at road accidents are reviewed approximately every five years (the review is led by the Standing Committee on Road Accident Statistics: SCRAS); as a result the data collected have changed several times since 1979. Previous updates have involved changing the fields and variables collected

Road accident data collection – form design research project
8
and some different illustrative forms have been produced during this time (see Figure 2).
Figure 2: Example page layout used in a) 1999 and b) 2004 Department for Transport illustrative STATS19 forms Contributory factor system The contributory factor system was designed to record information related to why and how each road accident might have occurred, in order to provide insight into how such accidents might be avoided in the future.
A quality review in 2002 revealed considerable variability in the methods used to collect and record contributory factors across Police forces (DfT/SCRAS, 2006). Following recommendation by the University of Southampton’s Transportation Research Group (The Scottish Government, 2003), the contributory factor system was simplified from a two-tier system to a single tier system. The number of possible confidence levels for each contributory factor was also reduced from three to two, simplifying the recording system further. The current system allows Police Officers to record factors as either very likely or possible.
As part of the major update in 2004, the ‘contributory factor system’ was integrated into the illustrative STATS19 data collection form. The system was further reviewed in 2011 when an additional factor was included. Up to six factors (out of a possible 78) may be recorded by Police via the STATS19 form. Contributory factors are the opinion of the reporting Police Officer based on the evidence presented at the time of the collision and are not necessarily the result of an in depth investigation. The Department for Transport state that “contributory factors are largely subjective and

Road accident data collection – form design research project
9
depend on the skill and experience of the investigating officer”, and so advise that “care should be taken in… interpretation” (Department for Transport, 2011, p. 2).
The Middlesex University form In response to a technical report which identified inconsistency in the reporting of STATS19 road accident data (Lupton, Jarrett and Wright, 1997), researchers from Middlesex University (Wright, 1999) were tasked with designing a new Police accident report form (known as the ‘Middlesex University form’) based on the 1999 version of STATS19.
Police forces across Great Britain were surveyed to obtain information on current methods of data collection, the types of forms used for recording data and the strengths and weaknesses of these methods. This information informed the design of a new form (see Figure 3) which was subsequently piloted by eight of the Police forces across GB in order to obtain comments and feedback on the design.
Figure 3: Example screenshots of Police accident report form developed by Middlesex University (Transport Scotland, 2013). From Police feedback, the researchers concluded that the form completion process could be simplified and the likelihood of errors could be reduced by following ‘sound principles of graphic design’. However, it was also noted that production of a ‘universal’ form which met the requirements of all Police forces may be impractical due to differences in the requirements of different Police forces.
Road accident data collection – form design research project
10
Limitations of the STATS19 form Some previous research has been conducted across GB to assess the limitations of the STATS19 form. For example, the study which influenced the Middlesex University form (Lupton et al, 1997) found inconsistencies in the reporting of road class, breath test, point of impact and school pupil casualties.
A later study by Wright (1999) compared the attributes of a subset of STATS19 collisions with the attributes extracted from the road network to which the collisions had been associated. Inconsistencies were identified which suggested errors in the recording process, in particular for fields relating to junction type, junction control, carriageway type and speed limit. The majority of Police forces across Great Britain responded to a survey about STATS19 data collection. From these responses, Wright (1999) concluded that:
STATS19 forms are generally not completed at the scene of road accidents
only half of the Police forces surveyed indicated that training was provided on how to complete STATS19 forms
accident location, causation factors1, direction of travel and severity were reported as the most difficult fields to complete
an A4 format was preferred for the form since this would be easiest to photocopy and file
61% of those surveyed indicated that they would not want colour to be introduced due to the costs associated with printing
most of the Police forces surveyed stated that they would be interested in computerised data collection, subject to cost
Wright (1999) also identified considerable variation in the format of accident reporting adopted by Police forces, including pocket books, full-size A4, single documents and multiple documents, and personal databases used for recording information electronically. Key limitations identified with the form design (relevant to the 1994 version of the illustrative STATS19 form) included:
illogical sequence of questions
little use of headings or colour to indicate hierarchy
difficult to read due to small font
1 These causation factors have been developed and renamed, and are now part of the contributory factor
system which was rolled out across GB in 2005.

Road accident data collection – form design research project
11
different methods of questioning and answering were used on the same form with few instructions
requiring officers to enter numbers rather than using a check box
A more recent study by Lupton (2001) identified that, where multiple accidents occur on the same stretch of road, data related to the road layout and features (e.g. speed limit, road type) are captured within the STATS19 data multiple times. The author suggested that it may be possible to define a road network for which all the road features are pre-recorded in a database so that they do not need to be repeatedly entered on the STATS19 database. However the report did not make it clear how this would work in practice.
Fraser (2009) analysed the consistency of data recorded in multiple fields within the STATS19 database. Several inconsistencies were identified including confusion over coding pedestrian collisions: Contributory factor number 801 is ‘pedestrian crossing road masked by stationary or parked vehicle’. It is also possible to include details of a pedestrian being masked by a parked or stationary vehicle in the field ‘pedestrian movement’. Thus, it might be supposed that a large proportion of collisions recorded with these ‘pedestrian movement’ details would also be recorded with contributory factor 801, and vice versa. However, Fraser’s (2009) analysis revealed several inconsistencies in recorded data related to these fields suggesting the recording process may need to be simplified. One suggested solution was that a ‘tick box’ layout may be easier for Police to record data accurately, as opposed to having to select options from a long list of codes.
Design of forms for non-data specialists This section presents findings from a review of the available literature as identified by the TRL information centre in relation to general form design. Eight relevant articles were identified.
The focus of the literature on how the design of a form can affect its usability has centred around two main topics of interest; the answer input mode and the alignment of the questions or labels2. The majority of this work has concentrated on online and computer-based forms and surveys, with little research on paper forms being available. However, some researchers have suggested that a user-centred design for online forms should be derived from a format that is already well known to the user such as paper forms (Garrett, 2002 cited in Bargas-Avila, Brenzikofer, Roth, Tuch, Orsini, & Opwis, 2010) meaning that similar principles may apply to both.
Heerwegh and Lossveldt (2002) compared the usability of online forms with various answer input modes and found that participants had a slight preference for radio
2 For the purpose of this report, a label is a word, phrase, or sentence that informs the form user what to enter
into the answer field for example ‘date’, ‘name’, and ‘vehicle type’.

Road accident data collection – form design research project
12
buttons compared to drop down lists. Radio buttons are a graphical control element that changes appearance when the user clicks on them to show the answer they are selecting. However, they also found that neither format had significant consequences on the quality of the data collected via the forms. The researchers concluded that form design should be based on the sample preferences and the overall purpose of the form.
Another piece of research investigating online forms by Bargas-Avila, Brenzikofer, Tuch, Roth, and Opwis (2011) compared the usability of forms using dropdown lists, free text (including several different conditions with differing label alignment), or a calendar to report a specific date shown to the participants at the top of the form. To determine the usability of each format, the authors analysed the answer format (for example, looking to see if the participants use the correct number of digits in the year), the level to which the answer was correct, the completion time, and the satisfaction of each participant.
Both the calendar and dropdown list versions eliminate answer formatting errors by making it impossible to enter a date in the wrong format, however, the wrong data can still be entered. All free text options had significantly higher formatting error rates. The quickest forms to complete were the free text versions, in particular those with a label to the left of the answer box or a label inside the answer box which disappeared once the participant started to enter the date. These versions were significantly quicker to complete than the free text options requiring the day, month and year to be entered into separate text boxes. They were also significantly faster than the dropdown list and calendar versions. Despite the elimination of formatting errors, the calendar version was the only version that was significantly lower than the others on date accuracy. This may be due to the fact that the calendar version was the only one to require the use of a mouse which may result in clicking errors. Also, a wrong date may have been easier to select than the correct date due to its proximity to the cursor and the number of clicks required whereas entering a wrong date in other versions such as free text takes a similar amount of effort to entering the correct date.
Finally, the measures of user satisfaction found that forms where the labels were inside the answer box were seen as less comfortable to use whereas single text boxes with a label to the left were rated the most comfortable to use. Overall, this suggests that for quick and satisfactory data entry, a single answer box with a label to the left would be most appropriate. Alternatively, for accurate data entry, drop down lists should be used. Conversely, Nielson (2000) suggested that dropdown lists reduce usability if not all the options are visible at once and can be frustrating for people entering well known information.
Hogg and Masztal (2001) conducted a piece of similar research into answer input modes and compared dropdown lists to radio buttons and free text boxes. Their results showed that radio buttons were much quicker for the user but that some

Road accident data collection – form design research project
13
users in this condition appeared to tick the same answer box for all the questions which suggests that dropdown lists may lead to more valid data collection.
Research looking more closely into answer format found that to increase the proportion of participants who use the desired format within free text boxes where the format is not fixed, the answer fields should provide information about the desired response format such as using different sized boxes to imply the size of the required answer (Christian, Dillman, & Smith 2007). This research also found that using labels that encourage the desired format also increased the likelihood of this format being used by participants such as the labels “MM” and “YYYY” for the month and year.
Other literature has looked into the effects of the alignment of the question or label used in a form on data quality and form usability. Das, McEwan, and Douglas (2008) used eye tracking technology on a small sample of participants to evaluate label alignment in online forms. The labels were presented either above or to the left of the answer box. Those presented to the left were either aligned to the left or the right. The analysis found that participants with the labels above or right aligned completed the form substantially faster than those with the label aligned to the left. The authors suggest that for forms with constrained space, using left labels with right alignment would be the better option, whereas if space is not a confining issue, top labels should be used. However, no attempts were made to control the order of the completion of the different forms meaning practice effects may be present within the results. The results may also have been influenced by the increased amount of space between the label and the answer box caused by the left alignment and column spacing used in this condition.
These results are similar to those found by Penzo (2006) who also used eye tracking to analyse both the label alignment and the answer input mode. This research found that left alignment of the label took a single eye movement and led to good form performance based on time and accuracy. However, this eye movement was relatively slow compared to the other conditions where participants made more eye movements at quicker speeds. This suggests that the left alignment causes a relatively high cognitive load created by the increased distance between the labels and answer box. Participants were also found to pay more attention to drop down boxes; the authors suggested this was possibly due to the increased interactive element implying greater importance. However, participants took longer to complete forms using drop down lists due to multiple eye movement towards the label. The form versions using right aligned labels were the fastest to complete and required less visual fixation. Other research findings from this experiment included the finding that using a bold font in the label increased fixations and form completion time.
Bargas-Avila, Brenzikofer, Roth, Tuch, Orsini, and Opwis (2010) conducted a literature review about online form design and produced 20 guidelines on how to design usable forms. The guidelines are presented in Appendix B. Those with empirical support include placing the label above the input field to enable quick data

Road accident data collection – form design research project
14
entry, coordinating the size of the answer field to the expected length of the answer, using check lists for multiple answers, using drop down lists where there is more than four options, and using labels that imply the required format.
Summary Since its inception in 1979, the design, content and appearance of the STATS19 collection system has changed multiple times. Across Scotland there appears to be considerable variation in the methods of data collection used in Legacy Police Force areas, presenting challenges for the production of a universal form which meets the requirements of every area. However, key limitations and inconsistencies have been identified in previous research which may be addressed through a new form design, standardisation and training on how STATS19 data should be collected and recorded.
The literature suggests that the design of a form for non-specialists should be tailored around the user and form purpose. Some designs are quicker for users to complete whereas others tend to lead to a better quality of data although they cannot eradicate incorrect data entry. Most studies found that participants preferred tick lists or free text boxes to drop down lists and other more interactive input modes but agree that drop down lists lead to fewer data entry errors. However, drop down lists have been found to work well if all options are visible simultaneously and no scrolling is required because they can attract users’ attention more than other input formats. The literature also agreed that participants find forms where the label is above or to the left of the answer box with right alignment the most comfortable as well as the quickest to use.

Road accident data collection – form design research project
15
4 Consultation Aims The purpose of this phase was to engage with those who interact most with the STATS19 form and data (the people who record, enter, process and use the data) in order to gain a better understanding of challenges and/or barriers to accurate data collection that users experience.
The specific aims of the consultation were:
1. To undertake qualitative interviews with stakeholders; 2. To analyse the interview data in order to identify key themes and trends in
responses; 3. To identify any differences or conflicts between users’ perceptions and use of
the form. These aims were achieved by a series of qualitative interviews with different stakeholder groups in Scotland, as well as engagement with those involved in the project from Transport Scotland. Issues known to Transport Scotland Transport Scotland provided documents with known areas of concern in the collection of the STATS19 data. These issues are recorded and reported in order that they can be reviewed periodically in line with the quinquennial reviews carried out by the Standing Committee on Road Accident Statistics (SCRAS). Table A-1 in Appendix A highlights the results of one such report including detailed information on common issues with data recording on the STATS19 form. Data inaccuracies were flagged relating to contributory factors and to casualty, vehicle and accident records. This information was compiled by Transport Scotland based on their own experiences with STATS19 data and feedback from other stakeholders. Method Sample Telephone interviews were undertaken with eighteen stakeholders from Police Scotland, Local Authorities, and statisticians from Transport Scotland. All eight of the legacy Scottish Police force areas, believed to be using different STATS19 recording systems were represented in the sample:
1. Central Scotland Police
2. Dumfries and Galloway Constabulary

Road accident data collection – form design research project
16
3. Fife Constabulary
4. Grampian Police
5. Lothian and Borders Police
6. Northern Constabulary
7. Strathclyde Police
8. Tayside Police
For some of the areas, more than one type of STATS19 form user was interviewed, although for Lothian and Borders, only Local Authority representatives were interviewed. This was mostly due to participant availability to take part in the interviews.
The final sample was comprised of 18 interviewees across the three stakeholder groups. Table 1 provides a breakdown of the sample and the areas represented.
Table 1: Breakdown of interview sample
Area Current division code
Stakeholder group
Number of interviewees
Dumfries and Galloway
V Police 1
Grampian A, B Police 3
Northern N Police 1
Central C Police 2
Strathclyde U Police/ Local Authority
2 (1 each group)
Fife P Police/ Local Authority
2 (1 each group)
Lothian and Borders E, J Local Authority 3
Tayside D Police 1
Transport Scotland n/a Statisticians 3
TOTAL 18
Typically, the level of experience with STATS19 data of those interviewed (excluding the Transport Scotland representatives) was high. The average level of experience reported was approximately 15 years. The participant with the least experience had worked with this data for 5 years (Police); while the two participants with the most experience reported having worked with STATS19 for 25 years (one from the Police and the other from a Local Authority).

Road accident data collection – form design research project
17
One participant (from a Local Authority) reported having “very limited” experience with STATS19 data, as their role only involved using high level data mostly for educational interventions and other aspects of evidence-based practice.
Recruitment Recruitment was facilitated in part by contacts provided by Transport Scotland, who served as gatekeepers into the organisations of interest. TRL staff then established contact with these organisations, either to book an interview with a particular named individual or to obtain details for other potential interviewees.
Interviews were arranged at a time convenient to the interviewee and participants did not receive an incentive for taking part in the research.
Format of telephone interviews A semi-structured interview format was used in order to ensure consistency in the data collection process.
Two topic guides were developed that covered issues relating to the different stakeholder groups involved in the interviews. One version was created specifically for Police STATS19 users as these were expected to have different experiences with the form and be aware of different issues with STATS19 data collection compared to those from Local Authorities and Transport Scotland (who had another version of the topic guide).
The duration of interviews was between 30 and 40 minutes depending on the amount of experience of using STATS19 data and the information that participants were willing to share.
Although most interviews were carried out on a one-on-one basis (one researcher and one participant), one interview (carried out with the Transport Scotland statistics team) was completed with three interviewees at the same time. All interviews were undertaken by one of two experienced qualitative researchers from TRL.
Outputs During the interviews, the researcher took detailed notes of the participant’s responses. Each interview was summarised according to the following key factors:
data completion process and related challenges
suggested new variables
misunderstood variables
variables that are often coded or entered incorrectly

Road accident data collection – form design research project
18
clarification requests
use of STATS19 data and STATS20 manual
general remarks on STATS19 use, improvements, or understanding
Analysis Qualitative thematic content analysis was applied to notes made in the interviews and is reported in the following sections. Thematic content analysis is a technique that can be defined as the “systematic, objective, and quantitative analysis of message (or theme) characteristics” (Neuendorf, 2002). The steps involved in this analysis included:
preparing the data for analysis – this involved reading all of the interview notes to ensure that they were accurate representations of what was said in the interviews.
closer examination of the text – the text was reviewed line by line to facilitate micro-analysis of the data
initial identification of themes – this occurred in two stages. Firstly, researchers identified topics of interest individually which were sorted into ‘themes’ – i.e. quotes and sections of the interviews relating to similar topics. Secondly, the two researchers took part in a short workshop where possible emerging themes were discussed and justified
re-examination of the text for relevant examples of each theme – each set of notes was re-examined for information relating to the themes identified in the above exercise
construction of the final structure of each theme – the name, definition and supporting data were re-examined for the final construction of each theme using all of the data relating to it
reporting of themes – each theme was described and illustrated by use of quotes from the original text (where possible) to help communicate participants’ meaning
Findings Current STATS19 data collection practices Before discussing the results of the interviews, it is important to contextualise these results by providing insight into the types of forms and processes used by the legacy Police areas interviewed.

Road accident data collection – form design research project
19
The process for collecting data reported by most Police interviewees involved the attending Police Officer recording accident details in a notebook at the scene. Upon returning to the Police station, the same attending officer entered the information into a STATS19 ‘form’ (which may be the illustrative DfT/Transport Scotland form or local versions). In some cases this was a fully electronic format (including drop-down boxes) while in others it was a Microsoft Word template (with blank fields). One participant suggested that the reporting officer does not always fill in the form, sometimes it is the enquiry officer on duty who undertakes this task based on the attending officer’s notes.
Another participant reported a practice where attending officers telephone a ‘voice bank’ who then input the data. However, even though attending officers did not complete the form personally, in this case, notes were still made and kept by the officer. The use of a ‘voice bank’, however, did not seem to be widespread among legacy Police Force areas.
The final method reported by interviewees involved the use of a Personal Digital Assistant (PDA) used to collect data at the scene, which then synchronises and uploads data automatically onto a computer. This did not appear to be common practice across other legacy forces.
Themes A number of themes emerged from the interviews undertaken. These have been divided into major and minor themes. Major themes are those that emerged consistently across interviews, and minor themes are topics that were not repeated frequently, but that warrant discussion. These are presented below.
Major themes
Experience governs the way in which data is captured and entered One prominent finding from interviews, particularly those carried out with Police, was the role played by ‘experience’. Police Officers do not necessarily memorise the particular details of the STATS19 form, instead they rely on their experience to know and understand the information that needs to be collected at the scene of the accident.
“We have a knowledge of the information that’s required…” – (Police)
There is some understanding among Police Officers of the limitations of the manual process of note-taking, for example identifying the precise location and compass points of the road traffic collision (RTC). “You’re not going to know that [compass points] just off the top of your head.” (Police)
Road accident data collection – form design research project
20
Nonetheless, respondents in this group believed that the method they currently employ is the most efficient way of collecting the necessary data. “There isn’t any other way of recording [RTC data]” (Police) In fact, when asked why this method was selected, responses generally indicated that it was standard practice, “what’s always been done”. “If we attend a road traffic collision, we’d always have notes… It’s just something everyone does…” (Police)
Experience was not only valued by stakeholders representing the Police; some Local Authorities also described using their experience to work with the STATS19 data. For example, one participant mentioned using a combination of available data and their own experience to correct errors relating to location. Another participant believed his organisation had the systems and knowledge available to check missing or incorrect data; they will only resort to seeking clarifications from the Police if the data is for a serious or fatal accident. No further information was provided as to who (administrative staff or attending Police Officers) provide the clarifications.
Accurate logging of location is a major challenge Although, generally, Police interviewees did not believe there were major issues with obtaining accurate RTC information, several participants mentioned some issues related to specific details such as location (geo coding, and the compass points – for example, was the accident-involved vehicle travelling North to South). This type of information may not be written down at the scene of the accident; instead the attending officers described having to conduct some research when they get back to their station in order to complete this part of the form. However, officers seemed to believe that the experience of having attended the scene is enough to be able to complete this information accurately.
The issue regarding location was also raised during interviews with Local Authorities and Transport Scotland representatives as well, particularly as this data was described as being more prone to errors when submitted. The issue of location inaccuracies seemed to be particularly problematic for Local Authorities as this data was viewed as important in reaching the organisations goals in road safety.
“Grid references are critical…” (Local Authority) Some participants provided information about the number of incorrect forms to quantify the size of the problem, particularly referring to clarifications relating to location.
Road accident data collection – form design research project
21
“We may send back 2 or 3 cases [out of ~35] for clarifications, in a month.” (Local Authority)
“In most cases it’s incorrect [grid reference] and I have to give it a new grid reference based on my experience, the accident description and the location description.” (Local Authority)
The scale of the problem, however, was not the same for all users of the data. Although not all participants from Local Authorities mentioned specific organisational issues arising from location inaccuracies, given that most reported they use the data to identify hotspots or areas for concern, it may be implied that accurate location information is important. The difference may be in the systems or expertise they have available to correct any inaccuracies in the data. “[Our] system’s got road numbers and different classifications of roads so we can actually make the data set a wee bit better…” (Local Authority)
Some of the checks done on the data reported by Local Authorities included superimposing data on a GIS network, checking against other data sources (own records of road type and number), and checking grid references. Improvements to the location data collection process Some suggestions were made for improvements to the collection of location data. A number of participants believed that technology was the solution to this problem. For example, one Local Authority participant believed that making this process more automated would “take out human error”. Another participant recommended that GPS data were collected at the scene of the accident. This would remove the opportunity to make mistakes in logging the location. The participant added that with the electronic format, “You can’t skip any information and can’t get it wrong” (Police) Other suggestions related to more detailed training of those who collect the data and improving understanding of the importance of this data for other users. Suggestions were provided by both Police and Local Authorities. “They [Police] don’t understand the importance of data they are collecting…” (Local Authority)
“Emphasise to Police what the data is used for…” (Local Authority)
“They [new officers] don’t quite understand what the form is trying to achieve in the end… and for me that’s something that as a force now, or as a company, that we should address…” (Police)
Road accident data collection – form design research project
22
One participant also suggested that better training of people collecting data may result in more accurate data collection, particularly in terms of knowledge of details such as compass points and direction of travel Other missing or incorrect data Although the key issue seems to relate to the accuracy of the location of the RTC, several other areas prone to errors were also discussed by participants; particularly Local Authority representatives. Issues were quite varied, and in many instances were not viewed as being particularly problematic.
Accurate and complete information about the age of casualty or driver was considered important by statisticians. Participants commented that details on ages are important in identifying child casualties and accurately monitoring trends as this is part of Transport Scotland’s Road Safety Framework to 2020 (Transport Scotland, 2009).
Other issues mentioned included: the number of casualties, Local Authority reference number, and descriptions of vehicles. Statisticians interviewed also mentioned issues with dates, severity of accidents, and missing records (such as casualty and vehicle).
On the other hand, when consulting those who complete the STATS19 form, issues with data collection or particular variables were not generally raised. When asked specifically to comment on variables that may be difficult to record accurately, officers tended to report that the process was “fairly straight forward”. One of the few issues mentioned related to recording specifics on makes or types of vehicles (for example, motorcycle engines). Officers may not have pre-existing knowledge in this area and must wait until they return to the station to carry out some research.
It is important to note that none of the problems reported in this section were believed to be particularly prevalent or challenging to the organisations’ operations.
Contributory factors generally not viewed as difficult to code In general, interviewees did not find that the contributory factors (CFs) on the existing STATS19 forms were particularly problematic. Representatives from both the Police and Local Authorities found the collection and interpretation of these to be generally straight forward, however a few specific issues were raised.
For example, one participant from Police Scotland reported that there are “No hard and fast rules” for assigning contributory factors. They also mentioned that some officers only apply one CF. However, it is worth noting that STATS20 does include guidelines for assigning the contributory factors.

Road accident data collection – form design research project
23
Another Officer shared similar views and reported that CFs are not robust and he believed that perhaps a way forward would be to remove these options and simply have officers write down what they believe the CF to be. Another participant believed that recording certain CFs, such as speeding, may be tricky, particularly if there were no witnesses. A further officer mentioned ‘careless driving’ as a CF that is difficult to record accurately under certain situations.
A participant mentioned that a positive aspect of the current form was the option on the form to assign a ‘confidence’ level to the CFs. This was viewed as an improvement to the accuracy of the information (such as speeding).
A participant from a Local Authority was concerned that the wording for ‘pedestrian failed to look’ and ‘driver failed to look’ was the same in the form and that this could lead to inaccuracies in the data collection process .
One Police Officer mentioned that the term ‘participant’ may cause confusion because it may not be clear which person (involved in the RTC) they are referring to.
A lack of confidence in the data by some Local Authorities was perceived. This may be because of their perception of the data quality for variables such as accident locations. As mentioned previously the findings showed that, in general, monthly RTC reports sent to the Local Authorities interviewed may have one or more errors, according to participants.
In terms of the contributory factors specifically, more than one Local Authority participant explained that they do not use this data because they do not trust the accuracy of it. One participant mentioned that this was because he did not believe it was the attending officers who completed the STATS19 form, and hence assumed that the person who had completed it may not have the knowledge or experience necessary to make an accurate allocation of CF.
"I don't know the experience of the person inputting the data” (Local Authority)
However, as described above, most of the participants representing legacy Police forces reported data was inputted onto the illustrative STATS19 form (or an equivalent form) by the attending officer.
The concerns raised by participants from Local Authorities may arise from a misunderstanding of the data collection process. Perhaps a better mutual understanding of how the data is collected and inputted, why this process is important and the importance of accurate information is required. An open discussion between all users of the data may facilitate each stakeholder group’s understanding of the importance of the data collection process.

Road accident data collection – form design research project
24
Improvements for CFs
Of all those interviewed, only one participant (from a Local Authority) mentioned a suggested variable they would like to see collected; this related to recording whether or not a child passenger was restrained. The participant believed that this variable could help inform campaigns aimed at parents, particularly providing an evidence-base for such campaigns. Although we are aware that this does not fit in with the aims of the contributory factor data collected on the STATS19 form, and that there is an option to complete restraint status for any vehicle occupant casualty, the participant believed that this could be an added benefit to having the data.
In terms of other changes relating to CFs, a number of improvements were mentioned, though these mostly related to general ease of use of the form and accurate data collection.
For example, one Local Authority participant commented that a sound qualitative account of what happened (i.e. a plain word description of the collision) was as important as the quantitative data collection “a good accident story and a good location…”. He believed the story (narrative) regarding the circumstances of the accident came directly from the attending officer.
However, other participants viewed the data collected as necessary; one interviewee from Police Scotland acknowledged that the data collection process is a "necessary evil", but felt that the amount of information required is too detailed. No suggestions were provided as to what variables could be edited or deleted.
"If I could take away form filling from the Police Officers, I would" (Police) Minor themes Aims of the form There was a divide between the perceived aims of completing the STATS19 form. For Police, participants seemed to understand form completion as part of their job. When asked regarding their motivations for completing the form, participants tended to relate it back to the requirements of their roles.
"Because I have to - that's the bottom line, it’s procedure" (Police) Some knowledge on how data is used by Local Authorities was also expressed by Police who generally understood that it is used for road safety, for example “identifying hot spots” was cited by most interviewees.
Conversely, Local Authorities reported some very clear aims for the data collected; to have data that will help them in achieving the organisation’s goals in road safety, particularly in identifying hotspots or any casualty trends that they need to be aware

Road accident data collection – form design research project
25
of. Other uses included a range of activities from road safety engineering, producing reports, and carrying out investigations.
Suggestions for improvement As mentioned previously, generally, the form was not believed to be particularly problematic. Form users believed that experience is key in understanding what data is required and how to fill in the form. Hence, the main improvements brought up during interviews related to the convenience and effort required from Police to fill in the necessary data.
Form modifications Participants from the Police expressed a desire for any revised form to be as user-friendly as possible. While many fill in a word version of the form which requires they simply “work through it”, others described fully electronic systems that make the process easier (e.g. no issues with handwriting, can carry out necessary checks on site). For example, one legacy Police force area reported using a PDA to collect data on site, which can then be uploaded directly onto a word document. This was believed to be a step forward in ensuring collection of more accurate data.
There was a desire expressed by one participant from Police Scotland that the form was made so that “you can’t put wrong information anywhere”.
The addition of drop-down menus was particularly favoured by some of the interviewees who believed that they would help in situations where officers are unsure of how to complete a question or where there was too much room for interpretation. Two officers commented:
“Drop-downs would be useful” (Police) “A drop-down system may alleviate some of these problems” (Police) In fact, one participant interviewed represented a Police division that had recently (2013) changed to a new electronic form which mostly employs drop-down menus. This was viewed as a significant improvement from the previous (manual, paper) form.
The order of the categories presented was also viewed as a potential area for improvement. One participant suggested that the most frequently recorded categories should be nearer the top of the list.
Finally, although not an additional variable, there was a strong feeling by one of the interviewees that when assigning a road class and road type, there should be an option provided for "Motorway". Although the option for motorway already exists on the current STATS19 data (i.e. motorways are classified as dual carriageways in road type, and then further specified in the road name), according to the participant

Road accident data collection – form design research project
26
this is a source of confusion which in turn may lead to inaccuracies in the data collected.
Similarly, another participant commented that there wasn't an option for ambulances or camper-vans in the vehicle type. This was also seen as a welcome addition.
Although some changes to the form were suggested, one participant considered the implications of redesigning a form and believed that this would have significant cost implications for their organisation given some in-house limitations.
“Our computer system is not maintained in house… we have to go to an external consultant so it’s quite pricey to get things changed.” (Local Authority)
Procedural modifications There was a desire across all stakeholder groups for some sort of consistent form/system to be used across the whole country. Some of the recommendations for improvement included having a central database where data was collected and available for viewing by all users. This could be of potential benefit, particularly as one participant reported differences between databases3. “The Police database doesn’t necessarily match the national database.” – (Local Authority)
A further recommendation by a Local Authority representative was for any revised form to re-introduce a sketch or diagram of the accident. The participant reported they used to receive this information but no longer do. This information was deemed to be “of great value”, particularly given the lack of confidence in the recording of location.
The use of technology was also viewed as something that could improve data collection. One participant was part of a two-year pilot where officers are provided with PDAs to input the data at the scene for the RTC. The participant reported a large improvement from the previous system, as this allows officers access to sources such as the Police National Computer (PNC) directly on site. It was also viewed as a positive step toward increasing accuracy as they suggested that this prevented Officers from skipping or entering incorrect information.
Interestingly, consultation with Transport Scotland statisticians revealed that although both former Strathclyde and Northern divisions have updated to what is considered a more “user friendly” PDA form format, they are not among the divisions
3 This could be a result of the way in which data shared. Police Scotland send STATS19 data to Local Authorities and Transport Scotland. Transport Scotland quality check the data and send error reports back to the Police. Police Scotland do not necessarily amend their database, nor do they necessarily amend the data sent to Local Authorities.

Road accident data collection – form design research project
27
with the fewest errors encountered. However, it is not clear if this is related to the relatively short time these systems have been in place, to the methods used to identify errors in the data collection or to some other factors.
Knowledge and use of STATS20 Views were mixed regarding the familiarity with and ease of use of the STATS20 guidance. Most participants reported having some knowledge of it (at least most of them had heard of it), and its uses seemed to relate to conducting checks (e.g. definitions) or referring to particular data when unsure (e.g. vehicle subdivisions).
Some Local Authority participants found it very useful, and could quantify their use of it, such as “once a week”. Some Police Officers interviewed also had positive views on it.
“Just about every officer refers to it when completing the form.” (Police) “It’s written in such a way that I can understand” (Police) However, other users from Police Scotland found it to be a “long read” and believed it could be improved by making it more condensed.
Only two participants reported not knowing of STATS20; one was a Police representative and the other represented a Local Authority.
There did not seem to be a significant difference in use of STATS20 between Local Authorities and Police.
Summary Generally the types of form used, the processes followed and user perceptions were varied. It became clear throughout the interviews that no consistent approach is used, despite widespread agreement that such consistency is desirable.
Some of the issues associated with identifying location data accurately may relate to a lack of information available to Police Officers of compass points or direction of travel at the scene. This may be further hindered if any information relevant to the accident location has to be researched when officers get back to their station, particularly as Police may have to be on site for several hours at a time in some cases.
A further issue concerning how data is input relates to whether the attending officer or someone on their behalf completed the form. While Local Authorities believed that this was a concern, interviews with Police Officers suggested that on most occasions it is the attending officer who completes the form, although typically not at the scene of a collision.

Road accident data collection – form design research project
28
Although no major areas of improvement to the data collection procedure were identified, a number of minor issues were brought up. These mostly related to user friendliness and adding information or options that can make data more accurate – for example, adding in options for types of vehicles that may be difficult to record accurately (ambulances or camper vans), further expanding the option list of road types (i.e. adding an option for “motorway”), and even providing forms with drop-down menu options that remove some of the subjectivity of the data collection process. A further suggested improvement relating to how data was collected was to investigate more sophisticated technology options as a potential avenue to help improve the accuracy of the data collection process. This was particularly viewed as useful for recording location data.
This said, overall, the form was considered to be “straight forward” and the data collected was viewed as valuable. None of the participants identified specific redundant or less useful variables, even when they suggested shortening the form to make it more user-friendly.
Finally, although this was not a widely held opinion among participants interviewed, one participant believed that changes to the form would have significant cost implications for his organisation (cost of implementation was not raised by others). This is something that should also be balanced out when considering overall improvements to the STATS19 data collection process.

Road accident data collection – form design research project
29
5 Draft form design Methodology In order to develop a revised form, we used insights gathered from the literature review and consultations. We also took the opportunity to engage with our expert advisors to provide input into an internal project team workshop.
The session was structured such that the insights gathered in the literature review and consultation tasks were presented to our expert advisors. The advisors, Jeremy Broughton, Richard Cuerden and Caroline Wallbank4 contributed to this in terms of providing their own expert opinions as well as challenging and raising questions to further enhance the development of the form.
General use of the form The interviews carried out in the consultation revealed that none of the Police Officers interviewed complete a 'STATS19 form' at the scene of a collision; instead, notes are made in notebooks, telephoned in or recorded on a PDA. The interviewees suggested that this process was normal practice for the collection and inputting of STATS19 data. Those that used notes completed a form on a computer (often a template that was typed in) at the Police station and sent it on or completed an online recording system.
Therefore it was not deemed appropriate to design a paper-based form, since the findings from the interviews suggested it is unlikely that this would be used. It was proposed that a simple electronic version of a form could be designed that could minimise errors and that an officer could complete for each collision based on notes made at the scene.
The draft form was designed in Microsoft Excel, making use of the validation drop down menus, which were highlighted in the literature review as improving the accuracy of the data entered. Users can only select items on each option list, and an error is displayed if a different response is entered. Drop down lists were chosen despite the finding from the literature review that they can be frustrating for users who are entering familiar information. The decision to use the drop downs was made based on feedback from the consultation, i.e. that interview respondents felt that dropdown menus would address the problems with the accuracy of the existing data returns. Further information about the data field or definitions from STATS20 was entered so that it is displayed when a cell is selected.
4 Richard and Jeremy have many years of experience in accident investigation, STATS19 analysis and designing
data collection forms, specifically for accident data collection and Caroline has recently been involved in
redesigning a roadside HGV check form for the Irish Road Safety Authority.

Road accident data collection – form design research project
30
Cells other than those where data are required have been greyed out and locked so that they are not selectable, and moving between cells using the TAB, ENTER or arrow keys scrolls through only those selectable cells. This means that data cannot be entered in other cells. Within each Excel file one sheet was created for each of collision circumstances, contributory factors, vehicles (up to 3) and casualties (up to 4). Provision for higher numbers of vehicles or casualties was considered after the vignette study.
The use of an electronic form enables some logic checks to be carried out at the data entry stage, which should reduce the number of forms that are returned to be checked at a later stage, for example, to check that only pedestrians have the pedestrian location, movement and direction data completed.
One respondent of the consultation suggested putting the most frequently used values at the top of the list for each field. This was considered as part of the workshop, and compared with the order as listed in STATS20 or alphabetical order. Our experts thought that putting the most common options first would not be suitable since the other options may be overlooked. For example, for vehicle manoeuvre ‘going ahead other’ is the most frequent value (Transport Scotland, 2014, Table 14), listed as the last option in STATS20, but our experts felt that all other options should be considered before this option is used.
Details of revised form design Accident circumstances Figure 4 shows the draft revised accident circumstances form produced following the workshop.

Road accident data collection – form design research project
31
Figure 4: Draft accident circumstances form
The changes to the accident circumstances form were:
Road type field. Users reported confusion for motorways and that for some cases multiple options appeared to apply
o adding 'or motorway main carriageway' to dual carriageway
o reordering to put single carriageway and dual carriageway at the end of the list to help suggest that the 'special cases - roundabout, slip-road, one-way street' should be used if they are present rather than single or dual carriageway
2nd Road Class. It was reported that this is not always completed for collisions involving a vehicle using a private drive or entrance
o add 'or private drive' to unclassified

Road accident data collection – form design research project
32
Weather
o It was suggested changing the order so that the conditions with and without high winds were adjacent.
The following fields are calculated automatically:
The accident severity is automatically calculated based on the casualty from the accident with the highest severity level.
The number of vehicles and number of casualties are filled in automatically from the vehicle and casualty data.
The day of week is calculated automatically from the date entered.
The following data validation and logic checks were incorporated:
The recording of the Ordnance Survey Grid References appeared problematic. Data validation were applied with the following criteria:
o Eastings between 0 and 500,000
o Northings between 500,000 and 1,300,000
For junction accidents the following checks are carried out:
o If junction detail is not equal to ‘not at a junction’ then red text is shown to indicate to complete the junction control, 2nd road class fields
o If 2nd road class is M, A(M), A or B then red text is shown to complete the 2nd road number field
o If junction is not completed and any of junction control, 2nd road class and 2nd road number are, then red text shows to fill in junction detail.
Vehicle details Figure 5 shows the draft revised vehicle details part of the STATS19 form.

Road accident data collection – form design research project
33
Figure 5: Draft vehicle details form
The changes to the vehicle details form were:
Vehicle type. Some STATS19 users reported confusion over 'other' vehicle types, for example, ambulance and motor caravan. A review of data suggests that 'vans' are often coded as 'other' also. Some interviewees suggested entering the motorcycle type was not always easy.
o The text box that displays when a user click on the vehicle type field shows some of the text from STATS20 (Department for Transport, 2011) giving definitions of vehicles, including examples of vehicles included under van, HGV and other vehicles.
The following checks were included within the form:
Pedal cycles and motorcycles not allowed to be left hand drive vehicles
Pedal cycles and motorcycles not allowed to have overturned
Vehicle manoeuvre, compass points and junction location of vehicle were also reported as confusing or inconsistent, but no form design changes were identified which could address these.

Road accident data collection – form design research project
34
Casualty details
Figure 6 shows the draft revised casualty details part of the STATS19 form.
Figure 6: Draft casualty details form The draft form includes a box shown when casualty severity is selected to indicate the injuries that are classed as serious (from STATS20). This should help users to identify seriously injured, with lesser injuries classed as slight.
The following data validation or logic checks were also included:
If casualty class is pedestrian then red text alerts user to complete pedestrian location, movement and direction.
If the casualty is a driver then the spreadsheet checks the age entered against the driver age of the vehicle corresponding to that driver. Red text alerts if these are different.
Contributory factors Users reported confusion over the term 'participant'. This refers to a vehicle/driver, casualty or uninjured pedestrian.
There was also confusion between similar descriptions of factors relevant for vehicles/drivers and pedestrians which have different codes:
Failed to look properly (405 for drivers, 802 for pedestrians)

Road accident data collection – form design research project
35
Failed to judge other person’s/vehicle path or speed (406 for drivers, code 803)
Impaired by alcohol (501 for drivers, 806 for pedestrians)
Impaired by drugs (502 for drivers, 807 for pedestrians)
Careless, reckless or in a hurry (code 602 for drivers, 808 for pedestrians)
The form was designed for users to select the type of participant (vehicle, casualty or uninjured pedestrian) first, and the relevant reference number.
The next field is the factor type, and is designed to only show those types relevant for the participant selected:
For vehicle/driver, all factor groups apart from ‘pedestrian only’ are shown
For injured and uninjured pedestrians, only the ‘pedestrian only’ and ‘special codes’ are shown
Once the factor type has been selected, the drop down list of options only shows the factors in the group selected. This should ensure that any vehicle specific code is assigned to a vehicle and that the correct code is used when the descriptions are similar.
Figure 7 shows the draft contributory factors part of the STATS19 form showing the factors reduced to those in the ‘injudicious action’ group.
Figure 7: Draft contributory factors form

Road accident data collection – form design research project
36
Summary The revised form was developed using insights from the literature review and the consultation as well as expert opinion provided during the expert advisor workshop. The first decision about the redesign of the form was to ensure that it was in a usable format for the Police and other users. Based on the information about current approaches to collection of accident data received as part of the consultation, a paper-based form was not considered to be the most ideal means of data collection, therefore the revised form was developed using Microsoft Excel.
The revised Excel form was designed to reduce or eliminate some of the accuracy issues highlighted in earlier tasks, while also incorporating any relevant best practice guidelines identified in the literature to enhance its layout and design.
The revised form included tabs or worksheets in Excel for each of accident circumstances, vehicle details, casualty details and contributory factors, using drop down lists wherever possible to minimise errors. Some logic checking between fields was introduced and modifications to the text for some field names and labels were also included.

Road accident data collection – form design research project
37
6 Vignette study Methodology The aim of the vignette study was for stakeholders to provide feedback on the revised form, both in terms of ease of use of the form and the accuracy of data recorded, based on using the form for a set of fictional collisions.
Vignettes were developed for four collisions. The ten Police participants from the consultation were sent the vignettes, together with the revised form and a brief description of the vignettes study.
In order to compare the reliability of the revised form with existing methods, each participant was asked to complete STATS19 data for half the cases using their existing method, if possible, and half using the revised form. For each participant we stated which of the four cases should be completed using which method, aiming to achieve five responses for each case using the revised form, and five using their existing methods.
Police divisions which input directly onto a database/online system were not able to use their current method as there was no way of telling the system that the collision is a dummy collision and not a real collision to be included in the final STATS19 data set. These officers were only asked to complete the revised forms.
The STATS19 data completed using the current processes and the revised form were compared for each of the vignettes to assess the reliability of the data using the different processes.
Any feedback that the participants supplied relating to the revised form was also reviewed.
Content The vignettes consisted of fictional collision reports containing a text description of a collision and included a map, or photo. Any photos used were from a set made available from the On-The-Spot (OTS) project, a project for the Department for Transport which involved TRL expert investigators attending the scene of collisions. These photos have been sanitised so that personal data and the true locations of accidents cannot be determined from the photos.
The vignettes were designed to include those collision types that were reported to cause confusion or result in inconsistencies from the literature review and consultation:
All of the cases required coding of the location of the accident based on a map and description of the location.

Road accident data collection – form design research project
38
Vehicles involved included a van and a motorcycle.
The severities of participants in the collision were described in terms of their injury so that the reporting officer needed to determine the casualty severity.
The date of births or ages of the participants were provided so that the driver/rider/casualty age could be completed.
Some data that a Police Officer would normally have access to, such as the Vehicle Registration Number or the home postcode of the driver or casualty were not included.
The vignettes included:
Case A: Collision at a roundabout to assess the recording of junction type, junction locations, vehicle manoeuvres and compass points
Case B: Pedestrian impaired by alcohol crossing road masked to assess the consistency between the pedestrian movement and CF and the impaired by alcohol CF for driver/rider and pedestrian
Case C: Collision at private drive to assess coding of 2nd road class
Case D: Collision on a motorway to assess coding of road type
The vignettes were reviewed and tested using the revised form before being sent to the participants. The full vignettes are provided in Appendix C.
Results A total of eleven revised forms and nine existing forms were completed by seven officers based on the provided vignettes. The result of having a smaller sample than expected is due to complications that arose throughout the data collection process that included not being able to use existing systems for ‘dummy’ cases, Police resourcing issues as well as challenges concerning compatibility of the form using existing versions of Microsoft Excel. The breakdown of the number of cases reported using each form can be found in Table 2.
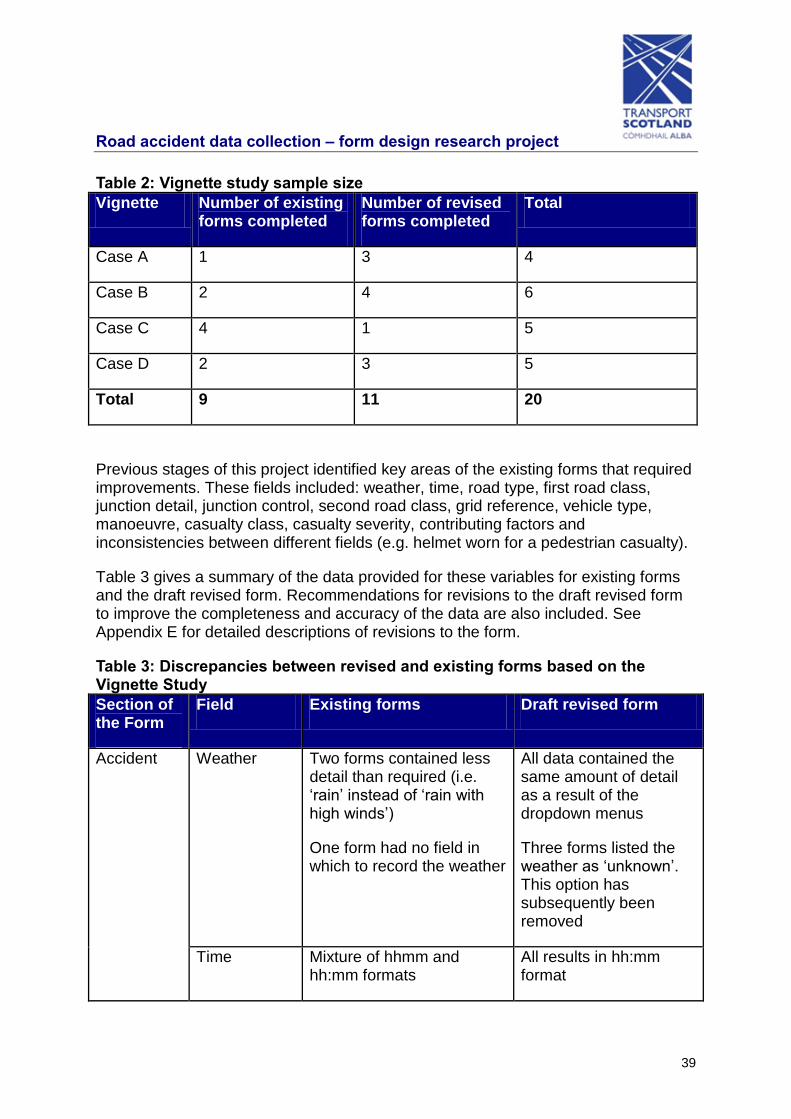
Road accident data collection – form design research project
39
Table 2: Vignette study sample size
Vignette Number of existing forms completed
Number of revised forms completed
Total
Case A 1 3 4
Case B 2 4 6
Case C 4 1 5
Case D 2 3 5
Total 9 11 20
Previous stages of this project identified key areas of the existing forms that required improvements. These fields included: weather, time, road type, first road class, junction detail, junction control, second road class, grid reference, vehicle type, manoeuvre, casualty class, casualty severity, contributing factors and inconsistencies between different fields (e.g. helmet worn for a pedestrian casualty).
Table 3 gives a summary of the data provided for these variables for existing forms and the draft revised form. Recommendations for revisions to the draft revised form to improve the completeness and accuracy of the data are also included. See Appendix E for detailed descriptions of revisions to the form.
Table 3: Discrepancies between revised and existing forms based on the Vignette Study
Section of the Form
Field Existing forms Draft revised form
Accident Weather Two forms contained less detail than required (i.e. ‘rain’ instead of ‘rain with high winds’)
One form had no field in which to record the weather
All data contained the same amount of detail as a result of the dropdown menus
Three forms listed the weather as ‘unknown’. This option has subsequently been removed
Time Mixture of hhmm and hh:mm formats
All results in hh:mm format

Road accident data collection – form design research project
40
Section of the Form
Field Existing forms Draft revised form
Road type One form had no field in which to record the road type
All information entered accurately
1st Road class
Inconsistencies with how unclassified roads are listed (‘U’ and ‘Unclassified’)
Inconsistencies with how M, A and B roads are listed (‘B’ and ‘B9119’)
All information entered accurately and consistently
Junction detail
Three forms had no field in which to record junction detail
Result is not being able to determine if subsequent blank junction control and 2nd road class fields were because the accident did not take place at a junction or if the officer forgot to fill them in
Four forms left junction detail blank. A reminder has subsequently been added to remind the officer that this is a required field
Junction detail has subsequently moved from ‘junction accidents only’ section to main section of form
Junction control
No inconsistent data (i.e. no information entered if junction detail was listed as ‘Not at or within…’)
No inconsistent data (i.e. no information entered if junction detail was listed as ‘Not at or within…’)
2nd Road class
Inconsistencies with how M, A and B roads are listed (‘B’ and ‘B7078’)
All information entered accurately
Grid reference
No inconsistencies with the ranges listed
Three forms were left blank.
No inconsistencies with the ranges listed
Three forms were left blank. A reminder has subsequently been added to remind the officer that this is a

Road accident data collection – form design research project
41
Section of the Form
Field Existing forms Draft revised form
required field
Vehicle Vehicle type One form only prompted the officer to record the make of the vehicle
Two forms included only general vehicle information (‘Lorry’ and ‘Motorcycle’)
All information entered accurately
Vehicle manoeuvre
Three forms had no field in which to record the vehicle manoeuvre
All information entered accurately
Vehicle reference (Casualty Form)
Inconsistencies with how data is entered (e.g. ‘1’, ‘vehicle 1’ and ‘Astra’)
One pedestrian casualty not linked to a vehicle. A reminder was subsequently added
Casualty Casualty class
All information entered accurately
All information entered accurately
Casualty Severity
All information entered accurately
All information entered accurately
Conflicting information
One form listed an individual as a driver and then as a passenger on the ‘CasForm’
One form provided conflicting driver sex data on the ‘VehForm’ and ‘CasForm’
One form listed ‘Seatbelt in use: unknown’ for a pedestrian casualty
One form listed ‘Seatbelt in use: unknown’ for a pedestrian casualty. Warning was subsequently added to prevent this
No other conflicting information
Contributing Factors
Conflicting information
One form provided conflicting information (vehicle reference for a casualty CF)
All information entered accurately

Road accident data collection – form design research project
42
It is important to note that further testing is required to validate these results before the form is adopted or rolled out widely. However, despite the small number of responses, the data that were provided using the revised form were both more accurate/detailed and more consistent as compared with the data provided using the existing forms. Errors that were present in the revised forms have been accounted for using warnings and validation procedures as described on page 43.
Feedback from use of revised form As mentioned on page 37, feedback from the participants relating to the revised form was also reviewed. Of the seven participants who returned the completed forms, six provided general feedback regarding their experience.
Several of the Police Officers believed that the new form was easy to use and an improvement on the current form used by their legacy Police area:
“I certainly found the new forms easier to complete” (Police)
“The form seems to be fairly user-friendly and certainly an improvement on what we currently use” (Police)
“The new form is light years better than the old paper form which is much more cumbersome” (Police)
One Police Officer believed some aspects of the form were a backward step, particularly the element of inputting the grid reference points on the form.
“This will lead to mistakes being made and vehicles ending up in a totally wrong location due to operator error” (Police)
However, this may be due to the participant having access to a more sophisticated system for collecting this type of data in their current STATS19 system; from the consultation exercise described on page 15, it was clear that not all regions have access to this type of system. The participant described the current method used by his legacy Police area which he believed to help reduce the likelihood of errors. Evaluation of such systems to establish whether they actually improve the accuracy of location data would determine whether there would be value in Police Scotland rolling out this sort of system more widely.
“We have a system here where you use a Google earth type of map, you click on the exact locus, the computer calculates the grid reference and then a compass comes up on the screen where you show the direction of travel.” (Police)
Although the form was generally well received, a number of suggestions were made for further improvement. This included the addition of free-text boxes for elements

Road accident data collection – form design research project
43
such as details of injuries sustained (other than severity), damage caused to road-side furniture (such as fencing or barriers), or a brief summary of the collision.
Some respondents also identified that there were no spaces available to enter the full details (including name, address and post code) or drivers, witnesses or casualties.
A number of participants also commented regarding the lack of a space available to collect insurance details.
However, some of these additional details, although need to be recorded, are not part of the STATS19 data requirements. While the capture of additional details beyond the STATS19 data variables were out of the scope for this project, future revisions of the form could include space for such information (acknowledging that any additional data capture requirements would increase the time taken to record this and would increase complexity of the dataset collected).
As mentioned previously, some participants did not provide any detailed feedback regarding their experience with the form; however, the redesigned form seemed to be well received among many of the respondents. The next section highlights how the feedback obtained through this (and other parts of this study) were collated to further enhance the revised form.
Summary and revisions to form Four vignettes were developed, refined and tested with Police Officers who had participated in the consultation. Each vignette described a fictional collision report – providing the Police offices with a text description and a map or photo. They were designed to include collision types known to cause confusion or result in inconsistencies. Although the sample size achieved was small, qualitative feedback from users indicated that the revised form was well-received, and in addition, the vignette data collated from the draft revised form yielded more accurate and more consistent results than the forms that they were used to completing.
The feedback and analysis from the vignette study, along with further information from the literature review and the project team was collated and is summarised in Appendix E, together with the response for each comment. In many cases further enhancements were incorporated into the revised form, but in some cases the suggestions were not implemented, with reasons given in the table.
Key amendments included:
further guidance included for breath test, vehicle movement and driver/casualty ages

Road accident data collection – form design research project
44
vehicle type refined to two levels so that users select from a shorter list, with a further drop down menu giving further details for motorcycles, goods vehicles and other vehicles
further validation to remind users to complete key data and to check casualty sex, car passenger, bus/coach passenger, seat belt and cycle helmet based on the casualty class
compatibility checks for earlier versions of Excel

Road accident data collection – form design research project
45
7 Summary and recommendations Summary The aim of this project was to review the currently used versions of the STATS19 form and produce a new form that incorporates recommendations for improvement that could be potentially rolled out nationally to help improve the quality of the personal injury road accident data collected in Scotland. This project has designed a revised STATS19 form based on:
An evidence review of literature relating to the design of STATS19 and other forms, including those for non-specialists
A consultation with Police and other users of STATS19
An expert workshop to determine the form design
A vignette study to compare the completeness and accuracy of data using existing forms and the revised form and to collate feedback
Following the results of the vignette study, further enhancements were made to the form to improve the completeness and accuracy of the data.
Literature review The STATS19 data collection system was created in 1979, and since then, the design, content and appearance of the illustrative form have changed many times as part of quinquennial reviews. The key limitations and inconsistencies of STATS19 have been identified in previous research which suggested that improvements could be made to the form design, as well as standardisation and training on how STATS19 data should be collected and recorded.
Literature about form design for non-specialists suggests that any form should be tailored around the user and form purpose. Some designs are quicker for users to complete whereas others tend to lead to a better quality of data. Most studies found that participants preferred tick lists or free text boxes to drop down lists and other more interactive input modes but agreed that drop down lists lead to fewer data entry errors. The literature also agreed that participants find forms where the label is above or to the left of the answer box with right alignment the most comfortable as well as the quickest to use.
Consultation
Telephone interviews were undertaken with eighteen stakeholders from Police Scotland, Local Authorities, and Transport Scotland. All eight of the legacy Scottish Police force areas, believed to be using different STATS19 recording systems were

Road accident data collection – form design research project
46
represented in the consultation (seven legacy forces were represented by Police contacts, while the eighth was covered at Local Authority level).
Generally the types of form used, the processes followed and user perceptions varied. It became clear throughout the interviews that no consistent approach is used, despite widespread agreement that consistency is desirable. One legacy force uses a PDA to report data; the other respondents write notes in their notebook and complete a STATS19 form later at the Police station.
Local Authority representatives described one of the challenges that they face is related to errors about location data provided by Police Officers via the STATS19 forms. This data was viewed as critical for them to reach their road safety goals, particularly in terms of identifying problematic contributory factors or high frequency accident areas.
The consultation revealed that while Police Officers did not identify any specific areas of improvement, they did raise a number of small, usability issues. These mostly related to user friendliness and adding information or options to facilitate more accurate data input. None of the participants identified specific redundant or less useful variables, even when they suggested shortening the form to make it more user-friendly.
Form design and vignettes A revised STATS19 form was developed using insights from the literature review and the consultation as well as expert opinion. The form was designed to ensure that it was in a usable format for the Police or other users. Based on the information about the way in which accident data was collected from the consultation, a paper-based form was not felt to be the most appropriate format, therefore the revised form was developed using Microsoft Excel.
The revised Excel form was designed to reduce or eliminate some of the accuracy issues highlighted in earlier tasks, while also incorporating any relevant best practice guidelines identified in the literature to enhance its layout and design.
Four vignettes (fictional accident case studies) were developed, refined and tested with Police Officers who had participated in the consultation. They were designed to include collision types known to cause confusion or result in inconsistencies. Qualitative feedback from users indicated that the revised form was well-received, and in addition, yielded more accurate and more consistent results than the forms that they were used to completing.
Some of the feedback on the draft revised form, as well as information obtained from the literature review, and the results of the analysis of the data received were used to make further amendments to the form. The output from this project has been the successful development of a suggested revised example of a STATS19 form,

Road accident data collection – form design research project
47
developed based on evidence from users of the form, which may lead to improved data quality.
Developing the form in Microsoft Excel was considered to be an improvement in terms of the accuracy and ease of completing, and respected Transport Scotland’s requirement for a solution that did not need large scale IT resources, hardware and training. Table 4 below presents a hierarchy of forms ranging from the lowest technology to the greatest, with the advantages and disadvantages given of each. Paper forms and forms in Microsoft Word or Excel are advantageous due to users being familiar with these types of forms, but do not continually update a central STATS19 database. Web-based forms or a database, based at a central location or available via PDAs have the advantage that data input would directly feed into a central database, but this would require considerable IT infrastructure resources.
Table 4: Types of data input form
Form type Advantages Disadvantages
Paper form Require no IT infrastructure No error checking
Handwriting errors
Does not automatically complete database
Electronic form in Word
IT systems likely to have Word. Users likely to be familiar with use
Can be sent electronically
Requires typing so mistakes may be made
Does not automatically complete database
Unable to perform logic and consistency checks
Electronic form in Excel
IT systems likely to have Excel. Users likely to be familiar with use
Allows use of drop down menus
Logic and consistency checks can be included
Can be sent electronically
Does not automatically complete database

Road accident data collection – form design research project
48
Form type Advantages Disadvantages
Electronic form in Access or web based
Automatically completes database
More sophisticated logic and consistency checks can be included
Additional IT resources required
May require training
Forms completed at scene of collision on PDA
Automatically completes database
More sophisticated logic and consistency checks can be included
Complete data at scene
Automatically detect grid location of collision
Additional IT resources required
May require training
Recommendations In this section, recommendations (using the insights and information established as part of this study) are made. They are related to several key areas including further development of the type of STATS19 form used and the process for data collection, training opportunities and potential additional data that could be captured.
Type of form and process
Following the vignettes study, one Police area offered to test draft form version 2. This sort of pilot study could be carried out before a Scotland-wide distribution of the form.
Completing the STATS19 form is only part of the wider STATS19 process. The data from the form is reviewed, checked if necessary and compiled into the STATS19 database. The process used to extract data from the forms into the database varies by Police area, and the impact on this process needs to be evaluated based on the revisions to the form.
One of the Legacy Police Force areas already uses a web-based STATS19 form and another area uses PDAs to capture notes about the collision. Consideration should be given to what format the STATS19 form should take in the future to ensure that these divisions are not using a less sophisticated format than is available to them.

Road accident data collection – form design research project
49
Any further developments should also consider existing software to collect collision data, for example, CRASH (Collision, Recording And Sharing software), MaapCloud (TRL’s collision software), or the system already in use in the Ayrshire Police area. These systems would require additional IT resources and training which would need to be considered.
Training
The consultation showed that the current practice is for new Police Officers to be trained in recording road collision data at the scene of a collision with an experienced Police officer. Further training on why accurate completion of the form is important and how the data are used by other stakeholders may improve the completeness and accuracy of the form. In addition, although there is engagement between those collecting the data (i.e. Police Scotland), and those subsequently making use of the data (i.e. Local Authorities and Transport Scotland statisticians), this could be enhanced to ensure that all parties are bought into the process. This could take the form of stakeholder workshops where knowledge can be shared between all appropriate parties.
Our consultation showed that experience is key to completing the STATS19 data and most Police Officers write details of the collisions in their notebooks for transcription onto a form at the Police station. It was suggested that an aide-memoire could be produced which gave a summary of the information an officer needs to record at a collision. This would be useful for less experienced officers and when any new data are required.
Consultations with Police Officers showed that the recording of contributory factors did not appear to be a problem, and that reporting officers understood the system and completed these to the best of their knowledge (although there were a few suggestions for improvements). However, there is a lack of clarity amongst stakeholders about how these factors are assigned and they are often not considered to be reliable by users of the data. This mismatch between the data collectors and users of the data could be improved by training or engagement between both parties so that an understanding of the data collection process and the use of the data by others is understood by all.
The consultation exercise revealed that the guidelines for completing the STATS19 form (STATS20) are not accessible and therefore not used. In the revised form, selected elements of the guidelines have been added as part of the validation; however, it may be possible to provide a link to the relevant pages at various points in the Excel form, or to make the STATS20 more accessible in other ways. Any changes to STATS20 would need to be considered by SCRAS.

Road accident data collection – form design research project
50
Data included
There could be other variables that it would be useful to collect data on which are not routinely collected as part of STATS19 that could be added to the form in the future for use within Scotland or across Great Britain. For example, the collection of driver experience and exposure data (i.e. length of time drivers have held a driving licence, approximate annual mileage and any previous motoring convictions) or the breath alcohol level. Any changes that would affect data for Great Britain would need to be considered by SCRAS.
Other items (not currently part of STATS19) were suggested for inclusion on the form as part of the feedback from the vignettes study. For example, insurance details and addresses of participants and description of collision. These could be added onto a revised form so that all of the information relating to a collision is stored in one location.
The research undertaken as part of this project has led to the development of a revised STATS19 form which was informed by those who use it most with a view to making it more user-friendly while also improving the quality of personal injury road accident data collected in Scotland. We believe that should Transport Scotland wish to take forward the above recommendations (in conjunction with ongoing engagement with key stakeholders), it will result in Police Scotland having a more robust, accurate and consistent approach to collection of personal injury road accident data across Scotland.

Road accident data collection – form design research project
51
Bibliography Bargas-Avila, J., Brenzikofer, O., Roth, S., Tuch, A., Orsini, S., & Opwis, K. (2010) Simple but crucial user interfaces in the world wide web: introducing 20 guidelines for usable web form design. User Interfaces (INTECH ’10), R. Matrai, Ed., 1–10.
Bargas-Avila, J., Brenzikofer, O., Tuch, A., Roth, O., & Opwis, K. (2011). Working towards usable forms on the World Wide Web: optimizing date entry input fields. Advances in Human Computer Interaction 2011, 1-8.
Christian, L., Dillman, D., & Smyth, J. (2007). Helping respondents get it right the first time: the influence of words, symbols, and graphics in web surveys. Public Opinion Quarterly, 71(1), 113-125.
Das, S., McEwan, T., & Douglas, D. (2008). Using eye-tracking to evaluate label alignment in online forms. Proceedings of the 5th Nordic Conference on Human-Computer Interaction: Building Bridges, 451-454.
Department for Transport. (2011). Instructions for the completion of road accident reports from non-CRASH Sources. Retrieved March 2015, from https://www.gov.uk/government/uploads/system/uploads/attachment_data/file/230596/stats20-2011.pdf
Department for Transport/Standing Committee on Road Accident Statistics. (2006). NSQR Series Report No. 45: Review of Road Accident Statistics. Retrieved November 12, 2014, from Office for National Statistics: http://www.ons.gov.uk/ons/guide-method/method-quality/quality/nsqr/theme/travtrans/nsqr-series-report-no-45---review-of-road-accident-statistics.pdf
Fraser, A. (2009). Central Scotland Police Area: STATS19 Accidents Coded 2, 4 or 6 at 3.11 Pedestrian Movement and / or 801 at contributory factors during 2005 & 2006.
Garrett, J. (2002). The Elements of User Experience, New Riders, Indianapolis, Ind, USA.
Heerwegh, D. & Loosveldt, G. (2002). An evaluation of the effect of response formats on data quality in web surveys. Social Science Computer Review 20(4), 471.
Hogg, A., & Masztal, J. J. (2001). Drop-down, radio buttons, or fill-in-the-blank? Effects of attributing rating scale type on web survey responses. Proceedings of the ESOMAR Congress Marketing Transformation (ESOMAR ’01), Rome, Italy.
Lupton, K., Jarrett, D.F. and Wright, C.C. (1997), “The Consistency of Road Accident Variables in Great Britain: 1995”, Technical Report No: 1997/6, Transport Management Research Centre, Middlesex University.

Road accident data collection – form design research project
52
Lupton, K. (2001). Road accident investigation using an object-oriented database. Proceedings of the Institution of Civil Engineers Transport 147, 33-39.
Nielsen, J. (2000). Drop –down boxes: use sparingly. Retrieved 19 February, 2015, from http://www.nngroup.com/articles/drop-down-menus-use-sparingly/
Neuendorf, K.A. (2002). The Content Analysis Guidebook. Sage.
Penzo, M. (2006). Label placement in forms. Retrieved 19 February, 2015, from http://www.uxmatters.com/mt/archives/2006/07/label-placement-in-forms.php.
The Scottish Government. (2003). Project: Review of the Contributory Factors System. Retrieved January 30, 2015, from Department for Transport: http://www.dft.gov.uk/rmd/project.asp?intProjectID=10867
Transport Scotland (2009) Scotland’s Road Safety Framework to 2020 http://www.gov.scot/Resource/Doc/274552/0082161.pdfTransport Scotland. (2013).
Transport Scotland (2013). Appendix B: The collection of road accident statistics, and examples of forms that could be used to collect the data. Retrieved November 12, 2014, from Transport Scotland: http://www.transportscotland.gov.uk/statistics/j340611-61.htm
Transport Scotland (2014) Reported Road Casualties Scotland 2013 Available at http://www.transportscotland.gov.uk/statistics/j340611-00.htm
Wright, P. C. (1999). The development of improved methods for representing road accident data. Middlesex University.

Road accident data collection – form design research project
53
Appendices
Issues known to Transport Scotland Appendix A
Table A-1: Data inaccuracies reported to Transport Scotland
Part of form Issues Example Proposed solution
Contributory factors
CF believed to be a matter of fact, and hence should not be classed as a CF
Code 901 – Stolen vehicle
Add to vehicle variables
CF is potentially misleading or similar to other factors
Code 303 - Disobeyed double white line
Re-label using neutral terminology
CF not very useful Code 308 - Following too closely
None specified.
CF with ‘strangely low usage’
Code 401 - Junction overshoot
Important to note in every relevant case.
Casualty record Recording casualties appropriately
Casualty Class – narrow range unnecessarily complicates analysis
Expand list, at least to: "driver, rider, passenger, pedestrian".
Pedestrian location and movement
Pedestrian Direction – frequently miscoded
Abandon compass points, use bearings.
Recording of vehicle passengers
Car Passenger - Not always recognised as referring only to car
Record Passenger Location, regardless of vehicle.

Road accident data collection – form design research project
54
Part of form Issues Example Proposed solution
Vehicle record Consistency with other data included in the form
First Point of Impact - Not always consistent with hit and run variable
Another check.
Confusion/ lack of knowledge leads to inaccuracies in recording of data
Vehicle Movement Compass Point - Suggestion that direction of travel is not always recorded correctly.
Better guidance or training
Accident record Accurate recording of location
Grid co-ordinates not always correct
Training of officers? GPS?
Accurate recording of road details (e.g. type, class, junction)
e.g. Difference between "lane" and "carriageway" is not understood; Recording of private drives; Sometimes minor road is recorded as first road
Form redesign, training.

Road accident data collection – form design research project
55
20 Guidelines for Useable Web Form Design Appendix B
Taken from Bargas-Avila, Brenzikofer, Roth, Tuch, Orsini, & Opwis, 2010, page. 9
1) Let people provide answers in a format that they are familiar with from common situations and keep questions in an intuitive sequence.
2) If the answer is unambiguous, allow answers in any format.
3) Keep the form as short and simple as possible and do not ask for unnecessary input.
4) If possible and reasonable, separate required from optional fields and use color and asterisk to mark required fields.
5) To enable people to fill in a form as fast as possible, place the labels above the corresponding input fields.
6) Do not separate a form into more than one column and only ask one question per row.
7) Match the size of the input fields to the expected length of the answer.
8) Use checkboxes, radio buttons or drop-down menus to restrict the number of options and for entries that can easily be mistyped. Also use them if it is not clear to users in advance what kind of answer is expected from them.
9) Use checkboxes instead of list boxes for multiple selection items.
10) For up to four options, use radio buttons; when more than four options are required, use a drop-down menu to save screen real estate.
11) Order options in an intuitive sequence (e.g., weekdays in the sequence Monday, Tuesday, etc.). If no meaningful sequence is possible, order them alphabetically.
12) For date entries use a drop-down menu when it is crucial to avoid format errors. Use only one input field and place the format requirements with symbols (MM, YYYY) left or inside the text box to achieve faster completion time.
13) If answers are required in a specific format, state this in advance communicating the imposed rule (format specification) without an additional example.
14) Error messages should be polite and explain to the user in familiar language that a mistake has occurred. Eventually the error message should apologize for the mistake and it should clearly describe what the mistake is and how it can be corrected.

Road accident data collection – form design research project
56
15) After an error occurred, never clear the already complete fields.
16) Always show error messages after the form has been filled and sent. Show them all together embedded in the form.
17) Error messages must be noticeable at a glance, using color, icons and text to highlight the problem area and must be written in a familiar language, explaining what the error is and how it can be corrected.
18) Disable the submit button as soon as it has been clicked to avoid multiple submissions.
19) After the form has been sent, show a confirmation site, which expresses thanks for the submission and states what will happen next. Send a similar confirmation by e-mail.
20) Do not provide reset buttons, as they can be clicked by accident. If used anyway, make them visually distinctive from submit buttons and place them left-aligned with the cancel button on the right of the submit button.

Road accident data collection – form design research project
57
Vignettes Appendix C
C.1 Introduction
TRL are working with Transport Scotland to produce a revised STATS19 form that all Police in Scotland could use to collect STATS19 data. The revised form aims to make the data collection consistent and more accurate across Scotland.
We have designed an electronic form in Excel that provides drop-down menus for options and some checks of the data entered.
The following cases are fictional road collisions that have been created to test the redesigned STATS19 form. Please complete STATS19 data for the cases below as directed in your email:
two cases using your current method, if possible
two cases using the revised form that has been developed in Excel,
Some information is not available for these fictional cases, such as the vehicle registration number and home postcodes. Please fill in what you can from the information given.
Photos are based on those from collisions from the On-The-Spot project. TRL undertook this project for the Department for Transport, which involved attending the scene of collisions and carrying out in-depth collision investigation.
Please let us know if you have any comments about the project or the redesigned form.

Road accident data collection – form design research project
58
C.2 Case A
Call on radio to attend accident at Longman roundabout, Inverness on 14/1/2015, 5:23pm
© OpenStreetMap contributors http://www.openstreetmap.org/copyright
Accident occurred at Longman roundabout, junction of A82 and A9, speed limit 50mph.
Vehicle 1, a Ford Transit (similar to shown below), driven by a male aged 34, wearing seatbelt, travelling in the dry in good conditions on A82, aiming to deliver a package to a company in Stadium Road.
Vehicle 2: a Vauxhall Astra driven by a female (DoB 5/7/72), travelling from A82 to A9 towards Perth to visit a friend.
Both vehicles were on roundabout (street lit) in left hand lane, vehicle 1 behind vehicle 2. Traffic signal on roundabout changed to red, veh 2 driver claimed to stop at red light. Damage to front of veh 1, rear of veh 2.
Driver of vehicle 1 complained of whiplash.
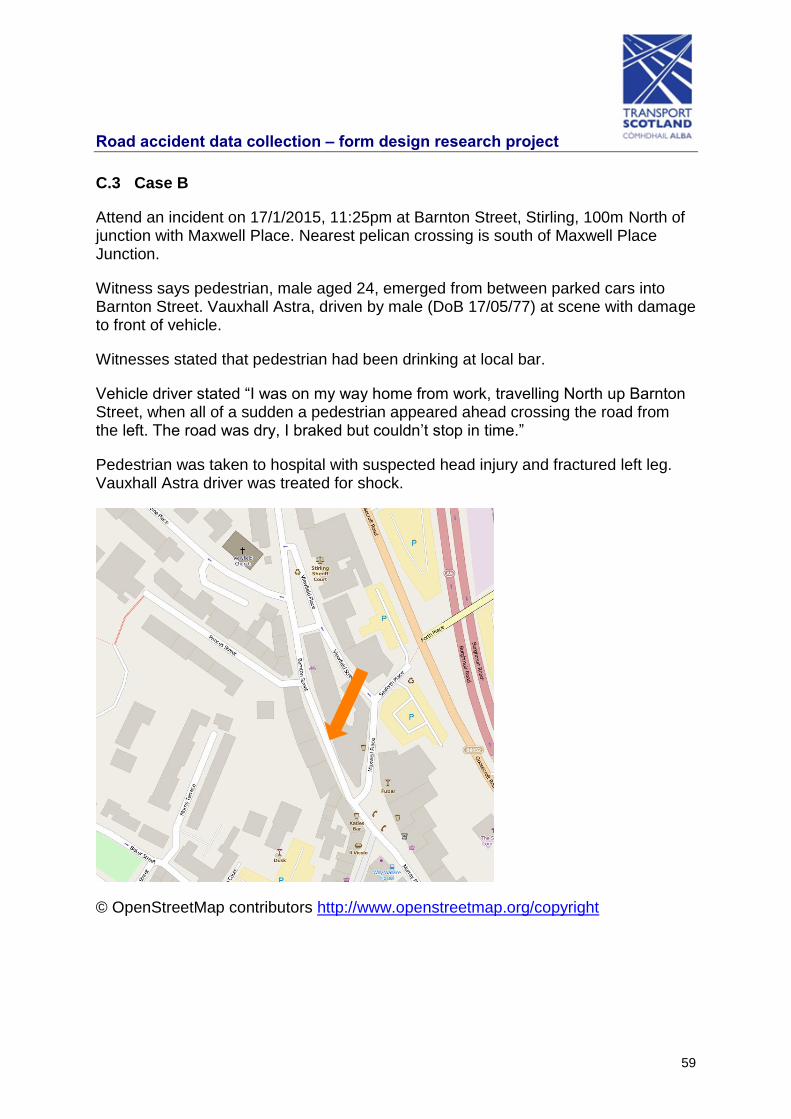
Road accident data collection – form design research project
59
C.3 Case B
Attend an incident on 17/1/2015, 11:25pm at Barnton Street, Stirling, 100m North of junction with Maxwell Place. Nearest pelican crossing is south of Maxwell Place Junction.
Witness says pedestrian, male aged 24, emerged from between parked cars into Barnton Street. Vauxhall Astra, driven by male (DoB 17/05/77) at scene with damage to front of vehicle.
Witnesses stated that pedestrian had been drinking at local bar.
Vehicle driver stated “I was on my way home from work, travelling North up Barnton Street, when all of a sudden a pedestrian appeared ahead crossing the road from the left. The road was dry, I braked but couldn’t stop in time.”
Pedestrian was taken to hospital with suspected head injury and fractured left leg. Vauxhall Astra driver was treated for shock.
© OpenStreetMap contributors http://www.openstreetmap.org/copyright
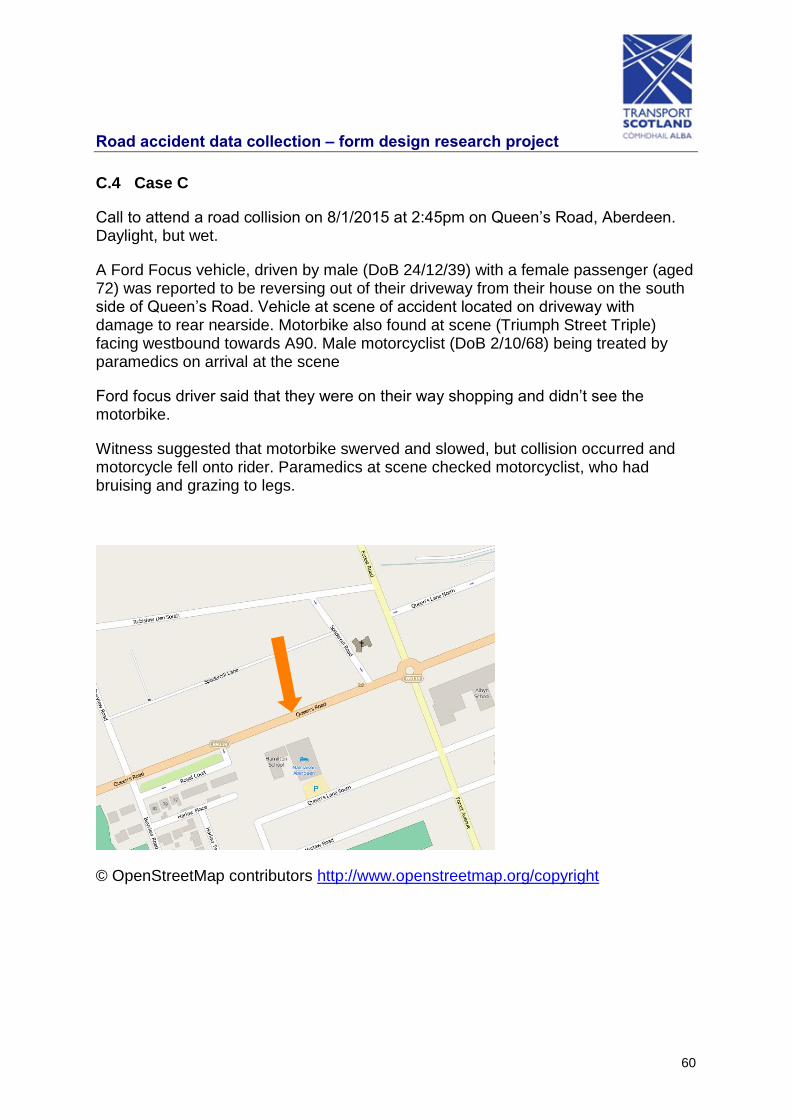
Road accident data collection – form design research project
60
C.4 Case C
Call to attend a road collision on 8/1/2015 at 2:45pm on Queen’s Road, Aberdeen. Daylight, but wet.
A Ford Focus vehicle, driven by male (DoB 24/12/39) with a female passenger (aged 72) was reported to be reversing out of their driveway from their house on the south side of Queen’s Road. Vehicle at scene of accident located on driveway with damage to rear nearside. Motorbike also found at scene (Triumph Street Triple) facing westbound towards A90. Male motorcyclist (DoB 2/10/68) being treated by paramedics on arrival at the scene
Ford focus driver said that they were on their way shopping and didn’t see the motorbike.
Witness suggested that motorbike swerved and slowed, but collision occurred and motorcycle fell onto rider. Paramedics at scene checked motorcyclist, who had bruising and grazing to legs.
© OpenStreetMap contributors http://www.openstreetmap.org/copyright

Road accident data collection – form design research project
61
C.5 Case D
Accident attended on 6/1/2015 12:30pm
Blue Peugeot 206 on northbound carriageway of M74 between junctions 10 and 9 near Kirkmuirhall.
Police arrived to find vehicle on its roof on the verge.
Driver (Female, DoB 10/12/1974) was trapped in vehicle, fire and rescue service attended. Driver had multiple injuries including suspected fractured leg and ribs.
Undamaged HGV and driver and Ford Focus car and driver stopped on hard shoulder. Ford Focus driver was travelling behind the Peugeot in the middle lane as the HGV in lane 1 signalled and pulled into lane 2. Peugeot braked sharply, skidded, lost control, rolled and ended up on the verge.
© OpenStreetMap contributors http://www.openstreetmap.org/copyright

Road accident data collection – form design research project
62
Example STATS19 forms Appendix D
D.1 Tayside

Road accident data collection – form design research project
63

Road accident data collection – form design research project
64

Road accident data collection – form design research project
65

Road accident data collection – form design research project
66
D.2 Ayrshire – U-Division (PDA) form

Road accident data collection – form design research project
67

Road accident data collection – form design research project
68

Road accident data collection – form design research project
69

Road accident data collection – form design research project
70
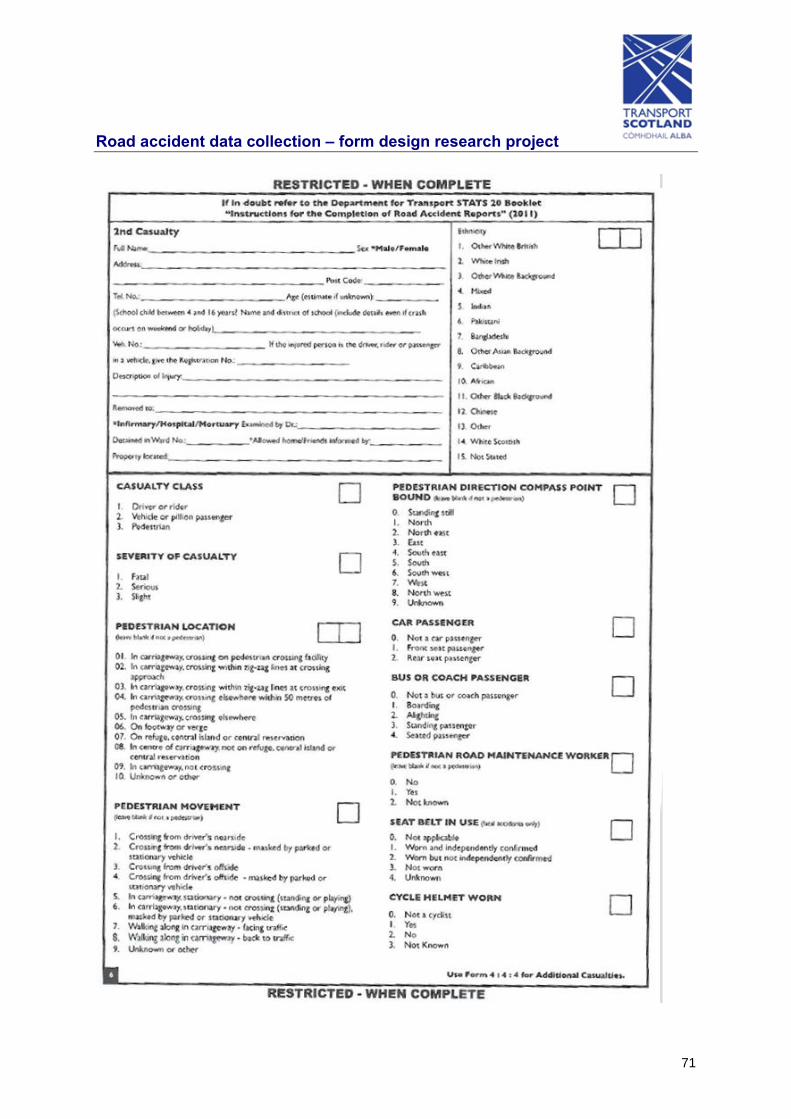
Road accident data collection – form design research project
71

Road accident data collection – form design research project
72

Road accident data collection – form design research project
73

Road accident data collection – form design research project
74
Feedback on form and suggested revisions Appendix E
Table E-1: Suggestions for revisions to form following vignette study
ID Source Requirement Response
1 Project team
Add sheets for additional vehicles and casualties and ensure formulae which reference other sheets look at all.
Additional columns added in vehicle and casualty sheets, with ‘freeze panes’ used so that labels are visible when a user scrolls right. This was simpler to implement and probably easier to complete for multiple vehicles and casualties without having to use macros which may not be acceptable to IT systems
2 Literature review
Make accident circumstances go down the page only
Done
3 Literature review
Add dd/mm/yy to date label
Done, also hh:mm added to time label
4 Literature review
Right align left labels Done
5 Literature review
Do not use bold font for labels
Done
6 Feedback 2.23 Breath test – I think it would be helpful to add the guidance info as to what ‘not applicable’ and ‘positive’ means as I think this causes confusion
Done
7 Feedback 2.8 Vehicle movement – the compass point requirement also causes confusion for some and it would be helpful to include some guidance re this
Picture and guidance added
8 Feedback 3.9 casualty severity – just a typo ‘impatient’
Done

Road accident data collection – form design research project
75
ID Source Requirement Response
rather than ‘inpatient’
9 Feedback 3.10 pedestrian location – in the drop down the 2 lines referencing zig-zags don’t include the word crossing as in the guidance notes and that confused me at first
Done – the word ‘crossing’ has been added to the form
10 Feedback Contributory factors page –typo in last line of info at top – ‘vehicle’
Done
11 Feedback We noticed that some of the validation checks are not compatible with older versions of Excel, so key benefits of the form may be lost to divisions not using the current version of Excel.
Validation rules were revised to be based on named ranges rather than cell references which should solve this problem. Compatibility check with earlier versions of Excel carried out.
12 Feedback Including some additional validation checks could be useful, to ensure that mutually exclusive options cannot be selected (e.g. car passenger and wearing a cycle helmet).
Checks added within casualty form for car passenger, bus/coach passenger and seat belt and cycle helmet worn based on casualty class.
Not referenced to type of vehicle
13 Feedback A validation could also be added for things like driver sex/driver casualty sex (e.g. if casualty class is driver then sex of casualty is equal to that for related vehicle). Perhaps it would be possible to ‘grey out’ or pre-select options based on previous responses as
Driver sex validation added

Road accident data collection – form design research project
76
ID Source Requirement Response
mentioned as a possibility in the draft interim report.
14 Feedback Some further refinement and routing of some categories could be useful (e.g. under vehicle type, selecting ‘HGV’ then a separate drop-down with the weight/class).
Vehicle type routing refined to two levels. In each case the second level headings are only shown if required and are reduced to the relevant options based on the first level.
pedal cycle
motorcycle
o motorcycle 50cc and under
o motorcycle over 50cc and up to 125cc
o motorcycle over 125cc and up to 500cc
o motorcycle over 500cc
o motorcycle – unknown cc
o electric motorcycle
taxi/Private hire car
car
minibus (8 - 16 passenger seats)
bus or coach (17 or more passenger seats)
goods vehicle:
o goods vehicle over 3.5 tonnes and under 7.5 tonnes mgw
o goods vehicle 7.5 tonnes

Road accident data collection – form design research project
77
ID Source Requirement Response
mgw and over
o goods vehicle – unknown weight
other:
o ridden horse
o agricultural vehicle (includes diggers etc.)
o tram/light rail
o van/goods vehicle 3.5 tonnes maximum gross weight (mgw) and under
o mobility scooter
o other vehicle
15 Feedback In order to help with filling in the contributory factor data, perhaps a form like the one attached (factor form) would be useful. It gives an overview of all the contributory factors and could be included as an additional sheet on the form.
Project has shown the majority of respondents like the logical flow of the revised form as it only shows the Contributory factors that are relevant based on the initial selections of participant and type of factor rather than the full list of 78 factors
16 Feedback What process is followed to add another vehicle/casualty record if there are more than 3?
See number 1
17 Feedback The accident date field does not accept dates prior to 2015, which means the system cannot accept older
Dates from 2014 can now be entered
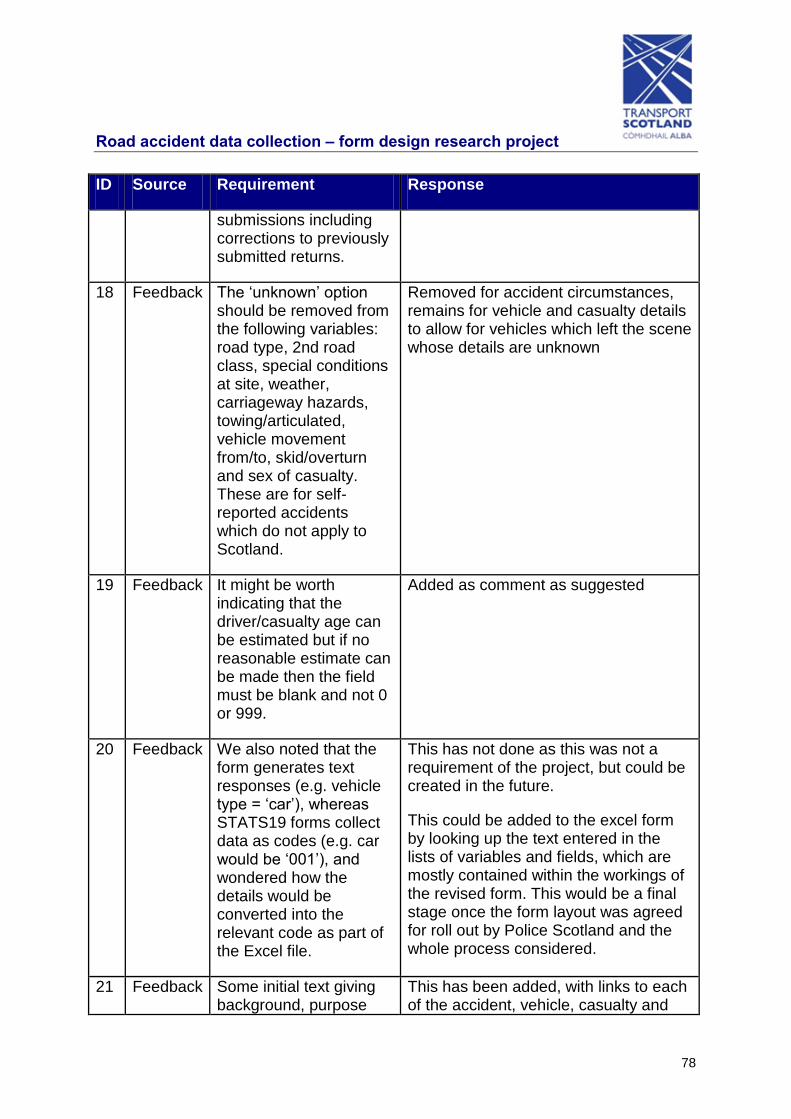
Road accident data collection – form design research project
78
ID Source Requirement Response
submissions including corrections to previously submitted returns.
18 Feedback The ‘unknown’ option should be removed from the following variables: road type, 2nd road class, special conditions at site, weather, carriageway hazards, towing/articulated, vehicle movement from/to, skid/overturn and sex of casualty. These are for self-reported accidents which do not apply to Scotland.
Removed for accident circumstances, remains for vehicle and casualty details to allow for vehicles which left the scene whose details are unknown
19 Feedback It might be worth indicating that the driver/casualty age can be estimated but if no reasonable estimate can be made then the field must be blank and not 0 or 999.
Added as comment as suggested
20 Feedback We also noted that the form generates text responses (e.g. vehicle type = ‘car’), whereas STATS19 forms collect data as codes (e.g. car would be ‘001’), and wondered how the details would be converted into the relevant code as part of the Excel file.
This has not done as this was not a requirement of the project, but could be created in the future.
This could be added to the excel form by looking up the text entered in the lists of variables and fields, which are mostly contained within the workings of the revised form. This would be a final stage once the form layout was agreed for roll out by Police Scotland and the whole process considered.
21 Feedback Some initial text giving background, purpose
This has been added, with links to each of the accident, vehicle, casualty and
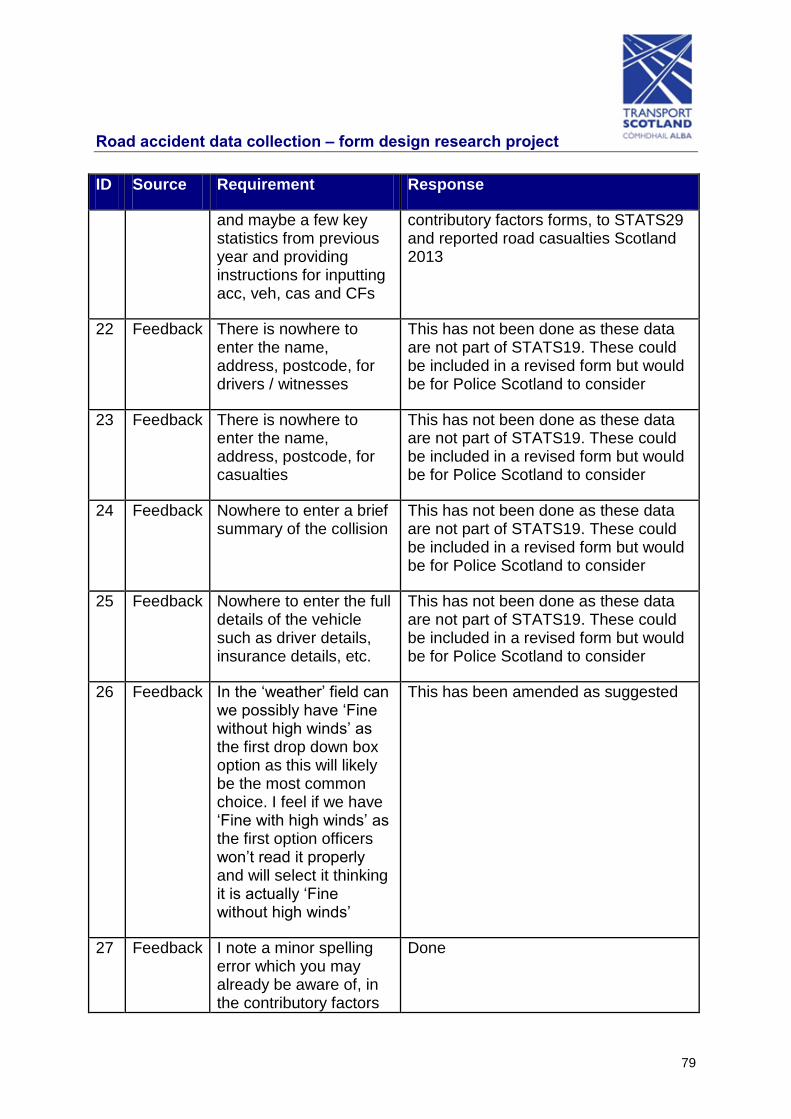
Road accident data collection – form design research project
79
ID Source Requirement Response
and maybe a few key statistics from previous year and providing instructions for inputting acc, veh, cas and CFs
contributory factors forms, to STATS29 and reported road casualties Scotland 2013
22 Feedback There is nowhere to enter the name, address, postcode, for drivers / witnesses
This has not been done as these data are not part of STATS19. These could be included in a revised form but would be for Police Scotland to consider
23 Feedback There is nowhere to enter the name, address, postcode, for casualties
This has not been done as these data are not part of STATS19. These could be included in a revised form but would be for Police Scotland to consider
24 Feedback Nowhere to enter a brief summary of the collision
This has not been done as these data are not part of STATS19. These could be included in a revised form but would be for Police Scotland to consider
25 Feedback Nowhere to enter the full details of the vehicle such as driver details, insurance details, etc.
This has not been done as these data are not part of STATS19. These could be included in a revised form but would be for Police Scotland to consider
26 Feedback In the ‘weather’ field can we possibly have ‘Fine without high winds’ as the first drop down box option as this will likely be the most common choice. I feel if we have ‘Fine with high winds’ as the first option officers won’t read it properly and will select it thinking it is actually ‘Fine without high winds’
This has been amended as suggested
27 Feedback I note a minor spelling error which you may already be aware of, in the contributory factors
Done

Road accident data collection – form design research project
80
ID Source Requirement Response
field, the phrase – ‘More than one vehicle or pedestrian may have the same factor’ has the word vehicle spelt as ‘vehiocle’.
28 Feedback Create paper based version?
This has not been done as our consultation found that Police Officers did not use a paper form. See also Table 4 giving the advantages and disadvantages of various different formats of form
29 Vignette analysis
Blank data Added validation to remind users to complete certain key data fields, including grid ref
30 Vignette analysis
Some respondents had not completed ‘junction detail’ for non-junction accidents as it was inside a box labelled ‘junction accidents only’
Junction detail field taken outside of box.
31 Project Team
Text included to indicate fields that are automatically calculated (accident severity, number of vehicles, number of casualties)
Done
32 Vignette analysis
Some respondents had used V1 rather than just 1 in vehicle reference which caused some of the logic checks to return errors
Validation used to only allow integer values.
Text also added to say e.g. 1, 2
33 Vignette analysis
Some respondents had not completed the vehicle reference for the pedestrian
Check included to ask for vehicle which hit a pedestrian

Further copies of this document are available, on request, in audio and large print formats and in community languages (Urdu; Bengali; Gaelic; Hindi; Punjabi; Cantonese; Arabic; Polish).
Transport Scotland, Buchanan House, 58 Port Dundas Road, Glasgow, G4 0HF 0141 272 7100 [email protected] www.transportscotland.gov.uk
ISBN: 978-1-909948-47-1
© Crown copyright 2015
You may re-use this information (excluding logos and images) free of charge in any format or medium, under the terms of the Open Government Licence. To view this licence, visit http://www.nationalarchives.gov.uk/doc/open-government-licence/ or e-mail: [email protected]
Where we have identified any third party copyright information you will need to obtain permission from the copyright holders concerned.
Any enquiries regarding this document / publication should be sent to us at [email protected]
This document is also available on the Transport Scotland website: www.transportscotland.gov.uk
Published by Transport Scotland, May 2015