Embed Size (px)
Citation preview
r AA091 293 EORGIA INST OF TECH ATLANTA ENGINEERING
EXPERIMENT --ETC F/ 20/5
190 ARRV HNA .RLE EE HWN OA8A4KINETIC STUDY OF THE REACTION OF CH3 02 WITH N02. VOLUME 12,(U
UN7CLASSIFIED FAA/EE-RO-3R-VOL-1 NL
rnuuunuuuuumE~h~hhh1hhE
AK
A 1t4ETIC STUDY OF THE; REACTO
A. R.' RvsakaraF. L. Ehete
tDTIC
Prepared for:
-' U.S Departrmnt of Transportation-I. Contract No. DOT-FA-78WA-4269
Report No. FAA-EE-80-38Volume I
GEORGIA INSTITUTE OF TECHNOLOGY
I SThIBUION ff ATSMMApproved for pub~elcoMq
Dlsaibufio UzImlbsi
80 10 30 004

/ '1~ (() '..5 V(2I~.LTechnical tkepart Documeintation PageRepo No. 2 Go e n ent Accesson No . 3. Re t Catalog No.
EE 8J-36, vol' A -A 0 93 . br , o r r . R
AKinetic Study of t e Reaction of Q-!3 02 with N0 8-07-onzoton Code
U 8p. Performng Organization Report No.
''IA.R./Ravishankara R. Winee ____________
Ped orrmrnqg Organi zato Nme nd Address 10. Work Unit No. (TRAIS)
Georgia Institute-of Techneloegy o oa
i800 Indepndence Ave., S. W. r4 Sponsoring A ,,ricy Code
Washington, D. C. 20591
16. Asrc
tI '
17. Key Words 18. Oistrbution Statement
This documnt is available to the publicthrough the National Technical Informa-tion Service, Springfield, Va. 22161,
19. Secwrity Clossif. (of this report) 20. S*°c¢riy Cla7sif. (of th. s pogo) 21. No. of Poeo 22. Prie °
Uncla;5fied 11hlassified
R -ms
' -.- "-"-__ ____,_._

A KINETIC STUDY OF THE REACTION OF
CH302 WITH NO2
Contract #DOT-FA78WA-4259
Report # FAA-EE-80-38
VOLUME I
Submitted to:
U.S. Department of TransportationFederal Aviation Administration800 Independence Avenue, S.W. ccessi,n For
Washington, D.C. 20591 TIS U.. :
DD-C T-- [iJuSt i L: .: , _
by
Molecular Sciences Group a. - 1and/or
. Electromagnetics Laboratory Dist spec al
Engineering Experiment StationGeorgia Institute of Technology
Atlanta, Georgia 30332
ii Contracting through;
Georgia Tech Research InstituteGeorgia Institute of Technology
Atlanta, Georgia 30332
Prepared by:
A.R. RavishankaraF.L. Eisele
IP.H. Wine

ABSTRACT
The technique of pulsed laser photolysis-long path laser aborption
is employed to study the kinetics of the reaction CH3'02 + N02 + N
CH303NO2 + N2 over the temperature range 253-353 K. At all temperatures,
kj is found to monotonically increase with increasing N2 pressure over the
range 76-722 torr, indicating that reaction occurs predominantly by addi-
tion. The dependence of k1 on N2 pressure shows that the reaction is in
the fall-off region between second and third order kinetics. These
results are compared with previous results and their atmospheric implica-
tions are discussed.
-ii
; L
.1
* _
77
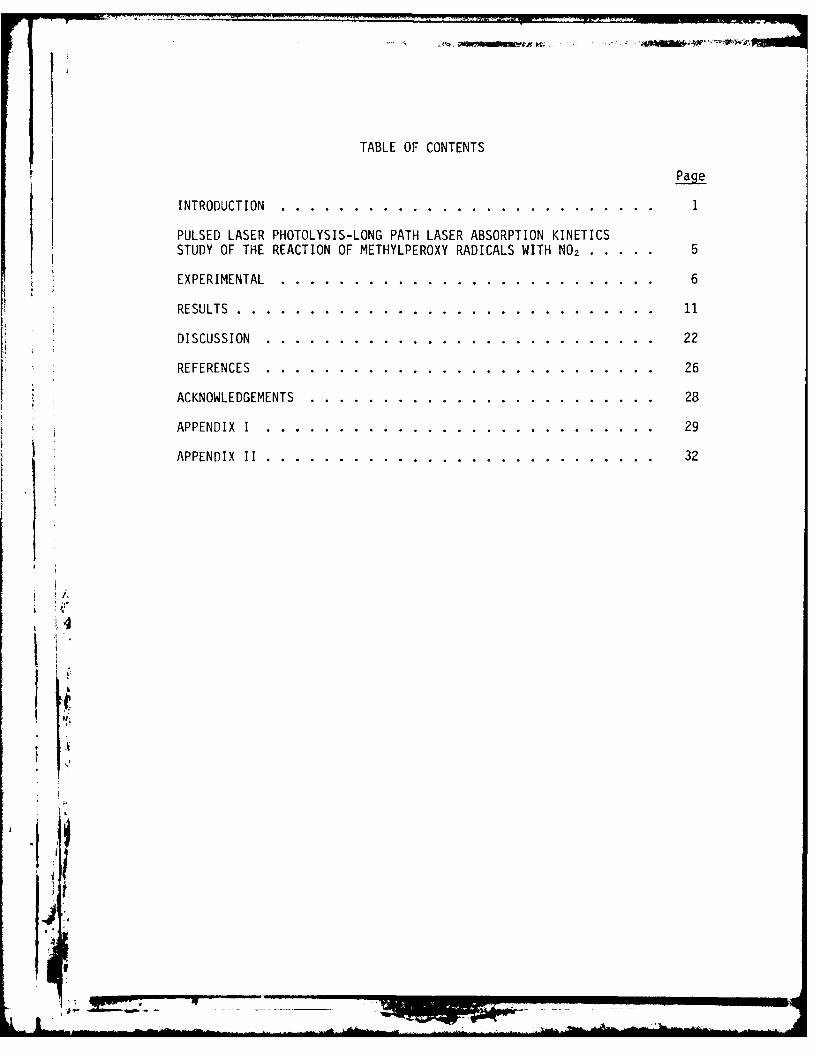
TABLE OF CONTENTS
Page
INTRODUCTION. .. ....... ........ ............
PULSED LASER PHOTOLYSIS-LONG PATH LASER ABSORPTION KINETICSSTUDY OF THE REACTION OF METHYLPEROXY RADICALS WITH NO2 . . . . . .. . 5
*EXPERIMENTAL. .. ....... ......... .......... 6
RESULTS. .. ... ........ ......... ......... 11
DISCUSSION .. ... ......... ......... ...... 22
REFERENCES .. ... ......... ......... ...... 26
ACKNOWLEDGEMENTS. .. ....... ......... ........ 28
APPENDIX I .. .... ......... ........ ...... 29
APPENDIX II. .. ... ......... ......... ..... 32

Introduction
The methylperoxy radical is an important intermediate in reaction
sequences through which hydrocarbons are oxidized in both atmospheric
and combustion processes. In combustion systems the fate of peroxy
radicals is predominantly governed by their reactions with other radicals,
while in the atmosphere, and particularly in the polluted troposphere, it
is expected that reactions with stable molecules will be important.
The major species which can react with CH90 2 in the atmosphere in-
clude H02 , NO, NO2, S02 , and 03. The rate constant for the reaction of1-3
CH302 with NO has been recently measured using direct kinetic techniques
and found to be nearly as fast as the reaction of H02 with NO.4'5 There-
fore, in a polluted atmosphere where.NOx concentrations are high, methyl
peroxy radicals are expected to react mostly with NOx species. For the\x
subject reaction of the present investigation,
CH302 + NO2 +N2----- CH302N02 \ N2 (i)
to effectively compete with the reaction of CH802 with-NO,
CH302 + NO CH3O + NO2 (2)
i the value of k, should be of similar magnitude as that of k2. If
Reaction (1) were a significant path for CH302 removal, NO production
(and the subsequent 03 generation) would be reduced.
Until recently most rate coefficients for CH302 radical reactions
were obtained by steady state competitive experiments.6- 8 In the past
few years direct measurement techniques such as discharge flow-mass
spectrometry, flash photolysis-ultraviolet absorption, and molecular
.. 1

modulation-UV absorption spectroscopy have been adopted for CH302
radical studies.
To date three direct measurements of ki have been carried out. Cox
and Tyndall 9 utilized the molecular modulation-UV absorption technique
and obtained a value of ki which was essentially independent of bath
gas pressure. The flash photolysis-UV absorption method has been employed
10 2by Adachi and Basco, and Sander and Watson to measure kj. Adachi and
Basco's results are in agreement with those of Cox and Tyndall. However,
unlike the previous two measurements, Sander and Watson found Reaction (1)
to be pressure dependent. These investigators carried out their experi-
ments under secondary reaction free conditions using a very sensitive
probe for CH302 radicals. Hence, their results appear to be more reliable.
There are no previous measurements of ki as a function of temperature.
In the present study, ki was measured as a function of N2 diluent
gas pressure and temperature using the recently developed technique of
pulsed laser photolysis-long path laser absorption. Due to the mono-
chrmoaticity of the photolysis laser, and the resultant photolysis
specificity, all unwanted photofragments were essentially eliminated, while
the high intensity of the CW 257 nm probing laser beam enabled measurement
Fi of very low concentrations of CH302. Under these secondary reaction
free conditions, our measured value of k, was found to be pressure
dependent in excellent agreement with Sander and Watson. Also, as to be
expected for an addition reaction, k, was found to increase with de-
creasing temperature.
2
..- ,. P,

The technique of pulsed laser photolysis-laser induced fluorescence
was originally proposed to be employed in the study of Reaction (1).
CH302 radicals were to be produced using either 355 nm photolysis of
C12/CH4/02 mixtures or UV photolysis of azomethane. To follow the course
of the reaction either NO2 reactant in excess CH302 or CH20 product in
excess NO2 were to be monitored using laser induced fluorescence.
There were two developments which excluded carrying out laser
induced fluorescence detection of CH20 to map out the course of
Reaction (1): a) we could not obtain the expected 10 mW of UV laser out-
+put in the intracavity Ar laser pumped tunable dye laser (in TaCt, we
succeeded in obtaining only 20 pW!), and b) in some recent studies it was
shown that Reaction (1) proceeds predominantly through an addition mechan-
ism; therefore, the CH20 product yield is very low, and an unrealistically
high detection sensitivity for CH20 would be needed. For these reasons,
we abandoned the idea of monitoring CH20.
The second approach of following the NO2 decay in excess CH30 2 was
pursued when the first approach failed. The primary requirement for this
experiment was the creation of a uniform known concentration of CH302 by
laser photolysis. We have succeeded in obtaining a spatially uniform,
'top hat' profiled laser beam using a segmented aperture optical integrator.
With this added capability, we can produce CH302 radicals in excess over NO.
Our capability to detect N02 via laser induced fluorescence (pumped by the
488 nm output of an argon ion laser) is well developed and has been used
in the study of the reaction of CH302 with NO.3 However, when we tried
.4 to monitor NO2 in excess CH302 , we found the decay of NO2 to be non-
exponential. The decay rates decreased with time due to the disproportion-
ation reaction,
3-in--
K

CH302 + CH302 -0 Product . (a)
The rate coefficient for Reaction (a) is reasonably well known. 2 A
simple calculation shows that unless Reaction (1) is very fast, i.e.,
is % 1 x 10- 1 cm3molecule-'s " , the CH302 concentration would decrease
by more than 10% by the time the N02 concentration dropped to 1/e times
its original value. Therefore, it was evident that even though
we could measure k, at low temperatures and high pressures the required
range of pressures and temperatures could not be covered.
Upon realizing that our originally proposed methods would be either
inapplicable or of limited use, we decided to develop the laser
photolysis-long path laser absorption technique. This effort was very
successful and we completed the measurement of k, as a function of
temperature and pressure, as discussed below.
j4
_.1
I
I
e'
k ~ l ....... . ...

PULSED LASER PHOTOLYSIS-LONG PATH LASER ABSORPTION KINETICS
STUDY OF THE REACTION OF METHYLPEROXY RADICALS WITH NO2
5
7i

Experimental
A schematic diagram of the apparatus used to study Reaction (1) is shown
in Figure 1. A jacketed reactor with an internal volume of ', it and a
length of 107 cm was constructed out of pyrex. The cell was maintained
at a constant temperature by circulating either methanol (253-298 K) or
ethylene glycol (298-353 K) from a temperature controlled circulator
through the outer jacket. It was found that the temperature was uniform
to within 2°C throughout the length of the cell. On both ends of the
reactor two 1/8" thick, 2" diameter quartz (Suprasil 1) plates were
attached using O-ring seals and metal clamps. The reactants were pre-
mixed in a mixing chamber and slowly flowed through the reactor. At the
outlet of the reactor, the pressure in the system was measured using an
absolute one-turn Bourdon gauge (Wallace and Tiernan Model FA160-NN)
before the gas mixture was pumped out.
Azomethane/N2 and N02/N2 mixtures were prepared in
12k bulbs on a gas handling system. The bulbs were connected to the
mixing chamber using teflon tubing and stainless steel ultra-torr fit-
j tings. The rateq of flow of the azomethane/N 2 mixture, N02/N2 mixture,
N2 , and 02 into the mixing chamber were controlled by stainless steel
needle valves and measured by calibrated mass flow transducers. The
tubes leading into the mixing chamber had radial outlets to turbulently
mix the gases. The concentration of each component in the reaction mix-
ture was determined from measurements of appropriate mass flow rates and
the total pressure. The concentration of NO2 in the N02/diluent mixture
was checked (before and after each set of experiments) by simultaneous
measurements of the total pressure (of the mixture) and NO2 absorption
6

LA Lc) *0 V
06J
-e-J
0. 0
CL 041J
4)I
LLea
4-4-
+ Cci
(Ii 0.
4))
LL./ (7%
at 366 nm. The measurements were carried out using an Hg pen-ray lamp as
the light source, a 70 cm absorption cell, and a bandpass filter-photo-
multiplier detector combination. The absorption cross section used to
determine IN0 21, 5.75 x 10- 30 cm2 , 11 has been previously measured in our
laboratory and agrees well with the literature value.1 2 The azomethane
concentration was occasionally checked by a method identical to that
for NO2 ; the absorption cross section of azomethane was measured to be
1.13 x 10- 20 cm2 at 366 nm, which is slightly higher than the published
value,13 but in agreement with other recent measurements.14
Azomethane was prepared as described in Appendix I. NO2 , obtained
from Matheson Gas Products, had a stated purity of 99.5%, and was purified
by mixing it with UHP 02 to convert all NO to NO2, and subsequently sub-
jecting it to freeze-pump-thaw cycles to remove 02. NO2 and 02 were
Matheson grade and had stated purity levels of 99.9995% and 99.99%,
respectively; these gases were used as supplied.
An ArF excimer laser, the photolysis light source, was housed in
an adjoining room, approximately 2 meters from the front window of the
reactor. We found this spatial separation to be essential if a uniform
beam was to be obtained. (Operation of the laser under slightly fluorine-
rich conditions also helped to make the beam more diffuse.) The beam was
approximately 2 cm x 7 cm by the time it reached the reactor. The laser
beam was transmitted through a custom made dielectric mirror, DM and traveled
through the reactor impinging on the MgF 2 coated aluminum mirror M4
where a fraction of the beam was reflected back into the reactor. Both* . mirrors DM and M, were mounted on precision mirror mounts with vernier
control to enable very fine adjustments. (DM was specially coated for us
by Acton Research Corp. to have "% 85% transmisstion at 193 nm and 95%
reflectivity at 257 nm.)
8
The doubled CW 257 nm UV beam was generated as described in Appendix
II. This beam was diverted into the reactor using mirror M, so as to
traverse the volume photolyzed by the ArF laser beam. By adjusting Mirrors
DM and M4, the CW UV beam was multipassed 8 times through the reactor to
obtain a path length of . 860 cm. The 8th pass was diverted away from
the reactor by a small aluminum mirror M2, passed through a methanol cell
and a 257 nni bandpass filter, and detected by a quartz envelope 1P28 (PrY'
photoriultiplier tube. (It was necessary to use a methanol filter to pre-
vent the 193 nm laser pulse from being detected by the PM tube.) The
output of the PM tube was amplified and stored in a signal averager
(Tracor-Northern 1500) operating in the analog mode and triggered 150 vsec
after the photolysis pulse. (We could not obtain a usable signal in the
first 150 isec due to interference from fluorescence induced by the 193 nm
beam.) The PM tube was operated at - 600 V to have a resistor bridge cur-
rent of ,, I mA. The anode current was always kept below I pA
by using suitable neutral density filters to reduce the intensity of the
257 nm beam. To increase the signal-to-noise ratio of the decay curves,
16 to 64 flashes were averaged. The pulse rate of the photolysis laser
(0.03 to 0.01 Hz) was such that the contents of the reactor was replaced
K between consecutive photolysis pulses. This was necessary in order to
sweep out the products (which also absorb the probing beam) and use identical
gas mixtures for each flash. In preliminary experiments it was established
that as long as the cell was swept out between flashes either the laser
repetition rate or the flow rate of the mixture through the reactor did
not affect the measured value of ki. The intensity of the transmitted 257
nm beam before photolysis was higher than that obtained when all CH302 had
reacted. This residual absorption has been observed by both Cox and
9
9 2
Tyndall, and Sander and Watson, and is attributed to the absorption by
CH30 2NO2 , the product of Reaction (1). Sander and Watson 2 have shown
that the absorption of the analyzing beam by a reaction product which is
stoichiometrically coupled to the monitored reactant species by a single
reaction (as it is in the present case) does not affect the kientic data
that is obtained. In addition, they point out that the proper Io value
that should be used in the data analysis is the intensity of the 257 nm
beam when all CH302 has reacted, and not the value obtained when CH302N0 2
is absent. It is worth noting that since the intensity of the probing
beam was high, the signal-to-noise was excellent and we could easily work
with less than 3% initial absorption and still follow the decay of CH302
down to " 4 1/e times.
I
Ii
ieq
10
4.0 1

Results
Reaction (1) was studied as a function of the pressure of the bath
gas N2 and temperature (at 298K, 76-722 torr; at 353K, 330-696 torr; at
253K, 109-510 torr). As pointed out earlier, all experiments were carried
under pseudo-first order conditions with [N0 2] > ICH3021. Figure 2 shows
typical decays of [CH 302] as a function of time; the decays are exponential
and thus confirm the presence of pseudo-first order conditions. The decay
of [CH30 2] was usually followed, for 3 1/e times. The pseudo-first order
rate constant, kj ( slope of n[CH 302] vs. t plots) was measured for
various values of IN0 2] at each temperature and N2 pressure. k! was then
plotted against IN0 2]; the slope of this line gave ki. Figure 3 shows one
such plot. It should be pointed out that the fitting procedure we employed
(a linear least squares analysis) did not force the k! vs. [N0 2] line to
a zero intercept; in our system, it is possible to have a non-zero inter-
cept since the entire volume of the reactor was not subjected to the
photolysis. The intercepts in all our experiments were small relative to
4the measured k values.
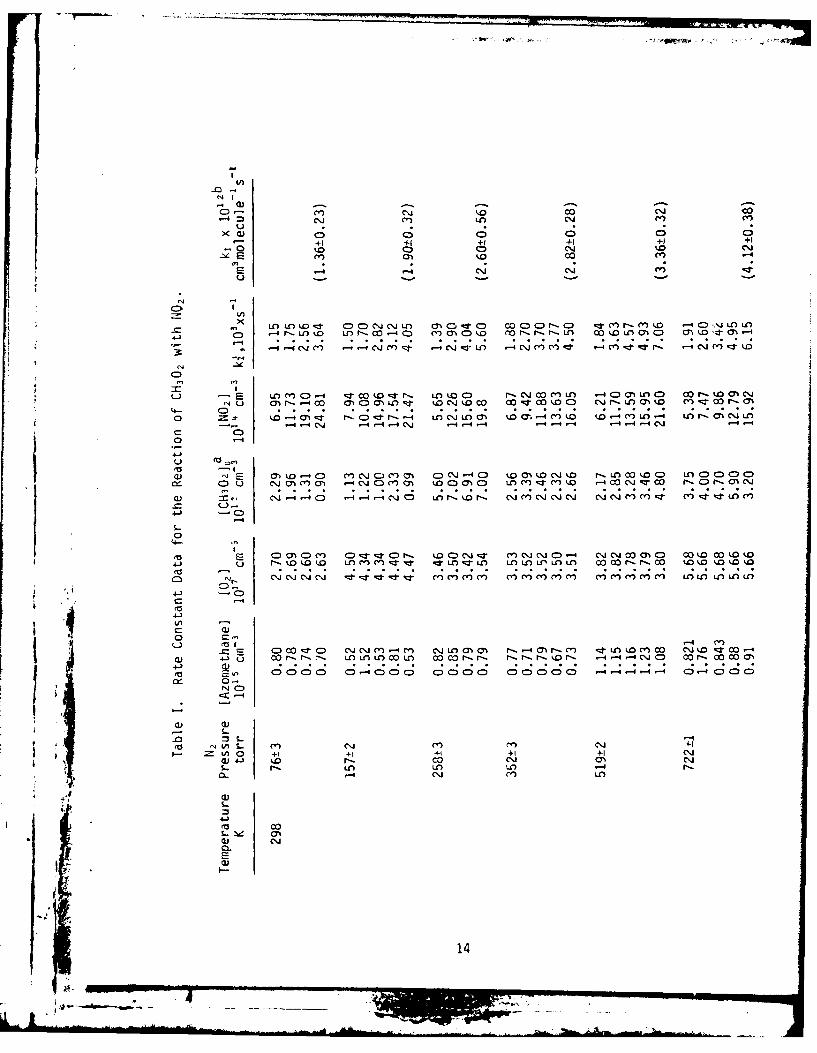
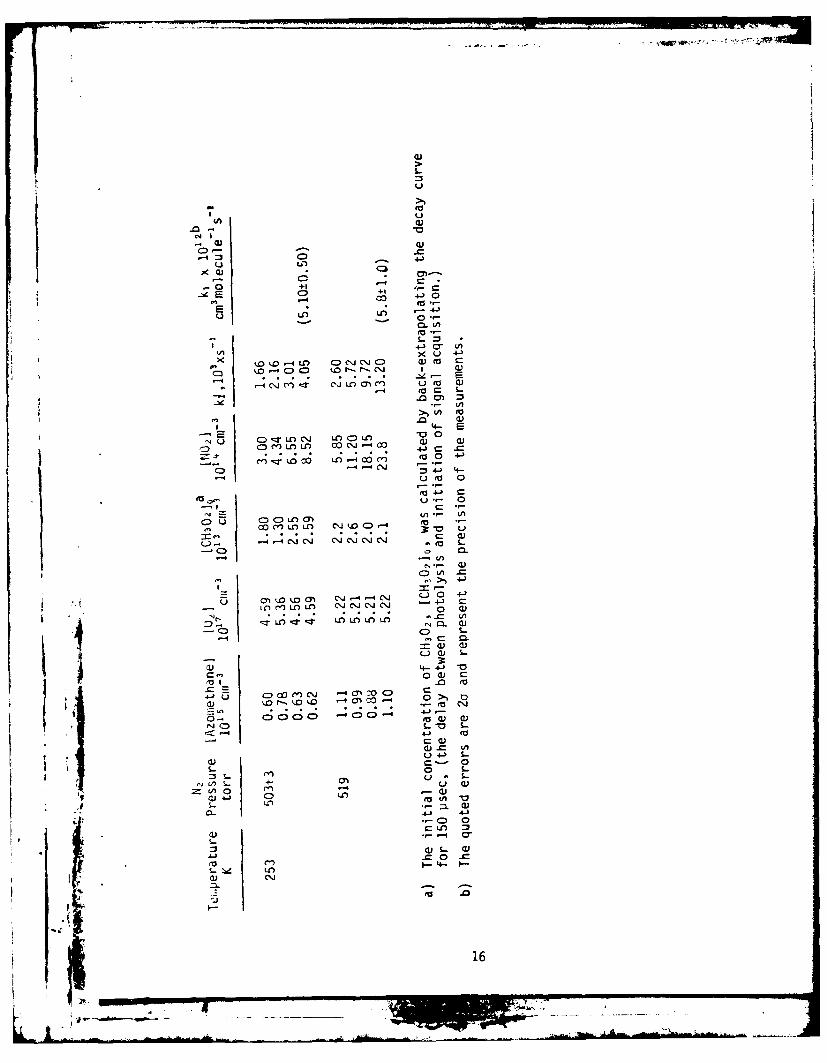
Table I lists the individual values of k1' along with all the pertinent
experimental conditions. The quoted errors for k2 , calculated from the
slope of k! vs. IN0 2] plots, are 2a and reflect the precision of the measure-
ment. The absolute accuracy of the measured values of ki, is expected to
be ' 20% which includes the error in the IN02] measurement.
Table II lists the values of ki obtained at various N2 pressures and
temperatures. Figure 4 shows a plot of kT as a function N2 number density
at three different temperatures. The solid lines drawn through these
points are visual best fits.
11
.1 ---____

+cNOj+M---* CH 0 0N0+M
519 Torr N2 , 298K
5 106.210 0.34 0.68 1.02
Time (m sec)
Figure 2. [CH 3O2 ] Temporal Profiles in the Presence of VaryingAmounts of NO2. The concentration of NO2 for eachq decay curve is shown next to the least squares linesdrawn through the experimental points.
'41
12

co
Cj
4-)
0
+< 00
0 +1I om 0)z ea0 PC) re R 4)
o~_ 0 41
z(1)
Z - LN
oC F-4-
0 0, 00
4- as
0-
4-
0 0 0 00 00c
V. 13
4 j-__
C ) m -~ %D 00 a~ cr- M\ C\LOcl
- 1 +1 +1 +1 +)+1-o '0 C0 0oC
-o m . .
0)
4- : 4 ",)ko L -0000- 0- 0 0 C)mC o r t -L ok l 000 0000 aN 1.0 14- a'0 0
4- C)4) .DrCOcJc,0.J -4-4 4- - - 44- 4C
)
U o_
M o -4C) mc Cmm = mr4c 0m ." o r OC%.C) OCDC DD
S-
o1
4-)I ~I~-~--..,-- - --- _4-__

In
LAj -4 0l C 0
0 0) 0 CD C0 0-+1 +1 +1 +1 +1 +1
-o) Orb ON LO 00
01 L
C r-.m ko C) ~-Iz jcx: c~j r mmq c\j-4 C\.ICO CO (D C c 0-4 - C*N \ 0
0 C3 - rn -4 C'.J ('n - C y.-J -c ('.4 -'4 C -0 Ok oC I 00
Es- - # -4 -- -- 4 C JC'.) C'.j ('4 CJ ' ') -('4 04 4 4 4 4CD)-
-4 0C %C ~ -L 100 0L - l Mcl ~ N- DC4 -tC
-43
000 C4 Co -40 -4--4m -4 -4-- -4 -4--40c C mC -4 .- 4 00000 - - :
4'. C4 -4('r .4 4 4
o -+ 1 +1 +1 +1
' *4) -4 0 Ln(n Ln 0i
0l.
15
1 ~ ~ -_______
Gif
4-0
U ~ 4-)
- CL
-4-X U -
-I* CA
(a 0
4-) 0 4-3
En )( 4) 4-
C:)~- C') LO(n
a~ )
4- 4-
,o a Cr~ cj u -ou -44-
LO LC LC) 0\40 c 0,
g- ~~ (n -_-O
j 0 c : O r l \ 4 C , 0-
C c) :) CD (a4-) Cj
<s 4- c
S- 0 L.
S -- \J \ UCJ\ .-E S.
0
CL 4-) 4-)
C l)
~ ~4O. O
'.4 - ~ to
a, 1 6

Table II. Rate Constants for the Reaction of CH302 with NO2as a Function of Temperature and N2 Pressure.
Temperature Pressure Number Density k, x 1012
K torr l01 9molecules cm- 3 cm molecule- s-'
298 76 0.246 1.36 ± 0.23
157 0.509 1.90 ± 0.32
258 0.836 2.60 ± 0.56
352 1.141 2.82 ± 0.28
500 1.620 3.25 ± 0.50
519 1.682 3.36 ± 0.32
722 2.339 4.12 ± 0.38
353 330 0.903 1.19 ± 0.15
354 0.966 1.35 ± 0.21
511 1.398 1.71 ± 0.10
696 1.904 1.93 ± 0.20
253 109 0.416 2.50 ± 0.34
250 0.954 3.85 ± 0.30
503 1.920 5.10 ± 0.50
519 1.981 5.8 ± 1.0
17

CH30+NO- CONO
6-& 253K
. 298K--= a 353K -
7,
4-E
-'
01
0 1.0 2.0
[ (1019 molecules cm)
Figure 4. Plots of k1 vs. Nz Number Density. The lines drawnthrough the points are visual best fits.
1 1K
18
Ib,- ~ ~ - ___

There are two possible chemical complications that can arise in
our experiments: (a) production of 03 due to reaction of O(3P) (formed
by either 02 or NO2 photolysis) with 02 and (b) production of NO and its
subsequent reaction with CH30 2. Photolysis of 02 under the most unfavor-
able conditions, i.e., high [02 ](^ 5 x 1027 cm- 3 ) and high photolysis
laser energy (% 10 md/cm 2), would produce , 1 x 10'' O('P) cm- . (The
absorption cross section for 02 at 193 nm is n 1 x 10- 21 cm2 .13)
Similary, photolysis of NO2 would lead to 't 1 x 101 3 0(3P) cm- . (The
absorption cross section for NO2 at 193 nm is \ 6 x 10-19 cm2 15.) Any
O(D) that is formed via photolysis would be quenched to O(3P) in less
16than 0.1 psec by N2. The photolytically produced 0(3P) would then react
with either 02 or NO2 ,
O(CP) + 02 + M l03 + M (4)
0('P) + NO2 k NO + 02 (5)
The fraction of O(3P) that would lead to 03 formation would, of course,
depend on the ratio of k4[021[M] to ks[N0 2 ]. Under the extreme conditions
of low temperature (where k4 is large) and low NO2 , we would produce
4 x 1032 03 cm-3. In our experiment, then, we would obtain n 3%
absorption of 257 nm radiation due to 03. However, the 03 formation does
not affect measurement of the CH30 2 decay since all 03 is formed within
100 Hsec (99% completion) after the laser flash, and, therefore simply
changes the value of Io. The concentration of O formed is too low to have
£ -any effect on the kinetics of the measured rate of CH30 2 decay. This con-
clusion was checked by increasing the photolysis energy by a factor of 4
while keeping [CH30 210 constant (by decreasing lazomethanel by a factor
19

of 4); the measured decay rates were, within experimental error,
unaffected.
The mount of NO that is produced via NO2 photolysis would be at
most 1.2% when 10 mJ/cm 2 is used for photolysis and all O(3P) that is
produced reacts with NO2 to produce NO. NO would of course, react with
CH302 to produce CH30 and NO2,
CH302 + NO- CH30 + NO2 . (2)
The rate constant for Reaction (2) is known to be x 8 x 1012 cm3
molecule-ls-'.1-3 Since the measured values of ki vary from 1.19 to
5.8 x 10⁻¹ 2 cm2iolecule- s-', the contribution of Reaction (2) could
never be greater than 8% (i.e., at high temperature and low pressures).
Again, this possibility was discarded as inconsequentialy by the observa-
tion that the measured rate constant was independent of photolysis energy.
CH3O formed in Reaction (2) would react with NO2 to give CH 3 0NO 2 -
CH30 + N02---> CH3ONO 2 (6)
i Formation of CH30N0 2 would not affect the measured rate constant since
CH3ONO 2 does not regenerate CH302, does not strongly absorb 257 nm radia-
tion, and its concentration is too low to effectively remove CH302 via
reaction. (The absorption cross section for CH3ONO 2 is ,, 4 x 10⁻²' cm 2
at 257 nm.1 )
In addition to the two photolysis related problems that were discussed
above, it is possible that our measured rate constants are incorrect if
the thermal decomposition of the CH302N02 product leads to CH30 2 production
on the same time scale as the measured CH302 decay,
20
T=-0

CH302N02 M-- CH302 + NO2 . (8)
Reaction (7) would, of course, be most severe at higher tempera-
tures. The rate constant for Reaction (7) is not known. However, it can-
not be very different from that of H02N02 decomposition leading to H02
and NO2 production, which has been measured. Using this rate constant,
the fastest rate for Reaction (7) at 353K, would be ,, 20s-'. This rate
is negligible when compared to the [CH 3021 decay rates of 699-8837 s-1
that were measured at 353K. Experimentally, if Reaction (7) was important,
we would have observed non-exponential [CH 302] decays and more importantly,
a non-linear dependence of k? on [NO 2]. We found the [CH 302] to decay
exponentially for at least 3 1/e times and k! vs [NO 2] plots were linear.
Therefore, Reaction (7) could not have been significant under our experi-
mental conditions.
S i 21

Discussion
There are three separate direct measurements of ki at 298K. Cox
and Tyndall 9 measured ki to be (1.2 ± 0.3) x 10-'2 cm'molecule-'s -1 at
500 torr of Ar + CH4, and ki = (1.6 ± 0.3) x 10-12 cm3molecule-'s -1 at
540 torr N2 , using the molecular modulation technique. This pressure
independent value of ki is in good agreement with those obtained by Adachi
and Basco10 who measured ki to be (1.53 ± 0.07) x 10- 12 cm3molecule - s-1
independent of pressure (between 53 and 580 torr Ar) using the method
of flash photolysis-kinetic spectroscopy. This pressure independent
behavior has been interpreted to mean that Reaction (1) is at its high2
pressure limit above nu 50 torr of Ar. Sander and Watson, however, found
ki to vary from (1.5 ± 0.10) x 10- 12 cm'molecule-s -1 at 50 torr N2 to. (3.94 ± 0.17) x 10"-2 cm3molecule-ls -' at 700 torr of N 2 at 298K. More-
over, the value of ki was observed to be dependent on the nature of the
bath gas, i.e., He, N2 , or SF6. This type of pressure dependent behavior
is typical of an addition reaction. Sander and Watson's data also shows
4 that Reaction (1) is in the "fall-off" regime, i.e., between second and
third order, in pressure range of 50 to 700 torr of He, N2 , and SF6. It
should also be pointed out that the lower pressure values of ki obtained
by Sander and Watson agree reasonably well with k, values of both Cox
and Tyndall, and Adachi and Basco.
As seen from Table III our measured values of k, are
in excellent agreement with those of Sander and Watson; this argues very
heavily for k, being pressure dependent. Sander and Watson have pointedI
out that the possible reason for the discrepancy between their values at
higher pressures and those of Cox and Tyndall, is the long residence time
of the gas mixtures and depletion of NO2 along the length of the cell in
22

to 0-
W-4 -j +1
to ~4-co -D w
(a m -n:
o3 0 >)1- (.. L.) S-
> a>
C) .- 4-2c x -o CJ C) C C C) .-40-) 4-J - LO 0 C') 00. C'J* -
C+ 1 4-I(A V)L/
4-))
-.0 CDLA C o l
M LA Ai LA r-. 4-)Ii. '.
I C C;CSi1
jj ___42VI- (U ___

the molecular modulation apparatus. In Adachi and Basco's experiments,
the concentrations of reactants used were extremely large. This should
have led to many secondary reaction complications. Also, their CH302
radical detection scheme was quite insensitive. Furthermore, as the
authors pointed out, they would have to make a large correction to their
t; high flash energy results due to the participation of Reaction (6), if
k6 - 8 x 10 -12 cm3molecule's "'. To date, three separate direct measure-
ments of k6 have been carried out which yield a value of ks = (8 ± 2) x
10-12 cm3molecule-Is-1.1-3 Even though Adachi and Basco carried out a
separate set of experiments using low flash energies and obtained values
of k, (supposedly in the absence of secondary reaction comiplications) in
agreement with their previous measurements, their results have to be con-
sidered suspect. They had very large concentrations of free radicals even
in their low flash energy experiments which could lead to erroneous results.
We believe that at 298K, the data obtained by Sander and Watson and in the
present investigation are devoid of secondary reaction complications and
hence should be used for atmospheric modeling studies.
There are no previous determinations of the temperature dependence of
ki. Our results are consistant with what is to be expected for an addition
reaction which goes through an energy-rich complex. The strong tempera-
ture dependence of the measured values of ki suggests that kj. is likelyto be > 1 x 10"1 cm~molecule's " at 253K. At 600 Torr, for example, the
apparent "activation energy" for Reaction (6) is n' -1.8 Kcal/mole.
For atmospheric modelling purposes it is convenient to obtain an
analytical expression which best describes the temperature and pressure
dependence of ki. Sander and Watson have fit their data for'k, at 298K
24

to the following semi-empirical equation which is based on Troe's
formulation of RRKN theory:19
T [M] {1 + [logjo(ko(T)lM]/k(T))] 2)"1k([M],T) 1 + k T [M] gF (1-)
(T T-
ko(T) = ko(298)(2)
k (T) = k(298) 298)
In Equation (1), k0(k.) are the rate constants in the low (high) pre-
ssure limits and F is a parameter which relates the energy dependencec
of the rate constant for activated complex decomposition to the shape
of the k vs [M] curve. They obtain ko(298) = (2.33 ± 0.8) x 10-30 cm6
molecule'lseCl, k = (7.0 ± 1.0) x 10" 12 cm3 molecule I sec 1 and Fc= 0.4.
Because Sander and Watson's data base at 298K is much larger than ours and
because our results are in excellent agreement with theirs, we have fit
our temperature dependent data by trial and error with the constraint that
k0(298), k(298), and Fc must fall within the error limits given by Sander
.4 and Watson. The best fit to the data is obtained for (Figure 4)
ko(T) = 2.2 x 10"so (T cm25 molecule 2s
QT) 7 x 10" (_)- cm 3molecule&'s'
I ;Fc = 0.4.
,* Our results suggest that Reaction (1) could contribute significantly
towards removal of CH302 and NO2 in the presence of high concentrations
of NOx(such as those encountered in urban smog) if CH302N02 is thermally
stable.
25

References
1. I.C. Plumb, K.R. Ryan, J.R. Steven, and M.F.R. Mulcahy, Chem. Phys.
Letters 63, 255 (1979).
2. S.P. Sander and R.T. Watson, J. Phys. Chem. (in press).
3. A.R. Ravishankara, F.L. Eisele, and P.H. Wine, presented at theGordon Conference on Environmental Chemistry-Air, 1979.
4.(a) C.J. Howard and K.M. Evenson, Geophys. Res. Lett. 4, 437 (1977).
(b) B.Reimann and F. Kaufman, paper presented at 13th Informal Conferenceon Photochem., Clearwater Beach, FL (1978).
(c) J.P. Burrows, D.I. Clift, G.W. Harris, B.A. Thrush, and J.P. Wilkinson,W.M.O. Sym. Ozone, Toronto, Canada (1978).
(d) J.J. Margitan and J.G. Anderson, paper presented at 13th InformalConference on Photochemistry, Clearwater Beach, FL (1978).
(e) M.T. Leu, J. Chem. Phys. 70, 1662 (1979).
5. C.J. Howard, J. Chem. Phys. 71, 2352 (1979).
6.(a) C.W. Spicer, A. Villa, H.A. Wiebe, and J. Heicklen, J. Amer. Chem.Soc. 95, 13 (1973).
(b) R. Simonaitis and J. Heicklen, J. Phys. Chem. 78, 2417 (1974).
(c) R. Simonaitis and J. Heicklen, J. Phys. Chem. 79, 298 (1975).
7. C.T. Pate, B.J. Finlyason, and J.N. Pitts, Jr., J. Amer. Chem. Soc.96, 6554 (1974).
"4 8. R.A. Cox, R.G. Derwent, P.M. Holt, and J.A. Kerr, J.C.S. Faraday I,72, 2444 (1976).
9. R.A. Cox and G.S. Tyndall, Chem. Phys. Lett. 65, 357 (1979).
10. H. Adachi and N. Basco. Int. J. Chem. Kinet. XII, 1 (1980).
11. P.H. Wine, N.M. Kreutter, and A.R. Ravishankara, J. Phys. Chem.83, 3191 (1979).
12. A.M. Bass, A.E. Ledford, Jr., and A.H. Laufer, J. Res. Natl. Bur.Stand. Section A 80, 143 (1976).
13. J.G. Calvert and J.N. Pitts, Jr., "Photochemistry," John Wileyand Son, Inc. 1966.
14. S.P. Sander and R.T. Watson, Private communications, 1980.
15. H.S. Johnston, S.G. Chang, and G. Whitten 78, 1 (1974).
26
16. NASA Reference Publication 1049, "The Strantosphere: Present andFuture," Editors, R.D. Hudson and F.I. Reed, (1979).
17. W.D. Taulor, T.D. Allston, M.J. Moscato, G.B. Fazekas, R. Koziosi,and G.A. Takacs, Int. J. Chemical Kinetics, in press, 1980, andreferences therein.
18. R.A. Graham, A.M. Winer, and J.N. Potts, Jr., J. Chem. Phys. 68,4505 (1978).
19. J. Troe, J. Phys. Chem. 83, 114 (1979).J. Troe, J. Chem. Phys. 66, 4758 (1977).
it
-- _ 27

Acknowledgements
We would like to thank Drs. S.P. Sander and R.T. Watson for very
helpful discussions throughout this work. We would also like to thank
Mr. A.O. Langford for discussions which steered us towards utilization of
colinear photolysis and probing laser beams.
This work was supported by the U.S. Department of Transportation/
Federal Aviation Administration through Contract #DOT-FA78WA-4259.
I
iw
f ,.8

APPENDIX I
Preparation of Azomethane
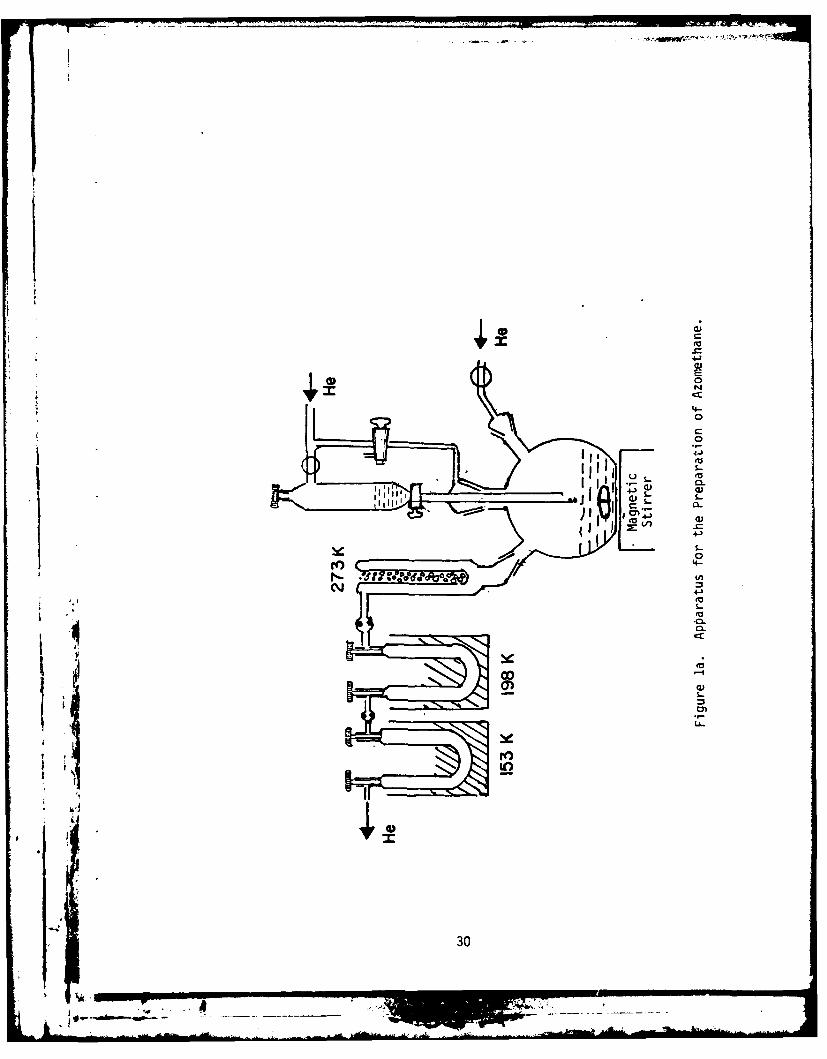
The apparatus used for preparation of azomethane is shown in
Figure la. The method we used is a slightly modified version of the
Renaud and Leitch preparation procedure.
Ten grams of Sym-1,2-dimethylhydrazinedihydrochloride (obtained from
Aldrich Chemical Co.) was slowly added to 25 ml of 6N NaOH contained in
a 250 ml Erlenmeyer flask. The flask was cooled in an ice bath and the
contents vigorously stirred using a magnetic stirrer. When 10 gm of Sym
1,2-dimethylhydrazinedihydrochloride was added, v 3 ml of 6N NaOH was
mixed with this solution to dissolve any remaining solid. This solution
was transferred to the dropping funnel.
35 grams of mercury (II) oxide was mixed with 50 ml of distilled
water in the three-necked 500 ml flat-bottom flask. The three-necked
flask was connected on one side to a helium tank and another side to a
cold finger. The cold finger, maintained at O°C with crushed ice, was
connected to two glass traps in series. Both traps were cleaned by
flaming them under vacuum.
Before starting the addition of the solution present in the droppingi funnel to the three-necked flask, the assembled system was flushed with
He for at least one hour to remove all traces of air present in the
assembly. The first trap was maintained at 193K (dry ice-trichloro-
ethylene slush) and the second at ". 163K (ethanol cooled with liquid N2).
The solution in the dropping funnel was added in drops to the slurry of
mercuric oxide which was slowly stirred with a magnetic stirrer. The
addition was completed in 45 minutes and He allowed to flow for another
29
, .. .,,,, 4
I--
0
C-
4-J a)
L
;77 cz
I'oIS
a,
30
___ -Ag

20 minutes to sweep out any remaining azomethane in to the traps. (The
flow rate of helium was ,, 20 ml/min.)
The traps were disconnected from the assembly and cooled to 77K
with liquid N2 to pump out He before transferring the contents to a bulb.
The cold finger of the bulb was then maintained at 197K and azomethane
distilled into a storage vessel maintained at 77K. The first and the
last fractions were discarded. The vapor pressure of azomethane at
197K is ̂ 7 torr while that of H20 is less than 1x 10 torr which
* enabled us to separate the two.
All preparation and handling of azomethane was carried out
in the dark or under red lights to avoid photolysis. The azomethane
was stored at 197K.
'I
,!
..

APPENDIX II
Generation of the 257 nm CW.UV Laser Beam
A schematic diagram of the setup is shown in Figure 2a. A Lexel model
95 Argon ion laser was operated on the 514 nm line. The out of this laser
was checked to ensure that the laser was operating in TEMoo mode. The
Gaussian beam was focused using a 10 cm focal length quartz plano convex
lens to obtain a tight beam waist with a confocal parameter of 10 cm.
(The focal length at 514 nm of the lens was accurately measured using the
cat's eye technique) The position of the lens was adjusted to locate the
beam waist in the middle of a 50 mm long (10 mm x 10 mm on the side) ADP
crystal (Inrad Corp.) which was housed in a gold plated copper block. This
copper block was in snug contact with a gold plated pedestal which was
backed by a Paltier thermoelectric cooler. The Peltier cooler itself was
backed by a heater block which, in turn, was cooled by circulating water
at a constant temperature (+ 2 OC) from a temperature controlled five gallon
water bath heated by a fish tank heater. By adjusting the rate of water
flow and the temperature of the heater block (which was controlled by a
proportional heater) the temperature of the ADP crystal could be m~intained
at -10 °C with a precision of +0.1 °C. We found that the doubled 257 nm
output was a maximum at this temperature.
The 257 nm beam was diverging as it exited the crystal; this beam was
rendered parallel by a second lens (n- 15 cm focal length at 257 nm). The
collinear 257 nm and 514 nm beams were dispersed by a prism and the 514
nm beam stopped by a block. The entire assembly was housed inside a box
to prevent dust from getting in and 514 nm light from scattering out.
32
.ALl

03
C 0L
'-4LA)
E I
Cl CL
0
LA Cl)F--oJc
cC
u C j 4J
CC
,wa.,
1-4-LnA
330
UNow_

With an input energy of 1 W at 514 nm, we could routinely obtain
50v~W of 257 nm, which was more than adequate to carry out our experiments.
34