Embed Size (px)
Citation preview

Pietal et al. BMC Bioinformatics 2012, 13:333http://www.biomedcentral.com/1471-2105/13/333
SOFTWARE Open Access
RNAmap2D – calculation, visualization andanalysis of contact and distance maps for RNAand protein-RNA complex structuresMichal J Pietal1†, Natalia Szostak2†, Kristian M Rother1,2 and Janusz M Bujnicki1,2*
Abstract
Background: The structures of biological macromolecules provide a framework for studying their biologicalfunctions. Three-dimensional structures of proteins, nucleic acids, or their complexes, are difficult to visualize indetail on flat surfaces, and algorithms for their spatial superposition and comparison are computationally costly.Molecular structures, however, can be represented as 2D maps of interactions between the individual residues,which are easier to visualize and compare, and which can be reconverted to 3D structures with reasonableprecision. There are many visualization tools for maps of protein structures, but few for nucleic acids.
Results: We developed RNAmap2D, a platform-independent software tool for calculation, visualization and analysisof contact and distance maps for nucleic acid molecules and their complexes with proteins or ligands. Theprogram addresses the problem of paucity of bioinformatics tools dedicated to analyzing RNA 2D maps, given thegrowing number of experimentally solved RNA structures in the Protein Data Bank (PDB) repository, as well as thegrowing number of tools for RNA 2D and 3D structure prediction. RNAmap2D allows for calculation and analysis ofcontacts and distances between various classes of atoms in nucleic acid, protein, and small ligand molecules. It alsodiscriminates between different types of base pairing and stacking.
Conclusions: RNAmap2D is an easy to use method to visualize, analyze and compare structures of nucleic acidmolecules and their complexes with other molecules, such as proteins or ligands and metal ions. Its special featuresmake it a very useful tool for analysis of tertiary structures of RNAs. RNAmap2D for Windows/Linux/MacOSX is freelyavailable for academic users at http://iimcb.genesilico.pl/rnamap2d.html
Keywords: Contact maps, Distance maps, RNA secondary structure, RNA base pairing, RNA stacking, Protein-RNAcomplex, Docking
BackgroundRNAs and proteins are linear polymers composed of alimited set of building blocks (ribonucleotide and aminoacid residues, respectively) that may spontaneously foldinto complex three-dimensional shapes [1,2]. In bothRNA and proteins, the order of building blocks held to-gether by covalent bonds is called the primary structure,the local conformation of the chain stabilized mostly by
* Correspondence: [email protected]†Equal contributors1Laboratory of Bioinformatics and Protein Engineering, International Instituteof Molecular and Cell Biology in Warsaw, ul. Ks. Trojdena 4, PL 02-109,Warsaw, Poland2Laboratory of Bioinformatics and Protein Engineering, International Instituteof Molecular and Cell Biology in Warsaw, ul. Ks. Trojdena 4, Warsaw PL61-614, Poland
© 2012 Pietal et al.; licensee BioMed Central LCommons Attribution License (http://creativecreproduction in any medium, provided the or
hydrogen bonds is the secondary structure, while the pathof the chain in three dimensions (3D) resulting from va-rious long-range interactions is the tertiary structure. It isknown that many proteins and RNAs undergo confor-mational transitions. Macromolecules and their parts mayalso exhibit structural disorder, i.e. fluctuations betweenmany different conformations [3,4]. The functions of pro-teins and RNAs typically involve physical interactions withother molecules in the cell, which are dependent on thestructure and plasticity of the interacting partners. Thus,the functions of proteins and RNAs alike depend on the3D structure and dynamics of these molecules, which inturn are encoded in their linear, i.e. unidimensional (1D)sequences [5].
td. This is an Open Access article distributed under the terms of the Creativeommons.org/licenses/by/2.0), which permits unrestricted use, distribution, andiginal work is properly cited.
Pietal et al. BMC Bioinformatics 2012, 13:333 Page 2 of 11http://www.biomedcentral.com/1471-2105/13/333
While three-dimensional macromolecular structuresrepresent an information-rich framework for studyingbiological functions, visualizing and analyzing them isdifficult both for humans and computer programs. Two-dimensional (2D) flat images are more readily discernibleto the eye and more memorable than complex 3D images.As a matter of fact, 3D structures of macromolecules(including proteins, nucleic acids, and their complexes),can be represented as square symmetrical matrices con-taining data about the proximity of residue or atom pairsin the molecule [6]. Values stored in the matrix may repre-sent e.g. euclidean distances between particular atoms,such matrix is then called a distance map). If only binaryinformation about residue-residue interactions is included,a matrix is called a contact map. In a contact map, aresidue-residue interaction may be qualified by an eucli-dean distance below a given threshold or by a particulartype of contact. The representation of macromolecularstructure by its 2D map is independent on the coordinateframe (i.e. makes the representation invariant to rotationsand translations), which makes it useful for both vi-sualization and structure comparison. Contact maps canbe also enriched with additional information, e.g. to dis-criminate different types of contacts or to indicate the chi-rality in 3D (handedness), which is otherwise lost upon theconversion to a 2D representation.It has been demonstrated that the 3D structure of a pro-
tein (and, by analogy, any linear polymer that forms a com-pact structure) can be recovered from its contact maprepresentation, with the reconstructed and original struc-tures similar up to the resolution of the contact map re-presentation [7]. This rationalizes the development ofcomputational tools for analysis and visualization of macro-molecular 2D maps, as an alternative to dealing directlywith 3D structures. In fact, complex structures of RNAmolecules have been traditionally described as 2D dia-grams, exemplified by the popular “cloverleaf” representa-tion of the tRNA molecule. Such diagrams emphasize“orthodox” pairing of bases with their Watson-Crick edges,and with the use of additional symbols or colors they canalso display other types of pairing, using the Hoogsteen andsugar edges [8]. However, a single nucleotide residue caninteract with more than one nucleotide at a time (stackingusing two faces, base-pairing using three edges, and inter-acting with the phosphate group). In this situation second-ary structure plots become illegible due to crossing ofmultiple lines indicating long-distance contacts. On theother hand, the same type of information can be repre-sented (and visualized) with a square symmetrical matrixcontaining data about different types of interactions e.g.discriminated by the use of different colors. With only a lit-tle training, one can learn to quickly distinguish e.g. helicesand complex tertiary arrangements, such as pseudoknots.Similarities between distantly related RNAs can be seen
easily in contact maps, even when the 3D structures super-impose poorly.The development of computational tools for molecular
structure visualization must keep up with the growingamount of bioinformatics data and the definition of newdata types. Structure visualization, analysis, and annota-tion tools play an increasingly important role in research,contributing significantly to understanding the biologicalfunction of macromolecules. There is a number of toolscapable of calculating, displaying, and analyzing proteincontact maps, including VMD [9], SeqX [10], PConPy[11], or CMView [12]. While some of these methods areable to display contacts of the protein component to thenucleic acid ligand, they do not produce a 2D map if RNAstructure alone is provided as input, and they do notdiscriminate between different types of nucleotide interac-tions. As more and more RNA structures are determinedby experimental methods or predicted by computationaltechniques, it becomes increasingly important to reinforcecurrent state-of-art 3D RNA modeling tools with 2D vi-sualization capabilities. Thus, we developed a computerprogram dedicated to structural maps of RNAs and RNA-protein or ligand-complexes, with particular emphasis onvisualization of different types of interactions mediated byedges or faces of nucleotide bases, i.e. pairing and stacking.
ImplementationProgramming language, systems, external programsRNAmap2D was developed based on its predecessorPROTmap2D [13]. The core programming language ofRNAmap2D is Python. The program uses the Biopython[14] and PyCogent [15] libraries to handle PDB structures.RNAmap2D is available for Linux, Windows and
MacOSX. To create a Windows executable version of theprogram, we used the py2exe 0.6.9 tool and to build aMacOSX version, py2app 0.3.6, respectively. Hardwarerequirements for RNAmap2D are very modest as of 2012,i.e. 1 GHz processor and 512 MB RAM memory.In analogy to a number of programs for determination
of protein secondary structure from 3D coordinates [16]that differ from each other in definition of structures andalgorithms for their detection, there exist various tools fordetermination of contacts from RNA 3D structures. Wehave adapted RNAmap2D to use RNAView [17] for basepair calculation. However, RNAView is not available forWindows, therefore we added our own procedure for cal-culating base/nucleotide pairs, developed in ModeRNA[18]. For every pair of residues considered, it superim-poses reference frames of all known pairs types as well aspredicts the presence of H-bonds characteristic for a givenpair type based on interatomic distances and angles. Thismakes the latter procedure sensitive to distortions of therelative conformation of the nucleotide. According to ourtests this procedure agrees with RNAView in assignment
Pietal et al. BMC Bioinformatics 2012, 13:333 Page 3 of 11http://www.biomedcentral.com/1471-2105/13/333
of ~95% of canonical base pairs. At startup, RNAmap2Dchecks for the presence of the installed RNAView pro-gram, and uses it by default for base pair interactions clas-sification, while in its absence our modules are used.
User skillsRNAmap2D requires no programming or scripting skillsto make use of all of its features, regardless of the platform.The Windows and MacOSX versions require no installa-tion, except for downloading and unpacking the distribu-tion file. Linux distribution is a set of bytecode Pythonfiles that require the installation of all modules cited at thebeginning of this section prior to the use of the program.Users are provided with a comprehensive manual and areadme file that explains all installation steps. All versionsprovide the same functionalities except for the above-mentioned absence of RNAView for the Windows platform.Our program has an easy-to-use graphic user interface
that allows for customizing the final contact or distancemap, and by setting all the important parameters. RNA-map2D navigation scheme design allows for making a stepback from the final map view to the main options panel inorder to refine parameters and promptly visualize thedesired output. The intermediate results of calculationsare stored in the computer memory to keep the data pro-cessing time at a minimum.Distance and contact maps can be saved and uploaded
as text files in a variety of formats, including e.g. the onesused in CASP or by the PHYLIP package. Maps can bealso exported and uploaded as Microsoft Office Excel™spreadsheets. Finally, images of maps can be exported asPNG, BMP, and TIFF files.
SpeedTo optimize the speed of RNAmap2D, we used C and C++libraries that are accessible under Python: wxPython (forthe graphical user interface), Numeric and NumPy (formost numeric calculations). Also, the core calculationroutine in RNAmap2D is the determination of distancesand contacts between atoms and residues. We used theKDTree algorithm [19] as implemented in Biopython,which has log-linear calculation time, fastest known todate. As an example, for a molecule of the size of 100 nu-cleotide residues, the calculation time reaches 1000 timeunits (typically below a second for obtaining a raw list ofcontacts from a 3D structure). It compares favorably e.g.with an alternative approach used by the PConPy programfor protein contact maps [11] that relies on a naïve doubleloop for calculating a contact map. For the molecule ofidentical size, the calculation time would reach 4950 units,which is five times slower. This is because time complexityof most such algorithms is of the order of O(n2). Pleasenote however, that the calculation time for RNA moleculeslonger than 200 bases can be quite long if no RNAView
plugin is installed. Bearing this in mind, we designedan additional “no pairings (fast)” contact map calculationmode that bypasses the pairing calculation algorithm andcan be used alternatively for large RNA structures, inorder to obtain a raw contact map very quickly.
Results and discussionBased on our previous experience with protein 2D map ana-lysis and core parts of the PROTmap2D code [13], we devel-oped RNAmap2D, a standalone tool for calculation,visualization and analysis of contact and distance maps ofnucleic acid structures and structures of protein-nucleic acidcomplexes. PROTmap2D was designed to perform varioustasks on proteins only. As a consequence, it has no genericor specific capabilities that could address tasks specific tonucleic acids or complexes formed by nucleic acids. Also,PROTmap2D cannot visualize contacts made by macromo-lecules with ligands or ions. On the other hand, the inter-action of RNA with ions is essential for the formation andstability of its 3D structure [20], therefore RNA-ion contactsshouldn’t be neglected in structural analyses. RNAmap2D istherefore an independent program, with multiple featuresspecific for RNA, and not simply an upgrade of PROT-map2D. Our method can serve to analyze DNA as well asRNA. However we expect that because of regularity of DNAstructures, this type of nucleic acid will not be frequentlyanalyzed on the 2D level, hence the program’s nameincludes only RNA as the key input molecule. For simplicity,in this article we refer mostly to RNA alone.RNAmap2D can calculate a contact map or a distance
map of an RNA structure, compare two alternative 3Dmodels of RNA (e.g. predicted structure versus experimen-tally solved one). Our program can analyze an ensemble ofstructures (e.g. the content of a PDB file solved by theNMR method), with two alternative statistics measures.RNAmap2D is also capable of visualizing a contact map ofprotein-RNA complex, and a series of such models, e.g. ori-ginating from a protein-RNA docking experiment. RNA-map2D can also calculate, visualize and export RNAsecondary structure in a common dot-bracket format.Secondary structure can be also imported and displayedas a 2D diagram – in this case all contacts visualized byRNAmap2D will correspond to Watson-Crick base pairs,as other types of contacts are not represented in trad-itional secondary structure representations.RNAmap2D generates interactive 2D maps, with a possi-
bility to zoom in onto particular fragments. Zooming isenabled when a user presses a mouse button over a mapand drags a rectangle-shaped area. The content of this areais shown in a separate window, with a sequence ruler,range indicator and a possibility of resizing. Also, when auser hovers a mouse cursor over a specific contact, awindow appears with information about the residue pair,including residue index, residue name and binary (Y/N)

Figure 2 A traditional 2D rendering of the 3D structure for the23S rRNA fragment (PDB ID: 1HC8, chain C). 5’ and 3’-terminalresidues are numbered. Nucleotide residues involved in Watson-Crick base-pairing are shown in pink and violet. Mg2+ ions are shownas green balls. The limitation of this representation is that a singleatom can have only one color and the use of multiple colors to
Pietal et al. BMC Bioinformatics 2012, 13:333 Page 4 of 11http://www.biomedcentral.com/1471-2105/13/333
contact information. Additional interaction schemes spe-cific to different tasks are available, such as color panels,fields to input certain value limits etc., which are describedbelow in specific sections.Output options for 2D maps include a number of image
formats (BMP, GIF, JPG, PNG, TIFF), and various text for-mats developed initially for storing the results of compara-tive analyses of protein sequences and structures: CASP[21], EVA [22], PHYLIP [23] and CLANS [24]. RNAmap2Dcan also encode maps in formats such as CSV or MS Excel™spreadsheets, which can be easily read and analyzed withmany third-party tools. The program is also capable of read-ing a map encoded as a text or Excel file, e.g. a file exportedfrom RNAmap2D and edited in a third-party program.In the section below we highlight some of the tasks of
RNAmap2D that we find most typical in our own researchon RNA structures. All tasks and options are extensively
Figure 1 RNAmap2D user interface. The main menu screen ofRNAmap2D, which serves as the entry panel for all analyses. The user isasked to select the type of analysis (“a job”), provide the inputfilename, and indicate whether the program should use residuenumbers from the input file or recalculate them. Additionally, for multi-model files (e.g. model ensemble analysis), the user is asked to definethe tag that separates individual models in the input file.
illustrate different types of interactions can become overwhelming.
documented in the User’s Manual, which is provided onthe program’s website. The program is also accompaniedby a Tutorial, which intends to demonstrate all standardfeatures for a user without any prior knowledge. A set ofPDB structures and other files is also provided, so thatusers do not have to search for appropriate input in orderto test and see all the features described in the Tutorial(Figure 1).
RNA contact mapRNAmap2D works on the level of residues rather than in-dividual atoms. A user can specify the definition of atomsused to calculate the presence of a contact: the type ofatoms to be included in calculations (the options per resi-due are: single atoms - C10, C40, O50, N1/N9 for purinesand pyrimidines respectively, or multiple atoms - all orheavy/non-hydrogen), a maximal distance (in Å) betweenthe specified atoms to form a contact, and a minimal resi-due separation along the sequence (e.g. to exclude con-tacts between consecutive residues that are connected bycovalent bonds). If multiple atoms are considered, it is suf-ficient for any pair of atoms from two residues to fallbelow the distance threshold to have this residues classi-fied as in contact; RNAmap2D does not generate a map ofcontacts between individual atoms, only maps informationabout proximal atoms on the respective residues. Howeverindividual heteroatom records found in PDB files that rep-resent ions or ligand atoms are treated as separate resi-dues. If the PDB file contains several models, the user canchoose a specific model to be analyzed by the program.For oligomeric structures, in most analyses it is also pos-sible to specify chain identifiers to limit the analysis to cer-tain chains of the molecule. Auxiliary options are: graphicsequence delimiter (ruler) and grid-like lines that separatechains (chain borders).
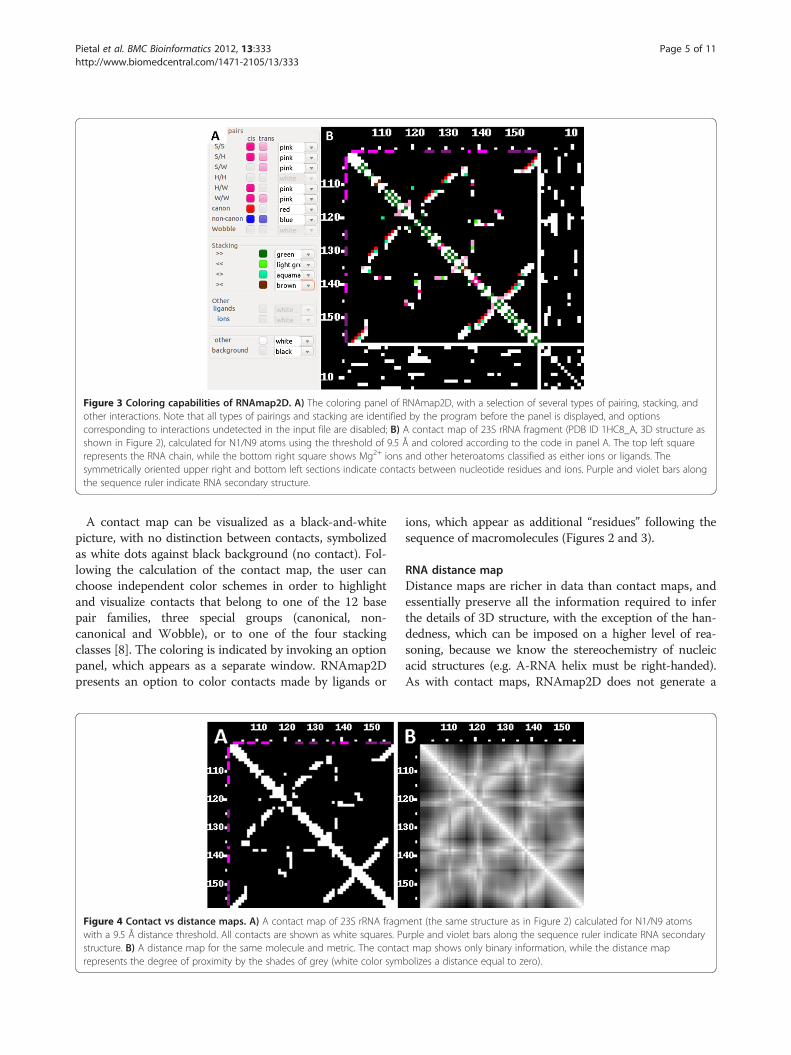
Figure 3 Coloring capabilities of RNAmap2D. A) The coloring panel of RNAmap2D, with a selection of several types of pairing, stacking, andother interactions. Note that all types of pairings and stacking are identified by the program before the panel is displayed, and optionscorresponding to interactions undetected in the input file are disabled; B) A contact map of 23S rRNA fragment (PDB ID 1HC8_A, 3D structure asshown in Figure 2), calculated for N1/N9 atoms using the threshold of 9.5 Å and colored according to the code in panel A. The top left squarerepresents the RNA chain, while the bottom right square shows Mg2+ ions and other heteroatoms classified as either ions or ligands. Thesymmetrically oriented upper right and bottom left sections indicate contacts between nucleotide residues and ions. Purple and violet bars alongthe sequence ruler indicate RNA secondary structure.
Pietal et al. BMC Bioinformatics 2012, 13:333 Page 5 of 11http://www.biomedcentral.com/1471-2105/13/333
A contact map can be visualized as a black-and-whitepicture, with no distinction between contacts, symbolizedas white dots against black background (no contact). Fol-lowing the calculation of the contact map, the user canchoose independent color schemes in order to highlightand visualize contacts that belong to one of the 12 basepair families, three special groups (canonical, non-canonical and Wobble), or to one of the four stackingclasses [8]. The coloring is indicated by invoking an optionpanel, which appears as a separate window. RNAmap2Dpresents an option to color contacts made by ligands or
Figure 4 Contact vs distance maps. A) A contact map of 23S rRNA fragmwith a 9.5 Å distance threshold. All contacts are shown as white squares. Pstructure. B) A distance map for the same molecule and metric. The contacrepresents the degree of proximity by the shades of grey (white color sym
ions, which appear as additional “residues” following thesequence of macromolecules (Figures 2 and 3).
RNA distance mapDistance maps are richer in data than contact maps, andessentially preserve all the information required to inferthe details of 3D structure, with the exception of the han-dedness, which can be imposed on a higher level of rea-soning, because we know the stereochemistry of nucleicacid structures (e.g. A-RNA helix must be right-handed).As with contact maps, RNAmap2D does not generate a
ent (the same structure as in Figure 2) calculated for N1/N9 atomsurple and violet bars along the sequence ruler indicate RNA secondaryt map shows only binary information, while the distance mapbolizes a distance equal to zero).
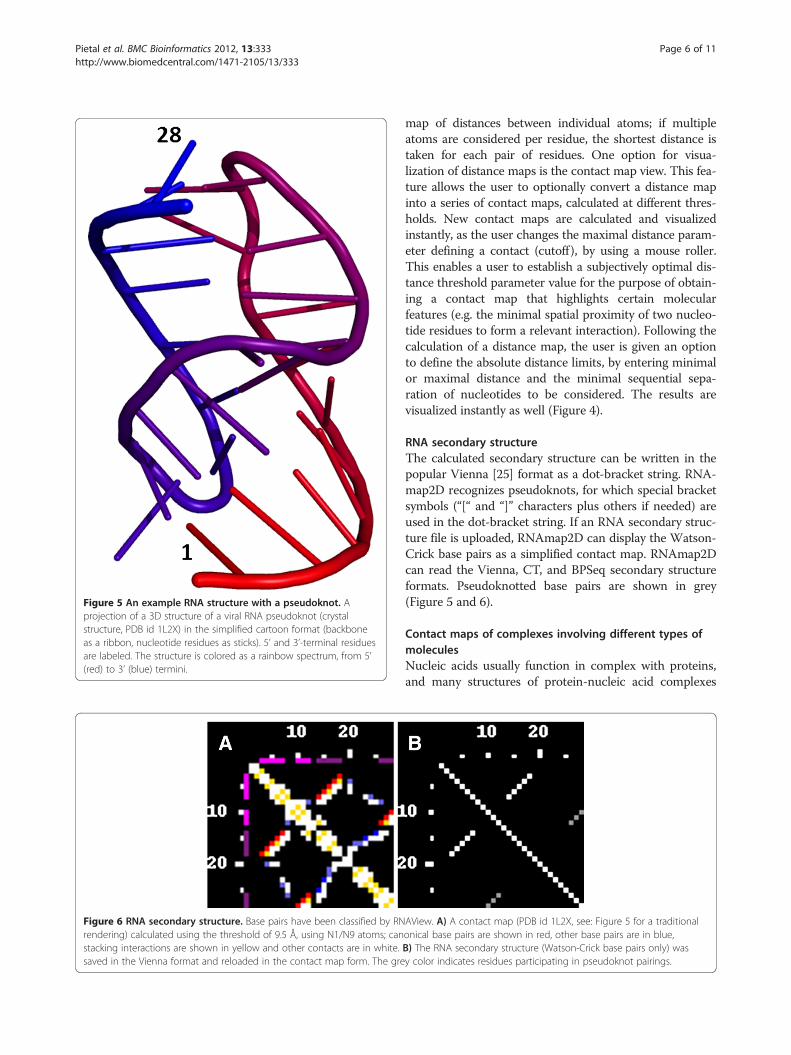
Figure 5 An example RNA structure with a pseudoknot. Aprojection of a 3D structure of a viral RNA pseudoknot (crystalstructure, PDB id 1L2X) in the simplified cartoon format (backboneas a ribbon, nucleotide residues as sticks). 5’ and 3’-terminal residuesare labeled. The structure is colored as a rainbow spectrum, from 5’(red) to 3’ (blue) termini.
Figure 6 RNA secondary structure. Base pairs have been classified by RNrendering) calculated using the threshold of 9.5 Å, using N1/N9 atoms; canstacking interactions are shown in yellow and other contacts are in white.saved in the Vienna format and reloaded in the contact map form. The gre
Pietal et al. BMC Bioinformatics 2012, 13:333 Page 6 of 11http://www.biomedcentral.com/1471-2105/13/333
map of distances between individual atoms; if multipleatoms are considered per residue, the shortest distance istaken for each pair of residues. One option for visua-lization of distance maps is the contact map view. This fea-ture allows the user to optionally convert a distance mapinto a series of contact maps, calculated at different thres-holds. New contact maps are calculated and visualizedinstantly, as the user changes the maximal distance param-eter defining a contact (cutoff), by using a mouse roller.This enables a user to establish a subjectively optimal dis-tance threshold parameter value for the purpose of obtain-ing a contact map that highlights certain molecularfeatures (e.g. the minimal spatial proximity of two nucleo-tide residues to form a relevant interaction). Following thecalculation of a distance map, the user is given an optionto define the absolute distance limits, by entering minimalor maximal distance and the minimal sequential sepa-ration of nucleotides to be considered. The results arevisualized instantly as well (Figure 4).
RNA secondary structureThe calculated secondary structure can be written in thepopular Vienna [25] format as a dot-bracket string. RNA-map2D recognizes pseudoknots, for which special bracketsymbols (“[“ and “]” characters plus others if needed) areused in the dot-bracket string. If an RNA secondary struc-ture file is uploaded, RNAmap2D can display the Watson-Crick base pairs as a simplified contact map. RNAmap2Dcan read the Vienna, CT, and BPSeq secondary structureformats. Pseudoknotted base pairs are shown in grey(Figure 5 and 6).
Contact maps of complexes involving different types ofmoleculesNucleic acids usually function in complex with proteins,and many structures of protein-nucleic acid complexes
AView. A) A contact map (PDB id 1L2X, see: Figure 5 for a traditionalonical base pairs are shown in red, other base pairs are in blue,B) The RNA secondary structure (Watson-Crick base pairs only) wasy color indicates residues participating in pseudoknot pairings.
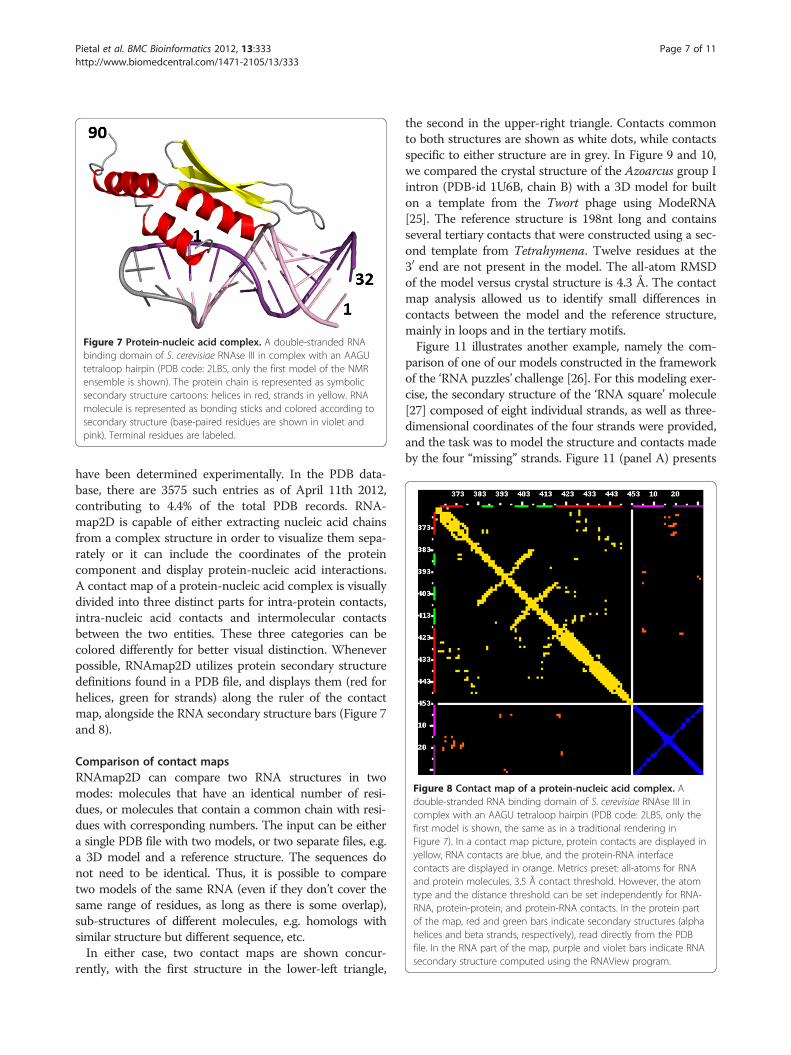
Figure 7 Protein-nucleic acid complex. A double-stranded RNAbinding domain of S. cerevisiae RNAse III in complex with an AAGUtetraloop hairpin (PDB code: 2LBS, only the first model of the NMRensemble is shown). The protein chain is represented as symbolicsecondary structure cartoons: helices in red, strands in yellow. RNAmolecule is represented as bonding sticks and colored according tosecondary structure (base-paired residues are shown in violet andpink). Terminal residues are labeled.
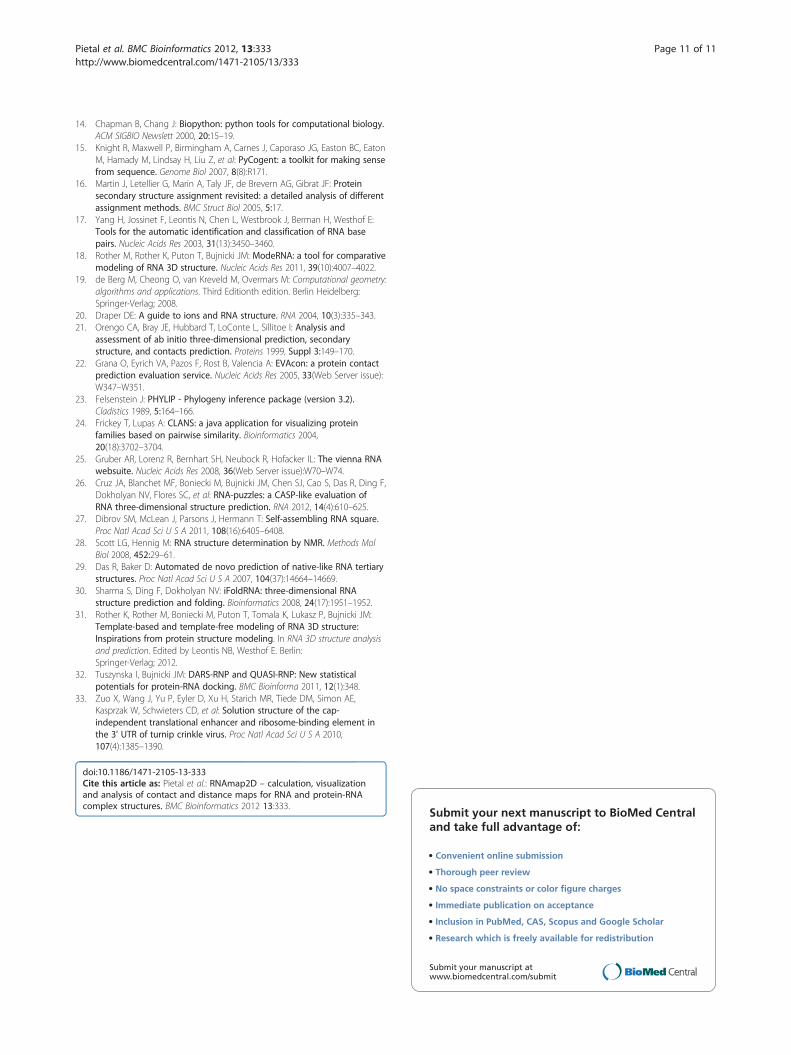
Figure 8 Contact map of a protein-nucleic acid complex. Adouble-stranded RNA binding domain of S. cerevisiae RNAse III incomplex with an AAGU tetraloop hairpin (PDB code: 2LBS, only thefirst model is shown, the same as in a traditional rendering inFigure 7). In a contact map picture, protein contacts are displayed inyellow, RNA contacts are blue, and the protein-RNA interfacecontacts are displayed in orange. Metrics preset: all-atoms for RNAand protein molecules, 3.5 Å contact threshold. However, the atomtype and the distance threshold can be set independently for RNA-RNA, protein-protein, and protein-RNA contacts. In the protein partof the map, red and green bars indicate secondary structures (alphahelices and beta strands, respectively), read directly from the PDBfile. In the RNA part of the map, purple and violet bars indicate RNAsecondary structure computed using the RNAView program.
Pietal et al. BMC Bioinformatics 2012, 13:333 Page 7 of 11http://www.biomedcentral.com/1471-2105/13/333
have been determined experimentally. In the PDB data-base, there are 3575 such entries as of April 11th 2012,contributing to 4.4% of the total PDB records. RNA-map2D is capable of either extracting nucleic acid chainsfrom a complex structure in order to visualize them sepa-rately or it can include the coordinates of the proteincomponent and display protein-nucleic acid interactions.A contact map of a protein-nucleic acid complex is visuallydivided into three distinct parts for intra-protein contacts,intra-nucleic acid contacts and intermolecular contactsbetween the two entities. These three categories can becolored differently for better visual distinction. Wheneverpossible, RNAmap2D utilizes protein secondary structuredefinitions found in a PDB file, and displays them (red forhelices, green for strands) along the ruler of the contactmap, alongside the RNA secondary structure bars (Figure 7and 8).
Comparison of contact mapsRNAmap2D can compare two RNA structures in twomodes: molecules that have an identical number of resi-dues, or molecules that contain a common chain with resi-dues with corresponding numbers. The input can be eithera single PDB file with two models, or two separate files, e.g.a 3D model and a reference structure. The sequences donot need to be identical. Thus, it is possible to comparetwo models of the same RNA (even if they don’t cover thesame range of residues, as long as there is some overlap),sub-structures of different molecules, e.g. homologs withsimilar structure but different sequence, etc.In either case, two contact maps are shown concur-
rently, with the first structure in the lower-left triangle,
the second in the upper-right triangle. Contacts commonto both structures are shown as white dots, while contactsspecific to either structure are in grey. In Figure 9 and 10,we compared the crystal structure of the Azoarcus group Iintron (PDB-id 1U6B, chain B) with a 3D model for builton a template from the Twort phage using ModeRNA[25]. The reference structure is 198nt long and containsseveral tertiary contacts that were constructed using a sec-ond template from Tetrahymena. Twelve residues at the30 end are not present in the model. The all-atom RMSDof the model versus crystal structure is 4.3 Å. The contactmap analysis allowed us to identify small differences incontacts between the model and the reference structure,mainly in loops and in the tertiary motifs.Figure 11 illustrates another example, namely the com-
parison of one of our models constructed in the frameworkof the ‘RNA puzzles’ challenge [26]. For this modeling exer-cise, the secondary structure of the ‘RNA square’ molecule[27] composed of eight individual strands, as well as three-dimensional coordinates of the four strands were provided,and the task was to model the structure and contacts madeby the four “missing” strands. Figure 11 (panel A) presents

Figure 9 Comparison of a group I intron crystal structure and acomparative 3D model built with the ModeRNA program, in3D. The homology model is compared to the crystal structure(1U6B_B), which was transformed by the deletion of 14 nt fragment tomatch the target sequence without major gaps. The picture showsboth 3D structures aligned: crystal structure (cyan) and the model (red).
Pietal et al. BMC Bioinformatics 2012, 13:333 Page 8 of 11http://www.biomedcentral.com/1471-2105/13/333
a superpositon of the crystal structure (PDB id 3P59)shown in cyan and a model generated by the Bujnickigroup shown in red. This model has been evaluated as themost accurate prediction for this molecule within the RNAPuzzles challenge [26]. The comparison of contact mapswith RNAmap2D shows that secondary structures havebeen modeled correctly, and a significant fraction of ter-tiary contacts observed in the crystal structure (bottomleft) are also present in the theoretical model (top right).
Figure 10 Comparison of a crystal structure and a comparative 3D mstructure. Contacts have been calculated using the N1/N9 metrics and 9.5triangle displays the contacts in the crystal structure, the upper right triangregions where the contacts differ, in particular one tertiary interaction site (
Comparison of structural ensemblesAnother ability of RNAmap2D is to analyze results ofcalculations, which typically generate not just one solu-tion, but entire ensembles. Such studies include RNAand RNP structure determination by NMR (review: [28]),and computational structure modeling approaches, suchas de novo folding (e.g. with FARNA [29] or iFoldRNA[30] or our in-house method SimRNA [31]) or protein-RNA docking (e.g. using low-resolution method to gene-rate decoys, followed by their scoring and ranking [32]).For such ensembles comprising sets of complexes (from afew to hundreds or even thousands of models) a statisticalcontact map can be calculated to visualize the frequenciesof contacts in the ensemble as shades of grey (Figure 12).RNAmap2D users can choose between two ways to dis-
play contacts that vary through the model ensemble file.In both cases, white fields on the map represent 100% fre-quency across a model set, and black fields represent nocontacts. For contacts that appear only in a fraction ofmodels, one option of visualization presents a relative fre-quency of contacts, where and shades of grey correspondto intermediate values (the more frequent the contact, thelighter the field). Another option is to present all “partial”contacts by one shade of grey.In an example analysis, we have analyzed the noncano-
nical base pairs in a part of the 30 UTR from turnip crinklevirus genomic RNA. This 102-nt structural element bindsto the large ribosomal subunit to promote translation.
odel, in 2D. The homology model is compared to the crystalÅ threshold (1U6B_B, 3D picture shown in Figure 9). A) The lower leftle those in the model. B) The right picture additionally highlights threeleft), one loop (center) and one junction (right).

Figure 11 Self-assembling RNA nano-square versus homology model. A) The 3D model (red) is compared to the crystal structure (PDB-id:3P59, [27], cyan). B) In the contact map picture, the lower left triangle displays the contacts in the crystal structure, the upper right triangle thosein the model. N1/N9 metrics and 9.5 Å threshold was used.
Pietal et al. BMC Bioinformatics 2012, 13:333 Page 9 of 11http://www.biomedcentral.com/1471-2105/13/333
The structure consists of three main helices. In the NMRstructure (PDB-ID 2krl), 10 models have been deposited.RNAmap2D can be used to check e.g. whether noncano-nical base pairs are maintained in all the models. We usedRNAmap2D to generate a contact map for the ensembleand then colored noncanical pairs in blue. We haveinspected individual pairs in the map zoomed to a full-screen mode and generated a statistics map and exportedthe contact frequencies to an Excel table. In the contactmap, regions that vary in the ensemble (e.g. due to in-creased flexibility) are immediately visible as grey areas.
Figure 12 Statistics of contacts in an NMR file. A) An AAGU tetraloop hpicture of an entire complex, see Figure 7 – here all NMR models are showin violet and pink. B) A statistical contact map of the whole ensemble of Rpercentage of particular contact occurrence in the whole model set. In thisvariability of contacts in the NMR file analyzed.
For instance tertiary interactions between hairpin loop37–43 and the structure (97–101) fluctuate, and basepairing in this region is not stable. In total, we identified15 noncanonical base pairs, of which four differ in at leastone of the 10 models. The three noncanonical pairs G9-G12, G29-U55, and A70-C87 (a sugar-Hoogsteen pair) differin only one of the models. The fourth pair, cis-Watson-Watson U67-C87, is present in four models only. It varies alot between the models and the participating bases can alsopair in the cis-Watson-Hoogsteen mode. Residues adjacentto A70 and C87 display some flexibility in the contact map
airpin from the protein-RNA complex (PDB code 2LBS_A, for then). The RNA molecule is colored according to the secondary structure,NA chains, 16 models in total. Shades of grey symbolize thecase, the C4’ metrics and 12 Å threshold were used to display the

Pietal et al. BMC Bioinformatics 2012, 13:333 Page 10 of 11http://www.biomedcentral.com/1471-2105/13/333
as well. This pair is located in an internal loop that is im-portant for switching between translation and replication inthe virus [33]. We conclude that RNAmap2D helps to iden-tify regions that undergo conformational changes by high-lighting them in the graphical output, and enables theirquantitative examination in a tabular report.
ConclusionsRNAmap2D is a new tool for calculation and visualizationof nucleic acid contact and distance maps. Our aim was tofacilitate analyses of RNA structures that focus on type andlocation of short-range interactions, without taking thespatial conformation of the backbone into account. RNA-map2D is also capable of analyzing protein-nucleic acidcomplexes. RNAmap2D is applicable in various scenarios,ranging from comparison of RNA 2D and 3D structural pre-dictions with each other and with the native structure, toanalyses of trajectories from MD simulations of nucleic acidstructures, to studies of RNA/DNA-protein and RNA/DNA-ligand interactions and analyses of macromoleculardocking experiments.PROTmap2D and RNAmap2D both provide researchers
with an extensive suite of programs for analysesand visualization of macromolecular structures. RNAmap2Druns on any modern operating system, is very fast and hasan intuitive interface. Both programs serve as a completeplatform that supplements the existing 3D visualizationtools, with sophisticated 2D map capabilities.
Availability and requirementsProject name: RNAmap2DProject home page: http://iimcb.genesilico.pl/rnamap2d.htmlOperating systems: Windows, Linux, MacOSX.Programming languages: Python (main), C/C++ (someparts of external libraries)Software packages (Windows, MacOSX): NoneSoftware packages (Linux): Python 2.6, Biopython 1.42,PyCogent 1.4, wxPython 2.8.10, PIL 1.1.6, Numeric 24.2,NumPy 1.1.3, PyExcelerator 0.6.3Other requirements: RNAView program is recom-mended as an optional plugin. Please refer to User’sManual and README file for installation instructionsto be found on the RNAmap2D project home page.Hardware requirements: min. 512 MB RAM, 1GHz CPUor better (2 GB RAM and 2 GHz CPU is recommended).License: RNAmap2D is distributed under free aca-demic license. Please refer to the home page for the li-cense document.Restriction for non-academics: Users willing to useRNAmap2D for non-academic purposes should con-tact the corresponding author for details. Please notethat this license will not affect commercial usage of
RNAView. Please contact authors of RNAView for aseparate license.
AbbreviationsPDB: Protein DataBank; PIL: Python Image Library; CASP: critical assessmentof techniques for protein structure prediction; CSV: comma-separated values;CT: connectivity table.
Competing interestsAuthors declare that they have no competing interests.
Authors’ contributionsNS participated in majority of the code implementation, including most ofthe features specific for RNA. MP co-supervised the work of NS, contributedthe code of PROTmap2D, participated in the development of the code,developed the final version of the software, and drafted the manuscript. KRco-supervised the work of NS, and participated in the development of thecode. JMB conceived of the study, participated in design and coordination,and edited the manuscript. All authors read and approved the finalmanuscript.
AcknowledgementsThe authors thank Irina Tuszynska for discussions, suggestions, and testingRNAmap2D in the context of RNA-protein docking, and also for criticallyproofreading the manuscript. The authors also thank Anna Philips for help inanalyzing structures containing ligands and ions and with nucleotidemodifications lists encoded within the RNAmap2D.This work was supported mainly by the European Commission (initially bythe FP6 grant “EURASNET”, LSHG-CT-2005-518238 and subsequently by theFP7 grant HEALTH-PROT, contract number 229676). Integration of varioussoftware tools involving protein bioinformatics in the Bujnicki laboratory inIIMCB has been supported by the EU structural funds (POIG.02.03.00-00-003/09). M.J.P was supported by European Social Fund through a SubcarpatianDoctoral Stipend Fund project. K.R. was independently supported by theGerman Academic Exchange Service (grant D/09/42768). J.M.B. wassupported by the Foundation for Polish Science (FNP, grant TEAM/2009-4/2).
Received: 6 June 2012 Accepted: 15 December 2012Published: 21 December 2012
References1. Dill KA: Dominant forces in protein folding. Biochemistry 1990,
29(31):7133–7155.2. Ferre-D’Amare AR, Doudna JA: RNA folds: insights from recent crystal
structures. Annu Rev Biophys Biomol Struct 1999, 28:57–73.3. Hazy E, Tompa P: Limitations of induced folding in molecular recognition
by intrinsically disordered proteins. Chemphyschem 2009,10(9–10):1415–1419.
4. Fulle S, Gohlke H: Constraint counting on RNA structures: linkingflexibility and function. Methods 2009, 49(2):181–188.
5. Anfinsen CB, Scheraga HA: Experimental and theoretical aspects ofprotein folding. Adv Protein Chem 1975, 29:205–300.
6. Phillips DC: The development of crystallographic enzymology. BiochemSoc Symp 1970, 30:11–28.
7. Vendruscolo M, Kussell E, Domany E: Recovery of protein structure fromcontact maps. FoldDes 1997, 2(5):295–306.
8. Leontis NB, Westhof E: Geometric nomenclature and classification of RNAbase pairs. RNA 2001, 7(4):499–512.
9. Humphrey W, Dalke A, Schulten K: VMD: visual molecular dynamics. J MolGraph 1996, 14(1):33–38. 27–38.
10. Biro JC, Fordos G: SeqX: a tool to detect, analyze and visualize residueco-locations in protein and nucleic acid structures. BMC Bioinforma 2005,6:170.
11. Ho HK, Kuiper MJ, Kotagiri R: PConPy-a python module for generating 2Dprotein maps. Bioinformatics 2008, 24(24):2934–2935.
12. Vehlow C, Stehr H, Winkelmann M, Duarte JM, Petzold L, Dinse J, Lappe M:CMView: interactive contact map visualization and analysis. Bioinformatics2011, 27(11):1573–1574.
13. Pietal MJ, Tuszynska I, Bujnicki JM: PROTMAP2D: visualization, comparison,and analysis of 2D maps of protein structure. Bioinformatics 2007,23(11):1429–1430.
Pietal et al. BMC Bioinformatics 2012, 13:333 Page 11 of 11http://www.biomedcentral.com/1471-2105/13/333
14. Chapman B, Chang J: Biopython: python tools for computational biology.ACM SIGBIO Newslett 2000, 20:15–19.
15. Knight R, Maxwell P, Birmingham A, Carnes J, Caporaso JG, Easton BC, EatonM, Hamady M, Lindsay H, Liu Z, et al: PyCogent: a toolkit for making sensefrom sequence. Genome Biol 2007, 8(8):R171.
16. Martin J, Letellier G, Marin A, Taly JF, de Brevern AG, Gibrat JF: Proteinsecondary structure assignment revisited: a detailed analysis of differentassignment methods. BMC Struct Biol 2005, 5:17.
17. Yang H, Jossinet F, Leontis N, Chen L, Westbrook J, Berman H, Westhof E:Tools for the automatic identification and classification of RNA basepairs. Nucleic Acids Res 2003, 31(13):3450–3460.
18. Rother M, Rother K, Puton T, Bujnicki JM: ModeRNA: a tool for comparativemodeling of RNA 3D structure. Nucleic Acids Res 2011, 39(10):4007–4022.
19. de Berg M, Cheong O, van Kreveld M, Overmars M: Computational geometry:algorithms and applications. Third Editionth edition. Berlin Heidelberg:Springer-Verlag; 2008.
20. Draper DE: A guide to ions and RNA structure. RNA 2004, 10(3):335–343.21. Orengo CA, Bray JE, Hubbard T, LoConte L, Sillitoe I: Analysis and
assessment of ab initio three-dimensional prediction, secondarystructure, and contacts prediction. Proteins 1999, Suppl 3:149–170.
22. Grana O, Eyrich VA, Pazos F, Rost B, Valencia A: EVAcon: a protein contactprediction evaluation service. Nucleic Acids Res 2005, 33(Web Server issue):W347–W351.
23. Felsenstein J: PHYLIP - Phylogeny inference package (version 3.2).Cladistics 1989, 5:164–166.
24. Frickey T, Lupas A: CLANS: a java application for visualizing proteinfamilies based on pairwise similarity. Bioinformatics 2004,20(18):3702–3704.
25. Gruber AR, Lorenz R, Bernhart SH, Neubock R, Hofacker IL: The vienna RNAwebsuite. Nucleic Acids Res 2008, 36(Web Server issue):W70–W74.
26. Cruz JA, Blanchet MF, Boniecki M, Bujnicki JM, Chen SJ, Cao S, Das R, Ding F,Dokholyan NV, Flores SC, et al: RNA-puzzles: a CASP-like evaluation ofRNA three-dimensional structure prediction. RNA 2012, 14(4):610–625.
27. Dibrov SM, McLean J, Parsons J, Hermann T: Self-assembling RNA square.Proc Natl Acad Sci U S A 2011, 108(16):6405–6408.
28. Scott LG, Hennig M: RNA structure determination by NMR. Methods MolBiol 2008, 452:29–61.
29. Das R, Baker D: Automated de novo prediction of native-like RNA tertiarystructures. Proc Natl Acad Sci U S A 2007, 104(37):14664–14669.
30. Sharma S, Ding F, Dokholyan NV: iFoldRNA: three-dimensional RNAstructure prediction and folding. Bioinformatics 2008, 24(17):1951–1952.
31. Rother K, Rother M, Boniecki M, Puton T, Tomala K, Lukasz P, Bujnicki JM:Template-based and template-free modeling of RNA 3D structure:Inspirations from protein structure modeling. In RNA 3D structure analysisand prediction. Edited by Leontis NB, Westhof E. Berlin:Springer-Verlag; 2012.
32. Tuszynska I, Bujnicki JM: DARS-RNP and QUASI-RNP: New statisticalpotentials for protein-RNA docking. BMC Bioinforma 2011, 12(1):348.
33. Zuo X, Wang J, Yu P, Eyler D, Xu H, Starich MR, Tiede DM, Simon AE,Kasprzak W, Schwieters CD, et al: Solution structure of the cap-independent translational enhancer and ribosome-binding element inthe 3’ UTR of turnip crinkle virus. Proc Natl Acad Sci U S A 2010,107(4):1385–1390.
doi:10.1186/1471-2105-13-333Cite this article as: Pietal et al.: RNAmap2D – calculation, visualizationand analysis of contact and distance maps for RNA and protein-RNAcomplex structures. BMC Bioinformatics 2012 13:333.
Submit your next manuscript to BioMed Centraland take full advantage of:
• Convenient online submission
• Thorough peer review
• No space constraints or color figure charges
• Immediate publication on acceptance
• Inclusion in PubMed, CAS, Scopus and Google Scholar
• Research which is freely available for redistribution
Submit your manuscript at www.biomedcentral.com/submit


![expVIP: a Customizable RNA-seq Data Analysis and ...expVIP: a Customizable RNA-seq Data Analysis and Visualization Platform1[OPEN] Philippa Borrill2, Ricardo Ramirez-Gonzalez2, and](https://img.dokumen.tips/doc/110x75/5fbe28f5cbc45957df55cb6c/expvip-a-customizable-rna-seq-data-analysis-and-expvip-a-customizable-rna-seq.jpg)