Embed Size (px)
Citation preview

Page 1 – Copyright © 2012 RM Research – www.rmresearch.com.au - Please read the disclaimer for terms.
What’s New? Why Read This? The past 12-18 months have been driven mostly by macro factors pushing equities to move in a lockstep pattern, implying high intra-stock correlation and a lack of fundamentals in the market place. These factors created a “lose-lose” situation for traditional investors. Recalling the “bear” arguments of CY11 and CY12 we can spot the market patterns that ignored fundamentals: 1) “bears” first argued that a recession was imminent last September, 2) during the last few quarters “bears” shifted their argument towards P/E multiple contraction due to margin compression, while 1QCY12 and 2QCY12 showed an opposite scenario, and 3) finally, the market rally over the last few weeks was triggered by Wall Street hopes of additional stimulus rather than companies beating earnings estimates. We believe that in such an unpredictable market environment, investors should consider a shift towards more defensive sectors in order to get a better alpha for their portfolios.
Pick Your Defensive Play – Australian Healthcare We consider Healthcare to be among the best defensive sectors in the Australian share market. Even during uncertain economic times and fiscal austerity, people will always need medical services and drugs, particularly given the aging populations in developed countries. These make revenues and profits of the Healthcare industry largely immune to macroeconomic challenges and the state of the domestic economy.
Major “bullish” arguments for the Healthcare sector that are becoming recognized by investors worldwide could warrant a significant premium on the sector down the road:
• An inflection in profitable growth upon macroeconomic stabilization;
• Disruptive technologies that shift the current treatment landscape and attract increasing investor and medical community interest to the sector;
• Products that enjoy premium pricing as well as protection from price cuts over its life cycle, particularly orphan drugs (Soliris marketed by Alexion Pharmaceuticals for Paroxysmal Nocturnal Hemoglobinuria is priced at $409.5K per annual therapy).
Where To Pick “Healthcare Nuggets” – Our Granular Approach We have developed a set of proprietary equally-weighted indices consisting of ASX listed companies that help us to gauge the returns of Healthcare sub-sectors split by commercial focus (medical devices and services, biotechnology & pharmaceuticals), and market capitalization (MCap). We identified companies in the Medical Devices & Services sector with MCap of $20M - $100M as the most appealing sub-sector, providing returns of approx. 30% and 8% YTD and 2QCY12 respectively. We attribute that to a combination of current or near-term positive cash flows, upcoming stock catalysts and attractive growth and effectiveness ratios. Our analysis identified Biotechnology and Pharmaceuticals companies with MCap below $20M as the worst performing sub-sector. We believe that these stocks are heavily discounted due to high uncertainties associated with their drug pipelines and thus future profitability. However, we also believe that careful fundamental analysis in that niche sector could identify true “home runs”.
We also tried to assess long term viability and relative strength of the sector going forward using various metrics and historical data points (i.e. trends in VC, PE, M&A and secondary deals), as well as data on changing landscape in global R&D licensing deals. Data is encouraging and we will continue to monitor and provide timely investor updates.
Anton Uvarov PhD Senior Analyst Guy Le Page Head of Research
This report is intended to provide an introduction to the Australian Healthcare sector. Our investment ideas and stock recommendations will be covered in separate publications.
RM Research Level 2, 6 Kings Park Road West Perth WA 6005 Ph: 08 9488 0800 Fax: 08 9488 0899 [email protected] www.rmresearch.com.au
INDUSTRY REPORT Australian Healthcare Sector -Performance and Investors’ Taste
5th September 2012
INDUSTRY REPORT

Page 2 – Copyright © 2012 RM Research - www.rmresearch.com.au
5 September 2012
Plain & Simple – Healthcare Outperforms Returns for the major stock indices were positive in the beginning of CY2012, but turned into negative territory in 2QCY12 on negative news flow from Europe, with Greece dominating the headlines in April and May. Importantly, Australian Healthcare was relatively immune to macro concerns and continued the positive trend returning 17% year-to-date (YTD). Recent inflection point in the market overall is largely attributed to Wall Street hopes for additional rescue stimulus (QE3).
Australian Healthcare ROE Improves Australian Healthcare sector drove improved returns on equity (ROE) throughout the previous three financial years (see Figure 2) primarily due to increased revenues and improved profit margins (see Table 1,2).
We also note that Australian Healthcare financial performance was superior to its overseas counterparts. While encouraging, it should be pointed out that performance of the Australian sector is largely driven by CSL’s results.
FIGURE 1: Australian Healthcare Sector Index (XHJ) outperformed other Sector Indices including Financials (XFJ), Industrials (XNJ), Materials (XMJ) as well as the market overall (XAO).
Source: RM Research
TABLE 1: Australian Healthcare recent performance.
Source: E&Y 2012, based on 61 companies
TABLE 2: Australian Healthcare recent performance relative to overseas Healthcare.
Source: E&Y 2012

Page 3 – Copyright © 2012 RM Research - www.rmresearch.com.au
5 September 2012
Figure 2 illustrates the defensive nature of the Healthcare sector: despite “macroeconomic hiccups” people still require medical aid to get over illness, particularly in globally aging population. We note that Healthcare ROE will continue to improve going forward based on analyst’s estimates.
Figure 2 excludes pure biotechnology stocks due to group’s immature profit margins. However, that mostly highlights a fundamental difference between biotechnology and the rest of the healthcare sector. Initial capital and R&D expenses are typically high and revenues (if any) are low until the pipeline matures. However, once commercialized, successful biotech drugs enjoy prolonged double-digit revenue growth, as long as they are protected by patents from generic competition (typically 10-15 years). Figure 3 highlights these differences, comparing historical and forecasted ROE for selected (> $0.1B in MCap) Biotechnology and ex-Biotechnology Healthcare stocks.
We designed a number of equally–weighted indices that allow us to track the performance of Healthcare sub-sectors split by commercial focus (medical devices and services vs. biotechnology & pharmaceuticals) and market capitalization. Large caps demonstrated a solid performance year to date as well as during the last quarter when most markets experienced negative returns courtesy of European headlines. Ex-majors showed a mixed performance last quarter with the index of mid-tier firms ($0.1B - $1B) dropping sharply mostly due to weaknesses in catalyst driven stories of Pharmaxis (ASX: PXS), Prima Biomed (ASX: PRR) and QRxPharma (ASX: QRX). We will be looking for value opportunities in that index.
FIGURE 2: Positive historical trends and forecasted growth in ROE – a defensive mark of Australian Healthcare.
Source: RM Research, Thomson ONE
FIGURE 3: Investing in Biotechnology equals investing in growth story and future product pipeline. Note the difference in ROE trends between traditional Healthcare and Biotechnology.
Source: RM Research, Thomson ONE
Page 4 – Copyright © 2012 RM Research – www.rmresearch.com.au
5 September 2012
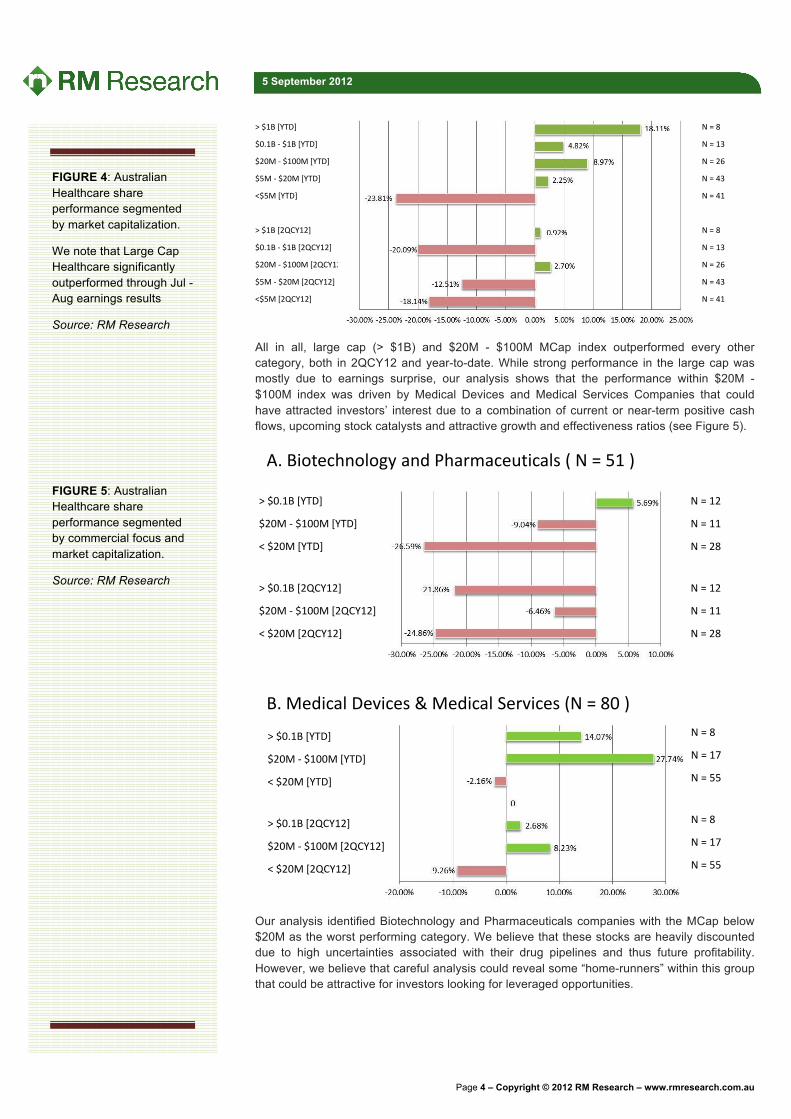
All in all, large cap (> $1B) and $20M - $100M MCap index outperformed every other category, both in 2QCY12 and year-to-date. While strong performance in the large cap was mostly due to earnings surprise, our analysis shows that the performance within $20M - $100M index was driven by Medical Devices and Medical Services Companies that could have attracted investors’ interest due to a combination of current or near-term positive cash flows, upcoming stock catalysts and attractive growth and effectiveness ratios (see Figure 5).
Our analysis identified Biotechnology and Pharmaceuticals companies with the MCap below $20M as the worst performing category. We believe that these stocks are heavily discounted due to high uncertainties associated with their drug pipelines and thus future profitability. However, we believe that careful analysis could reveal some “home-runners” within this group that could be attractive for investors looking for leveraged opportunities.
FIGURE 4: Australian Healthcare share performance segmented by market capitalization.
We note that Large Cap Healthcare significantly outperformed through Jul - Aug earnings results
Source: RM Research
FIGURE 5: Australian Healthcare share performance segmented by commercial focus and market capitalization.
Source: RM Research

Page 5 – Copyright © 2012 RM Research – www.rmresearch.com.au
5 September 2012
Importantly, investors should recognize various risks and uncertainties associated with investing in biotechnology companies and the relative risk levels of investing in biotech stocks at the different stage of pipeline development.
Risks that investors should consider:
• Clinical Risks – Figure 6 provides a simple diagram of the drug development process. Failure to achieve statistical significance on primary endpoints of the clinical study would mean that the Company either need to repeat the trial (capital intensive) or write off the drug candidate completely.
• Regulatory Risks – Upon completion of pre-clinical or clinical studies the company is required to submit data and protocols to a regulatory agency (i.e. FDA for Food and Drug Administration in US, EMA for European Medicines Agency in Europe). Upon agency approval, the company would be able to proceed with marketing or clinical studies. Alternatively (if rejected), the program would need to be re-evaluated or terminated.
• Commercial Risks – While biotech products enjoy premium pricing and exclusivity due to patent protection, market competition is usually stiff with few products marketed for the same indication. Reimbursement and pricing strategies for each particular company are often on investors’ radar and could affect the share price.
• Intellectual Property Risks - The patent position of biotechnology companies can be highly uncertain, and the company would normally face the risk in obtaining and defending its key product patents. Failure to protect its patents could negatively impact the stock price.
While the probability of success for each drug candidate should be estimated on an individual basis and requires scientific and clinical expertise, few academic groups have estimated probabilities and clinical approval success rates by source of the compounds that could be used by investors as a rule of thumb (see Figure 7).
According to a study from Tufts Medical School, the overall clinical approval success rate is substantially higher for the licensed-in drugs than for internally developed candidates (27% vs. 16%) due to potential screening process. All in all, the success rate for product candidates in Phase I, Phase II and Phase III are 19%, 27% and 60% respectively according to that study. These relative probabilities could be used as a discounting factor for future cash flow estimates for the drugs in development at respective clinical stage.
Discovery Late Clinical Development
Preclinical studies Clinical studies
CHEMISTRY/PHARMA-COLOGY
IND* PHASE I PHASE II PHASE III NDA** PHASE IV
Search for active
substances
Toxicology, efficacy
studies on various types
of animals
Regulatory review
Efficacy studies on
healthy volunteers
Clinical studies on a limited scale
Comparative studies on a
large number of patients
Regulatory review
Continued comparative
studies*InvestigationalNew Drug
Application for permission to
administer a new drug to humans
50–100persons
100–200patients
500–5,000patients
Registration, market
introduction
**New Drug Application
Application for permission to market
a new drug
KNOWLEDGE
LEVEL
KNOWLEDGE
LEVEL
2–4 yrs. 2–6 months 3–6 yrs. 1–3 yrs.
TIME SPAN
Early Clinical CommercializedFIGURE 6: “Under the Hood of Drug Development” – what investors need to know.
Source: RM Research
We recommend to avoid companies with immature pipelines (candidates are in pre-clinical or Phase I development only) due to a lot of uncertainties and significant clinical risks.

Page 6 – Copyright © 2012 RM Research – www.rmresearch.com.au
5 September 2012
For more sophisticated investors below we provide a table outling clinical success rates for each therapeutic class as clinical phases progress.
Australian Biotech – Segmentation By Theraputic Area And Stage of Clinical Development
FIGURE 7: Estimated success rates for transition from one phase of clinical development to another.
Source: DiMasi et.al., 2010 (Clinical Pharmacology & Therapeutics)
TABLE 3: Phase transition and clinical approval probabilities by therapeutic class for self-originated compounds.
Source: DiMasi et.al., 2010 (Clinical Pharmacology & Therapeutics)
FIGURE 8: Australian Biotech sector is represented in all of the major therapeutic areas; however we note a high percentage of companies in early stage of clinical development (54%). Companies with commercialized products not included.
Source: RM Research

Page 7 – Copyright © 2012 RM Research – www.rmresearch.com.au
5 September 2012
Australian Healthcare Sector Shows Strong Fundamentals When recommending Healthcare sector as a defensive play we tried to assess its long term viability and continued strength using various metrics and historical data points, such as transaction volumes and values in venture capital (VC), private equity (PE), mergers and acquisitions (M&A) and secondary deals.
Continues To Outperform in PE and Venture Backing
Our research showed that Australian Healthcare is particularly strong in private markets relative to other industries. That is indicative of an increasing interest from sophisticated investors and is also suggestive of future demand for the public markets for healthcare companies as funds will be looking for exit strategy.
Healthcare was among a few industries that saw an increase in PE investment throughout the last three years (Figure 9).
In addition, data indicates that EV/EBITDA multiples (new PE transactions) for Healthcare sector remained consistent throughout the last six years and were among the highest in the markets reaffirming the defensive nature of the sector (Figure 10).
FIGURE 9: PE transaction value by industry sector, FY09 - FY11 (A$B)
Source: AVCAL, 2012
FIGURE 10: Average EV/EBITDA by industry sector, FY06 - FY11 reaffirms our view of Healthcare as a good defensive play.
Source: AVCAL, 2012

Page 8 – Copyright © 2012 RM Research – www.rmresearch.com.au
5 September 2012
Venture capital backing of Healthcare and Life Science companies also showed strong fundamentals as it continues to lead the top VC investment sectors in FY11 while venture investments being lower year-over-year in most of the other industries. From a longer term perspective, Healthcare sector accounted for 49% ($436M) of the total value of VC investments from FY06 to FY11. That is another positive indication towards the growth of publicly traded Healthcare stocks and an increasing number of investment opportunities.
Increasing Realtive Strength in M&A And Placements
The IPO market remained largely closed to Healthcare and Life Sciences companies with only 7 listings in Biotech and 6 listings in Medical Devices since FY2008 (Source: PwC 2012). However, Australian Healthcare showed a great improvement in the value and volume of M&A and private placements. In FY2011 the value of M&A and private placements in Healthcare sector grew to A$6.7B (4.5% of total) from A$1.8B in FY2010 (2.1% of total). While we don’t yet have data for FY2012, we believe the trend will continue driven largely by increasing interest in Australian Healthcare from overseas investors and companies.
Global R&D Licensing Deals Above 10 Year Average In 2QCY12 global licensing deals generated $545M, which is above the 10 year average of $390M. 64 transactions were announced of which 25 disclosed an average deal size of $95.4M. We also point out that the average deal size is increasing year-on-year (Figure 13 indicates reduced number of deals with increase in total upfront payments). That reads positive for Australian companies that have promising candidates in Phase II or Phase III trials.
FIGURE 11: VC investment by industry, FY06 – FY11 (A$M) – metrics continue to point to relative sector strength.
Source: AVCAL, 2012
FIGURE 12: Value of total M&As and private placements in Australian Healthcare grew in relative and absolute terms in FY2011.
Source: AVCAL, 2012

Page 9 – Copyright © 2012 RM Research – www.rmresearch.com.au
5 September 2012
Conclusions Our research identified small cap stocks in the Medical Devices sector ($20M - $100M in MCap) as the most attractive investment opportunity. Below we provide a list of companies operating in the Medical Devices & Services space that had a Market Cap of $20M - $100M during the last 52 weeks (i.e. this group includes more companies than our index in Figure 5).
While large cap healthcare stocks represent a great defensive play providing positive returns at the time when other sectors are struggling, we believe that the Risk/Return on the small cap Medical Devices sector is very appealing and could provide higher upside and more diversification (n=21 vs. n=8) reducing individual company risks. In our view, this group will continue to outperform due to a combination of current or near-term positive cash flows, upcoming stock catalysts and attractive growth and effectiveness ratios.
While small cap biotech stocks proved to be a risky asset class (Figure 5) during CY2012, we believe that investors should not write off that segment as a whole. With more and more large pharmaceutical companies relying on acquisitions rather than on internal pipeline development and cash/license deal ratio constantly growing, small cap Biotech sector could provide above average returns due to positive late clinical stage trial results, potential acquisition premiums, potential licensing deals, future catalyst abundance and historically low valuations. However, we recommend investors to avoid companies with immature pipelines
FIGURE 13: Global R&D licensing deals are above 10 year average with cash per deal ratio constantly growing.
FIGURE 14: ASX Medical Devices & Services Performance $20M - $100M Market Cap.
Note that in most cases, companies with positive EPS significantly outperformed.
Source: Thomson One, RM Research
Market Data as of August 27, 2012

Page 10 – Copyright © 2012 RM Research – www.rmresearch.com.au
5 September 2012
(candidates are in pre-clinical or Phase I development only) without careful analysis due to various uncertainties and significant clinical risks.
Major “bullish” arguments for investment in Healthcare sector that are becoming increasingly recognized by investors worldwide should warrant a significant premium on that sector down the road:
• An inflection in profitable growth upon macroeconomic stabilization; • Disruptive technologies that shift the current treatment landscape and attract ongoing
investor and medical community interest to the sector; • Products that enjoy premium pricing as well as protection from price cuts over its life
cycle, particularly orphan drugs (Soliris marketed by Alexion for Paroxysmal Nocturnal Hemoglobinuria is priced at $409.5K per annual therapy).
• Improved sector environment – encouraging developments in the US legislature to improve the regulatory process. Food and Drug Administration Safety and Innovation Act recently signed by Obama contains amendments to the Prescription Drug User Fee Acts concerning communication with the sponsors, patient advocacy, etc. The bill should allow new therapies that are already available in EU and APAC (including Australia) to significantly improve their time-to-market in US which remains the largest healthcare market.
• Various metrics and historical data points, such as transaction volumes and values in VC, PE, M&A and secondary deals point to a continued strength in Australian Healthcare.
• Shift in market sentiment as risk capital rotates to resources sector.
In line with our thinking, a recent National Investor Sentiment Survey conducted by Wholesale Investor Pty Ltd showed that for the first time in 2 years Cleantech (46%) and Healthcare (43%) Sectors now lead the Mining Sector (39%).
FIGURE 15: Results of National Investor Sentiment Survey. Note that investors could select more than one option.
Page 11 – Copyright © 2012 RM Research - www.rmresearch.com.au
5 September 2012
Registered Offices
Perth Level 2, 6 Kings Park Rd West Perth WA 6005 Phone: +61 8 9488 0800 Fax: +61 8 9488 0899
PO Box 154 West Perth WA 6872
Email / Website [email protected] www.rmresearch.com.au
RM Research Recommendation Categories Care has been taken to define the level of risk to return associated with a particular company. Our recommendation ranking system is as follows:
Buy Companies with ‘Buy’ recommendations have been cash flow positive for some time and have a moderate to low risk profile. We expect these to outperform the broader market.
Speculative Buy We forecast strong earnings growth or value creation that may achieve a return well above that of the broader market. These companies also carry a higher than normal level of risk.
Hold A sound well managed company that may achieve market performance or less, perhaps due to an overvalued share price, broader sector issues, or internal challenges.
Sell Risk is high and upside low or very difficult to determine. We expect a strong underperformance relative to the market and see better opportunities elsewhere.
Disclaimer / Disclosure This report was produced by RM Research Pty Ltd, which is a Corporate Authorised Representative of RM Capital Pty Ltd (Licence no. 221938). RM Research Pty Ltd has made every effort to ensure that the information and material contained in this report is accurate and correct and has been obtained from reliable sources. However, no representation is made about the accuracy or completeness of the information and material and it should not be relied upon as a substitute for the exercise of independent judgement. Except to the extent required by law, RM Research Pty Ltd does not accept any liability, including negligence, for any loss or damage arising from the use of, or reliance on, the material contained in this report. This report is for information purposes only and is not intended as an offer or solicitation with respect to the sale or purchase of any securities. The securities recommended by RM Research carry no guarantee with respect to return of capital or the market value of those securities. There are general risks associated with any investment in securities. Investors should be aware that these risks might result in loss of income and capital invested. Neither RM Research nor any of its associates guarantees the repayment of capital. WARNING: This report is intended to provide general financial product advice only. It has been prepared without having regarded to or taking into account any particular investor’s objectives, financial situation and/or needs. Accordingly, no recipients should rely on any recommendation (whether express or implied) contained in this document without obtaining specific advice from their advisers. All investors should therefore consider the appropriateness of the advice, in light of their own objectives, financial situation and/or needs, before acting on the advice. Where applicable, investors should obtain a copy of and consider the product disclosure statement for that product (if any) before making any decision. DISCLOSURE: RM Research Pty Ltd and/or its directors, associates, employees or representatives may not effect a transaction upon its or their own account in the investments referred to in this report or any related investment until the expiry of 24 hours after the report has been published.