Embed Size (px)
Citation preview

rKOMICS: an R package for processing mitochondrial minicircle assemblies in population‑scale genome projectsManon Geerts1, Achim Schnaufer2 and Frederik Van den Broeck1,3*
Abstract
Background: The advent of population-scale genome projects has revolutionized our biological understanding of parasitic protozoa. However, while hundreds to thousands of nuclear genomes of parasitic protozoa have been generated and analyzed, infor-mation about the diversity, structure and evolution of their mitochondrial genomes remains fragmentary, mainly because of their extraordinary complexity. Indeed, unicellular flagellates of the order Kinetoplastida contain structurally the most complex mitochondrial genome of all eukaryotes, organized as a giant network of homogene-ous maxicircles and heterogeneous minicircles. We recently developed KOMICS, an analysis toolkit that automates the assembly and circularization of the mitochondrial genomes of Kinetoplastid parasites. While this tool overcomes the limitation of extract-ing mitochondrial assemblies from Next-Generation Sequencing datasets, interpreting and visualizing the genetic (dis)similarity within and between samples remains a time-consuming process.
Results: Here, we present a new analysis toolkit—rKOMICS—to streamline the analy-ses of minicircle sequence diversity in population-scale genome projects. rKOMICS is a user-friendly R package that has simple installation requirements and that is applicable to all 27 trypanosomatid genera. Once minicircle sequence alignments are generated, rKOMICS allows to examine, summarize and visualize minicircle sequence diversity within and between samples through the analyses of minicircle sequence clusters. We showcase the functionalities of the (r)KOMICS tool suite using a whole-genome sequencing dataset from a recently published study on the history of diversification of the Leishmania braziliensis species complex in Peru. Analyses of population diversity and structure highlighted differences in minicircle sequence richness and composition between Leishmania subspecies, and between subpopulations within subspecies.
Conclusion: The rKOMICS package establishes a critical framework to manipulate, explore and extract biologically relevant information from mitochondrial minicircle assemblies in tens to hundreds of samples simultaneously and efficiently. This should facilitate research that aims to develop new molecular markers for identifying species-specific minicircles, or to study the ancestry of parasites for complementary insights into their evolutionary history.
Keywords: Assembly, Clustering, Minicircles, Sequencing, Kinetoplast, Leishmania, Trypanosoma, Parasites
Open Access
© The Author(s) 2021. Open Access This article is licensed under a Creative Commons Attribution 4.0 International License, which permits use, sharing, adaptation, distribution and reproduction in any medium or format, as long as you give appropriate credit to the original author(s) and the source, provide a link to the Creative Commons licence, and indicate if changes were made. The images or other third party material in this article are included in the article’s Creative Commons licence, unless indicated otherwise in a credit line to the mate-rial. If material is not included in the article’s Creative Commons licence and your intended use is not permitted by statutory regulation or exceeds the permitted use, you will need to obtain permission directly from the copyright holder. To view a copy of this licence, visit http://creativecommons.org/licenses/by/4.0/. The Creative Commons Public Domain Dedication waiver (http://creativecommons.org/publicdo-main/zero/1.0/) applies to the data made available in this article, unless otherwise stated in a credit line to the data.
SOFTWARE
Geerts et al. BMC Bioinformatics (2021) 22:468 https://doi.org/10.1186/s12859‑021‑04384‑1
*Correspondence: [email protected] 1 Department of Biomedical Sciences, Institute of Tropical Medicine, 2000 Antwerp, BelgiumFull list of author information is available at the end of the article
Page 2 of 14Geerts et al. BMC Bioinformatics (2021) 22:468
BackgroundPopulation-scale sequencing projects resort to short-read sequencers such as Illumina’s HiSeq or BGI’s BGISEQ instruments because they are cost-effective, accurate and sup-ported by a wide range of analysis tools and pipelines [1]. Sequence data in fastq format is typically aligned to a nuclear reference assembly using tools such as BWA [2] or bow-tie2 [3] that store alignment details in Sequence Alignment/MAP (SAM) text formats (or its binary equivalent BAM). The aligned sequenced data are then used to call genome-wide variants with e.g. the Genome Analysis Toolkit (GATK) [4] or to detect structural variations [5]. In addition to nuclear sequences, next-generation sequencing platforms produce a high copy number of extranuclear sequences (originating from mitochondria or chloroplasts) when DNA is extracted from whole cells. Such extranuclear sequences can be de novo assembled using tools such as MITObim [6] or NOVOPlasty [7]. This means that both nuclear and extranuclear sequence diversity could be studied during a single next-generation sequencing experiment.
Kinetoplastids are early branching eukaryotes of biomedical and economical relevance with many genera infectious to humans or animals (e.g. Leishmania and Trypanosoma), plants (e.g. Phytomonas) and insects (e.g. Crithidia). The advent of whole genome sequencing has revolutionized our biological understanding of these parasitic protozoa. Continuous generation and refinement of reference genome assemblies and annotations [8, 9] provided an important resource for both experimental [10] and natural diversity studies [11–13]. Most notably, population-scale genome studies provided genomic evi-dence of meiotic-like recombination in presumed clonal pathogens [14–18], revealed the evolutionary and epidemic history of a lethal human pathogen [19, 20] or have set the scene for a new understanding of the evolution and genetics of protozoan parasites [21]. However, while hundreds to thousands of nuclear genomes of parasitic protozoa have been generated and analyzed, information about the diversity, structure and evolution of their mitochondrial genome remains fragmentary.
The mitochondrial genome of unicellular flagellates of the order Kinetoplastida is unique due to its extraordinary complexity and structure compared to the mitochon-drial genome of other eukaryotes. It contains a giant network of hundreds to thou-sands of heterogeneous minicircles (0.5–2.5 kb) interlaced with 20–50 homogeneous maxicircles (20–30 kb), with a topology resembling that of a medieval chain mail [22]. The maxicircles contain four genes (9S rRNA, 12S rRNA, RPS12 and RPS3) that encode rRNA and protein subunits of the mitochondrial ribosome and sixteen genes (ND1, 3, 4, 5, 7, 8 & 9, COI, II & III, Cyb, ATPase6, MURF1 & 2, CR3 & 4) encoding different protein subunits of the respiratory chain and F1FO ATP synthase. However, many of the protein-coding maxicircle genes are encrypted (i.e. are cryptogenes) and give rise to pre-mRNAs that require post-transcriptional modification via an elabo-rate RNA editing process that generates translatable mRNAs. Over 1,200 guide RNAs (gRNAs) are predicted to be responsible for directing this editing process in T. b. bru-cei [23, 24], and the vast majority of these gRNAs are encoded within the minicir-cles [22]. Minicircles generally consist of a ~ 100 bp conserved sequence region that contains hyper conserved sequences named Conserved Sequence Blocks (CSBs), and a variable region including gRNAs that are flanked by inverted repeats. Trypanoso-matids only encode 1–5 different gRNAs per minicircle, which explains the extreme

Page 3 of 14Geerts et al. BMC Bioinformatics (2021) 22:468
heterogeneity of these molecules in the kinetoplast genome. This RNA editing pro-cess represents one of the most striking examples of small RNA regulation of gene expression in eukaryotic cells.
The complex structure of the mitochondrial genome of Kinetoplastids requires a dedi-cated approach to recuperate a full complement of maxicircles and minicircles from next-generation sequencing datasets. The coding region of the maxicircles displays a highly conserved gene organization with a gene content similar to the mitochondrial genome of other eukaryotes, including yeast and mammals, with the notable exception of the complete absence of tRNA genes. Hence, bioinformatic and downstream phylo-genetic analyses of the mitochondrial maxicircle resemble those used for analyzing the mitochondrial genome in higher eukaryotes. Reference maxicircle sequences can be assembled using either short- or long-read sequencing datasets (see [16] for an exam-ple on how to sequence, assemble and annotate a complete reference maxicircle genome using paired-end 250-bp Illumina reads). Once a reference maxicircle sequence is avail-able from the species of interest (or from a closely related organism), it can be used in population-scale genome studies for reference-guided assembly (e.g. [25]) or genotyping (e.g. [16]). This approach has been used widely to recover the maxicircles from whole genome sequencing datasets of various protozoan parasites [14, 16, 20, 21].
In contrast to maxicircles, reference-guided assembly or genotyping is not feasible for the minicircles as each individual strain displays an almost unique set of minicir-cle sequences that occur in variable copy numbers [21, 26]. Hence, minicircles are to be assembled for each parasite sample independently and clustered into Minicircle Sequence Classes (MSCs), here defined as groups of minicircle sequences sharing a given percent identity [21, 24]. Long-read sequencing technologies such as Oxford Nanopore or PacBio should greatly facilitate the assembly process of the highly heterogeneous minicircle populations. These third-generation sequencers are a valid choice when deal-ing with one or a few samples, as done by [26] for two Leishmania tarentolae isolates, but they are not the preferred sequencing technology within the context of a genome diversity study that deals with tens to hundreds of protozoan parasites. Other studies have assembled minicircle sequences from short-read DNA/RNA sequencing in Lep-tomonas pyrrhocoris using a custom seed-extension assembly algorithm [27, 28], or in Trypanosoma brucei [24] using the Velvet assembly algorithm [29]. Because fully assem-bled contigs from circular molecules have duplicated ends, Cooper and colleagues used the CAP3 assembler to search for overlapping ends in contigs that were sliced in two halves [24], also known as the ’circularity test’ [30]. Following a similar approach as [24], we recently developed the program KOMICS (which stands for kinetoplast genomics), a python3.7 package that automates the assembly and circularization of mitochondrial minicircles from short-read whole genome sequencing datasets [21]. Assembly is done with MEGAHIT [31] and circularization through a BLAST approach [32] that identi-fies a sequence in common at the start and the end of a given minicircle contig. Once appropriate assembly parameters are chosen, KOMICS allows the automated recovery of (nearly) complete minicircle genomes for tens to hundreds of samples at a time [21].
While KOMICS overcomes the limitation of acquiring mitochondrial minicircle assemblies, interpreting and visualizing the genetic (dis)similarities of the minicircle sequences within and between (groups of ) samples remains a challenging process.

Page 4 of 14Geerts et al. BMC Bioinformatics (2021) 22:468
Here, we present a new tool named rKOMICS, an R package that allows swift explo-ration of clusters of minicircle sequences within a set of samples. Our aim is to pro-vide a dedicated bioinformatic tool that streamlines the analyses, visualization and interpretation of minicircle sequence diversity in population-scale genome projects.
Material and methodsImplementation
The core features of the rKOMICS package include data aggregation, analyses and visualization that allows to examine, summarize and extract meaningful information from minicircle sequence alignments as provided by KOMICS [21] or a custom bio-informatic pipeline, and from USEARCH cluster format (UC) files as generated by USEARCH [33] or VSEARCH [34]. In addition to storing data files, rKOMICS stores the analyses and visualization results into single list objects that can be called by the user at a later stage. All functions are listed in Table 1, and below we provide a brief description of the main functionalities.
Polished minicircle assemblies as obtained with KOMICS or a custom bioinfor-matic pipeline can be processed with rKOMICS to inspect sequence length distri-butions, and to extract minicircle sequences that are successfully circularized and of the expected length (usually ~ 700–900 bp for Leishmania [26] and ~ 1000–2000 bp for Trypanosoma parasites [24]). Once processed, the minicircle sequences from one or more samples are clustered into Minicircle Sequence Classes (MSCs) based on a minimum percent identity (MPI) using USEARCH’s or VSEARCH’s cluster-fast (see below for a typical usage workflow).
The function msc.uc reads the output of the clustering analyses (UC file) for each specified MPI into a single list, which will be analyzed automatically to calculate and visualize—per MPI—the number of MSCs, the proportion of perfect alignments (i.e.
Table 1 Summary of commands available in latest development version of rKOMICS
Command Description
Preprocess Filters a FASTA file based on minicircle sequence length (specified by a minimum and maximum numeric value) and circularization success (Boolean argument)
msc.length Calculates and visualizes the length of minicircle sequences
read.uc Reads and stores USEARCH cluster format (UC) files
msc.uc Processes clustering results by estimating the number of MSCs and alignment insertions/dele-tions per minimum percent identity
msc.matrix Stores clustering results in a matrix where MSCs (rows) are classified as present (1) or absent (0) in each sample (columns)
msc.heatmap Creates a heatmap that summarizes the presence/absence of MSCs per sample and per group
msc.richness Summarizes and visualizes the number of MSCs per sample
msc.similarity Estimates the number and proportion of shared and unique MSCs between groups of samples
msc.subset Extracts specific MSCs for a given group of samples
msc.pca Principal Component Analysis to summarize MSC variation for all or a given set of samples
msc.seqs Retrieves the DNA sequence of a MSC together with all its hit sequences
msc.quality Checks the quality of the assembly
msc.depth Calculates the read depth and copy number of the assembled minicircles

Page 5 of 14Geerts et al. BMC Bioinformatics (2021) 22:468
alignments without any insertion/deletion, but allowing point mutations) and the num-ber of alignment gaps. Gaps are defined by i) the number of insertions/deletions and ii) the length in base pairs of each individual insertion/deletion. It also issues a warn-ing when large gaps (> 500 bp) are found, which points the user to anomalous align-ments due to e.g. artificial dimers introduced by the assembly process. This allows the user to make an informed decision about the MPI (or MPI’s) that best captures minicir-cle sequence richness within a (group of ) sample(s) while minimizing the number and length of alignment gaps. The function msc.matrix reads the output of the clustering analyses (UC file) for each specified MPI and stores it in a matrix where MSCs (rows) are classified as present (1) or absent (0) in each sample (columns). This matrix is used for downstream analyses and visualizations, without relying on the user for data manipula-tion and reformatting.
We introduce several functions that allow measuring the variation of MSCs within a parasite sample and between parasite samples. The function msc.richness returns a measure of minicircle richness per sample, which is simply estimated as the number of MSCs per sample. The function returns a table of estimates per sample and per MPI, as well as a boxplot that shows the minicircle richness in each sample as estimated over a range of MPIs. The function msc.similarity returns a measure of minicircle sequence composition within and between groups of samples. Specifically, it estimates the abso-lute and relative number of MSCs that are unique to each group or shared between two or more groups. The function returns tables and barplots that summarize the number of unique or shared MSCs for each MPI separately or combined over all MPIs.
rKOMICS incorporates multiple methods of visualizations using the ggplot2 R pack-age [35] to plot the foundation of graphs. By adding ggplot2 functions to the rKOM-ICS visualization functions, the user has direct control over the finishing touches of the graph’s appearances. Our package also utilizes sample-specific metadata that allows multi-group data visualizations to facilitate exploratory analysis. The overall data set can be examined using barplots, heatmaps, PCA plots and box plots that are generated for each specified MPI. This makes it possible to visualize population structure and diversity based on minicircle sequence composition.
A step‑by‑step tutorial on how to use the (r)KOMICS tool suite
Population-scale genome diversity projects start by extracting DNA from whole cells before generating paired-end whole genome sequencing data that is aligned against a nuclear reference assembly. The aligned sequence data aids genome-wide variant discov-ery and the detection of structural variations that can be used in downstream population genomic analyses (this will not be discussed here, but see [14–21] for examples). Reads that did not align against the reference genome are putative extranuclear sequences and should be extracted from the alignment file. When a reference maxicircle sequence of the same or a closely related species is available, unaligned reads are mapped against the maxicircle sequence to assist reference-guided assembly or genotyping of the conserved coding region (see [14, 16, 20, 21] for examples).
To obtain de novo assemblies of minicircle and maxicircle sequences per sample, we propose to use the KOMICS software package [21] (https:// frebio. github. io/ komics/). The input of KOMICS is sequence reads in FASTQ format, and the output is maxicircle

Page 6 of 14Geerts et al. BMC Bioinformatics (2021) 22:468
and circularized minicircles in FASTA format. Before the assembly process is started, it is recommended to trim reads for high quality and to a maximum length of 150 bp (this is because sequencing quality may decrease with increasing number of cycles). Using the paired-end high-quality trimmed reads, the KOMICS assemble command will do the following three major steps:
1. Assemble contigs based on user-specified k-mer lengths with MEGAHIT [31]. The optimal k-mer length depends on the complexity of the mitochondrial genome, and it will also be different for maxicircles and minicircles. We recommend that the user tries different k-mer values in order to—independently—maximize the length of the assembled maxicircle contig and the proportion of circularized minicircle sequences.
2. Extract putative maxicircle sequences using a BLAST [32] approach with several build-in maxicircle sequences of Leishmania braziliensis M2904 [21] (available on www. tritr ypdb. org), Trypanosoma lewisi [36] (GenBank: KR072974.1), Trypanosoma brucei brucei (GenBank: M94286.1) and Trypanosoma equiperdum STIB842 [37] (GenBank: EU185800.1) as subjects. Identified maxicircle sequences may be further extended using NOVOPlasty [7], circularized using a BLAST approach and anno-tated using a homology-based search of known maxicircle genes with RATT [38] (see [16] for a detailed example on how to assemble a complete maxicircle sequence using deep-sequencing data of 250 bp paired-end reads). However, depending on sequencing depth and the complexity of the divergent (variable) region of the max-icircle, assembly of a complete maxicircle may prove challenging.
3. Extract minicircle contigs based on the presence of the Conserved Sequence Block 3 (CSB3), a 12-bp minicircle motif that is also known as the universal minicircle sequence and that is highly conserved across all Kinetoplastida species [39]. KOM-ICS uses the known CSB3 motifs GGG GTT GGT GTA [39] and GGG GTT GAT GTA (identified in a subset of minicircles from T. b. brucei [24]), and their reverse comple-ments. Note that other less conserved CSB3 motifs can be specified by the user to accommodate the species model being investigated; users should always check for potential alternative CSB3 motifs in the original contigs file using e.g. the MEME Suite [40]. Note that this step will only work for minicircle structures with a single conserved region per minicircle.
Following the assembly and identification of linear mitochondrial minicircle contigs, KOMICS circularize uses BLAST as a strategy to identify a sequence that is in com-mon at the start and the end of a given minicircle contig. Whenever an overlap is found, the contig is classified as circular and the duplicated sequence at the start of the contig is removed. Note that the performance of the circularization procedure has not been tested on dimeric or multimeric minicircles. Finally, KOMICS polish will (1) reori-ent each minicircle contig until the CSB3 motifs have the correct direction (GGG GTT G[G/A]TGTA), (2) create a minicircle alignment by rearranging sequences such that the Conserved Sequence Block 1 (CSB1) (GGG CGT [T/G]C) is at the start of each circular-ized minicircle contig and (3) cluster contigs based on a minimum percent identity using VSEARCH [34]. Note that other less conserved CSB1 and CSB3 motifs can be specified by the user to accommodate the species model being investigated.

Page 7 of 14Geerts et al. BMC Bioinformatics (2021) 22:468
Following the successful generation of minicircle sequence alignments with KOMICS, the user is recommended to check the quality of the assembly (Fig. 1, step 6). To this end, the original unaligned reads should be mapped against the minicircle sequence assembly using e.g. BWA [2] or bowtie2 [3] and several mapping statistics should be calculated. One useful metric is the proportion of perfect alignments of CSB3-containing reads, which serves as a proxy for the total number of minicircles that were initially present within the DNA sample. We suggest extending the circularized minicircle sequences by 150 bp to avoid clipped reads at either end of the minicircle. To streamline this process, we provide two scripts as part of the KOMICS suite (https:// github. com/ FreBio/ komics/ raw/ master/ komics/ fasta_ extend. py and https:// github. com/ FreBio/ komics/ raw/ master/ komics/ mappi ng_ stats. sh) that will parse SAM files and output the following statistics: number of reads, number of mapped reads, number of properly paired reads, num-ber of reads with mapping quality ≥ 20, number of CSB3-containing reads, number of mapped CSB3-containing reads and number of perfectly aligned CSB3-containing reads (i.e. alignments without any insertion/deletion). In addition, it will provide a results table that gives a detailed overview of the depth statistics per minicircle sequence. These output files can be processed using the rKOMICS scripts msc.quality and msc.depth to obtain plots and estimates of minicircle copy numbers.
Finally, we propose to use rKOMICS to measure and visualize minicircle sequence diversity in one or more samples. KOMICS will generate assemblies for each sample independently, which can be processed using the rKOMICS command preprocess to
Fig. 1 Schematic representation of a typical (r)KOMICS usage workflow. Steps 1–4 are shown in gray and are required bioinformatic analyses prior to the use of rKOMICS. Note that rKOMICS requires minicircle sequence assemblies (step 4) that are either obtained by KOMICS (https:// frebio. github. io/ komics/) or through a custom bioinformatic pipeline. Steps 5–9 describe the input files required and the results obtained by the rKOMICS software package. Functions implemented in rKOMICS are coloured in blue, while scripts implemented in KOMICS are coloured in green
Page 8 of 14Geerts et al. BMC Bioinformatics (2021) 22:468
retain only sequences of the expected length and—desirably—only sequences that are fully circularized (Fig. 1, step 5). Sequences of all samples of interest should be concat-enated into a single FASTA file and used for finding MSCs based on a minimum percent identity with VSEARCH using the default parameters (Fig. 1, step 7). rKOMICS then allows the user to read and store the clustering files, as well as to process the files in order to measure and visualize the variation of MSCs within and between parasite sam-ples (Fig. 1, step 8–9) (Table 1).
(r)KOMICS application example
To show the functionality of rKOMICS, we performed an example analysis using whole-genome sequencing data from a recently published study on the history of diversifica-tion of the Leishmania braziliensis species complex in Peru [21]. This species complex comprises two closely related species: the lowland and zoonotic L. braziliensis parasite circulating in a diverse range of wild mammals in Neotropical rainforests, and the high-land anthroponotic L. peruviana parasite that is largely endemic to the Pacific slopes of the Peruvian Andes.
A total of 67 Leishmania parasites from 47 localities in Peru were cultured and sub-jected to whole genome sequencing. Sequence data were aligned against a PacBio assembly containing the 35 major chromosomes and a complete circularized maxicircle sequence of 27.69 kb. Using GATK’s HaplotypeCaller, the authors called Single Nucleo-tide Polymorphisms (SNPs) within the major chromosomes and the coding region of the maxicircle. For a full appreciation of the population genomic and phylogenomic analyses using SNPs identified within the nuclear genome and the mitochondrial maxicircle, we direct the reader to the publication by Van den Broeck and colleagues [21].
We extracted the unaligned sequence reads from the BAM files with SAMtools view [41] and converted the BAM file into a FASTQ file using GATK’s SamToFastq [4]. Sequence reads were then trimmed with FASTP [42] using the following parameters: -q 30 -u 10 -5 -3 -W 1 -M 30–cut_right–cut_right_window_size 10 –cut_right_mean_qual-ity 30 -l 95 -b 150. Trimmed reads were used for de novo assembly with KOMICS using a k-mer sweep strategy with k-mer values of 89, 99, 109 and 119. Minicircle contigs were then circularized and polished with KOMICS using the default parameters (see step-by-step tutorial above for details). Sequence reads were aligned to the filtered set of minicir-cle sequences (both circularized and non-circularized contigs) using SMALT (https:// www. sanger. ac. uk/ tool/ smalt-0/) with a minimum identity threshold of 95%, and pro-cessed with the rKOMICS command msc.quality to check the quality of the assembly. After inspection of minicircle sequence lengths with the msc.length function, individ-ual fasta files were filtered using the preprocess function based on a minimum length of 500 bp, a maximum length of 1200 bp and with the circularization parameter set to true. The filtered FASTA files containing circularized minicircles per sample were combined into a single file. VSEARCH –cluster_fasta was used to identify clusters of minicircle sequences based on a minimum percent identity of 80, 85, 88–100. Clustering results were then processed, transformed, visualized and summarized with the msc.uc, msc.matrix, msc.heatmap and msc.richness functions, respectively, after which we analyzed MSC diversity between samples with the msc.pca and msc.similarity functions.
Page 9 of 14Geerts et al. BMC Bioinformatics (2021) 22:468
ResultsWe provide a simplified overview of a straightforward analysis of minicircle sequence diversity, while in-depth analyses are provided in the rKOMICS vignette document. Most (but not all) of the results described below were also presented in [21], but we have here re-analyzed the data to showcase the functionality of rKOMICS.
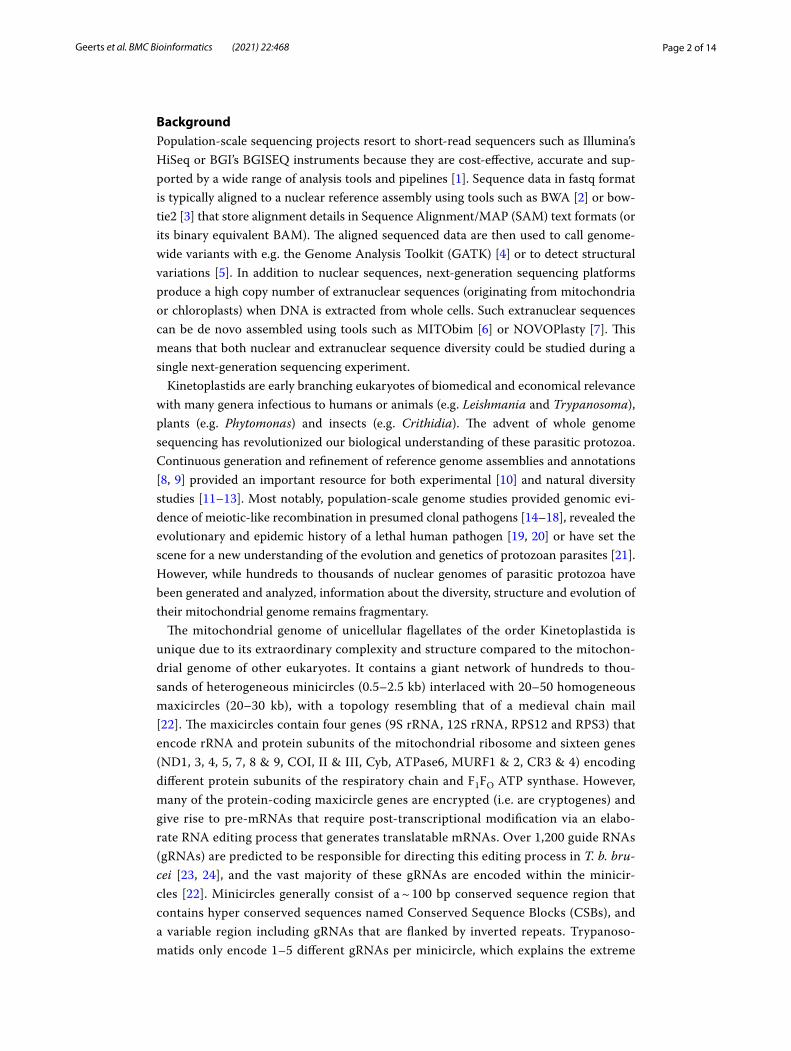
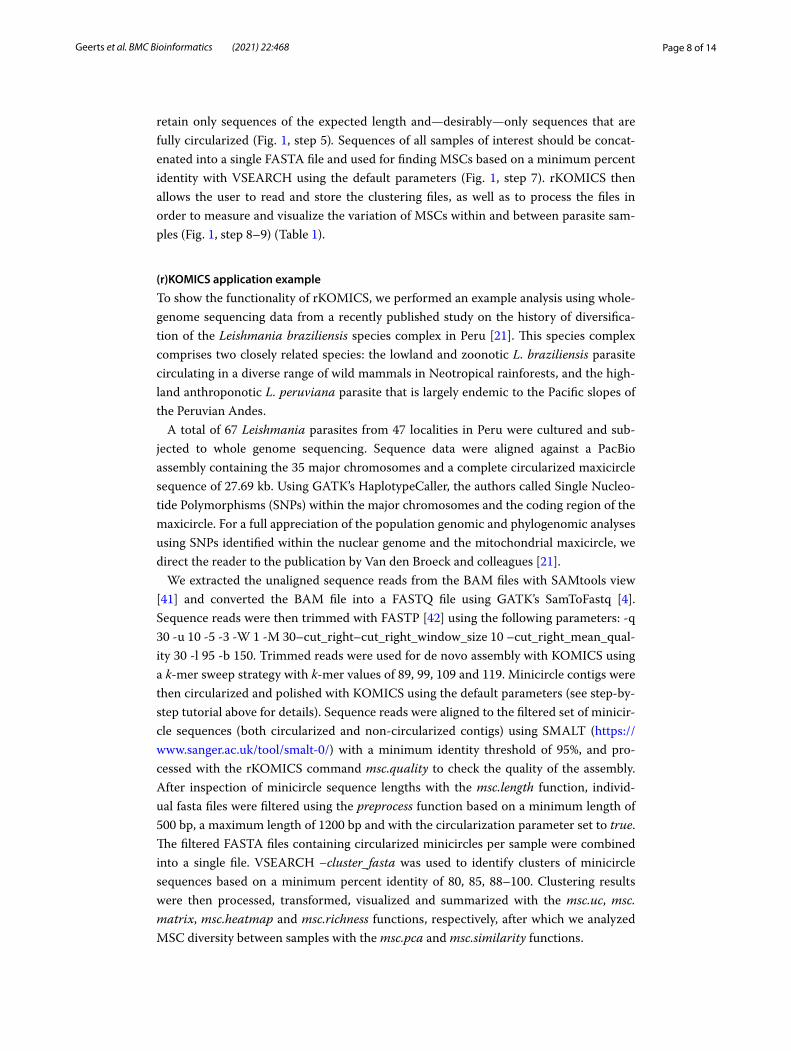
A combined total of 7760 minicircles were assembled for 67 Leishmania isolates. When examining the length distribution of the circularized minicircle sequences using the function msc.length, we found that the majority of minicircles (95.2%) were 720–760 bp long, which is within the expected length range of minicircles in Leishmania par-asites (Fig. 2a). 294 minicircle contigs (4.8%) showed twice this length (1400–1700 bp) (Fig. 2a), which may suggest that these are artificial minicircle dimers introduced by the assembly process, and were subsequently removed. For downstream analyses, we only retained the circularized minicircles of the expected length (720–760 bp) using the func-tion preprocess (Fig. 2b; coloured barplots), resulting in a final set of 5849 minicircles. When examining the quality of the assembly by alignment of reads to the assembled minicircles using the function msc.quality, we found that on average 77% of all mapped reads aligned with a mapping quality larger than 20 and on average 84% aligned in proper pairs. On average 93% of all CSB3-containing reads aligned against the assem-bled minicircle contigs and 88.5% aligned perfectly, suggesting that KOMICS was able to retrieve a large proportion of the minicircle classes.
hybrid L. braziliensis L. peruviana
HR41
0A1
HR43
4A1
HR80
A1LC
1407
A1LC
1408
A1LC
1418
A1LC
1419
A1LC
2435
A1LC
2520
A1LC
2851
A1LC
2877
A1LH
1099
A1PE
R01
1A1
CUM29
A1LC
1409
A1LC
1412
A1LC
1565
A1LC
2421
A1LC
2452
A1LC
2551
A1LC
2873
A1LH
825B
2PE
R00
2A1
PER00
5A1
PER01
0A1
PER01
2A1
PER01
4A1
PER01
6A1
PER06
5A1
PER06
9A1
PER08
6A1
PER09
4A1
PER20
1A1
PER21
5A1
PER26
0A1
RO39
3A1
D8A
1HB2
2A1
HB3
1A1
HB4
4A1
HB5
5A1
HB5
6A1
HB6
7A1
HB8
3A1
HB8
6A1
HR78
A1La
36A1
LC10
15A1
LC10
6cl6A1
LC24
34A1
LC26
cl6A
1LC
272A
1LC
436A
1LC
443A
1LC
468A
1LC
900A
1LC
A04A
1LC
A08A
1LC
A09A
1LH
2161
A1LH
2355
A1LH
2439
A1LH
249A
1LH
696A
1LH
741A
1LH
827A
1LH
925A
1
0
100
200
300
Nu
mb
er o
f m
inic
ircl
e se
qu
ence
s
0
2000
4000
1000 2000 3000Minicircle sequence length
Fre
qu
ency
A)
B)
Fig. 2 a Length distribution of the 7760 assembled minicircles in 67 Leishmania isolates, as obtained with rKOMICS function msc.length. b Gray barplots show the total number of minicircles found per Leishmania isolate, and coloured barplots indicate the number obtained after retaining only circularized minicircles of the expected length. Graph is obtained with the rKOMICS function preprocess

Page 10 of 14Geerts et al. BMC Bioinformatics (2021) 22:468
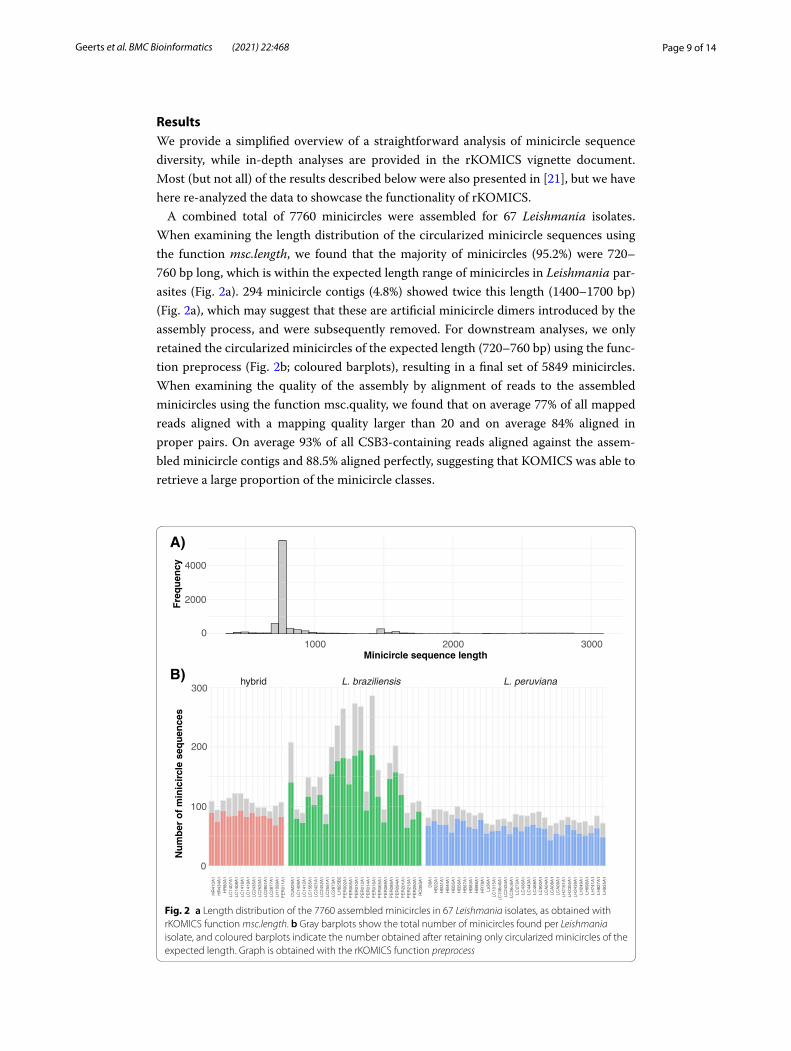
We used the function msc.uc to examine the combined number of minicircle sequence classes (MSCs) (based on overall identity) across all 67 isolates, and identified a total of 3811 MSCs at 100% identity. This number decreased sharply to 918 MSCs at 97% identity and 603 MSCs at 95% identity (Fig. 3a). The proportion of perfectly aligned minicircle sequences (i.e. alignments without any insertion/deletion) during the clus-tering process decreased from 100% (only perfect alignments) at 100% identity to 79% (79% of the alignments were perfect) at 97% identity and 68% at 95% identity (Fig. 3a). While insertions were mostly 1 bp long (Fig. 3b), the number of insertions per align-ment increased with decreasing percent identity (Fig. 3c). Most notably, below 97% iden-tity, we found a steady increase in alignments with 3 or 4 insertions (Fig. 3c). Similar results were obtained for deletions (results not shown). Hence, we decided to focus most of our downstream analyses at the 97% identity threshold, as this would capture suffi-cient minicircle sequence classes (Fig. 3a) while minimizing the number of alignment gaps (Fig. 3b, c).
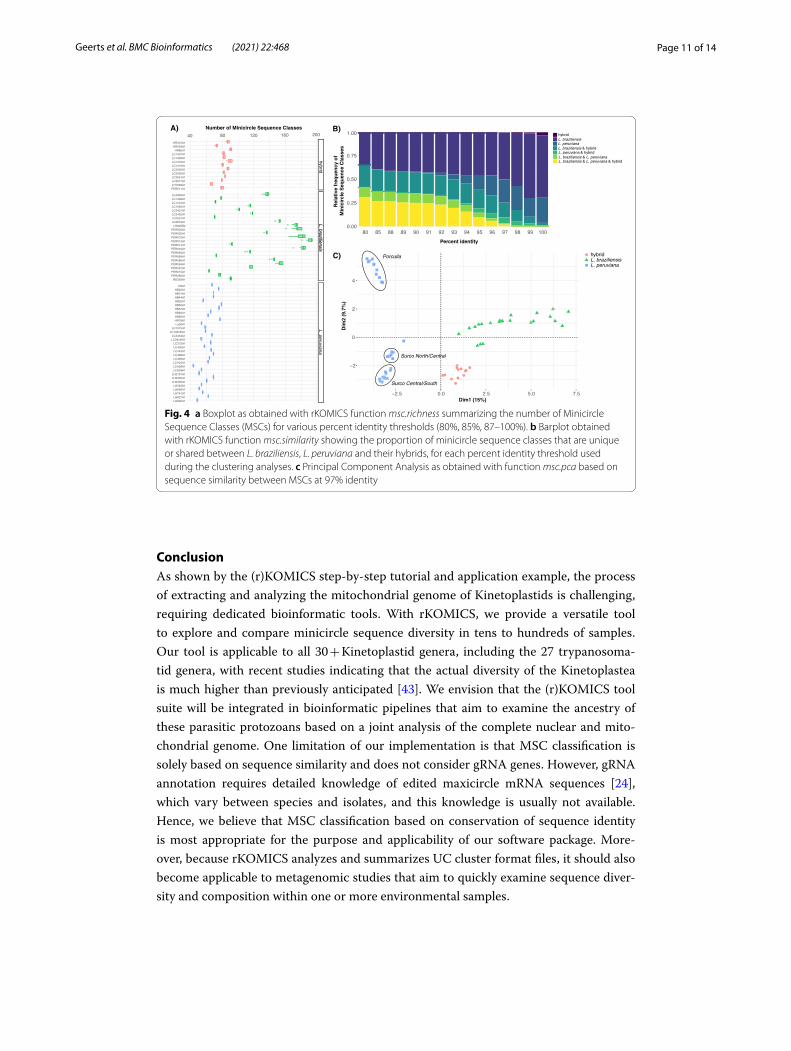
Focusing on the results at 97% identity, we observed that the Andean and near-clonal L. peruviana parasites harbored substantially less MSCs (mean = 62 MSCs per isolate) compared to the Amazonian and recombining L. braziliensis parasites (mean = 124 MSCs per isolate) (Fig. 4a). Using the function msc.similarity, we found that 48.9% and 25.9% of the MSCs were unique to L. braziliensis and L. peruviana, respectively, while hybrid L. braziliensis x L. peruviana parasites shared MSCs with both parents (Fig. 4b). This confirms that hybrid parasites inherited minicircles from both Leishmania parental species, a phenomenon that is described in more detail in [21]. Principal Component Analysis based on minicircle sequence similarity (i.e. MSC presence/absence per iso-late) separated L. braziliensis from L. peruviana on the first axis and three L. peruviana populations on the second axis (Fig. 4c). The three L. peruviana populations correspond to the Porculla lineage that circulates in the tropical deciduous forests of Peru, and the two Surco lineages that circulate in desert shrubland on the Pacific Coast (Surco North/Central and Surco Central/South) (see [21] for more details on the ancestry of these parasites). Hybrids did not cluster with either parental species, in contrast to what was observed for the uniparentally inherited kinetoplast [21], but instead occupied an inter-mediate position between L. braziliensis and the L. peruviana Surco Central/South line-age (Fig. 4b), again consistent with mixing of the parental minicircle populations [21].
1000
2000
3000
25
50
75
100
80 85 90 95 100percent identity (%)
Nu
mb
er o
f M
SC
Perfect alig
nm
ent p
rop
ortio
ns (%
)
0
500
1000
80 85 90 95 100percent identity (%)
Len
gth
of
inse
rtio
ns
1 insertion2 insertions3 insertionsminimum 4 insertions
0
500
1000
80 85 90 95 100percent identity (%)
Nu
mb
er o
f in
sert
ion
s
A) B) C)
Fig. 3 a Number of MSCs (blue) and proportion of perfect alignments (red) as obtained following clustering analyses for a range of percent identities. b, c Length and number of insertions in MSC alignments following clustering analysis for a range of percent identities. These graphs are obtained with the rKOMICS function msc.uc
Page 11 of 14Geerts et al. BMC Bioinformatics (2021) 22:468
ConclusionAs shown by the (r)KOMICS step-by-step tutorial and application example, the process of extracting and analyzing the mitochondrial genome of Kinetoplastids is challenging, requiring dedicated bioinformatic tools. With rKOMICS, we provide a versatile tool to explore and compare minicircle sequence diversity in tens to hundreds of samples. Our tool is applicable to all 30 + Kinetoplastid genera, including the 27 trypanosoma-tid genera, with recent studies indicating that the actual diversity of the Kinetoplastea is much higher than previously anticipated [43]. We envision that the (r)KOMICS tool suite will be integrated in bioinformatic pipelines that aim to examine the ancestry of these parasitic protozoans based on a joint analysis of the complete nuclear and mito-chondrial genome. One limitation of our implementation is that MSC classification is solely based on sequence similarity and does not consider gRNA genes. However, gRNA annotation requires detailed knowledge of edited maxicircle mRNA sequences [24], which vary between species and isolates, and this knowledge is usually not available. Hence, we believe that MSC classification based on conservation of sequence identity is most appropriate for the purpose and applicability of our software package. More-over, because rKOMICS analyzes and summarizes UC cluster format files, it should also become applicable to metagenomic studies that aim to quickly examine sequence diver-sity and composition within one or more environmental samples.
0.00
0.25
0.50
0.75
1.00
80 85 88 89 90 91 92 93 94 95 96 97 98 99 100
Percent identity
Rel
ativ
e fr
equ
ency
of
Min
icir
cle
Seq
uen
ce C
lass
es
hybridL. braziliensis
−2
0
2
4
−2.5 0.0 2.5 5.0 7.5Dim1 (15%)
Dim
2 (9
.7%
)
hybridL. braziliensisL. peruviana
L. peruvianaL. braziliensis & hybridL. peruviana & hybridL. braziliensis & L. peruvianaL. braziliensis & L. peruviana & hybrid
A)
C) Porculla
Surco North/Central
Surco Central/South
hybridL. peruviana
HR410A1HR434A1
HR80A1LC1407A1LC1408A1LC1418A1LC1419A1LC2435A1LC2520A1LC2851A1LC2877A1LH1099A1PER011A1
CUM29A1LC1409A1LC1412A1LC1565A1LC2421A1LC2452A1LC2551A1LC2873A1
LH825B2PER002A1PER005A1PER010A1PER012A1PER014A1PER016A1PER065A1PER069A1PER086A1PER094A1PER201A1PER215A1PER260A1
RO393A1
D8A1HB22A1HB31A1HB44A1HB55A1HB56A1HB67A1HB83A1HB86A1HR78A1La36A1
LC1015A1LC106cl6A1
LC2434A1LC26cl6A1
LC272A1LC436A1LC443A1LC468A1LC900A1LCA04A1LCA08A1LCA09A1
LH2161A1LH2355A1LH2439A1
LH249A1LH696A1LH741A1LH827A1LH925A1
40 80 120 160 200Number of Minicircle Sequence Classes B)
Fig. 4 a Boxplot as obtained with rKOMICS function msc.richness summarizing the number of Minicircle Sequence Classes (MSCs) for various percent identity thresholds (80%, 85%, 87–100%). b Barplot obtained with rKOMICS function msc.similarity showing the proportion of minicircle sequence classes that are unique or shared between L. braziliensis, L. peruviana and their hybrids, for each percent identity threshold used during the clustering analyses. c Principal Component Analysis as obtained with function msc.pca based on sequence similarity between MSCs at 97% identity
Page 12 of 14Geerts et al. BMC Bioinformatics (2021) 22:468
Availability and requirements
Project name: rKOMICSProject home page: https:// CRAN.R- proje ct. org/ packa ge= rKOMI CSOperating system(s): Platform independentProgramming language: ROther requirements: NoneLicense: LGPL
Any restrictions to use by non-academics: LGPL license, open source.
Abbreviationsbp: Base pair(s); kbp: Kilo base pair(s); KOMICS: Kinetoplast genomics; UC: USEARCH cluster; BGI: Beijing Genomics Insti-tute; BWA: Burrows–Wheeler alignment; SAM: Sequence alignment/map; BAM: Binary alignment map; GATK: Genomic analysis toolkit; DNA: Deoxyribonucleic acid; MITObim: Mitochondrial baiting and iterative mapping; RNA: Ribonucleic acid; mRNA: Messenger RNA; gRNA: Guide RNA; T.b.:: Trypanosoma brucei; MSC:: Minicircle sequence class; PCA:: Principal component analysis; MPI:: Minimum percent identity; CSB:: Conserved sequence block; L.:: Leishmania; SNP:: Single nucleotide polymorphism.
AcknowledgementsNot applicable.
Authors’ contributionsMG—Design, implementation, documentation, testing, validation and manuscript writing. AS—Conception and manu-script review. FVDB—Conception, design, testing, oversight and manuscript writing. All authors have read and approved the final manuscript.
FundingThis work is supported by the Bill & Melinda Gates Foundation to MG (Grant Number OPP1174221). FVdB is supported by the Department of Economy, Science and Innovation in Flanders and by the Research Foundation Flanders (Grants 1226120 N and 1528117 N). AS is supported by the UK Medical Research Council Fellowship MR/L019701/1. None of the funding bodies played any role in the design of the study, in the collection, analysis, and interpretation of data, or in writ-ing the manuscript. Funding was provided by Bill & Melinda Gates Foundation (BMGF) (Grant No. INV-007319).
Availability of data and materialsThe minicircle sequence alignment file that support the findings of this study are available at https:// github. com/ FreBio/ komics/ tree/ master/ data/ LBRA. all. circu lariz ed. minic ircles. fasta and were generated from the following study: Van den Broeck F, Savill NJ, Imamura H, Sanders M, Maes I, Cooper S, et al. Ecological divergence and hybridization of Neotropical Leishmania parasites. Proc Natl Acad Sci USA. 2020;117.
Declarations
Ethics approval and consent to participateNot applicable.
Consent for publicationNot applicable.
Competing interestsThe authors declare that they have no competing interests.
Author details1 Department of Biomedical Sciences, Institute of Tropical Medicine, 2000 Antwerp, Belgium. 2 Institute of Immunology and Infection Research, University of Edinburgh, Edinburgh EH9 3FL, UK. 3 Department of Microbiology, Immunology and Transplantation, Rega Institute for Medical Research, Katholieke Universiteit Leuven, 3000 Leuven, Belgium.
Received: 8 February 2021 Accepted: 20 September 2021
References 1. Goodwin S, McPherson JD, McCombie WR. Coming of age: ten years of next-generation sequencing technologies.
Nat Rev Genet. 2016;17:333–51. 2. Li H, Durbin R. Fast and accurate long-read alignment with Burrows–Wheeler transform. Bioinformatics.
2010;26:589–95.
Page 13 of 14Geerts et al. BMC Bioinformatics (2021) 22:468
3. Langmead B, Trapnell C, Pop M, Salzberg SL. Ultrafast and memory-efficient alignment of short DNA sequences to the human genome. Genome Biol. 2009;10:R25.
4. DePristo MA, Banks E, Poplin R, Garimella KV, Maguire JR, Hartl C, et al. A framework for variation discovery and genotyping using next-generation DNA sequencing data. Nat Genet. 2011;43:491–8.
5. Cameron DL, Di Stefano L, Papenfuss AT. Comprehensive evaluation and characterisation of short read general-purpose structural variant calling software. Nat Commun. 2019. https:// doi. org/ 10. 1038/ s41467- 019- 11146-4.
6. Hahn C, Bachmann L, Chevreux B. Reconstructing mitochondrial genomes directly from genomic next-generation sequencing reads—a baiting and iterative mapping approach. Nucleic Acids Res. 2013;41:e129–e129.
7. Dierckxsens N, Mardulyn P, Smits G. NOVOPlasty: de novo assembly of organelle genomes from whole genome data. Nucleic Acids Res. 2017;45:e18.
8. Berriman M, Ghedin E, Hertz-Fowler C, Blandin G, Renauld H, Bartholomeu DC, et al. The genome of the African trypanosome Trypanosoma brucei. Science. 2005;309:416–22.
9. Peacock CS, Seeger K, Harris D, Murphy L, Ruiz JC, Quail MA, et al. Comparative genomic analysis of three Leishmania species that cause diverse human disease. Nat Genet. 2007. https:// doi. org/ 10. 1038/ ng2053.
10. Tihon E, Imamura H, Van den Broeck F, Vermeiren L, Dujardin J-C, Van Den Abbeele J. Genomic analysis of isometa-midium chloride resistance in Trypanosoma congolense. Int J Parasitol Drugs Drug Resist. 2017;7:350–61.
11. Cuypers B, Lecordier L, Meehan CJ, Van den Broeck F, Imamura H, Büscher P, et al. Apolipoprotein L1 variant associ-ated with increased susceptibility to trypanosome infection. MBio. 2016. https:// doi. org/ 10. 1128/ mBio. 02198- 15.
12. Cuypers B, Van den Broeck F, Van Reet N, Meehan CJ, Cauchard J, Wilkes JM, et al. Genome-wide SNP analysis reveals distinct origins of Trypanosoma evansi and Trypanosoma equiperdum. Genome Biol Evol. 2017;9:1990–7.
13. Domagalska MA, Imamura H, Sanders M, Van den Broeck F, Bhattarai NR, Vanaerschot M, et al. Genomes of Leish-mania parasites directly sequenced from patients with visceral leishmaniasis in the Indian subcontinent. PLoS Negl Trop Dis. 2019;13:e0007900.
14. Rogers MB, Downing T, Smith BA, Imamura H, Sanders M, Svobodova M, et al. Genomic confirmation of hybridisa-tion and recent inbreeding in a vector-isolated leishmania population. PLoS Genet. 2014. https:// doi. org/ 10. 1371/ journ al. pgen. 10040 92.
15. Tihon E, Imamura H, Dujardin J-C, Van Den Abbeele J, Van den Broeck F. Discovery and genomic analyses of hybridi-zation between divergent lineages of Trypanosoma congolense, causative agent of Animal African trypanosomiasis. Mol Ecol. 2017. https:// doi. org/ 10. 1111/ mec. 14271.
16. Van den Broeck F, Tavernier LJM, Vermeiren L, Dujardin JC, Van Den Abbeele J. Mitonuclear genomics challenges the theory of clonality in Trypanosoma congolense: reply to Tibayrenc and Ayala. Mol Ecol. 2018. https:// doi. org/ 10. 1111/ mec. 14809.
17. Schwabl P, Imamura H, Van den Broeck F, Costales JA, Maiguashca-Sánchez J, Miles MA, et al. Meiotic sex in Chagas disease parasite Trypanosoma cruzi. Nat Commun. 2019. https:// doi. org/ 10. 1038/ s41467- 019- 11771-z.
18. Inbar E, Shaik J, Iantorno SA, Romano A, Nzelu CO, Owens K, et al. Whole genome sequencing of experimental hybrids supports meiosis-like sexual recombination in leishmania. PLoS Genet. 2019;15:1–28.
19. Imamura H, Downing T, Van den Broeck F, Sanders MJ, Rijal S, Sundar S, et al. Evolutionary genomics of epidemic visceral leishmaniasis in the Indian subcontinent. Elife. 2016. https:// doi. org/ 10. 7554/ eLife. 12613.
20. Franssen SU, Durrant C, Stark O, Moser B, Downing T, Imamura H, et al. Global genome diversity of the Leishmania donovani complex. Elife. 2020;9:e51243.
21. Van den Broeck F, Savill NJ, Imamura H, Sanders M, Maes I, Cooper S, et al. Ecological divergence and hybridization of neotropical Leishmania parasites. Proc Natl Acad Sci USA. 2020. https:// doi. org/ 10. 1073/ pnas. 19201 36117.
22. Lukes J, Guilbride DL, Votýpka J, Zíková A, Benne R, Englund PT, et al. Kinetoplast DNA network : evolution of an Improbable structure. Eukaryot Cell. 2002;1:495–502.
23. Koslowsky D, Sun Y, Hindenach J, Theisen T, Lucas J. The insect-phase gRNA transcriptome in Trypanosoma brucei. Nucleic Acids Res. 2014. https:// doi. org/ 10. 1093/ nar/ gkt973.
24. Cooper S, Wadsworth ES, Ochsenreiter T, Ivens A, Savill NJ, Schnaufer A. Assembly and annotation of the mito-chondrial minicircle genome of a differentiation-competent strain of Trypanosoma brucei. Nucleic Acids Res. 2019;47:11304–25.
25. Wu J, Liu B, Cheng F, Ramchiary N, Choi SR, Lim YP, et al. Sequencing of chloroplast genome using whole cellular DNA and solexa sequencing technology. Front Plant Sci. 2012;3:243.
26. Simpson L, Douglass SM, Lake JA, Pellegrini M, Li F. Comparison of the mitochondrial genomes and steady state transcriptomes of two strains of the trypanosomatid parasite, leishmania tarentolae. PLoS Negl Trop Dis. 2015;9:e0003841.
27. Gerasimov ES, Gasparyan AA, Afonin DA, Zimmer SL, Kraeva N, Lukeš J, et al. Complete minicircle genome of Leptomonas pyrrhocoris reveals sources of its non-canonical mitochondrial RNA editing events. Nucleic Acids Res. 2021;49:3354–70.
28. Gerasimov ES, Gasparyan AA, Litus IA, Logacheva MD, Kolesnikov AA. Minicircle kinetoplast genome of insect trypa-nosomatid leptomonas pyrrhocoris. Biochemistry. 2017;82:572–8.
29. Zerbino DR, Birney E. Velvet: algorithms for de novo short read assembly using de Bruijn graphs. Genome Res. 2008;18:821–9.
30. Jørgensen TS, Xu Z, Hansen MA, Sørensen SJ, Hansen LH. Hundreds of circular novel plasmids and DNA elements identified in a rat cecum metamobilome. PLoS ONE. 2014;9:e87924.
31. Li D, Liu CM, Luo R, Sadakane K, Lam TW. MEGAHIT: an ultra-fast single-node solution for large and complex metagenomics assembly via succinct de Bruijn graph. Bioinformatics. 2015. https:// doi. org/ 10. 1093/ bioin forma tics/ btv033.
32. Altschul SF, Gish W, Miller W, Myers EW, Lipman DJ. Basic local alignment search tool. J Mol Biol. 1990;215:403–10. 33. Edgar RC. Search and clustering orders of magnitude faster than BLAST. Bioinformatics. 2010;26:2460–1. 34. Rognes T, Flouri T, Nichols B, Quince C, Mahé F. VSEARCH: A versatile open source tool for metagenomics. PeerJ.
2016;4:e2584. 35. Ginestet C. Ggplot2: elegant graphics for data analysis: book reviews. J R Stat Soc Ser A Stat Soc. 2011;174:245–6.

Page 14 of 14Geerts et al. BMC Bioinformatics (2021) 22:468
• fast, convenient online submission
•
thorough peer review by experienced researchers in your field
• rapid publication on acceptance
• support for research data, including large and complex data types
•
gold Open Access which fosters wider collaboration and increased citations
maximum visibility for your research: over 100M website views per year •
At BMC, research is always in progress.
Learn more biomedcentral.com/submissions
Ready to submit your researchReady to submit your research ? Choose BMC and benefit from: ? Choose BMC and benefit from:
36. Lin R-H, Lai D-H, Zheng L-L, Wu J, Lukeš J, Hide G, et al. Analysis of the mitochondrial maxicircle of Trypanosoma lewisi, a neglected human pathogen. Parasites Vectors. 2015. https:// doi. org/ 10. 1186/ s13071- 015- 1281-8.
37. Lai D-H, Hashimi H, Lun Z-R, Ayala FJ, Lukes J. Adaptations of Trypanosoma brucei to gradual loss of kinetoplast DNA: Trypanosoma equiperdum and Trypanosoma evansi are petite mutants of T. brucei. Proc Natl Acad Sci USA. 2008;105:1999–2004.
38. Otto TD, Dillon GP, Degrave WS, Berriman M. RATT: rapid annotation transfer tool. Nucleic Acids Res. 2011;39:e87. 39. Ray DS. Conserved sequence blocks in kinetoplast minicircles from diverse species of trypanosomes. Mol Cell Biol.
1989;9:1365–7. 40. Bailey TL, Johnson J, Grant CE, Noble WS. The MEME suite. Nucleic Acids Res. 2015;43:W39-49. 41. Li H, Handsaker B, Wysoker A, Fennell T, Ruan J, Homer N, et al. The sequence alignment/map format and SAMtools.
Bioinformatics. 2009;25:2078–9. 42. Chen S, Zhou Y, Chen Y, Gu J. fastp: an ultra-fast all-in-one FASTQ preprocessor. Bioinformatics. 2018;34:i884–90. 43. d’Avila-Levy CM, Boucinha C, Kostygov A, Santos HLC, Morelli KA, Grybchuk-Ieremenko A, et al. Exploring the
environmental diversity of kinetoplastid flagellates in the high-throughput DNA sequencing era. Mem Inst Oswaldo Cruz. 2015;110:956–65.
Publisher’s NoteSpringer Nature remains neutral with regard to jurisdictional claims in published maps and institutional affiliations.