Embed Size (px)
Citation preview

RIYAD BANK
CONSOLIDATED STATEMENT OF FINANCIAL POSITION
As at December 31, 2010 and 2009
2010 2009Notes SAR’ 000 SAR’ 000
ASSETSCash and balances with SAMA 4 23,178,560 23,419,303 Due from banks and other financial institutions 5 4,688,754 8,704,462 Investments, net 6 33,822,441 32,308,077 Loans and advances, net 7 106,034,740 106,514,613 Other real estate 431,578 407,132 Property and equipment, net 8 1,862,855 1,830,157 Other assets 9 3,537,502 3,215,514 Total assets 173,556,430 176,399,258
LIABILITIES AND SHAREHOLDERS' EQUITY
LiabilitiesDue to banks and other financial institutions 11 10,636,551 16,163,012 Customer deposits 12 126,945,459 125,278,106 Debt securities in issue 13 1,873,723 1,873,403 Other liabilities 14 4,867,479 4,849,293
Total liabilities 144,323,212 148,163,814
Shareholders' equityShare capital 15 15,000,000 15,000,000 Statutory reserve 16 11,687,749 10,981,592 Other reserves 17 813,965 605,818 Retained earnings 610,504 513,034 Proposed dividends 24 1,121,000 1,135,000 Total shareholders' equity 29,233,218 28,235,444 Total liabilities and shareholders' equity 173,556,430 176,399,258
The accompanying notes 1 to 40 form an integral part of these consolidated financial statements.
1 of 39 - 2/7/2011- 1:32 PM

RIYAD BANK
CONSOLIDATED INCOME STATEMENT For the years ended December 31, 2010 and 2009
2010 2009Notes SAR' 000 SAR' 000
Special commission income 19 4,872,527 5,814,294 Special commission expense 19 730,740 1,467,108 Net special commission income 4,141,787 4,347,186
Fee and commission income, net 20 1,418,202 1,222,513 Exchange income, net 231,445 165,850 Trading losses, net (5,972) (5,971)Gains/ (losses) on Available for sale investments, net 129,849 (18,650)Other operating income 21 65,141 249,181
Total operating income 5,980,452 5,960,109
Salaries and employee-related expenses 1,124,228 1,118,172 Rent and premises-related expenses 254,382 226,915 Depreciation 277,812 262,248 Other general and administrative expenses 641,020 578,402 Impairment charge for credit losses, net 935,074 618,539 Impairment charge for investments, net (85,000) 117,843 Other operating expenses 22 8,309 7,505
Total operating expenses 3,155,825 2,929,624 Net income for the year 2,824,627 3,030,485
Basic and diluted earnings per share (in SAR) 23 1.88 2.02
The accompanying notes 1 to 40 form an integral part of these consolidated financial statements.
2 of 39 - 2/7/2011- 1:32 PM

RIYAD BANK
CONSOLIDATED STATEMENT OF COMPREHENSIVE INCOMEFor the years ended December 31, 2010 and 2009
2010 2009SAR' 000 SAR' 000
Net income for the year 2,824,627 3,030,485 Other comprehensive income:
Net changes in fair value (note 17) 487,550 1,420,457 Net changes in fair value transferred to consolidated income statement (note 17) (222,004) 118,635
265,546 1,539,092
Net changes in fair value (note 17) (58,821) 15,377 Net changes in fair value transferred to consolidated income statement (note 17) 1,422 (8,961)
(57,399) 6,416 Other comprehensive income for the year 208,147 1,545,508
Total comprehensive income for the year 3,032,774 4,575,993
-Available for sale investments
-Cash flow hedges
The accompanying notes 1 to 40 form an integral part of these consolidated financial statements.
3 of 39 - 2/7/2011- 1:32 PM

RIYAD BANK
CONSOLIDATED STATEMENT OF CHANGES IN SHAREHOLDERS' EQUITYFor the years ended December 31, 2010 and 2009
NotesAvailable for
sale investments
Cash flow hedges
2010Balance at the beginning of the year 15,000,000 10,981,592 485,692 120,126 513,034 1,135,000 28,235,444 Total comprehensive income - - 265,546 (57,399) 2,824,627 - 3,032,774 Final dividends paid - 2009 24 - - - - - (1,135,000) (1,135,000) Interim dividends paid - 2010 24 - - - - (900,000) - (900,000) Transfer to statutory reserve 16 - 706,157 - - (706,157) - - 2010 final proposed dividends 24 - - - - (1,121,000) 1,121,000 - Balance at the end of the year 15,000,000 11,687,749 751,238 62,727 610,504 1,121,000 29,233,218
2009Balance at the beginning of the year 15,000,000 10,223,971 (1,053,400) 113,710 275,170 1,131,000 25,690,451 Total comprehensive income - - 1,539,092 6,416 3,030,485 - 4,575,993 Final dividends paid - 2008 24 - - - - - (1,131,000) (1,131,000) Interim dividends paid - 2009 24 - - - - (900,000) - (900,000) Transfer to statutory reserve 16 - 757,621 - - (757,621) - - 2009 final proposed dividends 24 - - - - (1,135,000) 1,135,000 - Balance at the end of the year 15,000,000 10,981,592 485,692 120,126 513,034 1,135,000 28,235,444
SAR' 000
The accompanying notes 1 to 40 form an integral part of these consolidated financial statements.
Share capital
Statutory reserve
Other reserves Retained earnings
Proposed dividend
Total
4 of 39 - 2/7/2011- 1:32 PM

RIYAD BANK
CONSOLIDATED STATEMENT OF CASH FLOWS
2010 2009Notes SAR' 000 SAR' 000
2,824,627 3,030,485
(89,542) (350,109)(Gains)/ losses on non-trading investments, net (129,849) 18,650Depreciation 277,812 262,248Impairment charge for investments, net (85,000) 117,843 Impairment charge for credit losses, net 935,074 618,539
3,733,122 3,697,656
Statutory deposit with SAMA 4 (44,647) (1,364,192)2,692,865 (655,633)
Loans and advances (455,201) (10,703,306)Other real estate (24,446) 106,442Other assets (321,988) 199,149
Due to banks and other financial institutions (5,526,461) (5,050,182)Customer deposits 1,667,353 20,222,560Other liabilities 42,436 (986,516)
1,763,033 5,465,978
Proceeds from sales and maturities of non-trading investments 27,050,935 27,978,785Purchase of non-trading investments (28,052,441) (18,199,213)Purchase of property and equipment, net (310,510) (462,099)
(1,312,016) 9,317,473
Dividend and zakat paid (2,059,250) (2,014,593)(2,059,250) (2,014,593)(1,608,233) 12,768,85822,445,240 9,676,382
25 20,837,007 22,445,240
4,957,968 6,399,401 804,138 1,955,645
208,147 1,545,508
The accompanying notes 1 to 40 form an integral part of these consolidated financial statements.
Special commission received during the yearSpecial commission paid during the year
FINANCING ACTIVITIES
Net cash (used in) financing activities
Net cash (used in) from investing activities
Cash and cash equivalents at beginning of the year
For the years ended December 31, 2010 and 2009
Cash and cash equivalents at end of the year
INVESTING ACTIVITIES
Adjustments to reconcile net income to net cash from operating activities:
Due from banks and other financial institutions maturing after three months from the date of acquisition
OPERATING ACTIVITIES Net income for the year
Net (increase) decrease in operating assets:
Net (decrease)/ increase in cash and cash equivalents
(Accretion of discounts) on non-trading investments, net and debt securities in issue, net
Net increase (decrease) in operating liabilities:
Net cash from operating activities
Net changes in fair value and transfer to consolidated income statementSupplemental non-cash information
5 of 39 - 2/7/2011- 1:32 PM

RIYAD BANK
NOTES TO THE CONSOLIDATED FINANCIAL STATEMENTS
1.
2.a)
b)
c )
d) Critical accounting judgements, estimates and assumptions
( i ) Impairment for credit losses on loans & advances
These consolidated financial statements are presented in Saudi Arabian Riyals (SAR), which is the Bank’s functional currency. Except asindicated, financial information presented in SAR has been rounded off to the nearest thousand Saudi Arabian Riyals.
Functional and presentation currency
The consolidated financial statements are prepared in accordance with the Accounting Standards for Financial Institutions promulgated by the Saudi Arabian Monetary Agency (SAMA) and International Financial Reporting Standards (IFRS). The Bank also prepares its consolidated financial statements to comply with the Banking Control Law, the provisions of Regulations for Companies in the Kingdom of Saudi Arabia and the Bank's Articles of Association.
Statement of compliance
The consolidated financial statements are prepared under the historical cost convention except for the measurement at fair value of derivativesand Available for Sale financial assets. In addition, financial assets or liabilities that are hedged in a fair value hedging relationship, and otherwisecarried at cost, are carried at fair value to the extent of the risk being hedged. The consolidated financial statements are prepared on the goingconcern basis.
Basis of measurement
The preparation of financial statements in conformity with IFRS requires the use of certain critical accounting judgements, estimates andassumptions that affect the reported amounts of assets and liabilities. It also requires management to exercise its judgement in the process ofapplying the Bank’s accounting policies. Such judgements, estimates and assumptions are continually evaluated and are based on historicalexperience and other factors, including obtaining professional advices and expectations of future events that are believed to be reasonable underthe circumstances. Significant areas where management has used estimates, assumptions or exercised judgements are as follows:
The Bank reviews its loan portfolios to assess specific and collective impairment on a quarterly basis. In determining whether an impairmentloss should be recorded, the Bank makes judgements as to whether there is any observable data indicating that there is a measurabledecrease in the estimated future cash flows. This evidence may include observable data indicating that there has been an adverse changein the payment status of borrowers in a group. Management uses estimates based on historical loss experience for loans with credit riskcharacteristics and objective evidence of impairment similar to those in the portfolio, when estimating its cash flows. The methodology andassumptions used for estimating both the amount and the timing of future cash flows are reviewed regularly to reduce any differencesbetween loss estimates and actual loss experience.
For the years ended December 31, 2010 and 2009
GENERAL
BASIS OF PREPARATION
Riyad Bank (The "Bank") is a Saudi Joint Stock Company incorporated in the Kingdom of Saudi Arabia, formed pursuant to the Royal Decree and theCouncil of Ministers’ Resolution No. 91 dated 1 Jumad Al-Awal 1377H (corresponding to November 23, 1957G). The Bank operates undercommercial registration No. 1010001054 dated 25 Rabi Al-Thani 1377H (corresponding to November 18, 1957G) through its 241 branches (2009:216 branches) in the Kingdom of Saudi Arabia, a branch in London-United Kingdom, an agency in Houston-United States, and a representative officein Singapore. The Bank’s Head Office is located at the following address:
Riyad BankP.O. Box 22622Riyadh 11416 Kingdom of Saudi Arabia
The objective of the Bank is to provide a full range of banking and investment services. The Bank also provides to its customers Islamic (non-interestbased) banking products which are approved and supervised by an independent Shariah Board established by the Bank.
6 of 39 - 2/7/2011- 1:32 PM

RIYAD BANK
2. BASIS OF PREPARATION (continued)d) Critical accounting judgements, estimates and assumptions (continued)
( ii ) Fair value of unquoted financial instruments
( iii ) Impairment of Available for sale equity investments
( iv ) Classification of held-to-maturity investments
3. SUMMARY OF SIGNIFICANT ACCOUNTING POLICIES
a) Change in accounting policies
(I )
(ii )
(iii )
b) Basis of consolidation
c) Settlement date accounting All regular way purchases and sales of financial assets are recognized and derecognized on the settlement date. The Bank accounts forany change in fair value between the trade and the reporting date in the same way as it accounts for the acquired assets. Regular waypurchases or sales are purchases or sales of financial instruments that require delivery of assets within the time frame generallyestablished by regulation or convention in the market place.
The Bank exercises judgement in considering impairment on the Available for sale equity investments. This includes determinationof a significant or prolonged decline in the fair value below its cost. In making this judgement, the Bank evaluates among otherfactors, the normal volatility in share price. In addition, the Bank considers impairment to be appropriate when there is evidence ofdeterioration in the financial health of the investee, industry and sector performance, changes in technology and operational andfinancing cash flows.
The Bank follows the guidance of IAS 39 on classifying non-derivative financial assets with fixed or determinable payments and fixedmaturity as held-to-maturity. In making this judgement, the Bank evaluates its intention and ability to hold such investments tomaturity.
The consolidated financial statements comprise the financial statements of Riyad Bank and its subsidiaries; Riyad Capital and Ithra Al-Riyad Real Estate Company (collectively referred to as “the Group”). The financial statements of the subsidiaries are prepared for thesame reporting year as that of the Bank, using consistent accounting policies.
The significant accounting policies adopted in the preparation of these consolidated financial statements are set out below.
Improvements to IFRSs 2009 – amendments to applicable and relevant standards and interpretations.
IAS 27 Consolidated and Separate Financial Statements (amended 2008). The amendments deal primarily with the accounting for changes in ownership interests in subsidiaries after control is obtained, the accounting for the loss of control of subsidiaries, and the allocation of profit or loss to controlling and non-controlling interests in a subsidiaryIAS 39 (amendment), "Financial instruments - Recognition and measurement – Eligible hedged items". The amendment was issued in July 2008. These amendments to IAS 39 clarify how the principles that determine whether a hedged risk or portion of cash flows is eligible for designation should be applied in particular situations.
Subsidiaries are all entities controlled by the Bank. Control exists when the Bank has the power to govern the financial and operatingpolicies, so as to obtain benefits from its activities, generally accompanying an ownership interest of more than one half of the voting rights.Subsidiaries are consolidated from the date on which control is transferred to the Bank and cease to be consolidated from the date onwhich the control is transferred from the Bank.Non-controlling interests represent the portion of net income and net assets attributable to interests, which are not owned, directly orindirectly, by the Bank in its subsidiaries. As at December 31, 2010 and 2009, non-controlling interests are less than 1% of the Bank’ssubsidiaries’ net assets and is owned by representative shareholders and hence, they are not presented separately in the consolidatedincome statement.Balances between the Bank and its subsidiaries, and any income and expenses arising from intra-group transactions are eliminated inpreparing the consolidated financial statements.
NOTES TO THE CONSOLIDATED FINANCIAL STATEMENTS - continuedFor the years ended December 31, 2010 and 2009
The accounting policies used in the preparation of these consolidated financial statements are consistent with those used in thepreparation of the annual consolidated financial statements for the year ended 31 December 2009, except for the adoption of amendmentsto the existing standards, as mentioned below.
The fair values of financial instruments that are not quoted in active markets are determined by using valuation techniques, which arevalidated and periodically reviewed independently, to ensure that outputs reflect actual data and comparative market prices. To theextent practical, valuation techniques use only observable market data; however areas such as credit risk, volatilities and correlationsrequire management to make estimates. Changes in assumptions about these factors could affect reported fair value of financialinstruments.
7 of 39 - 2/7/2011- 1:32 PM

RIYAD BANK
3 SUMMARY OF SIGNIFICANT ACCOUNTING POLICIES (continued)
d ) Derivative financial instruments and hedge accounting
For the purpose of hedge accounting, hedges are classified into two categories: (a) fair value hedges which hedge the exposure to changesin the fair value of a recognised asset or liability or an unrecognised firm commitment or an identified portion of such an asset, liability or firmcommitment, that is attributable to a particular risk and could affect the reported net gain or loss; and (b) cash flow hedges which hedgeexposure to variability in cash flows that is either attributable to a particular risk associated with a recognised asset or liability, or to a highlyprobable forecasted transaction that will affect the reported net gain or loss.
(ii) Hedge accounting
NOTES TO THE CONSOLIDATED FINANCIAL STATEMENTS - continuedFor the years ended December 31, 2010 and 2009
Any changes in the fair value of derivatives that are held for trading purposes are taken directly to consolidated income statement anddisclosed in trading income/ loss. Derivatives held for trading also include those derivatives which do not qualify for hedge accountingdescribed below.
Derivative financial instruments, including foreign exchange contracts, special commission rate swaps and currency options (both writtenand purchased), are measured at fair value. All derivatives are carried at their fair value as assets where the fair value is positive and asliabilities where the fair value is negative. Fair values are obtained by reference to quoted market prices, discounted cash flow models andpricing models, as appropriate. The treatment of changes in their fair value depends on their classification into the following categories:(i) Derivatives held for trading
In order to qualify for hedge accounting, the hedge should be expected to be highly effective, i.e. the changes in fair value or cash flows ofthe hedging instrument should effectively offset corresponding changes in the hedged item, and should be reliably measurable. At theinception of the hedge, the risk management objective and strategy is documented, including the identification of the hedging instrument,the related hedged item, the nature of risk being hedged, and how the Bank will assess the effectiveness of the hedging relationship.Subsequently, the hedge is required to be assessed and determined to be an effective hedge on an ongoing basis.
When a derivative is designated as the hedging instrument in a hedge of the change in fair value of a recognised asset or liability or a firmcommitment that could affect income statement, any gain or loss from re-measuring the hedging instruments to fair value is recognisedimmediately in the consolidated income statement. The related portion of the hedged item is adjusted against the carrying amount of thehedged item and recognised in the consolidated income statement. For hedged items measured at amortised cost, where the fair valuehedge of a special commission bearing financial instrument ceases to meet the criteria for hedge accounting or is sold, exercised orterminated, the difference between the carrying value of the hedged item on termination and the face value is amortised over the remainingterm of the original hedge using the effective yield basis. If the hedged item is derecognised, the unamortised fair value adjustment isrecognised immediately in the consolidated income statement.
When a derivative is designated as the hedging instrument in a hedge of a variability of cash flows attributable to a particular riskassociated with a recognised asset or a liability or a highly probable forecasted transaction that could affect income statement, the portion ofthe gain or loss on the hedging instrument that is determined to be an effective portion is recognised directly in other comprehensive incomeand the ineffective portion, if any, is immediately recognised in the consolidated income statement. For cash flow hedges affecting futuretransactions, the gains or losses recognised in other reserves, are transferred to the consolidated income statement in the same period inwhich the hedged transaction affects the consolidated income statement. Where the hedged forecasted transaction results in the recognitionof a non- financial asset or a non-financial liability, then at the time such asset or liability is recognised the associated gains or losses thathad previously been recognised directly in other comprehensive income are included in the initial measurement of the acquisition cost orother carrying amount of such asset or liability.Hedge accounting is discontinued when the hedging instrument expires or is sold, terminated or exercised, or no longer qualifies for hedgeaccounting, or the forecast transaction is no longer expected to occur or the Bank revokes the designation. At that point of time, anycumulative gain or loss on the cash flow hedging instrument that was recognised in other comprehensive income is retained until theforecasted transaction occurs. Where the hedged forecasted transaction is no longer expected to occur, the net cumulative gain or lossrecognised in other comprehensive income is transferred to the consolidated income statement for the period.
a) Fair value hedges
b) Cash flow hedges
8 of 39 - 2/7/2011- 1:32 PM

RIYAD BANK
3
e) Foreign currencies
f )
g )
(i)
(ii)
(iii)
Special commission income and expense for all special commission bearing financial instruments, except for those classified as held for tradingor designated at fair value through income statement (FVIS), are recognised in the consolidated income statement using the effective yieldbasis. The effective yield is the rate that exactly discounts the estimated future cash payments and receipts through the expected life of thefinancial asset or liability (or, where appropriate, a shorter period) to the carrying amount of the financial asset or liability. When calculating theeffective special commission rate, the Bank estimates future cash flows considering all contractual terms of the financial instrument but notfuture credit losses.
Fees and commissions are recognised when the service has been provided. Loan commitment fees for loans that are likely to be drawn downare deferred and, together with the related direct cost, are recognised as an adjustment to the effective yield on the loan. Portfolio and othermanagement advisory and service fees are recognised based on the applicable service contracts, usually on a time-proportionate basis. Feereceived on asset management, wealth management, financial planning, custody services and other similar services that are provided over anextended period of time, are recognised over the period when the service is being provided.
If the recorded value of a financial asset or a group of similar financial assets has been reduced due to an impairment loss, special commissionincome continues to be recognised using the original effective yield applied to the new carrying amount.The calculation of the effective yield includes all fees and points paid or received, transaction costs, and discounts or premiums that are anintegral part of the effective special commission rate. Transaction costs are incremental costs that are directly attributable to the acquisition,issue or disposal of financial asset or liability.
The carrying amount of the financial asset or financial liability is adjusted if the Group revises its estimates of payments or receipts. Theadjusted carrying amount is calculated based on the original effective special commission rate and the change in carrying amount is recordedas special commission income or expense.
Dividend income is recognised when the right to receive payment is established. Exchange income/ loss is recognised when earned/ incurred.Results arising from trading activities include gains and losses from changes in fair value and related special commission income or expensefor financial assets and financial liabilities held for trading.
Financial assets and liabilities are offset and reported net in the consolidated statement of financial position when there is a legally enforceableright to set off the recognised amounts and when the Group intends to settle on a net basis, or to realise the asset and settle the liabilitysimultaneously.
Revenue recognition
SUMMARY OF SIGNIFICANT ACCOUNTING POLICIES (continued)
Offsetting financial instruments
For the years ended December 31, 2010 and 2009NOTES TO THE CONSOLIDATED FINANCIAL STATEMENTS - continued
Transactions in foreign currencies are translated into Saudi Arabian Riyals at exchange rates prevailing on the transaction dates. Monetaryassets and liabilities at the year-end, denominated in foreign currencies, are translated into Saudi Arabian Riyals at the exchange ratesprevailing at the reporting date. Foreign exchange gains or losses on translation of monetary assets and liabilities denominated in foreigncurrencies are recognised in the consolidated income statement, except for differences arising on re-translation of Available for sale equityinstruments except, when deferred in equity as qualifying cash flow hedges and qualifying net investment hedges. Translation gains or losseson non-monetary items carried at fair value are included as part of the fair value adjustment either in the consolidated income statement or inequity, depending on the underlying financial asset.
The monetary assets and liabilities of overseas branch are translated at the rate of exchange ruling at the reporting date. The income andexpenses of overseas branch are translated at the average exchange rates for the year. Exchange differences arising on monetary items thatform part of net investment in a foreign operation, if significant are included as a separate component of equity. These differences aretransferred to consolidated income statement at the time of disposal of foreign operations. All insignificant differences are included in theconsolidated income statement.
Special commission income and expenses
Fee and commission income
Others
9 of 39 - 2/7/2011- 1:32 PM

3
h )
i )
(i) Held as FVIS
(ii) Available for sale
For the years ended December 31, 2010 and 2009
For securities where there is no quoted market price, a reasonable estimate of the fair value is determined by reference to the current marketvalue of another instrument which is substantially the same, or is based on the expected cash flows of the security. Where the fair valuescannot be derived from active markets, they are determined using a variety of valuation techniques that include the use of mathematicalmodels if possible. The input to these models is taken from observable markets where possible, but where this is not feasible, a degree ofjudgment is required in establishing fair values. Following recognition, subsequent transfers between the various classes of investments are not ordinarily permissible except in accordancewith amendments in IAS 39 (refer note 6). The subsequent period-end reporting values for each class of investment are determined on thebasis as set out in the following paragraphs:
Sale and repurchase agreementsAssets sold with a simultaneous commitment to repurchase at a specified future date (repos) continue to be recognised in the consolidatedstatement of financial position and are measured in accordance with related accounting policies for investments held as FVIS, Available forsale, held to maturity and other investments held at amortised cost. The counterparty liability for amounts received under these agreements isincluded in "Due to banks and other financial institutions" or "Customers’ deposits", as appropriate. The difference between sale andrepurchase prices is treated as special commission expense and is accrued over the life of the repo agreement on an effective specialcommission rate basis. Assets purchased with a corresponding commitment to resell at a specified future date (reverse repos), are notrecognised in the consolidated statement of financial position, as the Bank does not obtain control over the assets.Amounts paid under these agreements are included in "Cash and balances with SAMA" or "Due from banks and other financial institutions"as appropriate. The difference between purchase and resale prices is treated as special commission income and accrued over the life of thereverse repo agreement on an effective yield basis.
NOTES TO THE CONSOLIDATED FINANCIAL STATEMENTS - continued
Investments in this category are classified at initial recognition as either investment held for trading or those upon initial recognitiondesignated as FVIS. Investments classified as trading are acquired principally for the purpose of selling or repurchasing in short term. After initial recognition, investments at FVIS are measured at fair value and any change in the fair value is recognised in theconsolidated income statement for the period in which it arises. Transaction costs, if any, are not added to the fair value measurementat initial recognition of FVIS investments. Special commission income and dividend income on investment securities held as FVIS arereflected as trading income.
SUMMARY OF SIGNIFICANT ACCOUNTING POLICIES (continued)
InvestmentsAll investment securities are initially recognised at fair value, including incremental direct transaction cost except for investments held as FairValue through Income Statement (FVIS) and are subsequently accounted for depending on their classification as either held to maturity,FVIS, Available for sale or other investments held at amortised cost. Premiums are amortised and discounts accreted using the effective yieldbasis and are taken to special commission income. For securities traded in organized financial markets, fair value is determined by reference to exchange quoted market bid prices at the closeof business on the reporting date. Fair value of managed assets and investments in mutual funds are determined by reference to declared netasset values.
Available for sale investments are those equity and debt securities intended to be held for an unspecified period of time, which may besold in response to needs for liquidity or changes in special commission rates, exchange rates or equity prices. Investments, which areclassified as “Available for sale”, are subsequently measured at fair value. For an Available for sale investment where the fair value hasnot been hedged, any gain or loss arising from a change in its fair value is recognised directly in other comprehensive income. Onderecognition, any cumulative gain or loss previously recognised in other comprehensive income is included in the consolidated incomestatement.
10 of 39 - 2/7/2011- 1:32 PM

RIYAD BANK
3
i )(iii) Other investments held at amortised cost
(iv) Held to maturity
j ) Loans and advances
k) Impairment of financial assets
Once a financial asset has been written down to its estimated recoverable amount, special commission income is thereafter recognised basedon the rate of special commission that was used to discount the future cash flows for the purpose of measuring the recoverable amount.
An assessment is made at each reporting date to determine whether there is objective evidence that a financial asset or group of financialassets not held as FVIS may be impaired. If such evidence exists, the estimated recoverable amount of that asset is determined and anyimpairment loss, based on the net present value of future anticipated cash flows, is recognised for changes in its carrying amounts. Financialassets are impaired when objective evidence demonstrates that a loss event has occurred after initial recognition of asset, and that the lossevent has an impact on the future cash flows of the asset that can be estimated reliably.
If, in a subsequent period, the amount of the impairment loss decreases and the decrease can be related objectively to an event occurringafter the impairment was recognised (such as an improvement in the debtor’s credit rating), the previously recognised impairment loss isreversed by adjusting the allowance account. The amount of the reversal is recognised in the consolidated income statement in impairmentcharge for credit losses.
Investments (continued)
Investment securities with fixed or determinable payments that are not quoted in an active market are classified as “Other investmentsheld at amortised cost”. Such investments whose fair values have not been hedged are stated at amortised cost using effective yieldbasis, less provision for impairment. Any gain or loss is recognised in the consolidated income statement when the investment isderecognised or impaired.
Investments having fixed or determinable payments and fixed maturity that the Bank has the positive intention and ability to hold tomaturity other than those that meet the definition of “Other investments held at amortised cost” are classified as held to maturity. Held tomaturity investments are subsequently measured at amortised cost, less provision for impairment in value. Amortised cost is calculated bytaking into account any discount or premium on acquisition using an effective yield basis. Any gain or loss on such investments isrecognised in the consolidated income statement when the investment is derecognised or impaired.Investments classified as held to maturity cannot ordinarily be sold or reclassified without impacting the Bank’s ability to use thisclassification and cannot be designated as a hedged item with respect to commission rate or prepayment risk, reflecting the longer-termnature of these investments.
When a financial asset is uncollectible, it is written off against the related provision for impairment either directly by a charge to consolidatedincome statement or through impairment allowance account. Financial assets are written off only in circumstances where effectively allpossible means of recovery have been exhausted, and the amount of the loss has been determined.
Loans and advances are non-derivative financial assets originated or acquired by the Bank with fixed or determinable payments. Loans andadvances are recognised when cash is advanced to borrowers. They are derecognised when either borrowers repay their obligations, or theloans are sold or written off, or substantially all the risks and rewards of ownership are transferred.
Objective evidence that financial assets are impaired can include default or delinquency by a borrower, restructuring of a loan or advance bythe group on the terms that the Bank would not otherwise consider, indications that a borrower or issuer will enter bankruptcy, thedisappearance of active market for a security or other observable data relating to a group of assets such as adverse changes in the paymentstatus of borrowers or issuers.
All loans and advances are initially measured at fair value, including directly attributable transaction costs associated with the loans andadvances. Loans and advances originated or acquired by the Bank that are not quoted in an active market, are stated at amortised cost. Forpresentation purposes, allowance for credit losses is deducted from loans and advances.
For the years ended December 31, 2010 and 2009
SUMMARY OF SIGNIFICANT ACCOUNTING POLICIES (continued)
NOTES TO THE CONSOLIDATED FINANCIAL STATEMENTS - continued
Loans whose terms have been renegotiated are no longer considered to be past due but are treated as new loans. Restructuring policies andpractices are based on indicators or criteria, which indicate that payment will most likely continue. The loans continue to be subject to anindividual or collective impairment assessment, calculated using the loan’s original effective yield rate. Consumer loans are charged off whenthey become 180 days past due.
11 of 39 - 2/7/2011- 1:32 PM

RIYAD BANK
3.
k ) Impairment of financial assets (continued)i) Impairment of financial assets held at amortised cost
ii) Impairment of Available for sale financial assets
l )The Bank, in the ordinary course of business, acquires certain real estate against settlement of due loans and advances. Such real estate areconsidered as assets held for sale and are initially stated at the lower of net realizable value of due loans and advances or the current fairvalue of the related properties, less any costs to sell, if material. Rental income from other real estate is recognised in the consolidated incomestatement. No depreciation is charged on such real estate.
NOTES TO THE CONSOLIDATED FINANCIAL STATEMENTS - continued
Subsequent to initial recognition, any subsequent write down to fair value, less costs to sell, are charged to the consolidated income statement.Any subsequent gain in the fair value less costs to sell of these assets to the extent this does not exceed the cumulative write down isrecognised as income together with any gain/ loss on disposal.
SUMMARY OF SIGNIFICANT ACCOUNTING POLICIES (continued)
Other real estate
For the years ended December 31, 2010 and 2009
The Bank also considers evidence of impairment at a collective assets level. The collective provision is based upon deterioration in theinternal grading or external credit ratings, allocated to the borrower or group of borrowers, the current economic climate in which theborrowers operate and the experience and historical default patterns that are embedded in the components of the credit portfolio.
For equity investments held as Available for sale, a significant or prolonged decline in fair value below its cost represents objectiveevidence of impairment. The impairment loss cannot be reversed through consolidated income statement as long as the asset continuesto be recognised i.e. any increase in fair value after impairment has been recorded can only be recognised in equity. On derecognition,any cumulative gain or loss previously recognised in shareholders’ equity is included in the consolidated income statement for the year.
In case of financial instruments held at amortised cost and held to maturity, the Bank assesses individually whether there is objectiveevidence of impairment based on same criteria as explained above.A specific provision for credit losses due to impairment of a loan or any other financial asset held at amortised cost is established if thereis objective evidence that the Bank will not be able to collect all amounts due. The amount of the specific provision is the differencebetween the carrying amount and the estimated recoverable amount. The estimated recoverable amount is the present value of expectedcash flows, including amounts estimated to be recoverable from guarantees and collateral, discounted based on the original effectiveyield rate.
In the case of debt instruments classified as Available for sale, the Bank assesses individually whether there is objective evidence ofimpairment based on the same criteria as explained above. However, the amount recorded for impairment is the cumulative lossmeasured as the difference between the amortised cost and the current fair value, less any impairment loss on that investment previouslyrecognised in the consolidated income statement.If, in a subsequent period, the fair value of a debt instrument increases and the increase can be objectively related to credit eventoccurring after the impairment loss was recognised in the consolidated income statement, the impairment loss is reversed through theconsolidated income statement.
12 of 39 - 2/7/2011- 1:32 PM

RIYAD BANK
3.
m )
n )
o )
p )
q )
r )
s )
Guarantee contractsIn ordinary course of business, the Bank gives financial guarantees, consisting of letters of credit, guarantees and acceptances. Financialguarantees are initially recognised in the financial statements at fair value in other liabilities, being the value of the premium received.Subsequent to the initial recognition, the Bank's liability under each guarantee is measured at the higher of the amortised premium and the bestestimate of expenditure required to settle any financial obligations arising as a result of guarantees. Any increase in the liability relating to thefinancial guarantee is taken to the consolidated income statement in 'impairment charge for credit losses'. The premium received is recognised inthe consolidated income statement in 'fee income from banking services, net' on a straight line basis over the life of the guarantee.
All money market deposits, customer deposits and debt securities in issue are initially recognised at fair value less transaction costs.Subsequently, all special commission-bearing financial liabilities other than those held at FVIS or where fair values have been hedged aremeasured at amortised cost. Amortised cost is calculated by taking into account any discount or premium. Premiums are amortised anddiscounts accreted on an effective yield basis to maturity and taken to special commission expense.Financial liabilities in an effective fair value hedge relationship are adjusted for fair value changes to the extent of the risk being hedged. Theresultant gain or loss is recognised in the consolidated income statement. For financial liabilities carried at amortised cost, any gain or loss isrecognised in the consolidated income statement when derecognised.
NOTES TO THE CONSOLIDATED FINANCIAL STATEMENTS - continued
Leases entered into by the Group as a lessee, are operating leases. Payments made under operating leases are charged to the consolidatedincome statement on a straight-line basis over the period of the lease. When an operating lease is terminated before the lease period hasexpired, any payment required to be made to the lessor by way of penalty is recognised as an expense in the period in which termination takesplace.
SUMMARY OF SIGNIFICANT ACCOUNTING POLICIES (continued)
Accounting for leases
For the years ended December 31, 2010 and 2009
ProvisionsProvisions are recognised when a reliable estimate can be made by the Bank for a present legal or constructive obligation as a result of pastevents and it is more likely than not that an outflow of resources will be required to settle the obligation.
Financial liabilities
4 years
Cash and cash equivalents
In instances where the Bank is assessed to have transferred a financial asset, the asset is derecognised if the Bank has transferred substantiallyall the risks and rewards of ownership. Where the Bank has neither transferred nor retained substantially all the risks and rewards of ownership,the financial asset is derecognised only if the Bank has not retained control of the financial asset. The Bank recognises separately as assets orliabilities any rights and obligations created or retained in the process.
A financial asset (or a part of a financial asset, or a part of a group of similar financial assets) is derecognised, when the contractual rights toreceive the cash flows from the financial asset expires.
A financial liability (or a part of a financial liability) can only be derecognised when it is extinguished, that is when the obligation specified in thecontract is either discharged, cancelled or expires.
For the purpose of the consolidated statement of cash flows, cash and cash equivalents are defined as those amounts included in cash,balances with SAMA excluding statutory deposits, and due from banks and other financial institutions maturing within three months from the dateof acquisition.
Derecognition of financial instruments
Property and equipmentProperty and equipment are stated at cost and presented net of accumulated depreciation. Freehold land is not depreciated. The cost of otherproperty and equipment is depreciated using the straight-line method over the estimated useful lives of the assets as follows:
5 years3 to 5 years
The assets’ residual values and useful lives are reviewed, and adjusted if appropriate, at each reporting date. Gains and losses on disposals aredetermined by comparing proceeds with carrying amount and are included in consolidated income statement.
Buildings Improvements and decoration of premises Furniture, fixtures and equipment Computer hardware Software programs and automation projects Motor vehicles
33 yearsover the lower of the lease period or 5 years5 to 20 years
13 of 39 - 2/7/2011- 1:32 PM

RIYAD BANK
3.
t )
u )
v)
w )
4.2010 2009
SAR' 000 SAR' 0002,562,125 2,099,6216,137,435 6,092,788
14,479,000 15,226,89423,178,560 23,419,303
5.2010 2009
SAR' 000 SAR' 00083,354 80,455
4,605,400 8,624,0074,688,754 8,704,462
Investment management servicesThe Group offers investment services to its customers, which include management of certain investment funds. Fees earned are disclosedunder related party transactions. Assets held in trust or in a fiduciary capacity are not treated as assets of the Group and accordingly, are notincluded in the consolidated financial statements.
End of service benefitsBenefits payable to the employees of the Bank at the end of their services are accrued in accordance with the guidelines set by the SaudiArabian Labor Regulations and are included in other liabilities in the consolidated statement of financial position.
Zakat Under Saudi Arabian Zakat and Income Tax Laws, Zakat is the liabilities of shareholders. Zakat is computed on the shareholders’ equity or netincome using the basis defined under the Zakat regulations. Zakat is not charged to the Group’s consolidated income statement as they arededucted from the dividends paid to the shareholders.
TotalReverse repos with SAMAStatutory deposit
In accordance with the Banking Control Law and regulations issued by the Saudi Arabian Monetary Agency (SAMA), the Bank is required tomaintain a statutory deposit with SAMA at stipulated percentages of its demand, savings, time and other deposits, calculated at the end of eachmonth. The statutory deposit with SAMA is not available to finance the Bank's day-to-day operations and therefore are not part of cash and cashequivalents.
Total
DUE FROM BANKS AND OTHER FINANCIAL INSTITUTIONS
Current accountsMoney market placements
SUMMARY OF SIGNIFICANT ACCOUNTING POLICIES (continued)
NOTES TO THE CONSOLIDATED FINANCIAL STATEMENTS - continuedFor the years ended December 31, 2010 and 2009
Cash in hand and other balances
Non-interest based banking productsIn addition, to the conventional banking, the Bank offers its customers certain non-interest based banking products, which are approved by itsShariah Board. These products include Murabaha, Tawaraq, Istisna’a and Ijara. These banking products are accounted for using IFRS and arein conformity with the accounting policies described in these consolidated financial statements.
CASH AND BALANCES WITH SAMA
14 of 39 - 2/7/2011- 1:32 PM

RIYAD BANK
6.a)
i) Held as FVIS
ii) Available for sale
2010 2009 2010 2009 2010 2009 40,545 15,159 8,997,997 8,455,293 9,038,542 8,470,452 - - 1,764,956 1,522,852 1,764,956 1,522,852 138,598 137,737 2,268,717 2,046,188 2,407,315 2,183,925 947,760 732,398 129,846 109,059 1,077,606 841,457 1,126,903 885,294 13,161,516 12,133,392 14,288,419 13,018,686
iii) Other investments held at amortised cost
2010 2009 2010 2009 2010 2009 13,321,266 9,838,124 1,297,242 857,345 14,618,508 10,695,469 3,859,396 6,305,151 38,643 275,811 3,898,039 6,580,962 17,180,662 16,143,275 1,335,885 1,133,156 18,516,547 17,276,431
iv) Held to maturity
2010 2009 2010 2009 2010 2009 404,722 442,801 612,753 1,570,159 1,017,475 2,012,960 404,722 442,801 612,753 1,570,159 1,017,475 2,012,960
18,712,287 17,471,370 15,110,154 14,836,707 33,822,441 32,308,077
NOTES TO THE CONSOLIDATED FINANCIAL STATEMENTS - continued
Fixed rate securities
INVESTMENTS, NET
International
Investment securities are classified as follows:
International
Investments, net
Fixed rate securitiesHeld to maturity
International investments above includes investment portfolios of SAR 11.3 billion ( 2009: SAR 9.8 billion) which are externally managed.
Domestic International
Floating rate securitiesOther investments held at amortised cost
TotalSAR' 000
Total
Mutual funds
Available for sale, net
SAR' 000
For the years ended December 31, 2010 and 2009
SAR' 000
On September 1, 2008, the Group reclassified investments held in trading portfolio reported under its investments at fair value through incomestatement ("FVIS") category to the Available for sale category.The carrying and fair value of these reclassified investments as at December 31, 2010 was SAR 3,553 million (December 31, 2009: SAR 3,278million).
Floating rate securities
Domestic
Fixed rate securities
Had the reclassification not occurred, the consolidated income statement for the year ended December 31, 2010, would have included fair valuegain on such reclassified investments amounting to SAR 292.1 million (31 December 2009: unrealised fair value gain SAR 576.1 million).
Domestic Total
Equities
15 of 39 - 2/7/2011- 1:32 PM

RIYAD BANK
6.b)
Quoted Unquoted Total Quoted Unquoted Total 10,328,159 14,346,366 24,674,525 7,691,474 13,487,407 21,178,881 3,863,651 1,799,344 5,662,995 3,083,863 5,019,951 8,103,814 637,826 480,352 1,118,178 549,066 333,245 882,311 2,407,315 - 2,407,315 2,183,925 - 2,183,925 - (40,572) (40,572) - (40,854) (40,854)17,236,951 16,585,490 33,822,441 13,508,328 18,799,749 32,308,077
c)
i)SAR' 000
Carrying value
Gross unrealised
gain
Gross unrealised
loss
Fair value Carrying value Gross unrealised gain
Gross unrealised loss
Fair value
14,618,508 77,984 (4,927) 14,691,565 10,695,469 28,009 - 10,723,478 3,898,039 50,180 - 3,948,219 6,580,962 8,040 (48,006) 6,540,996 18,516,547 128,164 (4,927) 18,639,784 17,276,431 36,049 (48,006) 17,264,474
ii) Held to maturity SAR' 000
Carrying value
Gross unrealised
gain
Gross unrealised
loss
Fair value Carrying value Gross unrealised gain
Gross unrealised loss
Fair value
1,017,475 23,746 - 1,041,221 2,012,960 25,953 - 2,038,913
d)
SAR' 000 Fixed rate Floating rate Others Total Fixed rate Floating rate Others Totalsecurities securities securities securities
AAA 3,372,997 1,486,239 - 4,859,236 2,963,540 1,152,794 - 4,116,334 AA- to AA+ 14,873,897 2,042,358 - 16,916,255 11,854,160 5,417,353 - 17,271,513 A- to A+ 3,734,750 1,584,441 - 5,319,191 3,565,296 1,315,412 - 4,880,708 Lower than A- 2,297,230 505,782 - 2,803,012 2,557,647 143,103 - 2,700,750 Unrated 395,651 44,175 3,484,921 3,924,747 238,238 75,152 3,025,382 3,338,772 Total 24,674,525 5,662,995 3,484,921 33,822,441 21,178,881 8,103,814 3,025,382 32,308,077
e)2010 2009
SAR' 000 SAR' 000 20,028,755 19,436,296 7,515,232 6,881,102 6,278,454 5,990,679 33,822,441 32,308,077
Fixed rate securitiesFloating rate securitiesTotal
The analysis of unrealised gains and losses and the fair values of other investments held at amortised cost, and held to maturity investments, isas follows:
2010 2009Other investments held at amortised cost
Floating rate securities
20092010SAR' 000
Fixed rate securities
EquitiesMutual fundsAllowance for impairmentInvestments, net
For the years ended December 31, 2010 and 2009NOTES TO THE CONSOLIDATED FINANCIAL STATEMENTS - continued
INVESTMENTS, NET (continued)The analysis of the composition of investments is as follows:
Total
Investments include SAR 4,216 million ( 2009: SAR 2,828 million), which have been pledged under repurchase agreements with customers (note 18 d).The market value of such investments is SAR 4,369 million ( 2009: SAR 2,920 million).
CorporateBanks and other financial institutions
The analysis of investments by counter-party is as follows:
Government and quasi Government
Fixed rate securities
2009
Lower than A- comprise mainly of bonds rated BBB and BB. The unrated category mainly comprises of mutual funds and equities.
Credit quality of investments
2010
2010 2009
16 of 39 - 2/7/2011- 1:32 PM

RIYAD BANK
6.
f)2010 2009
SAR' 000 SAR' 000 40,854 99,871
(282) (59,017) 40,572 40,854
7.a) Loans and advances held at amortised cost
5,358,633 847,429 20,505,072 79,475,447 323,027 106,509,608 100,131 - - 1,641,331 72,023 1,813,485
5,458,764 847,429 20,505,072 81,116,778 395,050 108,323,093 Allowance for impairment (67,797) - - (1,100,321) (47,886) (1,216,004)
5,390,967 847,429 20,505,072 80,016,457 347,164 107,107,089 Portfolio provision - - - - - (1,072,349)Loans and advances held at amortised cost, net 106,034,740
5,895,843 896,004 17,374,959 82,222,814 637,389 107,027,009 78,293 - - 1,143,447 31,812 1,253,552
5,974,136 896,004 17,374,959 83,366,261 669,201 108,280,561 Allowance for impairment (42,022) - - (628,390) (23,187) (693,599)
5,932,114 896,004 17,374,959 82,737,871 646,014 107,586,962 Portfolio provision - - - - - (1,072,349)
106,514,613
b)Portfolio Totalprovision
- - 693,599 693,599 1,072,349 1,765,948 71,003 350,272 780,764 1,202,039 - 1,202,039
(71,003) (350,272) (135,318) (556,593) - (556,593) - - (74,605) (74,605) - (74,605) - - (48,436) (48,436) - (48,436) - - 1,216,004 1,216,004 1,072,349 2,288,353
Portfolio Totalprovision
- - 602,829 602,829 1,072,349 1,675,178 101,417 330,204 485,395 917,016 - 917,016
(101,417) (330,204) (228,581) (660,202) - (660,202) - - (119,145) (119,145) - (119,145) - - (46,899) (46,899) - (46,899) - - 693,599 693,599 1,072,349 1,765,948
* Including overdrafts and other loans
Credit cards Consumer loans
Commercial loans *
TotalAllowances for impairment
TotalCredit cards Consumer loans
Bad debts written offRecoveries of previously provided amounts
Others
2009
Total
Loans and advances above include non-commission based Islamic banking products of SAR 45,301 million (2009: SAR 44,672 million).
Commercial loans *
Allowances for impairment
Consumer loans
Commercial loans
Consumer loans
Total
TotalOthers
Balance at end of the year
Total
Overdrafts
OverdraftsSAR' 0002009
Other movements
Balance at beginning of the yearProvided during the year
Loans and advances held at amortised cost, net
Credit cards
Performing loans and advances, gross
Total Loans and advances
Other movements
SAR' 0002010
Non-performing loans and advances, net
SAR' 000
NOTES TO THE CONSOLIDATED FINANCIAL STATEMENTS - continued
LOANS AND ADVANCES, NET
For the years ended December 31, 2010 and 2009
Movements in allowance for impairment are as follows:
Balance at beginning of the yearProvided during the yearBad debts written offRecoveries of previously provided amounts
Balance at end of the year
These comprise the following:
Non-performing loans and advances, netTotal Loans and advances
Credit cards2010SAR' 000Performing loans and advances, gross
Commercial loans
Balance at end of the yearAmounts recovered/ transferred during the year
INVESTMENTS, NET (continued)
Movements of allowance for impairment on investments:
Balance at beginning of the year
17 of 39 - 2/7/2011- 1:32 PM

RIYAD BANK
7.
c)
i) Neither past due nor impairedCredit cards Consumer
loansCommercial
loans*Total
717,749 19,206,995 84,808,499 104,733,243 - - 91,064 91,064
717,749 19,206,995 84,899,563 104,824,307
Credit cards Consumer loans
Commercial loans*
Total
749,412 16,618,623 86,404,098 103,772,133 - - 144,333 144,333
749,412 16,618,623 86,548,431 103,916,466
ii) Ageing of loans and advances (Past due but not impaired)
72,995 810,740 101,332 985,067 56,685 487,336 138,272 682,293
- - 17,941 17,941 129,680 1,298,076 257,545 1,685,301
88,028 491,158 631,091 1,210,277 58,564 265,178 344,310 668,052
- - 1,232,214 1,232,214 146,592 756,336 2,207,615 3,110,543
* Including overdrafts and other loans
NOTES TO THE CONSOLIDATED FINANCIAL STATEMENTS - continued
LOANS AND ADVANCES, NET
For the years ended December 31, 2010 and 2009
Credit Quality of Loans and Advances
2010SAR' 000
Total
Special Mention category
Standard categorySpecial Mention category
Standard category
Total
Above includes past due but not impaired loans with upto 30 days ageing amounting to SAR 2,457 million as at Dec 31,2010 (2009: SAR 3,526
2009SAR' 000
Total
2010
More than 180 daysFrom 91 - 180 days
From 91 - 180 days
From 31 - 90 days
More than 180 days
From 31 - 90 days
2009
Consumer loans
TotalSAR' 000
Standard category: A credit with good to satisfactory credit quality and repayment ability, where regular monitoring is carried out.
Credit cards
Total
Special Mention category: A credit that requires close monitoring by management due to deterioration in the borrower's financial condition.
SAR' 000Total
Commercial loans*
Credit cards
Consumer loans
Commercial loans*
18 of 39 - 2/7/2011- 1:32 PM

RIYAD BANK
7.
d) Economic sector risk concentration for the loans and advances and allowance for impairment are as follows
Performing Non performing,
net
Allowance for impairment
Loans and advances, net
Performing Non performing,
net
Allowance forimpairment
Loans andadvances, net
20,090 - - 20,090 1,218,726 - - 1,218,726 4,664,535 - - 4,664,535 3,846,294 - - 3,846,294 1,079,112 9,293 8,559 1,079,846 1,167,079 20,623 10,455 1,177,247 15,365,186 268,864 133,968 15,500,082 15,518,903 85,133 23,467 15,580,569 1,902,403 - - 1,902,403 2,605,164 - - 2,605,164 2,437,559 - - 2,437,559 1,800,820 - - 1,800,820 10,037,939 119,460 123,370 10,034,029 8,862,477 182,109 105,235 8,939,351 37,002,582 1,344,468 918,894 37,428,156 38,279,210 895,572 528,748 38,646,034 7,766,495 - - 7,766,495 9,820,346 460 116 9,820,690 2,849,061 19,920 18,784 2,850,197 3,620,452 13,793 9,703 3,624,542 21,352,501 - - 21,352,501 18,270,963 - - 18,270,963 2,032,145 51,480 12,429 2,071,196 2,016,575 55,862 15,875 2,056,562 106,509,608 1,813,485 1,216,004 107,107,089 107,027,009 1,253,552 693,599 107,586,962
(1,072,349) (1,072,349) 106,034,740 106,514,613
e)
8.
Land and buildings
Improvements and decoration
of premises
Furniture, fixtures and
equipment
Computer hardware,
software programs and
automation projects
Motor vehicles
Total2010
Total2009
1,240,327 564,281 281,929 1,605,041 2,369 3,693,947 3,236,843 70,842 81,616 55,595 102,457 - 310,510 462,235 - (1,687) (681) (121) - (2,489) (5,131) 1,311,169 644,210 336,843 1,707,377 2,369 4,001,968 3,693,947
367,778 350,503 213,776 929,458 2,275 1,863,790 1,606,537 24,461 87,489 29,820 135,997 45 277,812 262,248 - (1,687) (681) (121) - (2,489) (4,995) 392,239 436,305 242,915 1,065,334 2,320 2,139,113 1,863,790
As at December 31, 2010 918,930 207,905 93,928 642,043 49 1,862,855 As at December 31, 2009 872,549 213,778 68,153 675,583 94 1,830,157
2010 2009
The Bank in the ordinary course of lending activities holds collaterals as security to mitigate credit risk in the loans and advances. These collateralsmostly include time and demand and other cash deposits, financial guarantees, local and international equities, real estate and other fixed assets. Thecollaterals are held mainly against commercial and consumer loans and are managed against relevant exposures at their net realizable values.Management monitors the market value of the collateral and requests additional collateral in accordance with the underlying agreement when deemednecessary.
SAR' 000
TotalPortfolio provisionLoans and advances, net
Transportation and communication
Consumer loans and credit cards
Mining and quarryingElectricity, water, gas and health Building and constructionCommerce
Land and buildings; and improvements and decoration of premises include work in progress as at December 31, 2010 amounting to SAR 104.6 million(2009: SAR 276.3 million); and SAR 1.9 million (2009: SAR 16.8 million), respectively.
Net book value
Balance at end of the year
DisposalsBalance at end of the year
Accumulated depreciation and amortisationBalance at beginning of the year Charge for the yearDisposals
PROPERTY AND EQUIPMENT, NET
CostBalance at beginning of the year Additions
SAR' 000
For the years ended December 31, 2010 and 2009NOTES TO THE CONSOLIDATED FINANCIAL STATEMENTS - continued
Collateral
LOANS AND ADVANCES, NET (continued)
Government and quasi GovernmentBanks and other financial institutions Agriculture and fishingManufacturing
Other
Services
19 of 39 - 2/7/2011- 1:32 PM

RIYAD BANK
9.2010 2009
SAR' 000 SAR' 000
- banks and other financial institutions 7,234 27,218 - 162,010 167,937 - 347,399 391,976 - 62,986 77,939
579,629 665,070 55,455 66,768 2,674,320 1,817,240 228,098 666,436 3,537,502 3,215,514
10.
a)
b)
c)
d) OptionsOptions are contractual agreements under which the seller (writer) grants the purchaser (holder) the right, but not the obligation, to either buy orsell at a fixed future date or at any time during a specified period, a specified amount of a currency, commodity or financial instrument at a pre-determined price.
Total accrued special commission receivableAccounts receivable Positive fair value of derivatives (note 10)OtherTotal
Forwards and futuresForwards and futures are contractual agreements to either buy or sell a specified currency, commodity or financial instrument at a specified priceand date in the future. Forwards are customized contracts transacted in the over-the-counter market. Foreign currency and special commissionrate futures are transacted in standardized amounts on regulated exchanges and changes in futures contract values are settled daily.
Forward rate agreements are individually negotiated special commission rate contracts that call for a cash settlement for the difference between acontracted special commission rate and the market rate on a specified future date, on a notional principal for an agreed period of time.
Forward rate agreements
DERIVATIVES
In the ordinary course of business, the Bank utilizes the following derivative financial instruments for both trading and hedging purposes:SwapsSwaps are commitments to exchange one set of cash flows for another. For special commission rate swaps, counterparties generally exchangefixed and floating special commission rate payments in a single currency without exchanging principal. For currency swaps, principal, fixed andfloating commission payments are exchanged in different currencies.
Held for trading purposesMost of the Bank’s derivative trading activities relate to sales, positioning and arbitrage. Sales activities involve offering products to customers andbanks in order, inter alia, to enable them to transfer, modify or reduce current and future risks. Positioning involves managing market risk positions withthe expectation of profiting from favourable movements in prices, rates or indices. Arbitrage involves identifying pricing anomalies in different marketsand products, with the expectation of profiting from price differentials between markets or products.
Held for hedging purposesThe Bank adopted a comprehensive system for the measurement and management of risk. Part of the risk management process involves managingthe Bank’s exposure to fluctuations in foreign exchange rates and special commission rates to reduce its exposure to currency and special commissionrate risks to acceptable levels as determined by the Board of Directors within the guidelines issued by SAMA. The Board of Directors has establishedlevels of currency risk by setting limits on counterparty and currency position exposures. Positions are monitored on a daily basis and hedgingstrategies are used to ensure positions are maintained within the established limits. The Board of Directors have also established the level of specialcommission rate risk by setting limits on special commission rate gaps for stipulated periods. Asset and liability special commission rate gaps arereviewed on a periodic basis and hedging strategies are used to reduce special commission rate gap within the established limits.
As part of its asset and liability management, the Bank uses derivatives for hedging purposes in order to adjust its own exposure to currency andspecial commission rate risks. This is generally achieved by hedging specific transactions as well as strategic hedging against overall consolidatedstatement of financial position exposures. Strategic hedging, other than portfolio hedges for special commission rate risks, does not qualify for specialhedge accounting and the related derivatives are accounted for as held for trading.
NOTES TO THE CONSOLIDATED FINANCIAL STATEMENTS - continued
OTHER ASSETS
For the years ended December 31, 2010 and 2009
investmentsloans and advancesother
Accrued special commission receivable
20 of 39 - 2/7/2011- 1:32 PM

RIYAD BANK
10.
Within 1 year 1-3 years 3-5 years
12,866 6,624 - (711) - - 12,155 6,624 -
Within 1 year 1-3 years 3-5 years
15,369 18,863 420 (2,214) (704) - 13,155 18,159 420
Positive fair value
Negative fair value
Notional amount
totalWithin 3 months
3-12 months
1-5 years
Monthly average
3,201 (3,256) 854,455 439,444 - 415,011 1,390,964 2,241,307 (317,957) 63,149,908 47,399,105 15,750,803 - 61,919,694 350,747 (350,997) 1,218,686 859,875 357,211 1,600 944,539
- (9,766) 2,661,795 322,000 1,839,795 500,000 3,149,663
79,065 (1,209) 1,929,011 96,000 735,011 1,098,000 2,199,855 2,674,320 (683,185) 69,813,855 49,116,424 18,682,820 2,014,611 69,604,715
The Bank is exposed to variability in future special commission cash flows on non-trading assets and liabilities which bear specialcommission rate at a variable rate. The Bank uses special commission rate swaps as cash flow hedges of these special commission raterisks.
Fair value hedgesThe Bank uses special commission rate swaps to hedge against the special commission rate risk arising from specifically identified fixedspecial commission rate exposures.
Special commission rate swaps
Held for trading:Special commission rate swapsForward foreign exchange contracts
The table below shows the positive and negative fair values of derivative financial instruments held, together with their notional amounts,analyzed by the term to maturity and monthly average. The notional amounts, which provide an indication of the volumes of the transactionsoutstanding at the year end, do not reflect the amounts of future cash flows involved. These notional amounts, therefore, are neither indicativeof the Bank’s exposure to credit risk, which is generally limited to the positive fair value of the derivatives, nor market risk.
2010SAR' 000
Total
Currency options
Held as fair value hedges:
Held as cash flow hedges:Special commission rate swaps
Notional amounts by term to maturity
Below is the schedule indicating as at 31 December, the periods when the cash flows arising from the hedged item are expected to occur andwhen they are expected to affect profit or loss:
Cash flow hedges
NOTES TO THE CONSOLIDATED FINANCIAL STATEMENTS - continued
DERIVATIVES (continued)
For the years ended December 31, 2010 and 2009
Held for hedging purposes (continued)
2010SAR' 000Cash inflows (assets)Cash outflows (liabilities)Net cash inflow
2009SAR' 000Cash inflows (assets)Cash outflows (liabilities)Net cash inflow
21 of 39 - 2/7/2011- 1:32 PM

RIYAD BANK
10.
Positive fair value
Negative fair value
Notional amount total
Within 3 months
3-12 months
1-5 years
Monthly average
3,976 (3,780) 1,187,680 988,890 11,252 187,538 1,333,755 1,665,124 (243,843) 52,694,695 37,292,726 15,401,969 - 56,373,792 8,422 (8,422) 162,662 8,236 81,286 73,140 2,233,845
917 (12,593) 2,508,083 - 1,290,068 1,218,015 2,389,293
138,801 (2,124) 2,459,075 - 530,000 1,929,075 2,309,022 1,817,240 (270,762) 59,012,195 38,289,852 17,314,575 3,407,768 64,639,707
Fair value
Hedge inception
value RiskPositive
fair valueNegative fair value
1,929,011 1,929,011 Cash flow 79,065 (1,209)
Fixed special commission rate loans 1,247,226 1,226,081 Fair value - (9,766)
Fair value
Hedge inception
value RiskPositive fair
valueNegative fair
value
2,459,075 2,459,075 Cash flow 138,801 (2,124)
Fixed special commission rate loans 2,564,529 2,521,331 Fair value 917 (12,593)
2010 2009SAR' 000 SAR' 000
120,126 113,710 (58,821) 15,377 1,422 (8,961)
62,727 120,126
The net gains on the hedging instruments for fair value hedge is SAR 1.91 million (2009: net gain of SAR 12.7 million). The net losses on the hedgeditem attributable to the hedged risk is SAR 22.94 million (2009: net loss of SAR 2.7 million).
Balance at end of the year
Balance at beginning of the yearGains/ losses from changes in fair value recognised directly in equity
Reconciliation of movements in the other reserve of cash flow hedges:
Losses/ gains removed from equity and included in net special commission income
Hedging instrument
2010SAR' 000Description of hedged items
Special commission rate swaps
Special commission rate swaps
Floating rate notes (including debt securities in issue)
Hedging instrument
Special commission rate swaps
Special commission rate swaps
Floating rate notes (including debt securities in issue)
For the years ended December 31, 2010 and 2009NOTES TO THE CONSOLIDATED FINANCIAL STATEMENTS - continued
DERIVATIVES (continued)
2009SAR' 000
Currency options
Notional amounts by term to maturity
Forward foreign exchange contracts
Held for trading:Special commission rate swaps
The table below shows a summary of hedged items, the nature of the risk being hedged, the hedging instrument and its fair value:
Held as fair value hedges:
Total
Special commission rate swaps
Held as cash flow hedges:Special commission rate swaps
2009SAR' 000Description of hedged items
22 of 39 - 2/7/2011- 1:32 PM

RIYAD BANK
11.2010 2009
SAR' 000 SAR' 000 527,820 1,076,280 10,108,731 15,086,732 10,636,551 16,163,012
12.2010 2009
SAR' 000 SAR' 000 47,939,992 40,451,465 285,581 265,353 70,081,869 77,994,199 8,638,017 6,567,089 126,945,459 125,278,106
2010 2009SAR' 000 SAR' 000
1,533,515 2,487,341 141 153 18,037,118 21,113,411 187,874 123,806 19,758,648 23,724,711
13. DEBT SECURITIES IN ISSUE
14.2010 2009
SAR' 000 SAR' 000Accrued special commission payable
– banks and other financial institutions 7,849 10,294 – customer deposits 223,421 294,395 – debt securities in issue 2,053 2,032
233,323 306,721 787,348 1,023,794 683,185 270,762 3,163,623 3,248,016 4,867,479 4,849,293 Total
Total accrued special commission payableAccounts payable
During April 2006, the Bank issued USD 500 million (SAR 1,875 million) Floating Euro Medium Term Note (EMTN), maturing April 26, 2011, as thefirst tranche of the Notes issuance programme amounting to USD 1,600 million.
Other
OTHER LIABILITIES
Negative fair value of derivatives (note 10)
OtherTotal
Time deposits include deposits against sales of fixed rate bonds of SAR nil (2009: SAR 210 million) with agreement to repurchase the same at fixedfuture dates. Time deposits also include non-interest based deposits of SAR 26,241 million (2009: SAR 27,062 million). Other customers’ depositsinclude SAR 1,917 million (2009: SAR 2,581 million) of margins held for irrevocable commitments.
Total
The above customer deposits include foreign currency deposits as follows:
DemandSavingTimeOther
DemandSavingTime
Other include regular deposits in transit
DUE TO BANKS AND OTHER FINANCIAL INSTITUTIONS
Current accounts
NOTES TO THE CONSOLIDATED FINANCIAL STATEMENTS - continued
Money market deposits
For the years ended December 31, 2010 and 2009
Total
Money market deposits include deposits against sales of fixed rate bonds of SAR 4,136 million (2009: SAR 2,363 million) with agreement torepurchase the same at fixed future dates.
CUSTOMER DEPOSITS
23 of 39 - 2/7/2011- 1:32 PM

RIYAD BANK
15. SHARE CAPITAL
16. STATUTORY RESERVE
17Cash flow
hedgesAvailable for
sale Total
120,126 485,692 605,818 (58,821) 487,550 428,729 1,422 (222,004) (220,582) (57,399) 265,546 208,147 62,727 751,238 813,965
Cash flow hedges
Available for sale
Total
113,710 (1,053,400) (939,690) 15,377 1,420,457 1,435,834 (8,961) 118,635 109,674 6,416 1,539,092 1,545,508 120,126 485,692 605,818
18. COMMITMENTS AND CONTINGENCIESa) Legal proceedings
b) Capital commitments
c) Credit related commitments and contingencies
Transfer to consolidated income statement
Balance at end of the year
Transfer to consolidated income statement Net movement during the year
Balance at beginning of the yearNet change in fair value
Net movement during the year
2009 SAR' 000s
OTHER RESERVES2010SAR' 000Balance at beginning of the yearNet change in fair value
Commitments to extend credit represent the unused portion of authorizations to extend credit, principally in the form of loans and advances,guarantees and letters of credit. With respect to credit risk on commitments to extend credit, the Bank is potentially exposed to a loss in anamount equal to the total unused commitments. However, the likely amount of loss, which cannot readily be quantified, is expected to beconsiderably less than the total unused commitment as most commitments to extend credit are contingent upon customers maintainingspecific credit standards. The total outstanding commitments to extend credit do not necessarily represent future cash requirements, as manyof these commitments could expire or terminate without being funded.
Balance at end of the year
NOTES TO THE CONSOLIDATED FINANCIAL STATEMENTS - continued
The authorised, issued and fully-paid share capital of the Bank consist of 1,500 million shares of SAR 10 each (2009:1,500 million shares of SAR10 each).
For the years ended December 31, 2010 and 2009
Acceptances comprise undertakings by the Bank to pay bills of exchange drawn on customers. The Bank expects most acceptances to bepresented before being reimbursed by the customers.
In accordance with Saudi Arabian Banking Control Law and the Articles of Association of the Bank, a minimum of 25% of the annual net incomeis required to be transferred to the statutory reserve until this reserve equals the paid up capital of the Bank. Accordingly, SAR 706.2 million hasbeen transferred from 2010 net income (2009: SAR 757.6 million). The statutory reserve is not currently available for distribution.
The primary purpose of these instruments is to ensure that funds are available to a customer as required. Guarantee and standby letters ofcredit, which represent irrevocable assurances that the Bank will make payments in the event that a customer cannot meet its obligations tothird parties, carry the same credit risk as loans and advances. Cash requirements under guarantees and standby letters of credit areconsiderably less than the amount of the commitment because the Bank does not generally expect the third party to draw funds under theagreement. Documentary letters of credit, which are written undertakings by the Bank on behalf of a customer authorizing a third party todraw drafts on the Bank up to a stipulated amount under specific terms and conditions, are generally collateralized by the underlyingshipments of goods to which they relate, and therefore have significantly less risk.
As at December 31, 2010 the Bank had capital commitments of SAR 178.7 million (2009: SAR 214.8 million). This includes computerhardware, software, automation projects, construction and equipment purchases.
As at December 31, 2010 there were legal proceedings of a routine nature outstanding against the Bank. No provision has been made asmanagement and in-house legal adviser believes that it is unlikely that any significant loss will arise.
24 of 39 - 2/7/2011- 1:32 PM

RIYAD BANK
18.
c)(i)
Within 3 months
3-12 months
1-5 years
Over 5 years Total
2,645,169 2,879,268 2,785,106 2,977,566 11,287,109 7,220,465 6,353,124 29,851,224 7,764,490 51,189,303 1,327,310 567,093 27,022 190,574 2,111,999 295,298 3,135,622 4,103,268 1,096,228 8,630,416 11,488,242 12,935,107 36,766,620 12,028,858 73,218,827
Within 3 months
3-12 months
1-5 years
Over 5 years Total
1,070,109 4,874,700 1,929,297 2,592,111 10,466,217 2,779,937 10,495,766 28,678,318 2,787,569 44,741,590 1,084,267 478,000 19,523 145,047 1,726,837 204,695 1,149,325 3,232,939 997,886 5,584,845 5,139,008 16,997,791 33,860,077 6,522,613 62,519,489
(ii)2010 2009
SAR' 000 SAR' 000 1,125,000 900,180 56,498,211 47,949,567 15,595,616 13,669,742
73,218,827 62,519,489
d)
Assets Related liabilities
Assets Related liabilities
SAR' 000 SAR' 000 SAR' 000 SAR' 0004,216,499 4,135,748 2,828,491 2,573,020
Assets pledged as collateral with other financial institutions and customers are as follows:
Total
CorporateBanks and other financial institutions
NOTES TO THE CONSOLIDATED FINANCIAL STATEMENTS - continued
COMMITMENTS AND CONTINGENCIES (continued)
Credit related commitments and contingencies (continued)
For the years ended December 31, 2010 and 2009
The contractual maturity structure for the Bank’s commitments and contingencies are as follows:
Total
Assets pledged
Irrevocable commitments to extend credit
Letters of creditLetters of guarantee Acceptances
2010SAR' 000
Irrevocable commitments to extend credit
2009SAR' 000
Letters of guarantee
Government and quasi government
Letters of credit
Total
The outstanding unused portion of non firm commitments as at December 31,2010 which can be revoked unilaterally at any time by the Bank,amounts to SAR 65,301 million (2009: SAR 60,067 million).
The analysis of commitments and contingencies by counterparty is as follows:
Acceptances
Other investments held at amortised cost and Available for sale (note 6,11 and 12)
20092010
25 of 39 - 2/7/2011- 1:32 PM

RIYAD BANK
18.
e)
2010 2009SAR' 000 SAR' 000
22,400 21,068 40,338 41,974 20,882 20,977 83,620 84,019
19.2010 2009
SAR' 000 SAR' 000Investments 328,004 385,658
196,293 515,922 41,004 53,342 565,301 954,922 101,512 202,171
Loans and advances 4,205,714 4,657,201 4,872,527 5,814,294
2010 2009SAR' 000 SAR' 000
94,817 181,181 623,374 1,261,339 12,549 24,588 730,740 1,467,108
20.2010 2009
SAR' 000 SAR' 000
245,137 271,446 1,038,509 868,396 431,693 345,566 1,715,339 1,485,408
230,260 212,828 66,877 50,067 297,137 262,895 1,418,202 1,222,513
21.2010 2009
SAR' 000 SAR' 000 4 65 2,387 178,275 62,750 70,841 65,141 249,181
Realised and unrealised revalation gains on other real estateOther Total
During 2009, the Bank sold lands with a book value of approximately SAR 112.8 million. The sold properties were initially acquired in settlement of certainloans and advances.
OTHER OPERATING INCOME
Gains on disposal of property and equipment
NOTES TO THE CONSOLIDATED FINANCIAL STATEMENTS - continued
COMMITMENTS AND CONTINGENCIES (continued)
Operating lease commitments
For the years ended December 31, 2010 and 2009
Total
SPECIAL COMMISSION INCOME AND EXPENSE
The future minimum lease payments under non-cancelable operating leases where the Bank is the lessee are as follows:
Less than 1 year1 to 5 yearsOver 5 years
Special commission income
Due from banks and other financial institutions
- Available for sale- Other investments held at amortised cost- Held to maturity
TotalDebt securities in issue
Total
Special Commission income accrued on impaired loans and advances recognised in special commission income during the year, is SAR 48.4 million(2009: SAR 46.9 million).
Special commission expenseDue to banks and other financial institutions Customer deposits
Fee and commission expense:- Banking cards and share brokerage
Total fee and commission income
Total fee and commission expenseFee and commission income, net
FEE AND COMMISSION INCOME, NET
Fee and commission income:- Share brokerage and fund management- Trade finance and corporate finance and advisory - Other banking services
- Other banking services
26 of 39 - 2/7/2011- 1:32 PM

RIYAD BANK
22.2010 2009
SAR' 000 SAR' 000 21 39 8,288 7,466 8,309 7,505
23.
24.
25.
2010 2009SAR' 000 SAR' 000
17,041,125 17,326,515 3,795,882 5,118,725 20,837,007 22,445,240
26.
Deposit, credit and investment products for individuals and small to medium sized businesses.
The operating segments are managed separately based on the Group's management and internal reporting structure. The Group’s primary businessis conducted in Saudi Arabia with one international branch. However, the total assets, liabilities, commitments and results of operations of this branchare not material to the Group’s overall consolidated financial statements and as a result have not been separately disclosed. Transactions betweenthe operating segments are on normal commercial terms. Funds are ordinarily reallocated between segments resulting in funding cost transfers.There are no other material items of income or expense between the operating segments.
Due from banks and other financial institutions maturing within three months from the date of acquisitionTotal
OPERATING SEGMENTS
Loss on disposal of property and equipment Other
The Group’s reportable segments under IFRS 8 are as follows:
Cash and balances with SAMA excluding statutory deposit (note 4)
Zakat for the year amounted to approximately SAR 71 million (2009: SAR 85 million).
CASH AND CASH EQUIVALENTSCash and cash equivalents included in the consolidated statement of cash flows comprise the following:
Includes income on capital and unallocated costs pertaining to head office, finance division, human resources, technology services and other supportdepartments and unallocated assets and liabilities.
Investment management services and asset management activities related to dealing, managing, arranging, advising and custody of securities.Investment banking and brokerage
NOTES TO THE CONSOLIDATED FINANCIAL STATEMENTS - continued
PROPOSED GROSS DIVIDEND AND ZAKAT
For the years ended December 31, 2010 and 2009
The net cash dividend after deduction of zakat reached SAR 1,950 million (2009: SAR 1,950 million), resulting in a net dividend to the shareholdersof SAR 1.30 per share (2009: SAR 1.30 per share). The gross dividends for 2010 include interim net dividends of SAR 900 million paid for the firsthalf of 2010 (2009: SAR 900 million). Final dividends, net of zakat of SAR 1,050 million have been proposed for 2010 (2009: SAR 1,050 million).
OTHER OPERATING EXPENSES
Total
EARNINGS PER SHAREBasic and diluted earnings per share for the years ended December 31, 2010 and 2009 is calculated by dividing the net income for the year by theweighted average number of ordinary shares outstanding at end of the year.
Retail
Corporate
Treasury and investments
Other
Principally handling corporate customers’ current accounts, deposits and providing loans, overdrafts and other credit facilities and derivative
Principally providing money market trading and treasury services as well as the management of the Bank’s investment portfolios
27 of 39 - 2/7/2011- 1:32 PM
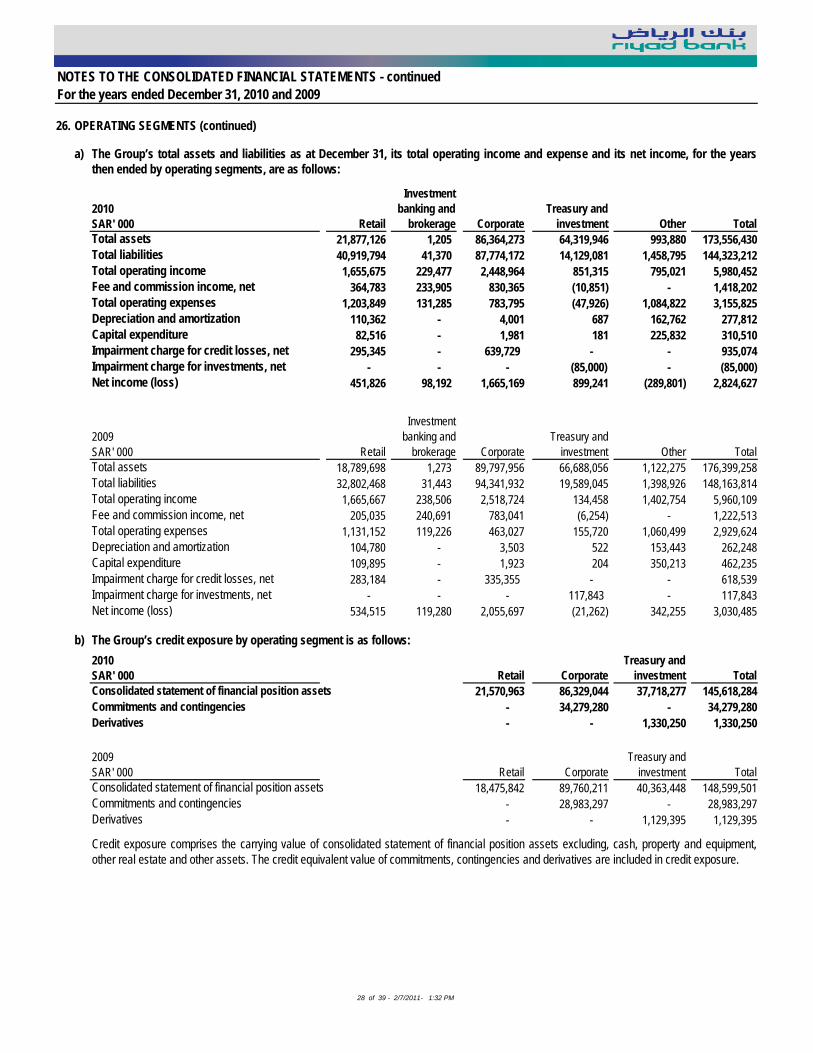
RIYAD BANK
26.
a)
Retail
Investment banking and
brokerage Corporate Treasury and
investment Other Total 21,877,126 1,205 86,364,273 64,319,946 993,880 173,556,430 40,919,794 41,370 87,774,172 14,129,081 1,458,795 144,323,212 1,655,675 229,477 2,448,964 851,315 795,021 5,980,452 364,783 233,905 830,365 (10,851) - 1,418,202 1,203,849 131,285 783,795 (47,926) 1,084,822 3,155,825 110,362 - 4,001 687 162,762 277,812 82,516 - 1,981 181 225,832 310,510 295,345 - 639,729 - - 935,074
- - - (85,000) - (85,000) 451,826 98,192 1,665,169 899,241 (289,801) 2,824,627
Retail
Investment banking and
brokerage Corporate Treasury and
investment Other Total 18,789,698 1,273 89,797,956 66,688,056 1,122,275 176,399,258 32,802,468 31,443 94,341,932 19,589,045 1,398,926 148,163,814 1,665,667 238,506 2,518,724 134,458 1,402,754 5,960,109 205,035 240,691 783,041 (6,254) - 1,222,513 1,131,152 119,226 463,027 155,720 1,060,499 2,929,624 104,780 - 3,503 522 153,443 262,248 109,895 - 1,923 204 350,213 462,235 283,184 - 335,355 - - 618,539
- - - 117,843 - 117,843 534,515 119,280 2,055,697 (21,262) 342,255 3,030,485
b)
Retail CorporateTreasury and
investment Total 21,570,963 86,329,044 37,718,277 145,618,284
- 34,279,280 - 34,279,280 - - 1,330,250 1,330,250
Retail CorporateTreasury and
investment Total 18,475,842 89,760,211 40,363,448 148,599,501
- 28,983,297 - 28,983,297 - - 1,129,395 1,129,395
Consolidated statement of financial position assets
Capital expenditureImpairment charge for credit losses, netImpairment charge for investments, net
Commitments and contingenciesDerivatives
2010SAR' 000
The Group’s credit exposure by operating segment is as follows:
Net income (loss)
2010SAR' 000
2009SAR' 000
Total assets
Consolidated statement of financial position assets
Impairment charge for investments, net
Fee and commission income, netTotal operating expenses
Total liabilities
Capital expenditureImpairment charge for credit losses, net
NOTES TO THE CONSOLIDATED FINANCIAL STATEMENTS - continued
OPERATING SEGMENTS (continued)
The Group’s total assets and liabilities as at December 31, its total operating income and expense and its net income, for the yearsthen ended by operating segments, are as follows:
For the years ended December 31, 2010 and 2009
Net income (loss)
Total operating income
Depreciation and amortization
Credit exposure comprises the carrying value of consolidated statement of financial position assets excluding, cash, property and equipment,other real estate and other assets. The credit equivalent value of commitments, contingencies and derivatives are included in credit exposure.
2009SAR' 000
Commitments and contingenciesDerivatives
Total assetsTotal liabilities
Depreciation and amortization
Fee and commission income, netTotal operating income
Total operating expenses
28 of 39 - 2/7/2011- 1:32 PM

RIYAD BANK
27.
NOTES TO THE CONSOLIDATED FINANCIAL STATEMENTS - continued
CREDIT RISK
Credit exposures arise principally in lending activities that lead to loans and advances, and investment activities. There is also credit risk in off-balance sheet financial instruments, such as loan commitments. The Bank uses internal credit rating tools to assess credit standing of itscounterparties and assigns credit ratings accordingly. Also the Bank uses the external ratings, of the major rating agency, where available. Apotential credit loss might arise due to lack of proper credit analysis of the borrower's credit worthiness, inability to service the debt, lack ofappropriate documentation etc.
The debt securities included in the investment portfolio are mainly sovereign risk. Analysis of investments by counterparty is provided in note 6.For details of the composition of loans and advances refer to note 7. Information on credit risk relating to derivative instruments is provided innote 10 and for commitments and contingencies in note 18.The information on Banks maximum credit exposure by business segment is given innote 26. The information on maximum credit risk exposure and their relative risk weights is also provided in note 33.
Management monitors the market value of collateral, requests additional collateral in accordance with the underlying agreement and monitors themarket value of collateral obtained during its review of the adequacy of the allowance for impairment losses. The Bank regularly reviews its riskmanagement policies and systems to reflect changes in markets products and emerging best practice.
The Bank attempts to control credit risk by monitoring credit exposures, limiting transactions with specific counterparties, and continuallyassessing the creditworthiness of counterparties. The Bank’s risk management policies are designed to identify and to set appropriate risk limitsand to monitor the risks and adherence to limits. Actual exposures against limits are monitored daily. In addition to monitoring credit limits, theBank manages the credit exposure relating to its trading activities by entering into master netting agreements and collateral arrangements withcounterparties in appropriate circumstances, and limiting the duration of exposure. In certain cases, the Bank may also close out transactions orassign them to other counterparties to mitigate credit risk.
The Bank’s credit risk for derivatives, represents the potential cost to replace the derivative contracts if counterparties fail to fulfil their obligation,and to control the level of credit risk taken, the Bank assesses counterparties using the same techniques as for its lending activities.Concentrations of credit risk arise when a number of counterparties are engaged in similar business activities, or activities in the samegeographic region, or have similar economic features that would cause their ability to meet contractual obligations to be similarly affected bychanges in economic, political or other conditions. Concentrations of credit risk indicate the relative sensitivity of the Bank’s performance todevelopments affecting a particular industry or geographical location.
For the years ended December 31, 2010 and 2009
The Bank seeks to manage its credit risk exposure through diversification of lending activities to ensure that there is no undue concentration ofrisks with individuals or groups of customers in specific locations or business. It also takes security when appropriate. The Bank also seeksadditional collateral from the counterparty as soon as impairment indicators are noticed for the relevant individual loans and advances.
29 of 39 - 2/7/2011- 1:32 PM

RIYAD BANK
28.a)
Kingdom of Saudi
Arabia
Other GCC and Middle
East EuropeNorth
AmericaLatin
AmericaSouth
East AsiaOther
countries Total
23,178,548 - 11 1 - - - 23,178,560 419,582 916,981 3,049,177 267,482 - 14,875 20,657 4,688,754
18,712,287 1,266,535 2,827,165 10,311,055 19,325 154,437 531,637 33,822,441 102,394,307 3,029,637 319,244 239,883 - - 51,669 106,034,740 144,704,724 5,213,153 6,195,597 10,818,421 19,325 169,312 603,963 167,724,495
1,114,274 3,661,217 3,189,923 2,061,258 - - 609,879 10,636,551 126,060,848 47,568 837,037 6 - - - 126,945,459
- - 1,873,723 - - - - 1,873,723 127,175,122 3,708,785 5,900,683 2,061,264 - - 609,879 139,455,733
48,705,174 608,842 9,068,632 9,476,739 1,522 276,880 5,081,038 73,218,827
545,658 170,549 511,914 102,129 - - - 1,330,250 22,853,330 275,929 4,516,084 4,738,071 761 112,731 1,782,374 34,279,280
Kingdom of Saudi Arabia
Other GCC and Middle
East EuropeNorth
AmericaLatin
AmericaSouth East
AsiaOther
countries Total
23,419,297 - 5 1 - - - 23,419,303 1,994,679 585,256 4,985,439 976,277 11,695 81,886 69,230 8,704,462
17,471,370 954,060 4,046,469 9,029,953 10,501 329,320 466,404 32,308,077 102,543,267 3,319,867 345,159 191,795 - 56,261 58,264 106,514,613 145,428,613 4,859,183 9,377,072 10,198,026 22,196 467,467 593,898 170,946,455
1,135,778 7,764,993 6,058,702 887,084 - - 316,455 16,163,012 124,662,690 46,838 568,572 6 - - - 125,278,106
- - 1,873,403 - - - - 1,873,403 125,798,468 7,811,831 8,500,677 887,090 - - 316,455 143,314,521
38,197,579 1,103,806 9,253,571 7,688,798 1,427,375 651,719 4,196,641 62,519,489
436,619 94,699 531,640 56,128 - 10,309 - 1,129,395 18,039,920 522,259 4,608,245 3,839,946 286,102 325,425 1,361,400 28,983,297
b)
2010 2009 2010 2009SAR' 000 SAR' 000 SAR' 000 SAR' 0001,813,485 1,253,552 1,216,004 693,599 1,813,485 1,253,552 1,216,004 693,599
NOTES TO THE CONSOLIDATED FINANCIAL STATEMENTS - continued
CONCENTRATION OF RISKS OF FINANCIAL ASSETS WITH CREDIT RISK EXPOSURE AND FINANCIAL LIABILITIES (continued)
For the years ended December 31, 2010 and 2009
2009SAR' 000
The distribution by geographical region for major categories of assets, liabilities, commitments and contingencies and credit exposure are asfollows:
2010SAR' 000AssetsCash and balances with SAMADue from banks and other financial institutionsInvestments, net
AssetsCash and balances with SAMADue from banks and other financial institutionsInvestments, net Loans and advances, net
Liabilities
Total
Due to banks and other financial institutionsCustomer deposits
Total
Commitments and contingencies
Debt securities in issue
Maximum credit exposure (stated at credit equivalent amounts)DerivativesCommitments and contingencies
The distributions by geographical concentration of non-performing loans and advances and specific allowance for credit losses, which is entirelyattributable to Saudi Arabia is as follows:
Total
Allowance for credit losses
Non-performing loans and advances, net
Kingdom of Saudi Arabia
Loans and advances, net Total
LiabilitiesDue to banks and other financial institutionsCustomer depositsDebt securities in issue
Commitments and contingencies
Total
Commitments and contingencies
Maximum credit exposure (stated at credit equivalent amounts)Derivatives
30 of 39 - 2/7/2011- 1:32 PM

RIYAD BANK
29.
Foreign exchange
rate risk
Special commission
rate risk
Equity price risk
Overall risk
1.40 2.48 - 3.070.98 1.92 - 2.293.25 5.48 - 5.390.51 0.45 - 0.83
Foreign exchange
rate risk
Special commission
rate risk
Equity price risk
Overall risk
6.41 2.20 - 6.2815.39 2.10 - 15.4362.24 6.83 - 62.251.39 0.48 - 1.57
This means that the VaR that the Bank measures is an estimate (using a confidence level of 95% and 99% of the potential loss) that is notexpected to be exceeded if the current market positions were to be held unchanged for one day or 10 days. The use of 99% confidence leveldepicts that within a 1-day horizon, losses exceeding VaR figure should occur, on average, not more than once every hundred days.
VaR as at December 31, 2010Average VaR for 2010
VaR as at December 31, 2009
The VaR represents the risk of portfolios at the close of a business day, and it does not account for any losses that may occur beyond thedefined confidence interval. The actual trading results however, may differ from the VaR calculations and, in particular, the calculation does notprovide a meaningful indication of profits and losses in stressed market conditions.To overcome the VaR limitations mentioned above, the Bank also carries out stress tests of both non-trading and trading portfolios to simulateconditions outside normal confidence intervals using six stress scenarios for the entire Bank. The potential losses occurring under stress testconditions are reported regularly to the Bank's Asset Liability Committee (ALCO) for their review.The Bank’s VaR related information for the year ended December 31, 2010 and 2009 using a 1 day holding period at 99% confidence interval isas under. All the figures are in million SAR:
2010
a) Market Risk - Trading BookThe Bank has set limits (exposure based limits) for the acceptable level of risks in managing the trading book. In order to manage the marketrisk in trading book, the Bank periodically applies a VaR methodology to assess the market risk positions held and also to estimate the potentialeconomic loss based on a set of assumptions and changes in market conditions. A VaR methodology estimates the potential negative change in market value of a portfolio at a given confidence level and over a specified timehorizon. The Bank uses variance-covariance approach for calculating VaR for trading book based on historical data (of 1 year). VaR models areusually designed to measure the market risk in a normal market environment and therefore the use of VaR has limitations because it is basedon historical correlations and volatilities in market prices and assumes that the future movements will follow a statistical distribution. The Bank calculates VaR on the basis of the following:1. 1 day holding period at 95% confidence interval for internal reporting 2. 10 days holding period at 99% confidence interval for regulatory capital computation (under IMA approach of Basel II Accord that the Bankplans to adopt in near future)3. 1 day holding period at 99% confidence interval for internal reporting and for disclosure purposes.
MARKET RISK Market Risk is the risk that the fair value or future cash flows of the financial instruments will fluctuate due to changes in market variables suchas special commission rates, foreign exchange rates, commodity and equity prices. The Bank classifies exposures to market risk into eithertrading or non-trading/ banking-book. The market risk for the trading book is managed and monitored using a VaR methodology. Market risk forthe non-trading book is managed and monitored using a combination of VaR, stress testing and sensitivity analysis
For the years ended December 31, 2010 and 2009NOTES TO THE CONSOLIDATED FINANCIAL STATEMENTS - continued
Maximum VaR for 2010Minimum VaR for 2010
2009
Average VaR for 2009Maximum VaR for 2009Minimum VaR for 2009
31 of 39 - 2/7/2011- 1:32 PM

RIYAD BANK
29.
i)
2010
6 months or less
1 year or less
1-5 years Over 5 years
+ 100 153.76 - - - - - + 100 (104.10) 2.51 0.96 28.53 185.82 217.82 + 100 6.00 0.46 0.49 7.29 9.93 18.17 + 100 (3.56) 0.03 0.21 0.93 1.88 3.05 + 100 19.23 - - - - - + 100 5.01 0.04 0.18 2.07 - 2.29
6 months or less
1 year or less
1-5 years Over 5 years
- 100 (164.43) - - - - - - 100 28.81 (2.51) (0.96) (28.53) (185.82) (217.82)- 100 (5.74) (0.46) (0.49) (7.29) (9.93) (18.17)
GBP - 100 2.24 (0.03) (0.21) (0.93) (1.88) (3.05)JPY - 100 (11.00) - - - - -
- 100 (5.47) (0.04) (0.18) (2.07) - (2.29)
SARUSD
GBPJPY
EUR
NOTES TO THE CONSOLIDATED FINANCIAL STATEMENTS - continued
Special commission rate risk
MARKET RISK (continued)
b) Market Risk - Banking Book
For the years ended December 31, 2010 and 2009
Special commission rate risk arises from the possibility that the changes in special commission rates will affect either the fair values orthe future cash flows of the financial instruments. The Bank has established Net special commission Income at Risk and Market Valueat Risk (MVaR) limits that are monitored by ALCO. There are gap limits to accommodate Forward FX and Money Market for allcurrencies. The Bank monitors positions daily and uses hedging strategies to ensure maintenance of positions within the establishedgap limits. The following table depicts the sensitivity to a reasonable possible change in special commission rates, with other variables heldconstant, on the Bank’s consolidated income statement or equity. The sensitivity of the income is the effect of the assumed changes inspecial commission rates on the net special commission income for one year, on the non-trading financial assets and financial liabilitiesheld as at December 31, 2010 & 2009, including the effect of hedging instruments. The sensitivity of equity is calculated by revaluingthe fixed rate Available for sale financial assets, including the effect of any associated hedges as at December 31, 2010 & 2009 for theeffect of assumed changes in special commission rates. The sensitivity of equity is analyzed by maturity of the asset or swap. All thebanking book exposures are monitored and analyzed in currency concentrations and relevant sensitivities are disclosed in SAR million.
Currency Increase in basis
Sensitivity of special
commission income
Sensitivity of equity Total
Currency Decrease in basis
Sensitivity of special
commission income
Sensitivity of equity Total
SAR
Others
USD
Others
EUR
32 of 39 - 2/7/2011- 1:32 PM

RIYAD BANK
29.
i)
2009
6 months or less
1 year or less 1-5 years Over 5 years
+ 100 218.96 - - - - - + 100 (117.26) 1.12 1.51 20.40 121.14 144.17 + 100 (23.88) 0.27 0.52 5.20 10.56 16.55
GBP + 100 (6.21) - - 0.27 3.59 3.86 JPY + 100 16.75 - - - - -
+ 100 2.08 0.05 0.05 1.10 0.48 1.68
6 months or less
1 year or less 1-5 years Over 5 years
- 100 (199.38) - - - - - - 100 74.38 (1.12) (1.51) (20.40) (121.14) (144.17)- 100 19.87 (0.27) (0.52) (5.20) (10.56) (16.55)
GBP - 100 9.91 - - (0.27) (3.59) (3.86)JPY - 100 (12.72) - - - - -
- 100 (3.97) (0.05) (0.05) (1.10) (0.48) (1.68)
Special Commission sensitivity of assets, liabilities and off statement of financial position itemsThe Bank manages exposure to the effects of various risks associated with fluctuations in the prevailing levels of market specialcommission rates on its financial position and cash flows. The Bank is exposed to special commission rate risk as a result of mismatchesor gaps in the amounts of assets and liabilities and off statement of financial position instruments that mature or re-price in a given period.The Bank manages this risk by matching the re-pricing of assets and liabilities through risk management strategies.
SARUSD
Others
EUR
Decrease in basis
Sensitivity of special
commission income
Increase in basis
Sensitivity of special
commission income
Sensitivity of equity Total
SAR
NOTES TO THE CONSOLIDATED FINANCIAL STATEMENTS - continued
Special commission rate risk
MARKET RISK (continued)b) Market Risk - Banking Book
For the years ended December 31, 2010 and 2009
Currency
Others
Currency
USD EUR
TotalSensitivity of equity
33 of 39 - 2/7/2011- 1:32 PM

RIYAD BANK
29.
i)
Within 3 months
3-12 months
1-5 years
Over 5 years
Non special commission
bearing Total
14,479,000 - - - 8,699,560 23,178,560 3,734,726 876,251 - - 77,777 4,688,754 12,387,326 7,038,301 6,373,542 4,538,351 3,484,921 33,822,441 42,465,652 23,342,528 35,127,132 5,099,428 - 106,034,740 - - - - 431,578 431,578 - - - - 1,862,855 1,862,855 - - - - 3,537,502 3,537,502 73,066,704 31,257,080 41,500,674 9,637,779 18,094,193 173,556,430
9,751,133 357,598 - - 527,820 10,636,551 49,364,899 21,911,047 - - 55,669,513 126,945,459 1,873,723 - - - - 1,873,723 - - - - 4,867,479 4,867,479 - - - - 29,233,218 29,233,218 60,989,755 22,268,645 - - 90,298,030 173,556,430
12,076,949 8,988,435 41,500,674 9,637,779 (72,203,837)
1,301,749 (1,854,750) 553,001 - - 13,378,698 7,133,685 42,053,675 9,637,779 (72,203,837)
13,378,698 20,512,383 62,566,058 72,203,837 -
Within 3 months
3-12 months
1-5 years
Over 5 years
Non special commission
bearing Total
15,226,894 - - - 8,192,409 23,419,303 7,870,104 760,974 - - 73,384 8,704,462 12,927,791 7,545,858 5,432,333 3,376,713 3,025,382 32,308,077 48,989,810 24,531,453 25,979,649 7,013,701 - 106,514,613 - - - - 407,132 407,132 - - - - 1,830,157 1,830,157 - - - - 3,215,514 3,215,514 85,014,599 32,838,285 31,411,982 10,390,414 16,743,978 176,399,258
14,610,233 476,499 - - 1,076,280 16,163,012 55,128,379 24,062,714 - - 46,087,013 125,278,106 1,873,403 - - - - 1,873,403 - - - - 4,849,293 4,849,293 - - - - 28,235,444 28,235,444 71,612,015 24,539,213 - - 80,248,030 176,399,258
13,402,584 8,299,072 31,411,982 10,390,414 (63,504,052)
783,999 (750,000) (33,999) - - 14,186,583 7,549,072 31,377,983 10,390,414 (63,504,052) 14,186,583 21,735,655 53,113,638 63,504,052 -
Shareholders’ equityTotal liabilities and shareholders’ equity
Special commission rate risk (continued)b) Market Risk - Banking Book (continued)
Customer deposits
Other liabilities
2010SAR' 000AssetsCash and balances with SAMADue from banks and other financial institutionsInvestments, netLoans and advances, net
MARKET RISK (continued)
For the years ended December 31, 2010 and 2009NOTES TO THE CONSOLIDATED FINANCIAL STATEMENTS - continued
The table below summarizes the Bank’s exposure to special commission rate risks. Included in the table are the Bank’s assets and liabilities at carryingamounts, categorized by the earlier of contractual re-pricing or the maturity dates.
Other real estateProperty and equipment, netOther assetsTotal assets
Due to banks and other financial institutionsLiabilities and shareholders’ equity
Debt securities in issue
Cash and balances with SAMADue from banks and other financial institutions
2009SAR' 000Assets
Special commission rate sensitivity -On statement of financial position gapSpecial commission rate sensitivity -Off statement of financial position gapTotal special commission rate sensitivity gapCumulative special commission rate sensitivity gap
Investments, netLoans and advances, net
Other liabilities
Other real estateProperty and equipment, netOther assetsTotal assets
Liabilities and shareholders’ equityDue to banks and other financial institutionsCustomer depositsDebt securities in issue
Shareholders’ equityTotal liabilities and shareholders’ equitySpecial commission rate sensitivity -On statement of financial position gap
The off statement of financial position gap represents the net notional amounts of derivative financial instruments, which are used to manage thecommission rate risk.
Special commission rate sensitivity -Off statement of financial position gapTotal special commission rate sensitivity gapCumulative special commission rate sensitivity gap
34 of 39 - 2/7/2011- 1:32 PM

RIYAD BANK
29.
ii)
+1 6.14 +1 0.32
GBP +1 0.18 JPY +1 0.10 Others +1 0.24
+1 4.89 +1 0.24
GBP +1 0.06 JPY +1 0.14 Others +1 0.10
iii)
2010Long (short)
SAR' 000
2009Long (short)
SAR' 000US Dollar 1,263,249 777,983 Japanese 51,702 55,174 Euro (27,724) 39,285 Pound 13,507 27,443 Other (20,211) 13,622
iv)
+5 27.64 +5 25.94 +10 55.27 +10 51.88 -5 (27.64) -5 (25.94)-10 (55.27) -10 (51.88)
30.Liquidity risk is the risk that the Bank will be unable to meet its net funding requirements. Liquidity risk can be caused by market disruptions orcredit downgrades, which may cause certain sources of funding to dry up immediately. To mitigate this risk, management has diversified fundingsources and assets are managed with liquidity in mind, maintaining an appropriate balance of cash, cash equivalents and readily marketablesecurities.
LIQUIDITY RISK
NOTES TO THE CONSOLIDATED FINANCIAL STATEMENTS - continued
Currency risk represents the risk of change in the value of financial instruments due to changes in foreign exchange rates. The Board hasset limits on positions by currencies, which are monitored daily, and hedging strategies are also used to ensure that positions are maintainedwithin the limits. The table below shows the currencies to which the Bank has a significant exposure as at December 31, 2010 & 2009 on its non-tradingmonetary assets and liabilities and forecasted cash flows. The analysis calculates the effect of reasonable possible movement of thecurrency rate against SAR, with all other variables held constant, on the consolidated income statement (due to the fair value of the currencysensitive non-trading monetary assets and liabilities) and equity (due to change in fair value of currency swaps and forward foreignexchange contracts used as cash flow hedges). A positive effect shows a potential increase in consolidated income statement or equity;whereas a negative effect shows a potential net reduction in consolidated income statement or equity.
MARKET RISK (continued)
b) Market Risk - Banking Book
For the years ended December 31, 2010 and 2009
Currency risk
EUR
Currency ExposuresAs at December 31, 2009
Currency Exposures (SAR Millions)As at December 31, 2010
EUR
Change in currency rate in %
Effect on net income
USD
Change in currency rate in %
Effect on net income
USD
Foreign currency risk
Market Indices
Tadawal
The effect on the Bank’s equity investments held as Available for sale due to reasonable possible change in equity indices, with all othervariables held constant, is as follows:
The Bank manages exposure to effects of fluctuations in prevailing foreign currency exchange rates on its financial position and cash flows. TheBoard of Directors sets limits on the level of exposure by currency and in total for overnight positions, which are monitored daily. At the end of theyear, the Bank had the following significant net exposures denominated in foreign currencies:
Change in equity indices %
December 31, 2010 December 31, 2009Effect in SAR
millions
Banking Book -Equity Price riskEquity risk refers to the risk of decrease in fair values of equities in the Bank’s non-trading investment portfolio as a result of reasonablepossible changes in levels of equity indices and the value of individual stocks.
Change in equity
Effect in SAR millions
35 of 39 - 2/7/2011- 1:32 PM

RIYAD BANK
30.
Within 3 months 3-12 months
1-5 years
Over 5 years Total
10,289,929 357,907 - - 10,647,836 103,957,418 22,733,762 622,095 6,065 127,319,340
4,828 1,874,539 - - 1,879,367
11,579 22,121 17,553 - 51,253 114,263,754 24,988,329 639,648 6,065 139,897,796
Within 3 months 3-12 months
1-5 years
Over 5 years Total
15,704,107 476,847 - - 16,180,954 99,433,252 24,779,834 1,550,888 6,086 125,770,060
3,345 8,215 1,878,466 - 1,890,026 15,965 49,737 33,972 - 99,674
115,156,669 25,314,633 3,463,326 6,086 143,940,714
Within 3 months 3-12 months
1-5 years
Over 5 years
No fixed maturity Total
17,041,125 - - - 6,137,435 23,178,560 3,812,503 876,251 - - - 4,688,754 9,181,653 6,551,301 9,919,213 4,685,353 3,484,921 33,822,441 33,113,612 21,142,761 40,476,950 11,301,417 - 106,034,740 - - - - 431,578 431,578 - - - - 1,862,855 1,862,855
3,253,949 - - - 283,553 3,537,502 66,402,842 28,570,313 50,396,163 15,986,770 12,200,342 173,556,430
10,278,953 357,598 - - - 10,636,551 103,633,711 22,683,588 622,095 6,065 - 126,945,459 - 1,873,723 - - - 1,873,723
916,508 - - - 3,950,971 4,867,479 - - - - 29,233,218 29,233,218
114,829,172 24,914,909 622,095 6,065 33,184,189 173,556,430
Due to banks and other financial institutionsCustomer depositsDebt securities in issueDerivative financial instruments (gross contractual amounts
Due to banks and other financial institutionsCustomer depositsDebt securities in issueDerivative financial instruments (gross contractual amounts payable)
NOTES TO THE CONSOLIDATED FINANCIAL STATEMENTS - continued
Management monitors the maturity profile to ensure that adequate liquidity is maintained. The daily liquidity position is monitored and regularliquidity stress testing is conducted under a variety of scenarios covering both normal and more severe market conditions. All liquidity policies andprocedures are subject to review and approval by ALCO. Daily reports cover the liquidity position of both the Bank and the foreign branch. Asummary report, including any exceptions and remedial action taken, is submitted regularly to ALCO.
The table below summarizes the maturity profile of the Bank's financial liabilities at 31 December 2010 and 2009 based on contractual undiscountedrepayment obligations. As special commission payments up to contractual maturity are included in the table, totals do not match with the statementof financial position. The contractual maturities of liabilities have been determined based on the remaining period at the reporting date to thecontractual maturity date and do not take into account the effective expected maturities. The Bank expects that many customers will not requestrepayment on the earliest date the Bank could be required to pay and the table does not affect the expected cash flows indicated by the Bank'sdeposit retention history. The undiscounted maturity profile of the liabilities is as follows:
2010SAR' 000Financial liabilities
For the years ended December 31, 2010 and 2009
LIQUIDITY RISK (continued)
In accordance with Banking Control Law and the regulations issued by SAMA, the Bank maintains a statutory deposit with SAMA equal to 7% (2009:7%) of total demand deposits and 4% (2009: 4%) of saving and time deposits. In addition to the statutory deposit, the Bank also maintains liquidreserves of not less than 20% of its deposit liabilities, in the form of cash, gold, Saudi Government Development Bonds or assets which can beconverted into cash within a period not exceeding 30 days. The Bank has the ability to raise additional funds through repo facilities with SAMA upto75 % of the nominal value of bonds held by the Bank.
Financial liabilities
Investments, netLoans and advances, netOther real estate
2010SAR'000AssetsCash and balances with SAMADue from banks and other financial institutions
Total undiscounted financial liabilities
The table below summarises the maturity profile of the Bank’s assets and liabilities. The contractual maturities of assets and liabilities have beendetermined on the basis of the remaining period at the reporting date to the contractual maturity date and do not take account of the effectivematurities as indicated by the Bank’s deposit retention history. The amounts disclosed in the table are the contractual undiscounted cash flows,whereas the Bank manages the inherent liquidity risk based on expected undiscounted cash inflows.The maturity profile of the Bank's assets andliabilities is as follows:
Total undiscounted financial liabilities
2009SAR' 000
Total assets
Property and equipment, netOther assets
Liabilities and shareholders’ equityDue to banks and other financial institutions
Total liabilities and shareholders’ equity
Customer deposits
Other liabilitiesDebt securities in issue
Shareholders’ equity 36 of 39 - 2/7/2011- 1:32 PM

RIYAD BANK
30.
Within 3 months 3-12 months
1-5 years
Over 5 years
No fixed maturity Total
17,326,515 - - - 6,092,788 23,419,303 7,943,490 760,972 - - - 8,704,462 7,481,995 9,744,858 8,532,114 3,523,728 3,025,382 32,308,077 41,657,369 24,881,257 27,983,437 11,992,550 - 106,514,613
- - - - 407,132 407,132 - - - - 1,830,157 1,830,157
2,482,310 - - - 733,204 3,215,514 76,891,679 35,387,087 36,515,551 15,516,278 12,088,663 176,399,258
15,686,513 476,499 - - - 16,163,012 99,011,998 24,710,220 1,549,802 6,086 - 125,278,106
- - 1,873,403 - - 1,873,403 577,483 - - - 4,271,810 4,849,293
- - - - 28,235,444 28,235,444 115,275,994 25,186,719 3,423,205 6,086 32,507,254 176,399,258
31.
- 2,674,320 - 2,674,320 11,022,232 2,786,567 479,620 14,288,419
- 683,185 - 683,185
- 1,817,240 - 1,817,240 8,866,208 3,820,248 332,230 13,018,686
- 270,762 - 270,762
2010 2009 SAR' 000 SAR' 000
Opening balance 332,230 257,878 Total gains or losses
(891) 382 16,512 34,130
Purchases 131,769 39,840 Closing balance 479,620 332,230
Financial Liabilities
Fair value and fair value hierarchy
Financial assetsDerivative financial instrumentsFinancial investments Available for sale
Level 1: quoted prices in active markets for the same instrument (i.e., without modification or repacking):
Level 1 Level 2 Level 3 TotalSAR' 0002010
LIQUIDITY RISK (continued)The maturity profile of the Bank's assets and liabilities is as follows (continued):
For the years ended December 31, 2010 and 2009NOTES TO THE CONSOLIDATED FINANCIAL STATEMENTS - continued
Investments, netLoans and advances, netOther real estateProperty and equipment, net
2009SAR' 000AssetsCash and balances with SAMADue from banks and other financial institutions
Derivative financial instruments
Total liabilities and shareholders’ equity
Due to banks and other financial institutionsCustomer deposits
Other liabilitiesDebt securities in issue
FAIR VALUES OF FINANCIAL ASSETS AND LIABILITIESThe Bank uses the following hierarchy for determining and disclosing the fair value of financial instruments:
Level 2: quoted prices in active markets for similar assets and liabilities or other valuation techniques for which all significant inputs are based onobservable market data: andLevel 3: valuation techniques for which any significant input is not based on observable market data.
Liabilities and shareholders’ equity
Other assetsTotal assets
Assets available to meet all of the liabilities and to cover outstanding loan commitments include cash, balances with SAMA, items in the course ofcollection; loans and advances to banks; and loans and advances to customers. The cumulative maturities of commitments and contingencies is given innote 18 c) (i) of the financial statements.
Shareholders’ equity
Level 2 Level 3 Total
Financial assets
2009SAR' 000
Level 1
Derivative financial instrumentsFinancial investments Available for sale
Financial LiabilitiesDerivative financial instruments
The Bank uses the Net Asset Valuation method to fair-value the above Level 3 fair value hierarchy investments. The net asset values of these are derivedfrom the latest available audited financial statements of the investees. Insufficient data is available to permit other valuation methods to be used, andtherefore the potential impact of using alternative assumptions for the valuations cannot be determined.
Reconciliation of movement in Level 3
- recognised in other comprehensive income - recognised in consolidated income statement
37 of 39 - 2/7/2011- 1:32 PM

RIYAD BANK
31.
32.
2010 2009SAR' 000 SAR' 000
a) 4,036,428 5,192,993 24,082,591 24,273,121 974,856 670,570 1,826,001 2,440,179
Executive end of service 26,576 25,112
b) 2,360,469 3,837,139
2010 2009SAR' 000 SAR' 000
101,379 199,797 366,310 716,140 157,894 135,313 4,425 4,543 21,426 23,656 2,273 1,397 5,198 5,198
33.
Capital Ratio Capital RatioSAR' 000 % SAR' 000 %
26,248,816 16.0% 25,111,069 15.7%29,986,016 18.3% 29,120,011 18.2%
Other major shareholders represent shareholdings of 5% or more of the Bank’s issued share capital.
Other expenses
Directors, key management personnel, other major shareholders' and their affiliates:
For the years ended December 31, 2010 and 2009
Key management personnel are those persons, including a non-executive director, having authority and responsibility for planning, directing andcontrolling the activities of the Bank, directly or indirectly.
NOTES TO THE CONSOLIDATED FINANCIAL STATEMENTS - continued
RELATED PARTY TRANSACTIONSIn the ordinary course of its activities, the Bank transacts business with related parties. Related party transactions are governed by the limits setby the Banking Control Laws and regulations issued by SAMA. The balances at December 31, resulting from such transactions are as follows:
Loans and advancesCustomer depositsDerivatives asset (at fair value)Commitments and contingencies (irrevocable)
Bank’s mutual funds:Customers' deposits
Income and expenses pertaining to transactions with related parties included in the financial statements are as follows:
Special commission income
Fees from banking services, net
Executive remuneration and bonusDirectors and committees remuneration and expenses
Special commission expense
Executive end of service
The Group’s objectives when managing capital, are, to comply with the capital requirements set by SAMA; to safeguard the Group’s ability tocontinue as a going concern; and to maintain a strong capital base.
CAPITAL ADEQUACY
Capital adequacy and the use of regulatory capital are monitored daily by the Group’s management. SAMA requires to hold the minimum levelof the regulatory capital of and maintain a ratio of total regulatory capital to the risk-weighted asset at or above the agreed minimum of 8%.
2009
Pursuant to SAMA guidelines regarding implementation of Basel II, Pillar 3 disclosures effective 1 January 2008, the following disclosures havebeen made.
2010
Total regulatory capital (Tier 1 + Tier 2 )Tier 1 capital
The Group maintains an actively managed capital base to cover risks inherent in the business. The adequacy of the Group's capital is monitoredusing, among other measures, the rules and ratios established by the Basel Committee on Banking Supervision and adopted by the SaudiArabian Monetary Agency in supervising the Banks in the Kingdom.
Top consolidated level
The fair values of derivatives are based on the quoted market prices when available or by using the appropriate valuation technique.
FAIR VALUES OF FINANCIAL ASSETS AND LIABILITIES (continued)Fair value is the amount for which an asset could be exchanged or a liability settled between knowledgeable, willing parties in an arm’s lengthtransaction. The fair values of on-statement of financial position financial instruments, except for other investments held at amortised costs and held-to-maturity investments which are carried at amortised cost, are not significantly different from the carrying values included in the financial statements. The fair values of loans and advances, special commission bearing customers’ deposits, debts securities in issue, due from and due to banks which are carried at amortised cost, are not significantly different from the carrying values included in the financial statements, since the current market special commission rates for similar financial instruments are not significantly different from the contracted rates, and for the short duration of due from and due to banks.The estimated fair values of held-to-maturity investments and other investments held at amortised cost are based on quoted market prices whenavailable or pricing models when used in the case of certain fixed rate bonds (respectively). The fair values of these investments are disclosedin note 6.
38 of 39 - 2/7/2011- 1:32 PM

RIYAD BANK
33.2010 2009
SAR' 000 SAR' 000 152,213,239 149,227,902 10,212,100 9,640,338 1,360,097 939,074 163,785,436 159,807,314
34.
.
35.Number of employees
Fixed compensation
Variable compensation
Total compensation
18 21,451 7,244 28,695 400 89,867 16,918 106,785 225 42,994 3,914 46,908 178 12,855 - 12,855 4,681 569,937 67,807 637,744 5,502 737,104 95,883 832,987
36.
37.
38.
39.
40.
Compensation policy is based on the job profile requirement, market practices, nature and level of involvement in risk taking process. It applies to theBank's senior management and all employees and aims to link individual performance to the Bank's overall achievements and soundness.Compensation includes fixed and variable components. Salary revision, performance bonus and other performance linked incentives are decided basedon the performance evaluation process outcome as well as the Bank's financial performance and strategic goals. The Board of Directors has the ultimate responsibility to approve and oversee the Bank's compensation policy. The Nomination and CompensationCommittee, made up of five non executive Directors is in charge of overseeing the compensation system design and effectiveness on behalf of theBoard of Directors as well as preparing the Bank's compensation policy and undertaking its periodic assessment and update to ensure achievement ofthe system objectives and reinforce the Bank's risk management framework. Fixed compensation comprises of salaries and wages and other benefitsand allowances. The variable compensation includes sales incentives, product related rewards and performance related payments.
Employees engaged in risk taking activities
Outsourced employeesOthersTotal
COMPARATIVE FIGURES Other than reclassifications required by adoption of the revised IAS 39 (amendments), certain prior year figures have been reclassified to conform withcurrent year presentation.
BASEL II PILLAR 3 DISCLOSURESUnder Basel II Pillar 3, certain quantitative and qualitative disclosures are required, and these disclosures will be made available on the Bank’s websitewww.riyadbank.com and the annual report, respectively, as required by the Saudi Arabian Monetary Agency. Such disclosures are not subject to reviewor audit by the external auditors.
BOARD OF DIRECTORS' APPROVALThe consolidated financial statements were approved by the Board of Directors on 20 Safar 1432H (corresponding to January 24, 2011).
The Bank’s assets under management include non-interest based funds amounting to SAR 5.9 billion (2009: SAR 6.9 billion).
ISSUED IFRS BUT NOT YET EFFECTIVEThe Bank has chosen not to early adopt IFRS 9, “Financial Instruments”, part of which has been issued, and is mandatory for compliance for the Bank’sfiscal year beginning January 1, 2013. The Bank is currently assessing the implication of the standard on the Group and the timing of its adoption.
The Bank has also chosen not to early adopt revised IAS 24 Related Party and Improvements to IFRSs 2010 – amendments to applicable and relevantstandards and interpretations, which are applicable for annual periods beginning on or after 1 January 2011 and early adoption is permitted.
Total Pillar 1 Risk Weighted Assets
STAFF INVESTMENT SAVINGS PLANS
For the years ended December 31, 2010 and 2009
CAPITAL ADEQUACY (continued)
Credit risk weighted assetsOperational risk weighted assetsMarket risk weighted assets
Risk weighted assets
NOTES TO THE CONSOLIDATED FINANCIAL STATEMENTS - continued
The costs of the above plans were charged to the Bank’s consolidated income statement over the term of the plans.
INVESTMENT MANAGEMENT SERVICESThe Bank offers investment management services to its customers, which include management of certain investment funds with assets totaling of SAR 21.0 billion (2009: SAR 19.9 billion).
The Bank operates a Staff Savings Investment Plan. Under the terms of the Staff Savings Investment Plan, participating employees of the Bank makemonthly contributions by way of a deduction from their salary subject to a maximum of 15 % of their basic salaries. The Bank also contributes on amonthly basis a pre-determined percentage (subject to a maximum of 6 %) of the basic salary of an employee based on the varying service periods.The proceeds are invested in the Bank’s existing range of mutual funds for the benefit of the employees.
STAFF COMPENSATION Categories 2010
SAR' 000 Senior executives requiring SAMA no objections
Employees engaged in control functions
39 of 39 - 2/7/2011- 1:32 PM