Embed Size (px)
Citation preview
RIVM report 250912003/2005 Bacillus cereus: characteristics, behaviour in the gastro-intestinal tract, and interaction with
LM Wijnands, JB Dufrenne, FM van Leusden
This investigation has been performed by order and for the account of Food and Consumer Product Safety Authority (VWA), within the framework of project 250912, Quantitative research of Bacillus cereus within the scope of hazard characterization and exposure assessment, and within the Fifth European Community Framework Programme, within the framework of project QLK1-CT-2001-00854, Bacillus cereus: Preventing Bacillus cereus foodborne poisoning in Europe; detecting hazardous strains, tracing contamination routes and proposing criteria for foods.
RIVM, P.O. Box 1, 3720 BA Bilthoven, telephone: 31 - 30 - 274 91 11; telefax: 31 - 30 - 274 29 71
Caco-2 cells
page 2 of 86 RIVM report 250912003
Rapport in het kort Bacillus cereus: algemene karakteristieken, gedrag in maagdarmkanaal en interactie met Caco-2 cellen. Door het eten van voedsel dat besmet is met de bacterie Bacillus cereus kan diarree ontstaan. Onderzoek naar de bacterie zelf en het ziekmakend proces hebben geleid tot meer kennis over het optreden van de ziekte. Allereerst zijn stammen van de bacterie op grond van specifieke karakteristieken ingedeeld. Hierbij is onder andere gebruik gemaakt van kunstmatig darmsap en lichaamstemperatuur om de groeimogelijkheden van de verschillende stammen Bacillus cereus goed te kunnen bepalen. Daarnaast bleek dat slechts een beperkt aantal stammen ziekte kunnen veroorzaken. Dit zijn voornamelijk stammen die goed groeien bij 37ºC en die zich goed kunnen aanpassen aan omstandigheden zoals die voorkomen in de dunne darm. Een essentiële stap in het ziekmakend proces blijkt de hechting van de Bacillus cereus aan de wand van de dunne darm te zijn. Dit proces is in het onderzoek nagebootst met Caco-2 cellen. Daarnaast kunnen de cellen van de dunne darm aanzetten tot ontkieming en vermenigvuldiging van Bacillus cereus sporen. Sporen zijn bacteriecellen die zich in een soort sluimerstand bevinden. In een wetenschappelijke publicatie zullen gegevens worden gepubliceerd ten aanzien van het vóórkomen van Bacillus cereus bacteriën in voedsel. Trefwoorden: Bacillus cereus, algemene karakteristieken, ziekmakend vermogen, dunne darm, ontkieming.
RIVM report 250912003 page 3 of 86
Abstract Bacillus cereus: characteristics, behaviour in gastro-intestinal tract, and interaction with Caco-2 cells. The consumption of food contaminated with the bacterium Bacillus cereus may lead to diarrhoea. Investigation of characteristics of the bacterium and the pathogenesis increased knowledge regarding the onset of disease. Strains of Bacillus cereus were categorised according to specific characteristics. Besides artificial media to determine the growth characteristics of the strains, simulated intestinal fluid and human body temperature were used. Diarrhoeal disease is mainly caused by strains which grow well at 37ºC and which adapt easily to small intestinal conditions. Adhesion of Bacillus cereus to the epithelium of the small intestine appears to be of vital importance for the onset of disease. Moreover, epithelial cells are able to induce germination of Bacillus cereus spores. These are forms of the bacterium able to withstand a variety of adverse conditions, such as dryness and heat. Data on the occurrence of Bacillus cereus in food commodities in The Netherlands will be published elsewhere. Key words: Bacillus cereus, general characteristics, pathogenesis, small intestine, germination.

page 4 of 86 RIVM report 250912003
RIVM report 250912003 page 5 of 86
Contents
Samenvatting 6
Summary 7
1. Introduction 9
2. Characteristics of Bacillus cereus 11
2.1 Introduction 11 2.2 Materials and Methods 11 2.3 Results 14 2.4 Discussion 16 2.5 Conclusions 17
3. Behaviour of Bacillus cereus in the gastro-intestinal tract under simulated circumstances 19
3.1 Introduction 19 3.2 Materials and Methods 19 3.3 Results 23 3.4 Discussion 28 3.5 Conclusions 33
4. Interaction between Bacillus cereus and differentiated Caco-2 cells (as a model for the epithelium of the small intestine) 35
4.1 Introduction 35 4.2 Materials and Methods 36 4.3 Results 38 4.4 Discussion 40 4.5 Conclusions 42
5. General discussion and conclusion 43
References 45
Appendix 1 Simulated gastric and intestinal fluid 49
Appendix 2 Characteristics of Bacillus cereus 53
Appendix 3 Behaviour of Bacillus cereus in the gastro-intestinal tract under simulated circumstances 63
Appendix 4 Interaction between Bacillus cereus and differentiated Caco-2 cells (as a model for the epithelium of the small intestine) 83
page 6 of 86 RIVM report 250912003
Samenvatting Bacillus cereus is een bacterie die bij vóórkomen in voedsel twee typen aandoeningen kan veroorzaken: het braaksyndroom en het diarreesyndroom. De bacterie kan voorkomen als vegetatieve cel, maar ook als spore. Dit rapport handelt voornamelijk over het diarreesyndroom. Omdat de ziekteverschijnselen van het diarreesyndroom over het algemeen vrij mild van aard zijn en vrij kort duren, wordt zelden een arts geraadpleegd. Daardoor is het moeilijk een goede schatting van het optreden van dit syndroom te maken. Om een betere schatting van het vóórkomen te maken zijn gegevens nodig omtrent de aanwezigheid van B. cereus in voedsel en gegevens ten aanzien van het ziekmakend mechanisme. Ook gegevens over karakteristieke eigenschappen van B. cereus zijn van belang. Gegevens ten aanzien van het vóórkomen van B. cereus in voedsel in Nederland zullen elders worden gepubliceerd. In dit rapport wordt voornamelijk ingegaan op het ziekmakend mechanisme. In hoofdstuk 1 van dit rapport wordt een aantal karakteristieken van circa 30 B. cereus stammen op een rij gezet. Dit betreft vooral gegevens over groeisnelheden en aanpassingsfasen bij diverse temperaturen. Op basis van deze gegevens is een begin gemaakt om de stammen in te delen in psychrotrofe (i.e. stammen die kunnen groeien bij temperaturen < 10°C, maar niet zo goed bij 37°C) en mesofiele stammen (i.e. stammen met goede groei bij 37°C, maar geen groei bij temperaturen < 10°C). Het bleek echter moeilijk op basis van deze gegevens een duidelijk onderscheid te maken tussen psychrotrofe en mesofiele stammen. Groeisnelheden en aanpassingsfasen gemeten in media die de in vivo situatie zo dicht mogelijk benaderen, zoals het gebruik van gesimuleerd darmsap in plaats van artificieel cultuurmedium, maken een beter onderscheid tussen psychrotrofe en mesofiele stammen mogelijk. Tevens blijkt uit ons onderzoek dat de hittegevoeligheid van sporen van psychrotrofe stammen groter is dan die van sporen van mesofiele stammen. Hoofdstuk 2 van het rapport behandelt het gedrag van B. cereus in het maagdarmkanaal. Experimenten met gesimuleerd maag- en darmsap wijzen uit dat mesofiele stammen beter bestand zijn tegen de omstandigheden in het maagdarmkanaal dan psychrotrofe stammen. Niet alleen de temperatuur is daarbij van belang, ook de samenstelling van de inhoud van de dunne darm speelt een rol. In hoofdstuk 3 van dit rapport wordt nader ingegaan op de interactie tussen B. cereus en het epitheel van de dunne darm, het voornaamste doelwit van de enterotoxinen van B. cereus. Dit onderzoek is uitgevoerd met een cellijn die het epitheel simuleert. Cellen van B. cereus blijken te kunnen hechten aan het epitheel van de dunne darm, hetgeen een voorwaarde lijkt voor het optreden van ziekteverschijnselen. Daarnaast kunnen dunne darmcellen sporen van B. cereus aanzetten tot ontkieming, een noodzakelijke stap om tot groei en de daaraan gerelateerde productie van toxinen over te kunnen gaan. Samenvattend kan worden gesteld dat gegevens met experimenten, die de in vivo situatie zoveel mogelijk benaderen, leiden tot andere uitkomsten in risicoschattingen dan wanneer gegevens worden gebruikt die verkregen zijn in experimenten met algemene media.
RIVM report 250912003 page 7 of 86
Summary Bacillus cereus may cause two types of food borne disease: an emetic syndrome and a diarrhoeal syndrome. Complicating factor is that the organism may occur as vegetative cell, and as heat resistant spore. In this report mainly the diarrhoeal syndrome will be dealt with. The symptoms of the diarrhoeal syndrome are not very severe and of short duration. Therefore, few ill people will see a physician. This leads to a too low estimation of incidence of the disease. To improve this estimation data on occurrence of B. cereus in food commodities and data on the pathogenic mechanism are necessary. Also data on the characteristics of B. cereus are of importance. Data on occurrence will be published elsewhere, this report deals mainly with the pathogenic mechanism and characteristics. Chapter 1 is a compilation of data on growth speed and lag phase of circa 30 B. cereus strains determined in artificial culture medium. These data were used to discriminate between psychrotrophic (i.e. strains able to grow at temperatures below 10°C, but with poor growth at 37°C) and mesophilic strains (i.e. strains that do not grow at temperatures below 10°C, but grow well at 37°C). Determination of growth speed and lag phases in simulated intestinal fluid proved to show better discrimination between psychrotrophic and mesophilic strains. Our researches show heat sensitivity of spores to be related to the growth temperature profile of the strains. Spores of psychrotrophic strains appear to be more heat sensitive than spores of mesophilic strains. The behaviour of spores and vegetative cells in the gastro-intestinal tract is the subject of research in chapter 2 of this report. Using simulated fluids, the mesophilic strains appear better to withstand the gastro-intestinal environment than psychrotrophic strains. Not only temperature plays a role, also the composition of the intestinal fluid is of importance. In the last part of this report the interaction between the epithelium of the small intestine (simulated by using a human cell line) and B. cereus is investigated. Spores and vegetative cells are able to adhere to the epithelial cells, apparently a prerogative for the onset of diarrhoeal disease. Moreover, the epithelial cells are able to induce germination of spores of B. cereus, an important step before start of growth and subsequent enterotoxin production.. Overall can be concluded that the outcome of a risk assessment is more realistic using data from experiments closely relating the in vivo situation instead of data from a more artificial design.

page 8 of 86 RIVM report 250912003
RIVM report 250912003 page 9 of 86
1. Introduction The genus Bacillus consists of Gram positive, spore forming microorganisms that are ubiquitously distributed in the environment. The genus is subdivided in three groups based upon cellular morphology and physiological properties. Group 1, the Bacillus cereus group, consists of B. cereus, B. thuringiensis, B. mycoides, B. pseudomycoides, B anthracis, and B. weihenstephanensis. Several species from this group receive special attention as either suspect or proven pathogens. B. thuringiensis is well known and widely used as insecticidal agent; B. anthracis is well known as the agent that causes anthrax, a disease that may affect mammals; B. cereus is known to cause food borne disease. The close relationship of this group is emphasized by their similarity on DNA-level (Daffonchio et al., 1998; Helgason et al., 2000). B. cereus can cause two forms of food borne disease, an intoxication or emetic syndrome, and a toxico-infection or diarrhoeal syndrome (Kramer and Gilbert, 1989). For both syndromes the incubation time and the duration are relatively short. As a consequence many patients do not see physicians, which leads to an underestimation of the number of cases. Nevertheless cases of food borne disease caused by B. cereus comprise yearly around 4% of the total number of food borne diseases, as reported through the Food and Consumer Safety Authority (Duynhoven et al., 2005). The majority of these reports concern the emetic syndrome, since outbreaks of this syndrome usually involve two or more individuals at the same time. The diarrhoeal syndrome is thought to involve usually individual cases, but no hard figures on this are available. The incubation time of the emetic syndrome varies between 30 minutes and 5 hours, the duration of symptoms usually is 24 hours. The pathogenesis of this syndrome is well known: emetic toxin (or cereulide) is produced by B. cereus in the incriminating food commodity prior to consumption. After ingestion of the contaminated food, the toxin reaches the small intestine, activating a 5HT-3 receptor and thus triggering emesis (Agata et al., 1995). The incubation time of the diarrhoeal syndrome varies between 6 – 24 hours, and the duration of symptoms is around 24 hours (Kramer and Gilbert, 1989; Granum, 1994). The pathogenesis of the diarrhoeal syndrome is more complicated. B. cereus cells (spores and/or vegetative cells) are ingested with contaminated food. After passing the stomach and reaching the small intestine B. cereus must grow and produce enterotoxins that are responsible for the diarrhoeal symptoms. Many aspects concerning the pathogenesis of this syndrome, however, need more clarification. These include growth characteristics from B. cereus in food, survival and growth of B. cereus in the gastro-intestinal tract and the interaction between B. cereus and the epithelium of the small intestine. This report is concerned solely with the diarrhoeal syndrome, the emetic syndrome is discussed elsewhere.
page 10 of 86 RIVM report 250912003
This report is a compilation of various investigations regarding: 1) characteristics of B. cereus that are of importance to survival during preparation of food, 2) behaviour of B. cereus in simulated gastro-intestinal conditions in order to estimate the influence of physical conditions on the survival and growth of B. cereus, and 3) the interaction between B. cereus and differentiated Caco-2 cells as a model for epithelial cells of the small intestine being the target site for the enterotoxins. Data regarding the prevalence of B. cereus in food commodities in the Netherlands will be published elsewhere (Wijnands et al., in preparation a). Most investigations have been carried out with a set of twelve strains to mimic the diversity of B. cereus.
RIVM report 250912003 page 11 of 86
2. Characteristics of Bacillus cereus 2.1 Introduction Bacillus cereus is a microorganism that can grow at a great variety of temperatures, ranging from psychrophilic to thermophilic strains, strains able to grow at very low or very high temperatures, respectively (Kramer and Gilbert, 1989). Within the framework of food safety and human disease, only a limited number of strains is of importance. After processing, food is often stored at refrigerator temperatures (4 - 10°C), and strains able to grow or survive at these temperatures may be of importance. Since the main steps in the diarrhoeal syndrome occur in the gastro-intestinal tract, strains able to grow at 37°C and higher are also of importance. The potential of strains to grow at certain temperatures is most obviously determined by assessing growth rate at the temperature of interest. However, recently a molecular biological method has been described (Stetten et al., 1998), which is able to discriminate between strains able to grow below 7°C (psychrotrophic stains) and strains unable to grow below 7°C (mesophilic strains). This PCR method is based on small differences in base sequence in the 16S rDNA of the strains. Such differences have not only been found in B. cereus strains, but also in B. thuringiensis, and B. mycoides. The ability of Bacillus strains to form spores plays an important role in the concept of food safety. Spores are highly resistant to environmental influences, and therefore attention must be paid to the type and duration of processes in food preparation. Heating is a process step often included in food preparation. Where bacterial vegetative cells do not survive proper heating, spores are much more heat resistant and their elimination requires more drastic measures. Therefore, more knowledge on the heat resistance of spores is of importance.
2.2 Materials and Methods 2.2.1 Strains The strains that were selected for research are described in Table A.2.1 (see Appendix 2). The “Sensor project” (De Wit et al., 2001) was a population-based cohort study on gastroenteritis in the Netherlands. NVH is the Norwegian School on Veterinary Science, INRA is the French National Institute for Agronomic Research, DSMZ is the German Collection of Microorganisms and Cell Cultures, NCTC is the British National Collection of Type Cultures. 2.2.2 Spore production Following overnight growth at 30ºC in Brain Heart Infusion (BHI) broth, all selected
page 12 of 86 RIVM report 250912003
B. cereus strains (see Table A.2.1) were grown on polymyxine pyruvate egg yolk mannitol bromothymol blue agar (PEMBA) (Holbrook and Anderson 1980) for 48 hours at 30ºC. Colonies were collected, suspended in and washed with sterile demineralized water until milky white. The spores were suspended in physiological salt solution, heated 10 minutes at 80ºC and stored at -70ºC or -20°C in physiological salt solution in 1.5 ml vials (1 ml per vial), or stored in 30% glycerol in physiological salt solution in 1.5 ml vials containing glass beads at -70ºC or -20°C. 2.2.3 Growth characteristics 2.2.3.1 Growth characteristics in Brain Heart Infusion broth Growth at 10°C A glass bead from the -20°C spore stock of each strain was transferred to a tube containing 10 ml BHI-broth. Following incubation at 30°C (18-24 hours), 100 μl BHI-culture was transferred to 50 ml BHI-broth in a 60 ml infusion bottle (precooled at 10°C), and placed in a 10°C water bath (the water bath was placed in a room conditioned at 4°C). Strains were checked every 24 hours for turbidity. The optical density at 600 nm (OD600) was measured from the moment the first signs of turbidity were visible. When the OD600 was more than 0.7, the sample was diluted in physiological salt solution before measurement. The OD600 was measured until no changes were seen for more than two days. Purity of the culture after the experiment was checked by culture on Columbia agar with sheep blood (Oxoid) at 30°C during 18-24 hours. Experiments were conducted in duplicate. Since most of the OD 600 values in the experiments at 10oC did not exceed the 0.100 value, growth characteristics were also assessed in separate experiments by making decimal dilutions of samples, plating these on Trypton Soy Agar (TSA), and incubating the plates 18-24 hours at 30°C. These experiments were carried out twice, with 12 strains out of the 30 strains of the initial selection, based on their growth at 28 and 37oC. Growth at 28°C, 37°C, and 42°C The method at these temperatures differed from the growth experiments at 10°C at the following points: 1) the temperatures of the water bath were 28°C, 37°C, or 42°C, and 2) the duration of the experiments was 10 hours at 28°C, and 8 hours at 37°C and 42°C. Most experiments were conducted in duplicate. 2.2.3.2 Growth characteristics in simulated intestinal fluid Growth at 37°C Growth of B. cereus strains at 37°C in complete simulated intestinal fluid (SIF, including bile salts and pancreatic juice, described in Appendix 1 was carried out with 12 strains (see 2.2.3.1, Growth at 10oC). These strains have been selected from the strains used for the growth characteristics in BHI based on their growth profiles and PCR results. These twelve strains were also used for further experiments regarding investigations into the pathogenic pathway of the diarrhoeal syndrome. Simulated intestinal fluid was prepared based on a
RIVM report 250912003 page 13 of 86
previously described method (Rotard et al., 1995), and pipetted in 60 ml infusion bottles (50 ml per bottle). After thawing of the spores (from the -70°C stock in physiological salt solution) at room temperature, 100 µl spore suspension was added to 50 ml SIF (preheated at 37°C). Bottles were kept at 37°C in a water bath. Samples were taken at t=01, 1, 2, 3, and 4. From the samples the number of colony forming units were determined by plating 10-fold dilutions in duplicate on Trypton Soy Agar (TSA), and incubating the plates 18-24 hours at 30°C. Purity of the spores was assessed by plating samples at t=0 and t=4 on Columbia agar with sheep blood (Oxoid). 2.2.3.3 Evaluation of results and calculations All OD600 and culture data of the experiments were collected in Excel-files. The OD600 values were transformed to LN (natural logarithm). These data were plotted, and a straight line was calculated. The generation time was calculated as follows: LN2/RC = generation time. The lag phase was calculated as follows: LN(intersection with the y-axis)/RC = lag phase. When using the culture data, the data were plotted, and preferably in the logarithmic part of the curve Excel calculated the linear equation. Both the generation time and the lag phase were determined as described for the OD 600 data. The generation times and lag phases for all strains are shown in this report. 2.2.4 Growth temperature profile Two methods were used to determine whether strains were psychrotrophic or mesophilic, namely a PCR-method based on a difference in 16S rDNA signature between psychrotrophic and mesophilic strains (Stetten et al., 1998) and a culture method in which growth at 10°C and 37°C were the main parameters. 2.2.4.1 Determination of growth temperature profile by PCR The method was carried out as previously described (Stetten et al., 1998). Briefly, B. cereus strains were grown in Brain Heart Infusion (BHI) broth, overnight at 30°C. A PCR mixture was made as follows: 5 μl 10x PCR-buffer (Roche Molecular Biochemicals), 1.5 mM MgCl2, 200 µM of each of the deoxynucleoside triphosphates, 300 µM of each primer [MF, UR, UF, and PR, according to von Stetten (Stetten et al., 1998)], 2.5 units AmpliTaQ polymerase (Roche Molecular Biochemicals), 1 μl template DNA (= 1 μl BHI-culture), and sterile Milli-Q water to a final volume of 50 μl. The PCR was carried out in a Hybaid thermal cycler (Thermo Electron Corporation) with the following program: 2 minutes at 94°C (1 cycle), 30 cycles of 15 seconds at 94°C/15 seconds at 55°C/15 seconds at 72°C, and finally 2 minutes at 72°C. The PCR products were analyzed by electrophoresis in a 2 % agarose gel, using a 100 bp ladder. The psychrotrophic strains display a band at 130 bp, the mesophilic strains a band of 250 bp. Intermediate strains may display both bands.
1 hours
page 14 of 86 RIVM report 250912003
2.2.4.2 Determination of growth temperature profile by culture at various temperatures For these determinations the data on growth characteristics at 10°C, 37°C, and 42°C, as described under chapter 1.2.3.1, were used. These temperatures are most important in determining whether strains are mesophilic or psychrotrophic. The generation time data were plotted in bar-graphs. 2.2.5 Heat resistance of Bacillus cereus spores The heat resistance of B. cereus spores was determined as previously described (Dufrenne et al., 1994). Briefly, six glass tubes with screw cap with rubber inlay, each containing 7 ml phosphate buffered physiological salt solution (0.07M, pH 7.2), were submerged in a water bath at the desired temperature. Spores, stored at -20°C and thawed at room temperature, were added and incubated for 25, 20, 15, 10, 5 and 0 minutes (for each time period a different tube was used). After the indicated time, all tubes were placed on melting ice until further research. Samples from each tube were investigated by plating 100 µl of decimal dilutions in duplicate on Trypton Soy Agar (TSA), and incubating the plates 18-24 hours at 30°C. The temperatures at which the heat resistance was measured were 80°C, 85°C, 87.5°C, 90°C, 95°C, and 97.5°C. From the colony counts plotted against time, D-values at each temperature were determined for each strain. Not each temperature was applied to each strain, but for each strain at least three different temperatures were used to obtain an inactivation curve from which the D-value could be calculated. Also, dependant on the results or expected results, the time periods, in which measurements were made, were varied. 2.2.6 Statistical analysis Statistical analyses were performed in Excel (Microsoft) using the t-test: two-sample assuming unequal variances.
2.3 Results For figures and tables mentioned in this chapter see Appendix 2. 2.3.1 Determination of generation times using BHI The results of the calculations of the experiments for determining the growth characteristics are shown in Tables A.2.2 to A.2.6. The Tables A.2.2, A2.2.4, A2.2.5, and A2.2.6 are based on OD 600 measurements at 10°C, 28°C, 37°C, and 42°C in BHI, respectively. The OD values at 10°C in BHI did not exceed the 0.100, and were regarded as unreliable. Therefore, the experiments at 10°C were repeated, growth was monitored by culturing samples on TSA-plates, and the results of these experiments are shown in Table A.2.3. Also the generation
RIVM report 250912003 page 15 of 86
times at 10°C, 37°C and 42°C are shown in Figures A.2.1, A.2.2 and A.2.3, in which the strains with immeasurable generation times are shown as having a very long generation time. The results for some strains have not been shown (see Tables A.2.2 and A.2.6, strains with the indication “n.d.”), since growth of these strains took so long that these experiments were stopped and the results were not recorded. Therefore, the generation times and lag phases could not be determined reliably. In Figures A.2.1, A.2.2 and A.2.3, that show the results at 10°C, 37°C and 42°C respectively, these unreliable generation times are shown as bars exceeding the generation time used for the Y-axis. In the legend at the bottom of Tables A.2.2, A.2.4, A.2.5 and A.2.6 the 95% confidence intervals for the mean generation times and the mean lag phases are mentioned. Strains with generation times smaller than the interval grew well at the indicated temperature, strains with generation times above the interval grew poorer at the indicated temperature. Also the lag phases were taken into consideration. Strains were considered psychrotrophic based upon good growth and short lag phase at 10°C, and poorer growth and long lag phases at 37°C and 42°C. Mesophilic strains were generally characterized by poorer growth and long lag phases at 10°C, and good growth and short lag phases at 37°C and 42°C. For example, strain PAL 2 has a relative short mean generation time and an average lag phase at 10°C (Table A.2.2), at 37°C both generation time and lag phase are on average, and at 42°C both parameters are below average. Combined with the corresponding lag phases PAL 2 was considered to be mesophilic. Therefore, from the tables and the figures the growth temperature profile of the strains can be distinguished. Strains PAL 17, PAL 18, PAL 20, and PAL 22 have relatively low generation times at 10°C, and relatively high generation times at 37°C. The differences with the rest of the strains is not significant (P>0.05), but the tendency is clear. Also, strain PAL 17 has a high generation time at 42°C. These four strains were, based on these results, designated as psychrotrophic. Also in the PCR-method these strains showed to be psychrotrophic. For the experiments at 10°C in BHI with culture of samples only a limited number of strains has been used. This selection was based on the results in BHI at 42°C, 37°C and 10°C with OD-measurement, where not only the OD 600 was measured with the spectrophotometer, but also growth and turbidity were assessed visually: the OD from bottles with non turbid BHI was not yet measured to prevent the occurrence of cross-contamination. The results at 28°C are the least discriminative, as they were carried out near the optimal growth temperature of B. cereus., and therefore not taken into consideration for determining the growth temperature profile. 2.3.2 Determination of generation times using simulated intestinal fluid In Table A.2.7 the results of the calculations for determining generation time and lag phase are presented for the same limited number of strains used to determine these characteristics at 10°C in BHI with culture of samples. Two strains (PAL 3 and PAL 7) showed no growth at all, and therefore no generation time or lag phase could be determined (indicated by “n.g.“). In general short generation times correspond with short lag phases.
page 16 of 86 RIVM report 250912003
These experiments were conducted later than the growth experiments in BHI, when the limited selection of strains had already been divided in psychrotrophic and mesophilic, based on the growth characteristics and PCR-results. In Figure A.2.4 the results from the calculations of the generation times have been plotted in a graph. The psychrotrophic strains (PAL 3, PAL 17, PAL 18, and PAL 20) appear to have higher generation times than the mesophilic strain with the exception of strain PAL 25. Two psychrotrophic strains (PAL 7 and PAL 22) did not show growth in simulated intestinal fluid at 37°C, and therefore no bars are shown for these two strains. The P-value of a t-test is slightly higher than 0.05, and therefore the difference between he mesophilic strains (minus strain PAL 25) and the psychrotrophic strains is not significant. 2.3.3 Determination of growth temperature profile by PCR From the results of the growth experiments growth temperature profile of the various strains can be derived. Most important temperatures were 10°C, 37°C, and 42°C. Not only the generation time is of importance, also the lag phase adds to determine growth temperature profile. (See also section 3.2). In Table A.2.8 the PCR-results are shown. A distinction is made on the basis of PCR-signature between psychrotrophic (p) and mesophilic (m) strains. 2.3.4 Heat resistance of spores In Table A.2.9 and Figure A.2.5 the results of the determination of heat resistance of spores of various strains at various temperatures are shown, represented as D-values in minutes. In Figure A.2.5, the data from Table A.2.9 are shown separately for psychrotrophic (x) and for mesophilic strains (▲), irrespective of the strain number. The individual strains are not shown, but this graph shows the difference in D-values between mesophilic and psychrotrophic strains in a different manner. From Figure A.2.5 can be derived that, in general, the mesophilic strains have higher D-values than the psychrotrophic strains. The difference at 90°C, the only temperature with data of all twelve strains, is not significant (p>0.05), but the tendency in Figure A.2.5 is clear.
2.4 Discussion The generation times of strains PAL 17, PAL 18, PAL 20, and PAL 22 at 37°C in BHI are significantly higher, and based upon these data these strains may be called psychrotrophic. At 10°C the data are less discriminative. Some strains do indeed show a sufficiently high deviation from the mean generation time to call them mesophilic (PAL 2, PAL 27) or psychrotrophic (PAL 20, PAL 22). But in general the outcomes are not very clear. Strain 3 appears to be mesophilic from the results at 10oC, but has in the PCR-test a clear psychrotrophic signature. The growth temperature profile of strains PAL 17, PAL 18, PAL 20, and PAL 22, as detected in growth experiments at 37ºC, is confirmed by the PCR test, where these strains show the
RIVM report 250912003 page 17 of 86
psychrotrophic signature. Psychrotrophy of strain PAL 3 can be derived form the results at 37°C and 42°C: at both temperatures this strain fails to grow (as indicated in Figures A.2.2 and A.2.3 by the lacking bars). From the results at 42°C, see Figure A.2.3, there is a strong indication that strain PAL 7 is psychrotrophic. The results for these two strains are confirmed by the PCR-test where both strains show psychrotrophic signatures. From the graphs in Figures A.2.2 and A.2.3 can be read that strains PAL 25, PAL 26, PAL 27, and PAL 28 have low generation times, indicating mesophily of these strains. These results are confirmed by the PCR test. The growth experiments at 37°C in simulated intestinal fluid (SIF) confirm the results obtained with the other techniques and seem to be more discriminative. Although the difference is not significant due to the aberrant behaviour of strain PAL 25, there is a clear tendency for the psychrotrophic strains to grow slower (as indicated by higher generation times, see Table A.2.7 and Figure A.2.4) than the mesophilic strains. Moreover, two psychrotrophic strains, PAL 7 and PAL 22, do not even grow in SIF. The difference in heat resistance between psychrotrophic spores and mesophilic spores can best be seen in Figure A.2.5. The heat resistance of mesophilic spores is consequently higher at each of the temperatures at which both types of spores have been tested. At only one temperature all strains have been tested; i.e. 90°C. At this temperature the results, and more specific the differences between psychrotrophic and mesophilic strains, are not significant (0.05<p<0.1). There is however a strong tendency that the D-values of the mesophilic strains are higher at each temperature than the D-values of the psychrotrophic strains. Bacillus cereus is a species with a large variety of strains. This variety is not only expressed in the growth characteristics at different temperatures, as described in this part of the report. The variety is also expressed in the differences in heat resistance of the spores. Such information is of importance in risk assessment, when conclusions have to be drawn on the potential health risk of, for example, food preparation processes. One always has to bear in mind the large variety of properties of the species.
2.5 Conclusions The results with growth experiments at various temperatures are generally in concordance with the results by PCR growth temperature profile: the same strains are named psychrotrophic or mesophilic. The PCR results present a black and white discrimination, where the classification based upon growth is less discriminative. The results of the growth experiments in simulated intestinal fluid confirm and emphasize the differences between psychrotrophic and mesophilic strains. We conclude that data from experiments in simulated intestinal fluid, resembling more closely the in vivo situation, are better suitable for modeling than data from tests in culture media.

page 18 of 86 RIVM report 250912003
The differences in growth temperature profile are also expressed in the differences in heat resistance of spores. Although the difference is not significant, spores from mesophilic strains are generally more heat resistant than spores from psychrotrophic strains.
RIVM report 250912003 page 19 of 86
3. Behaviour of Bacillus cereus in the gastro-intestinal tract under simulated circumstances
3.1 Introduction The mechanism of the diarrhoeal syndrome is believed to be as follows: food contaminated with B. cereus, spores and/or vegetative cells, is consumed. Spores pass the stomach, reach the small intestine, germinate, grow, and produce the enterotoxins. Vegetative cells are believed to be very susceptible to stomach conditions, and will therefore hardly reach the small intestine. However, during food consumption the pH in the stomach rises. The highest pH and the subsequent drop after ingestion of the food depend on the type and amount of food (Russell et al., 1993; Dressman et al., 1990). The lapse of pH after the ingestion of three types of food (solid, intermediate and fluid) and the role of age in the lapse of pH after food intake have been described before (De Jonge et al., 2003). During food uptake the pH in the stomach may reach values at which vegetative cells of B. cereus may survive, and subsequently reach the small intestine. There they may grow and thus contribute to the onset of disease. Results concerning the possible contribution of vegetative cells to the pathogenesis of B. cereus will be discussed elsewhere (Wijnands et al., in preparation b). Aim of these investigations was twofold, namely to confirm the hypothesis that spores pass the stomach unharmed and germinate and grow in the small intestine, and to confirm that the gastric conditions have a negative effect on survival of vegetative cells before they are transferred to the small intestine. All studies are to be performed in vitro. As the human gastro-intestinal tract is a very complicated organ it is nearly impossible to mimic the exact circumstances and physiological properties. Our set up includes the use of artificial gastric and intestinal fluids. A variety of formulations used to simulate the gastric environment can be found in the literature (Anonymous, 1995; Cooper et al., 1995; Longland et al., 1977). For the experiments described in this report, formulations were used as previously described for the determination of heavy metals after ingestion (Rotard et al., 1995).
3.2 Materials and Methods 3.2.1 Strains. The twelve Bacillus cereus strains used for these experiments are described in Table A.3.1 (Appendix 3). The strains were grown on MEYP2-agar (Mossel et al., 1967) and subsequently tested for glucose fermentation, acetylmethylcarbinol production according to Voges-Proskauer, nitrate-reduction and gelatin turn-over. Purity was checked by plating the strains on Columbia agar with sheep blood and incubating overnight at 30°C. The growth
2 MEYP = mannitol egg yolk phenol red

page 20 of 86 RIVM report 250912003
temperature profile of the strains was established by a previously described method based on polymerase chain reaction (Stetten et al., 1998). 3.2.2 Spore production. Pure Bacillus cereus strains were grown on PEMBA3-agar (Holbrook and Anderson 1980) for 48 hours at 30°C. Spores were collected by scraping colonies from the plates, using distilled water, and centrifugation (10 minutes 1800xg). Washings and centrifugation were continued until the suspension was milky white (generally 4 times). After the final centrifugation step, the spores were suspended in physiological salt solution, heated 10 minutes at 80ºC, and stored in 1.5 ml vials (1 ml per vial) at -70ºC. Spore counts were performed after the final suspension of spores in physiological salt solution, but the final suspensions were not adjusted to equal spore concentrations before storage and experiments. 3.2.3 Production and use of vegetative cells in gastro-intestinal experiments Stationary phase vegetative cells were produced by inoculating 10 ml BHI with a glass bead with spores from the –70ºC stock and incubating the inoculated BHI at either 30ºC or 37ºC, dependent on the growth temperature profile of the strain (psychrotrophic strains were incubated at 30ºC, mesophilic strains at 37ºC). The incubation-time in BHI was circa 5 hours. Subsequently the strains were inoculated in Luria Bertani Glucose broth (LBG) (pH 7.0) and incubated overnight. Psychrotrophic strains at 30ºC, mesophilic strains at 37ºC. Log phase vegetative cells were produced by inoculation of 10 ml BHI with a glass bead with spores from the –70ºC stock and overnight incubation at 30ºC (psychrotrophic strains) or 37ºC (mesophilic strains). Subsequently, LBG-broth was inoculated with BHI culture (0.2 ml BHI-culture to 25 ml LBG broth). The strains were incubated for 4 hours at either 30°C or 37°C dependent on their growth temperature profile characteristics and used in the gastro-intestinal experiments. For experiments with gastric fluid 0.2 ml LBG-culture was added to 50 ml SGF4, for intestinal experiments 0.2 ml LBG-culture was added to 50 ml SIF5. For combined experiments 0.2 ml LBG-culture was added to 50 ml SGF, whereafter 1 ml of the inoculated SGF was added to 50 ml SIF. All experiments involving SGF or/and SIF were performed at 37ºC. 3.2.4 Simulated gastric and intestinal fluids The simulated gastric and intestinal fluids are based on previously described formulations (Rotard et al., 1995) and the composition of (each of the components for) simulated gastric fluid (SGF) and simulated intestinal fluid (SIF) is described in Appendix 1.
3 PEMBA = polymyxin pyruvate egg yolk mannitol bromothymol blue 4 SGF = simulated gastric fluid 5 SIF = simulated intestinal fluid
RIVM report 250912003 page 21 of 86
3.2.5 Evaluation of survival and growth Samples, taken during the experiments, were investigated for the total number of colony forming units (vegetative cells and spores, i.e. total count) and for the number of spores (i.e. spore count) after heating the 10x diluted original samples for 10 minutes at 80°C. Ten-fold dilutions of the samples in physiological salt solution containing 0.1% (w/v) peptone were plated in duplicate on Trypton Soy Agar. Agar plates were incubated overnight (i.e. 18 – 20 hours) at 30°C, and numbers of colonies were recorded from countable plates (15 < x < 150 per plate). The means of the duplicates of total and spore counts were calculated and used for further evaluations. All experiments were carried out with all twelve strains, unless mentioned otherwise. 3.2.6 Behaviour of Bacillus cereus spores and vegetative cells in gastric conditions After thawing, spores were suspended in 50 ml simulated gastric fluid (SGF) at pH 2.5 for 60 minutes at 37°C in a water bath. Samples were taken at the start of the incubation (t=0), after 30 minutes (t=30) and at the end of the incubation period (t=60). From the samples the total number of viable cells and the number of spores were determined. Vegetative cells, both stationary phase and exponential phase cells, were suspended in SGF of various pH, with and without pepsin. At regular time intervals samples were taken for colony counts. The length of the time intervals was adjusted to the expected survival of the cells, i.e. the lower the pH the lower the expected survival the shorter the time intervals. From the colony counts D-values were calculated, being the time in minutes necessary to decrease at a certain pH the colony count with one log-unit. 3.2.7 Behaviour of Bacillus cereus spores and vegetative cells in intestinal conditions After thawing, spores were suspended in 50 ml simulated intestinal fluid (SIF) at pH 7.8 +/- 0.3 in a water bath at 37ºC for 4 hours. Vegetative cells (stationary or exponential phase), prepared as described before, were suspended in 50 ml simulated intestinal fluid (SIF) at pH 7.8 +/- 0.3 in a water bath at 37ºC for 4 hours. Samples were taken at the start of the experiment (t=0) and at each hour afterwards, expressed in minutes (t= 60, 120, 180, and 240). Samples were investigated for total number of viable cells and numbers of spores. Vegetative cells, stationary phase and exponential phase, were suspended in the various formulations of SIF including complete SIF, and at regular time intervals samples were taken for colony counts. The colony counts were plotted and from the slope of the resulting graphs generation times in minutes were calculated.
page 22 of 86 RIVM report 250912003
3.2.8 Behaviour of spores and vegetative cells in simulated gastro-intestinal transfer After thawing, spores were suspended in 50 ml SGF at pH 2.5. After one hour incubation at 37ºC, 1 ml SGF suspension was transferred to 50 ml SIF and incubated further for 4 hours at 37ºC. Samples were collected at the start of the experiment in SGF (t=0 SGF), after 60 minutes incubation in SGF (t=60 SGF), immediately after transfer to SIF (t=0 SIF) and every hour during incubation in SIF, expressed in minutes (t=60 SIF, 120 SIF, 180 SIF, and 240 SIF). Similar experiments, with SGF of pH 1.0 and of pH 4.0, were carried out with one psychrotrophic and one mesophilic strain. Stationary and exponential phase cells of the mesophilic strains and stationary phase cells of the psychrotrophic strains were exposed to pH 2.5 in 50 ml SGF. After 30 minutes 1 ml SGF was transferred to 50 ml complete SIF. At regular time intervals (see above, but note that exposure to gastric conditions lasted for 30 instead of 60 minutes) samples were collected for colony counts. The colony counts in complete SIF were recalculated to compensate for the 50-fold dilution of the SGF after transfer to complete SIF. Exponential phase psychrotrophic cells were not included in this experiment because the yield of cells after 4 hours of incubation in LBG-MOPS at pH 7.0 grown at 37°C was too low. 3.2.9 Influence of low temperature storage on behaviour of spores and vegetative cells in simulated gastro-intestinal transfer Since food commodities are often stored in refrigerators, the influence of such treatment on the behaviour of spores in simulated gastro-intestinal conditions was investigated. Following incubation at 10ºC overnight, spores were exposed to SGF at pH 2.5 and subsequently to SIF. Samples were collected and investigated as described before. These experiments were carried out with spores from psychrotrophic strains 7, 18, and 22 and mesophilic strains 2, 5, and 27. Comparable experiments were carried out stationary phase vegetative cells from the same strains. No exponential phase cells were used for these experiments. 3.2.10 Influence of pH of gastric fluid on the behaviour of spores and vegetative cells in simulated gastro-intestinal transfer Most experiments have been carried out at pH 2.5. However, since the pH in the stomach may vary between nearly 1 and nearly 5, preincubation of spores at pH 1.0 and pH 4.0 was used to assess the subsequent behaviour in SIF. For these experiments spores from one psychrotrophic strain (PAL 22) and one mesophilic strains (PAL 27) were used. Apart from the pH of the simulated gastric fluid, the design of the experiments was the same as described before. Comparable experiments were carried out with stationary phase vegetative cells from psychrotrophic strains PAL 7, 18, and 22, and mesophilic strains PAL 2, 5, and 27.
RIVM report 250912003 page 23 of 86
3.2.11 Reproducibility of experiments The simulated gastric and intestinal fluids had to be produced freshly for each experiment. In addition, a limited number of strains that could be tested on one day. Therefore, a variety of batches of simulated fluids were used. To assess the reproducibility of results between tests, spores of strain PAL 2 were subjected to the tests in each experiment in which spores were involved, and served therefore as an internal control.
3.3 Results In Appendix 3 figures and tables referring to this chapter can be found. In general, when colony counts of < 10 were detected, for graphs and calculations this number of cfu was represented by 1. 3.3.1 Behaviour of spores and survival of vegetative cells in SGF In Figures A.3.1 and A.3.2 the effect of exposure of spores of psychrotrophic strains and mesophilic strains respectively to pH 2.5 in simulated gastric fluid with pepsin is shown. Only total counts are reported, at t=0, t=30 minutes and t=60 minutes. The counts are reported in logarithms of the colony count (log CFU). Since germination and growth are impossible under these circumstances, the small “increases” and “decreases” of the total counts of the strains in Figure A.3.1 and A.3.2 are more an indication of the margin of error in colony count. Therefore, only strain PAL 7 (see Figure A.3.1), with a decrease of nearly one log-unit in the total counts, appears to be slightly affected by pH 2.5 in simulated gastric fluid. Taking the same margin of error into account as with the psychrotrophic strains, none of the mesophilic strains show increase or decrease of the colony counts during the total time of exposure, indicating that pH 2.5 in simulated gastric fluid does not affect the spores of the mesophilic strains. The results of survival of vegetative cells, stationary phase and exponential phase, at low pH values in SGF are described in tables 2 and 3 respectively. The results are presented as D-values in minutes, i.e. time in minutes in which the colony count decreases with one log-unit. The stationary phase cells appear to be more acid tolerant. This can be derived from the difference in D-values of the stationary phase cells at pH 4.0 (Table A.3.2) compared with the D-values of the exponential phase cells at pH 4.0 (Table A.3.3). The average D-value of the stationary phase cells at pH 4.0 is about 10 times higher than the average D-value of the exponential phase cells. At pH 3.5 these differences in D-value become less apparent for most of the strains. In general the mesophilic exponential phase cells appear to be more acid tolerant than the psychrotrophic exponential phase cells, because the average D-value without pepsin for the mesophilic strains at pH 4.5 is 62 minutes, whereas for the psychrotrophic strains the average D-value at pH 4.5 is 45 minutes (see Table A.3.3). Also with pepsin there is such difference in average D-values. At pH 4.0 with the stationary phase cells (see Table
page 24 of 86 RIVM report 250912003
A.3.2), the differences in average D-values between the stationary phase mesophilic and psychrotrophic strains are much smaller (see Table A.3.2). 3.3.2 Behaviour of spores and vegetative cells in complete SIF The effect of exposure of spores to complete SIF during 4 hours (= 240 minutes) is depicted in Figures A.3.3, A.3.4, A.3.5 and A.3.6. The incubation time is set at the X-axis, the colony counts on a logarithmic scale at the Y-axis. Figures A.3.3 and A.3.4 show the results of total and spore counts respectively when spores of the psychrotrophic strains were used. In Figures A.3.5 and A.3.6 the results of total and spore counts respectively for the spores of the mesophilic strains are shown. From the psychrotrophic strains only strains PAL 17 and PAL 18 show a slight increase in total count during the time of the experiment (see Figure A.3.3). These are also the strains that show the highest degree of germination, since the spore count from both these strains after 1 hour of exposure drops more than 1 log unit (see Figure A.3.4). From the mesophilic strains only strain PAL 25 shows hardly any increase in total count (see Figure A.3.5). This is also reflected by the lack of decrease in spore count of this strain indicating that hardly any germination took place (see Figure A.3.6). Also strain PAL 5 does not show any measurable decrease in spore count (Figure A.3.6), although contrary to strain PAL 25 strain PAL 5 does show an increase is total count indicating growth in the complete simulated intestinal fluid (Figure A.3.5). Mesophilic strain PAL 26 shows a remarkable decrease in spore count over the duration of the experiment (see Figure A.3.5). This spectacular decrease is not reflected in an equal increase in total count (see Figure A.3.6). The results of the investigations concerning the behaviour of vegetative cells in simulated intestinal fluid (SIF), in SIF with bile salts, in SIF with pancreatin, and in complete SIF (= SIF with bile salts and pancreatin) are shown as generation times, calculated from the colony counts at regular time intervals, in Tables A.3.4 and A.3.5 for stationary phase and exponential phase cells, respectively. Generation times over 120 minutes were recorded as >>>, since the slope of the graph ( and therefore the increase in numbers of cfu) was so small that the errors in the calculations would be too high. As can be derived from Tables A.3.4 and A.3.5 the addition of bile or pancreatin results in higher generation times for exponential and stationary phase cells. In complete SIF (with bile and pancreatin) the generation times are higher than in SIF (i.e. no bile and pancreatin included). For the stationary phase cells of the psychrotrophic strains all generation times are over 120 minutes, while only one stationary phase mesophilic strain (PAL 2) has a generation time over 120 minutes (see Table A.3.4). In the exponential phase two psychrotrophic strains show generation times of over 120 minutes (see Table A.3.5). No mesophilic strain in exponential phase shows generation times of more than 120 minutes.
RIVM report 250912003 page 25 of 86
3.3.3 Behaviour of spores and vegetative cells in complete SIF after exposure to pH 2.5 in SGF The effect of exposure of spores to complete SIF after exposure to pH 2.5 in SGF (simulating passage through the stomach into the small intestine) is depicted in Figures A.3.7, A.3.8, A.3.9 and A.3.10. Figures A.3.7 and A.3.8 show the results of total and spore counts of the psychrotrophic strains. The results of the total and spore counts of the mesophilic strains are depicted in Figures A.3.9 and A.3.10. In all figures the colony counts in the complete SIF are calculated values and shown on a logarithmic scale at the Y-axis as a function of exposure time at the X-axis. In the experiment only 1 of 50 ml of SGF was transferred to 50 ml complete SIF, causing a 50-fold drop in actual colony count. In order to compensate for this drop in colony count the colony counts for the complete SIF were recalculated by multiplying them with a factor 50. As in the experiment in complete SIF, in this combination experiment the psychrotrophic strains PAL 17 and 18 show an increase in total colony count during the time of the experiment (see Figure A.3.7). These are also the strains that show the highest degree of germination, as can be derived from the decrease in spore count throughout the course of the experiment (see Figure A.3.8). From the mesophilic strains strain PAL 5 shows hardly any increase in total count (see Figure A.3.9). This corresponds to the lack of decrease in spore count of this strain indicating that hardly any germination took place (see Figure A.3.10). Also strain PAL 25 does not show any decrease in spore count (Figure A.3.10), although contrary to strain PAL 5 strain PAL 25 does show an increase is total count indicating growth in the complete SIF (Figure A.3.9). All other mesophilic strains show both increase in total counts and decrease in spore count. The vegetative cells were exposed to complete SIF after 30 minutes of exposure to pH 2.5 in SGF. In Figures A.3.19 and A.3.20 the results are shown for the stationary phase cells (psychrotrophic and mesophilic strains respectively), and in Figure A.3.21 the results for the exponential phase of all the mesophilic strains. In all three figures calculated values for the numbers of cfu in SIF are shown to compensate for the transfer of 1 ml SGF to 50 ml SIF. To indicate the effect of transfer of cells from pre-incubation medium to SGF, the colony counts of the starting material have also been incorporated in the figures. Immediately after transfer of cells from the pre-incubation medium to SGF a sample was taken of the SGF to determine the loss of viability upon exposure to SGF. From the stationary phase cells of the psychrotrophic strains only strain PAL 7 does not seem to recover from the low pH-shock after 4 hours in complete SIF; from the stationary phase mesophilic cells PAL 5 does not recover after 4 hours of exposure in complete SIF. The experiments with exponential phase cells in complete SIF after exposure to pH 2.5 in SGF were carried out only with the mesophilic strains since the psychrotrophic strains grew so slow at 37°C prior to exposure to SGF that the numbers were too low to give reliable results (see Figure A.3.21). The experiment involving strain PAL 26 was unsuccessful. Exponential phase cells seem to be more susceptive to low pH than stationary phase cells because only two of the five strains grew after 4 hours of exposure in complete SIF, while
page 26 of 86 RIVM report 250912003
five out of six strains in stationary phase showed growth after 4 hours (compare Figures A.3.20 and A.3.21). 3.3.4 Influence of different pH’s in SGF on the behaviour of spores in complete SIF The experiments described in section 2.3.3 have been carried out at pH 2.5 in SGF preceding the exposure to complete SIF. To investigate the influence of other pH’s in SGF one psychrotrophic and one mesophilic strain have been exposed in SGF to pH 1.0, 2.5 and 4.0 prior to transfer to complete SIF. In figures 11 and 12 the results are shown. Here too, the colony counts in complete SIF have been recalculated to compensate for the dilution step during transfer from SGF to complete SIF. Only total counts are shown on a logarithmic scale at the Y-axis as a function of exposure time on the X-axis. The colony counts of the psychrotrophic strain (PAL 22) after exposure to pH 1.0 appear to be affected, indicated by the slightly lower colony counts (see Figure A.3.11). Between the colony counts after exposure to pH 2.5 and pH 4 respectively no difference can be observed. All in all no increase in colony count can be observed, indicating that this psychrotophic strain is unable to germinate and grow in simulated intestinal conditions. Exposure to pH 1 in SGF appears to decrease the number of viable spores from the mesophilic strain (PAL 27). However, the ability to germinate and grow is not affected (see Figure A.3.12). Preincubation at pH 1 appears to lead to lower generation times after germination of the spores, but spore counts are lower than after pre-exposure to pH 2.5. In Figure A.3.12 this phenomenon can be derived from the smaller slope of the curve between t=180 and t=300. From the colony counts, on which the graphs in figure 12 are based, could be calculated that the generation time between t=180 and t=300 is 45 minutes with pH 1.0 preincubation, versus 29 and 24 minutes with pH 2.5 and pH 4.0 preincubation respectively. The experiments involving exposure of stationary phase cells to SGF at pH 2.5 and subsequent exposure to SIF were repeated with a limited number of strains at pH 4.0 (60 minutes exposure) and at pH 1.0 (5 minutes exposure) in SGF. The results are shown in Figures A.3.22 to A.3.25, with calculated cfu values at logarithmic scale at the Y-axis due to compensation for the transfer of 1 ml SGF to 50 ml SIF. The calculated cfu values are shown as function of the time of exposure in SGF/SIF. All three psychrotrophic and mesophilic strains that were used for this experiment, show growth after 4 hours in complete SIF following the 60 minute exposure at pH 4.0 in SGF (see Figures A.3.22 and A.3.23). Exposure to pH 1.0 resulted in a lower number of growing strains after transfer to complete SIF, namely two psychrotrophic and two mesophilic strains (see Figures A.3.24 and A.3.25). Also growth appears to be reduced. 3.3.5 Reproducibility of experiments with spores and vegetative cells In order to give an indication of the reproducibility of experiments with spores, the results obtained with strain PAL 2 are shown in Figures A.3.13 and A.3.14, total counts and spore counts respectively. The colony counts is SIF are calculated values to compensate for the
RIVM report 250912003 page 27 of 86
transfer of 1 ml SGF to 50 ml complete SIF. The colony counts are shown at a logarithmic scale on the Y-axis as a function of the time of exposure in minutes at the X-axis. To assess the reproducibility of the experiments the total counts and the spore counts of the repeated experiments with strain 2 (Figure A.3.7), involving the exposure of spores to gastric fluid followed by incubation in intestinal fluid, were log transformed. Per sample point in time the average and standard deviation were calculated. The results were considered to be reproducible when the standard deviation per sampling point in time was within 0.25 log unit (95% confidence interval ± 0.5 log unit). At all time points the standard deviation was ≤ 0.25 (the maximum standard deviation found in the total counts was 0.21, in the spore counts 0.25). Therefore, the reproducibility of the experiments is considered to be satisfactory. The reproducibility of the experiments with vegetative cells is shown in Table A.3.7. The generation times of strain PAL 2, that was used in each experiment, show for the stationary phase and the exponential phase cells in SIF and complete SIF good correlations. Although for the stationary phase cells in complete SIF nothing can be concluded, since all generation times are over 100 minutes. From these results can be read that repeated production of the intestinal fluid does not influence the outcome of the experiments. All experiments in SIF were always carried out together with SIF without additions as control experiment. Therefore from all twelve strains there are triplicate results in SIF. Here too, from the numbers of cfu over the exposure time, growth rates and generation times were calculated. The generation times can be read from Table A.3.8. Using linear regression in the statistical program SAS, straight lines were drawn through the log cfu/time points, using the least squares method. The slopes of the different curves (= rate of growth) were compared and the p-value of the observations under the hypothesis of parallelism calculated. A significance level of 0.05 was used to test this hypothesis. The calculations were carried out twice, once using all the cfu data, and once using only the reliable data, i.e. data from counts between 15 and 150 colonies per plate (see chapter 3.2.5). The results in terms of p-value per strain were exactly the same for both calculations. Therefore, the result of only one calculation [= p-value per strain per growth phase using all data points plus the indication whether parallelism of the different growth curves (≡ generation time) per strain could be proven] is shown in Table A.3.9. From this table can be read that only the p-value for the exponential phase cells from strain PAL 20 is smaller than 0.05, and therefore the hypothesis of parallelism is rejected for this strain. As can be seen in Table A.3.8 the calculated generation time separate lines are not parallel. 3.3.6 Influence of storage at 10°C on the behaviour of spores and vegetative cells in SGF and SIF In Figures A.3.15 to A.3.18 the results are shown of the experiments involving incubation of spores at 10°C prior to exposure to pH 2.5 in SGF and subsequent exposure to complete SIF. Figures A.3.15 and A.3.16 depict the results for the psychrotrophic strains, total counts and spore counts respectively. In Figures A.3.17 and A.3.18 the results for the mesophilic strains
page 28 of 86 RIVM report 250912003
are shown, also total counts and spore counts respectively. Again, the colony counts in SIF, total and spore, are calculated values to compensate for the transfer of 1 ml SGF to 50 ml SIF. The colony counts are shown at logarithmic scale at the Y-axis, as a function of the time of exposure in minutes at the X-axis. The spore counts for both the psychrotrophic and the mesophilic strains have not been performed for all time points, as indicated at the X-axis. As can be seen from Figures A.3.17 and A.3.18 the behaviour of the mesophilic strains is comparable to their behaviour in the experiment without preincubation at 10°C (see Figures A.3.9 and A.3.10). From the psychrotrophic strains (see Figures A.3.15 and A.3.16) strain PAL 7 reacts very different compared to the experiment without preincubation at 10°C (see Figures A.3.7 and A.3.8). The other psychrotrophic strains (PAL 18 and PAL 22) show comparable results without and with preincubation at 10°C (compare figures A.3.7 and A.3.8 with A.3.15 and A.3.16). Like spores stationary phase vegetative cells were subjected to overnight exposure to 10°C prior to exposure to pH 2.5 in SGF and subsequent transfer to complete SIF. The results of these experiments are shown in Figures A.3.24 and A.3.25, for the psychrotrophic and the mesophilic strains respectively. Again, on the Y-axis calculated values for the numbers of cfu at a logarithmic scale are shown due to compensation for the transfer of 1 ml SGF to 50 ml SIF. The X-axis shows the time of exposure in SGF/SIF. From the three psychrotrophic strains that were used for this experiment only strain 18 appeared to grow after 4 hours of incubation in complete SIF (see Figure A.3.24). From the three mesophilic strains two grew after 4 hours of incubation in complete SIF (see Figure A.3.25). 3.3.7 Comparison of generation times in BHI and SIF Differences between growth of vegetative cells in BHI and SIF at 37°C are shown in Table A.3.6. The generation times are longer in SIF than in BHI for both the psychrotrophic and the mesophilic strains.
3.4 Discussion 3.4.1 Discussion of the results The diarrhoeal syndrome caused by Bacillus cereus is a toxico-infection. In other words, Bacillus cereus (vegetative cells or spores) must be ingested, must grow in the small intestine and subsequently produce enterotoxins that are responsible for the onset of the disease symptoms. Because Bacillus cereus may occur as vegetative cells and as spores, the fate of both types of cells during passage through the gastro-intestinal tract has been subject of this study. In food both psychrotrophic and mesophilic strains can be found, therefore both types of strains have been used for the current investigations. At first, the results will be discussed for the spores and vegetative cells separately, and finally the impact of the obtained results on the risk of disease will be discussed.

RIVM report 250912003 page 29 of 86
In Figures A.3.1 and A.3.2 the behaviour of spores of psychrotrophic and mesophilic strains during exposure to pH 2.5 in simulated gastric fluid (SGF) is shown. The variation in counts at the various time points is all within one log-unit without any regular trend, not upward nor downward. From this can be concluded that during the 60 minute exposure the total number of spores measured as colony forming units does not change. Two notable observations from the experiments regarding survival of vegetative cells in SGF (see Tables A.3.2 and A.3.3) can be made. Firstly, a sharp drop in survival with the decrease of 0.5 unit in pH. And secondly, the pH below which the D-values sharply drops, differs for stationary phase cells and exponential phase cells. The stationary phase cells appear to be more acid-tolerant than the exponential phase cells, regardless of the growth temperature profile (psychrotrophic or mesophilic) of the strains. Comparison of Tables A.3.2 and A.3.3 (columns on D pH 4.0 and D pH 4.5) also shows the influence of the addition of pepsin to the SGF. When taking a closer look at the stationary phase cells at pH 4.0 (Table A.3.2), the D-values of the investigated psychrotrophic strains appear to drop more dramatically upon addition of pepsin than the D-values of the mesophilic strains. The influence of pepsin on the exponential phase cells at pH 4.5 appears to be different: pepsin appears to increase the D-values of circa 60% of the tested strains. It should be mentioned that other phenomena also may be of influence here. Firstly, pH 4.5 is a condition at which Bacillus cereus may actually grow instead of staying alive or even die. And secondly, the influence of pepsin decreases with increasing pH (the optimal working pH is 1.5). At the other pH values used for these researches the influence of the addition of pepsin to SGF is less apparent. After passing the stomach spores reach the small intestine. The pH of the small intestine is near neutral, and, even before food reaches the small intestine, bile salts and pancreatic juice are secreted into the small intestine (Marieb, 1998). In Figures A.3.3 to A.3.6 the results are described of exposure of spores to complete simulated intestinal fluid (complete SIF). Total cell- and spore counts have been performed in order to discover what happens to the spores. From the graphs in Figure A.3.3 can be concluded that spores from two of the six psychrotrophic strains (namely PAL 17 and PAL 18) germinate in complete SIF and grow slightly. In Figure A.3.4 can be seen that the spore counts of all six strains show some degree of decrease; this can been interpreted as germination of spores of all strains. However, for four of the six psychrotrophic strains the conditions in the small intestine appear to be unfavorable for growth of germinated spores (see Figure A.3.3). The spores of the mesophilic strains, however, all show growth during exposure to complete SIF, although strains PAL 5 and PAL 25 lag behind (see Figure A.3.5). Contrary to the other four mesophilic strains the spore counts of the samples of strains PAL 5 and PAL 25 show hardly any decrease. This means that the germination efficiency was very small, The spore count of strain PAL 26 (see Figure A.3.6) drops more dramatic than of the other strains, while the total count does not increase proportionally. No explanation can be given for this phenomenon.
page 30 of 86 RIVM report 250912003
From these results it can be concluded that spores of both types of strains (psychrotrophic and mesophilic) appear to be capable to germinate under conditions simulating the small intestine. Subsequently all mesophilic strains appear to be able to grow, whereas only two of six psychrotrophic strains appear to show growth. This is another report of differences between psychrotrophic and mesophilic strains, comparable to differences in heat susceptibility between the two types of strains (Dufrenne et al., 1995, chapter 1 of this report). The effect of exposure to simulated intestinal fluid with and without the addition of pancreatin and bile (either separately or in combination) is expressed in generation times in minutes in Tables A.3.4 and A.3.5. The addition of additives (pancreatic juice, bile salts, pancreatic juice plus bile salts) to simulated intestinal fluid (SIF) has an adverse effect on the stationary phase cells of psychrotrophic and mesophilic origin although the effect on the latter is less dramatic. This can be deducted from the fact that the generation times of all six psychrotrophic strains reach values of over two hours (see Table A.3.4). The effect on exponential phase cells is less dramatic (see Table A.3.5). The generation times of two of the six psychrotrophic strains increase to over 2 hours, whereas the generation times of the other four strains also show an increase, which is however less dramatic. The increases in generation times for the mesophilic exponential phase cells are, apart from strain PAL 2 with the addition of bile, less than with the mesophilic stationary phase cells. From the separate additions bile seems to induce the largest increase in generation time. For all strains, psychrotrophic as well as mesophilic in exponential and in stationary phase, the generation times increase upon the addition of bile. The addition of pancreatin, on the contrary, appears to have less influence. For most strains an increase in generation time can be observed. Apart from the stationary phase psychrotrophic strains, the effect of co-exposure to bile salts and pancreatin, as in complete SIF, appears to be smaller than the effect of each of the additions separately. The previously described differences between spores of psychrotrophic and mesophilic strains are confirmed by the experiments in which spores were first exposed to low pH in SGF and subsequently transferred to complete SIF. The results of these experiments are shown in Figures A.3.7 and A.3.8 for the psychrotrophic strains, and in Figures A.3.9 and A.3.10 for the mesophilic strains. Again, like in the experiment with complete SIF alone, the psychrotrophic strains PAL 17 and PAL 18 are able to germinate and grow in SIF after exposure to SGF (Figure A.3.7), while the other psychrotrophic strains show no increase in total numbers. However, pre-exposure to pH 2.5 of spores from the mesophilic strains appears to be favorable for subsequent growth in SIF. Comparing Figures A.3.5 and A.3.9, the total counts at t=300 SIF in figure 9 appear to be higher than the total counts at t=240 in figure 5. However, contrary to the findings in complete SIF alone, PAL 25 shows proper growth after prior exposure to low pH in SGF. Due to the missing value at t=300 in SIF it is hard to draw conclusions on the behaviour of this strain in complete SIF after exposure to SGF at low pH.
RIVM report 250912003 page 31 of 86
From these results it may be concluded that the spores of strain PAL 25 are somehow affected by the low pH, resulting in better growth in complete SIF. Although only one psychrotrophic and one mesophilic strain were used, variation of the pH of the SGF used for exposure of spores before transfer to complete SIF does show an effect for the experiments involving pH 1.0 in SGF (see Figures A.3.11 and A.3.12). The total counts in complete SIF of the psychrotrophic strain after preincubation at pH 1.0 in SGF are lower than those for pH 2.5 and pH 4.0. The total counts of the mesophilic strain at pH 1.0 result in a slower growth after transfer to complete SIF, compared to the preincubation pH’s 2.5 and 4.0. This can be derived by calculating the generation time from the data: with pH 1.0 preincubation the generation time in complete SIF between t=180 and t=300 becomes 45 minutes, while with the pH 2.5 and 4.0 preincubation the generation times are 29 and 24 minutes, respectively. As with the spores, the ultimate test was the exposure of the vegetative cells to low pH in SGF followed by incubation in complete SIF, mimicking the passage through the stomach and the small intestine. Exponential phase cells were prepared by incubating the strains for four hours. As within that time span only the mesophilic strains reached sufficiently high cell numbers, experiments mimicking the passage through the stomach and the small intestine were not carried out with exponential phase psychrotrophic cells. It takes a long time, often over 4 hours, in complete SIF for all psychrotrophic and some mesophilic strains in stationary phase at pH 1.0 and 2.5 to reach countable numbers in complete SIF. At pH 4.0, countable numbers of most of the mesophilic strains are obtained within three hours while the psychrotrophic strains again trail behind. This can be concluded from Figures A.3.19, A.3.20, and A.3.22 to A.3.25. Therefore the assumption that vegetative cells alone will be able to cause diarrhoeal symptoms after ingestion of around 107 cells/ml is quite unlikely. And if vegetative cells would contribute to disease, the data in Figures A.3.19 and A.3.20 give an indication that the mesophilic strains again are of greater importance than the psychrotrophic strains. However, one has to bear in mind that these experiments were carried out in complete SIF without the addition of any food component, solid or fluid. For the Bacillus cereus cells it can be described as the worst case scenario, since they are directly exposed to low pH in the SGF and all ingredients in the intestinal fluid and do not have the protection of any kind of, for example, solid food ingredients. Finally, the exposure of stationary phase vegetative cells to low temperature did neither bring any protection to the low pH in the SGF nor the opposite, as can be derived by comparing Figures A.3.19 and A.3.20 with Figures A.3.23 and A.3.24, respectively. SIF is a complex medium to work with and the experiments were that elaborate that only a very limited number of strains, either as spores or as vegetative cells, could be tested each day. Instead of performing all experiments in duplicate or triplicate, one strain was used as a control strain in each experiment. The results for this strain were analyzed statistically, and for experiments with spores or vegetative cells, the reproducibility appeared to be good. Therefore, we concluded that the experiments could be compared to one another.
page 32 of 86 RIVM report 250912003
Since 37°C is (near) the maximum growth temperature and 28 to 30°C is the optimal growth temperature for the psychrotrophic strains, the question arose whether the changes in generation times were not just due to temperature instead of to the changed environment. As can be seen from Table A.3.6, the increase in generation time between BHI and SIF for the mesophilic strains is, apart from strain PAL 2, less than 1.5 fold. For the psychrotrophic strains, however, the difference is a factor 1.5 to 2 for all strains. This led to the conclusion that the differences in generation times as found in the previous experiments are mainly due to the use of SIF and not to the temperature used in the experiments. And thus can be concluded that the mesophilic strains appear to be less affected by the intestinal environment. 3.4.2 General discussion Based on the results of all experiments, the mesophilic strains appear to be more important for the onset of diarrhoeal disease, because they appear to be less affected by intestinal conditions. But some additional remarks are justified. The described experiments were carried out in stationary simulated fluids, with nothing of the intestinal epithelial layer present. The intestinal epithelial layer forms an important part of the pathogenic mechanism for the diarrhoeal syndrome, since damage to the epithelial layer leads to diarrhoea. So only part of the influence of the intestinal environment has been studied. Experiments regarding the interaction between Bacillus cereus and differentiated Caco-2 cells as model for the epithelial layer of the small intestine are described in part three of this report. In the small intestine in vivo the addition of pancreatic juice and bile salts to the intestinal fluid is regulated by a number of factors such as the smell or sight of food and the amount of food that enters the small intestine (Guyton and Hall, 1996; Marieb, 1998). Also, in vivo the influence of the additives will decrease with ongoing transport of material through the small intestine from the duodenum to the ileum, leading to decreased influence on the B. cereus spores/vegetative cells. In the experiments described here only a single dose of the additives to intestinal fluid has been tested, so no data are available on the influence of varying concentrations of bile and/or pancreatic juice. As stated in the introduction, the pH in the stomach will change during the consumption of food, dependent on the type of food and the individual. The pH will increase when food starts entering the stomach, and subsequently the pH will decrease to the low values that indicate the non-fed state of the individual (De Jonge et al., 2003). The pH may even reach values higher than 4.0, a pH at which vegetative cells can survive. In small amounts of food passing through the stomach the concentration of B. cereus vegetative cells may be very high. The amount of vegetative cells that can pass the stomach will decrease with transit time through the stomach, which is estimated to have a mean value of 2 hours (Marieb, 1998). Therefore the participation of vegetative cells to the pathogenesis of the diarrhoeal syndrome cannot be excluded, especially during the first moments of food ingestion when the digestive system still has to start working optimally. Data with respect to the contribution of vegetative cells to the diarrhoeal syndrome will be reported elsewhere (Wijnands et al, in preparation b).
RIVM report 250912003 page 33 of 86
Results, involving the occurrence of B. cereus in food commodities, show that sometimes a single food commodity is contaminated with more than one strain of B. cereus (Wijnands et al, in preparation a). Co-ingestion of various types of B. cereus will not be uncommon, and should therefore be considered as future research topic. For example, when thinking of co-ingestion of psychrotrophic and mesophilic spores, one has to bear in mind the following situation. Although the total number of spores may seem high enough to cause diarrhoea, no symptoms might occur due to the inability of psychrotrophic spores to grow in the small intestine after germination. Also, when considering the hypothesis that adhesion of spores to epithelial cells is believed to be a very important factor in the pathogenic mechanism, even more important than mentioned in the literature (Andersson et al., 1998), the psychrotrophic spores might block binding space on the epithelial cells, causing less adhesion of mesophilic spores and therefore less growth and less chance for disease symptoms. However, this is still speculative and should be investigated after further research of adhesion of spores to epithelial cells of the small intestine. The researches described in this report contribute to the clarification and understanding of the pathogenesis of the diarrhoeal syndrome caused by B. cereus as far as passage through the stomach and survival and growth in the small intestine are concerned. This is of importance in assessing the hazard and the subsequent description of the risk assessment concerning B. cereus in food. Eventually these results may contribute to a better description of the dose-response relation. It has to be taken into consideration, however, that these researches were carried out under simulated conditions without the addition of any food component, representing the “worst case” for B. cereus. This means that not all is clarified yet.
3.5 Conclusions Spores and vegetative cells from 6 psychrotrophic and 6 mesophilic strains of B. cereus were used to study the behaviour of B. cereus in the gastro-intestinal passage under simulated conditions. These studies demonstrated that:
− Spores were not affected by exposure to simulated gastric conditions; vegetative cells were rapidly inactivated with lowering pH. Stationary phase cells were more resistant to lowering of the pH than exponential phase cells.
− Mimicking the gastro-intestinal passage learned that spores from 5 out of the
6 mesophilic strains germinated and grew in the simulated intestinal fluid after exposure to pH 2.5 in gastric fluid. From the spores of the psychrotrophic strains 2 out of 6 germinated and grew after exposure to low pH in simulated gastric fluid. Pre-exposure to pH 1.0 in SGF led to a lower number of spores transferred to the SIF and lower growth rates in SIF.
page 34 of 86 RIVM report 250912003
Short during pre-exposure of spores and vegetative cells at a temperature of 10oC had no effect on the subsequent behaviour in the gastro-intestinal transfer. The effect of long time pre-exposure was not investigated.
− The generation times of psychrotrophic vegetative cells increased more in simulated
intestinal fluid than those of mesophilic vegetative cells, when compared to the generation times in brain heart infusion broth.
− Mesophilic strains appear to cope better with the conditions during the gastro-
intestinal passage than the psychrotrophic strains. Therefore, the mesophilic strains appear to be more important for the onset of diarrhoeal disease than the psychrotrophic strains.
RIVM report 250912003 page 35 of 86
4. Interaction between Bacillus cereus and differentiated Caco-2 cells (as a model for the epithelium of the small intestine)
4.1 Introduction The pathogenesis of the toxico-infection is still largely unknown, but is more complicated than the pathogenesis of the emetic syndrome. It is believed to be as follows: food contaminated with spores and/or vegetative cells is consumed; spores will survive the harsh conditions in the stomach, germinate and grow in the small intestine, and produce enterotoxins. Vegetative cells will partly pass the stomach, grow in the small intestine and produce enterotoxins as well. More and better understanding of the events happening in the gastro-intestinal tract is of importance for better risk assessment on B. cereus. We started investigations regarding several parts of the pathogenesis of the toxico-infection. Items of research are: 1) the behaviour of spores and vegetative cells during the simulated gastro-intestinal transfer (see chapter 2 of this report), 2) the interaction of B. cereus with the epithelial layer of the small intestine (this chapter) and, 3) production of enterotoxins in simulated intestinal fluid (to be published elsewhere). In chapter 2 of this report we showed that spores and vegetative cells of mesophilic strains (i.e. strains that hardly grow < 10ºC, and grow well at 37ºC) probably form a greater risk than psychrotrophic strains (i.e. strains that grow easily < 10ºC, but have difficulties growing at 37ºC). This conclusion was based on the phenomenon that 5 out of 6 mesophilic strains and 2 out of 6 psychrotrophic strains were able to grow in simulated intestinal fluid after exposure to simulated gastric fluid, and on the observation that mesophilic strains grow faster in simulated intestinal fluid. The diarrhoea caused by B. cereus is classified as secretory diarrhoea, in which the water and electrolyte transport between lumen and the epithelial cells is disturbed (Belaiche, 2000). Therefore the investigations, regarding the interaction between B. cereus spores/vegetative cells and the epithelial layer of the small intestine, as described in this chapter, are of importance. A number of observations led to the hypothesis that disease may only occur if spores and/or vegetative cells adhere to the epithelium of the small intestine. These observations were:
– The incubation time of the disease is 6 – 24 hours (Kramer and Gilbert, 1989) – The lag time in simulated intestinal fluid is 2 – 3 hours (see chapter 2) – Production of enterotoxins starts in the exponential growth phase (Granum et al.,
1993) – Production of enterotoxins is detectable during the exponential growth phase (in in
vitro experiments) starting at a cell count of 106 – 107 colony forming units per millilitre (not published results),
page 36 of 86 RIVM report 250912003
– The mean transit time through the stomach and the small intestine is 6 hours (not published results); a transit time of 2 hours through the small intestine has been mentioned (Moffett et al., 1993), and
– The enterotoxins are highly instable molecules; in vitro the activity vanished within 30 minutes (to be published elsewhere).
For the investigations on the interaction between B. cereus and the small intestinal epithelium, Caco-2 cells were used. Although the origin of these cells is the human colon, these cells resemble, after differentiation, the epithelial cells of the small intestine. They have been widely used to investigate adhesive and invasive properties of a large variety of microorganisms (Jaradat and Bhunia, 2003; Bolton et al., 2000; Morita et al., 2002).
4.2 Materials and Methods 4.2.1 Strains The B. cereus strains and their origin are mentioned in Appendix 3 Table A.3.1. 4.2.2 Production and preparation of spores See section 3.2.2. 4.2.3 Production of vegetative cells Brain heart infusion broth (BHI) was inoculated with glass beads of the twelve strains and incubated overnight (18 – 20 hours) at 30ºC. 4.2.4 Total and spores counts See section 3.2.5. 4.2.5 Culturing of Caco-2 cells6 and HEp-2 cells7 Caco-2 cells, obtained from ATCC (HTB-37, ATCC, USA), were cultured in DMEM 10% [Dulbecco’s Modified Eagle Medium (Gibco, 42430-025) supplemented with heat-inactivated fetal calf serum (10% v/v, Integro B.V., the Netherlands), 5 ml 100x non-essential amino acids (Gibco, 11140-035), 2 mM glutamine (Gibco, 25030-024), and 0.05 mg ml-1 gentamycine (Gibco, 15750-037)]. Cells were collected every 7th day by washing the monolayer twice with 0.022% disodium-EDTA (Acros, 14785) in phosphate buffered physiological salt solution (PBS, 0.07M, pH 7.2) and trypsinising the cells using 50 µg ml-1 trypsine (Gibco, 25050-014), in 0.022% di-Na-EDTA in PBS. Cells were seeded to a concentration of 1x10⁶ cells in 10 ml DMEM 10% in 75 cm2 culture bottles (Costar, 3376). The bottles were incubated at 37ºC with 5% carbon dioxide. The culture medium was refreshed every 4th day after passage of the cells. 6 Caco-2 cells = human colorectal adenocarcinoma cells
RIVM report 250912003 page 37 of 86
HEp-2 cells, a gift from dr. Erwin Duizer (RIVM, Bilthoven, The Netherlands) were cultured similarly in MEM 10% [Minimal Essential Medium with Hank’s salts (Gibco) supplemented with penicillin/streptomycin (100 units ml-1, 100 µg ml-1 respectively), sodium bicarbonate (0.08 % w/v), and heat-inactivated foetal calf serum (10% v/v, Integro B.V., the Netherlands)]. 4.2.6 Preparation of differentiated Caco-2 cells After washing and trypsinization Caco-cells from passage 25 to 45 (Duizer 1999) were seeded in 12-well plates at a concentration of 1.6x10⁵ cells ml-1 in DMEM 10%. In each well 1 ml of this suspension was pipetted. Plates were incubated at 37ºC with 5% carbon dioxide for 23 days before use in adhesion experiments. Each second or third day the medium in the wells was replaced by fresh medium. For microscopy experiments, cover slips were placed in the wells before adding the Caco-2 cell suspension in order to obtain differentiated Caco-2 cells on cover slips. 4.2.7 Adhesion/invasion experiments Adhesion/invasion experiments were carried out in 12-well plates containing differentiated Caco-2 cells or HEp-2 cells (1.6x10⁵ cells per well) or in 12-well plates without cells. Before the start of the experiment, the Caco-2 cells or HEp-2 cells were washed three times with experimental culture medium (ECM), i.e. DMEM 10% without gentamycine and heat-inactivated foetal calf serum for Caco-2 cells (Caco-2-ECM) or MEM 10% without penicillin/streptomycin and heat-inactivated foetal calf serum for HEp-2 cells (HEp-2-ECM). The required number of vials from the -70°C stock containing 1 ml spore suspension per vial were thawed. The spores were washed once with appropriate ECM (600 µl washing solution, centrifugation at 13,000xg during 5 minutes), and resuspended in appropriate ECM (1 ml per vial). To determine the initial number of viable particles total and spore counts were carried out after resuspending the spores in ECM. Per well, 40 µl spore suspension in appropriate ECM was added, plates were centrifuged briefly (1 minute at 175xg) and incubated at 37°C with 5% carbon dioxide (t=0). After 1 hour incubation (t=1), the 12-well plates containing either Caco-2 or HEp-2 cells or no cells were washed three times with appropriate ECM. Subsequently 1% Triton X-100 (Merck, Darmstadt) in PBS (0.07 M, pH 7.2) was added, to lyse the Caco-2 or HEp-2 cells and to collect remaining B. cereus cells (spores and/or vegetative cells). The lysates were investigated for total counts and spore counts 4.2.8 Microscopic determination of adhesion/invasion Differentiated Caco-2 cells on cover slips placed in 12-well plates were exposed during one hour to spores from strain 28, and further incubated in Caco-2-ECM. The cover slips were washed with physiological salt solution, and subsequently the DNA in the Caco-2 cells and the spores was coloured with the fluorescent dye propidium-iodide (Molecular Probes, 7 HEp-2 cells = human laryngeal epidermoid carcinoma cells

page 38 of 86 RIVM report 250912003
Eugene, OR USA), according to the manufacturer’s instructions. Subsequently the cover slips were placed upside down on a microscope slide for microscopic research with a laser scanning microscope (BioRad, Hercules, CA USA). Combination of pictures taken at various heights gives a top to bottom view through the Caco-2 cells. Pictures were taken after various incubation times. These experiments were carried out three times, with different batches of Caco-2 cells, using strain 28. 4.2.9 Control experiments Three 12-well plates with differentiated Caco-2 cells were used. One was incubated in ECM with spores of strain 28, and two plates were incubated with differentiated Caco-2 cells in ECM without spores. After one hour incubation the supernatants from all wells per plate were collected and centrifuged for 10 minutes at 1800xg. Half of the centrifuged supernatant from the plates without spores was heated for 5 minutes at 100ºC. All supernatants, heat treated and not heat treated, were pipetted into plates without differentiated Caco-2 cells (one plate per type of supernatant). Subsequently, 40 μl spore suspension were added per well (total 9 wells). Again the plates were incubated for 1 hour, the excess of spores washed away and samples were investigated at T=0, T=1, and T=3, as described under “Adhesion/invasion experiments”. As control for the reproducibility of the method, one 12-well plate with Caco-2 cells and one plate without Caco-2 cells were exposed during 1 hour to spores and subsequently treated as described under “Adhesion/invasion experiments”.
4.3 Results Tables and figures regarding this chapter can be found in Appendix 4. Microscopic observations did not show any evidence for invasion of B.cereus spores in differentiated Caco-2 cells. Therefore, from now on only adhesion will be mentioned and not adhesion/invasion. An overview of the adhesive properties of spores of the twelve strains used for these experiments is given in Table A.4.1 and Figures A.41 and A.4.2. In Table A.4.1, for each strain the total counts at t=0 (start of the experiment) and at t=1 (after 1 hour incubation) are shown. In the left part of the table (and in Figure A.4.1) after spores had been added to Caco-2 cells, in the right part of the table (and in Figure A.4.2) after vegetative cells had been added to the Caco-2 cells. Spores of all strains show some degree of adhesion, as indicated by the percentages in Table A.4.1 ( the higher the percentage, the higher the degree of adhesion) and by the differences between the total counts at t=0 an t=1 per strain in Figure A.4.1. Also the vegetative cells show adhesive properties, as depicted in Table A.4.1 and Figure A.4.2.
RIVM report 250912003 page 39 of 86
In Table A.4.2 the results for adhesion of spores to plates with (t=1 Caco-2) and without Caco-2 cells (t=1 cell free) are compared after the addition of spores at t=0. For each strain at t=1 the total and spore counts were determined, and from these numbers a spore count/ total count ratio was determined. In the right column of the table the t=1 cell free ratio is divided by the t=1 Caco-2 ratio. This gives a germination index. A germination index from ≤ 1 means no germination, a ration > 1 means germination. The higher this germination index the higher the degree of germination. In Figure A.4.3 the phenomenon of germination influence by Caco-2 cells is depicted for strain 28. The left (darker) bars represent the total counts at the given time points, the right (lighter) bars represent the spore counts at the given time points. At t=1 cell free the difference between total and spore count is a lot smaller than at t=1 Caco-2, indicating that with the Caco-2 cells present a high degree of germination has taken place. At t=1 cell free the degree of germination is a lot smaller. The various control experiments were carried out to learn more about 1) the production and use of the germination inducing compound (Figure A.4.4A), 2) heat stability of the compound (Figure A.4.4B), and 3) whether the compound is produced commonly by epithelial cells (Figure A.4.4C). The activity of the compound was based upon its germination inducing property. In case germination of spores occurred after the addition of spores to Caco-2 cells, the number of spores should drop and the number of vegetative cells should become high compared to the number of spores. This property was translated into a ratio spore count / total count. In case of germination the ratio should be <<1, no germination would result in a ratio close to 1. In Figure A.4.4 the results of various control experiments are shown. To obtain Figure A.4.4A supernatants from differentiated Caco-2 cells were exposed to spores or not prior to the transfer of the supernatant to a new cell-free plate and addition of spores to this plate. Apparently the germination inducer was readily absorbed by spores that were added to the first plate with Caco-2 cells. After all, the supernatant was no longer able to induce germination in the cell free plate, as indicated by a relatively high germination ratio (1.6x10⁴/3.3x104 = 0.46) at “t=1 sup from exposed Caco-2 cells” in Figure A.4.4A. The germination ratio obtained after transfer of non exposed supernatant has become very low (1.4x10²/7.5x103 = 0.016), indicating that the germination inducer was still present in this supernatant. The left pair of bars in figure 4A represents the starting situation, namely the spore and total count of the spores suspension added to the supernatant, with the spore count equal to the total count. Exposure of the germination inducer to heat does not influence its inducing capacity. As shown in Figure A.4.4B with and without heat treatment the germination ratio becomes low: 1.2x10²/3,7x104 = 0.003 at “t=1 untreated sup” and 1.9x10²/3.3x104 = 0.006 at “t=1 heat-treated sup”. The germination inducer is not commonly produced by epithelial cells. HEp-2 cells do not induce to germination, the spore count / total count ratio is 8.0x10⁴/1.4x105 = 0.57 (see figure A.4.4C “t=1 HEp-2”) which is close to the ratio in a cell free plate 7.0x10⁴/7.8x104 = 0.90 (see Figure A.4.4C “t=1 CF”).
page 40 of 86 RIVM report 250912003
4.4 Discussion Differentiated Caco-2 cells are widely used in research as an in vitro method for studying the epithelial cells of the small intestine. The interaction of various microorganisms with the small intestinal epithelium has been investigated using differentiated Caco-2 cells (Jaradat and Bhunia, 2003; Morita et al., 2002). Since the toxico-infection due to B. cereus is a phenomenon that takes place mainly in the small intestine, the use of these differentiated Caco-2 cells appeared to be the logical step for closer evaluation of the pathogenic mechanism. Adhesion of spores is a subject that is investigated within the scope of safe production of food, particularly with contamination of surfaces that are in contact with food commodities during preparation. Spores of B. cereus have been found to adhere to a variety of surfaces, namely metal, glass, and plastics (Peng et al., 2001; Faille et al., 2002; Rönner et al., 1990). Therefore, it is not surprising that spores adhere to differentiated Caco-2 cells, as shown in this report and as described previously (Andersson et al., 1998). However, we found that spores from all strains used for the investigations were able to adhere to differentiated Caco-2 cells. Apart from one, there was no similarity between our and their strains. Another important difference between the two investigations was also the method for detecting adhesion. Where Andersson et al. (1998) used microscopy, we employed culture methods for determining the number of adhered B. cereus cells. Also, we found that vegetative cells adhere to differentiated Caco-2 cells. This has been described before (Minnaard et al., 2004) and is an important finding in the explanation of the pathogenic mechanism of the toxico-infection caused by B. cereus. Because, after spores and/or vegetative cells have reached the small intestine, as a consequence of the consumption of contaminated food, the circumstances in the small intestine make adhesion to the epithelial cells prerequisite for the onset of the diarrhoeal syndrome. The nature of adhesion can, based on these results, only be speculated on. Some microorganisms, such as Listeria monocytogenes use specific receptors on the epithelial cells for adhesion (Jaradat and Bhunia, 2003). The presence of such adhesins on the surface of B. cereus spores and/or vegetative cells has never been established. Therefore, no definite answer can be given. Another phenomenon is at least as important to mention. When comparing spore adhesion to differentiated Caco-2 cells in 12-well plates and adhesion to the same plates without differentiated Caco-2 cells, the spores in the plate without differentiated Caco-2 cells showed no or delayed germination. The differentiated Caco-2 cells appear to excrete a compound capable of inducing germination of spores in 8 of the 12 B. cereus strains that were used in these investigations. Spores readily absorb the germination inducing compound. After all, supernatant from Caco-2 cells, that had not been exposed to spores, induced germination after transfer to a cell free plate and the subsequent addition of spores. Whereas, supernatant from Caco-2 cells, that had
RIVM report 250912003 page 41 of 86
been exposed to spores, was not able to induce germination. Apparently, the germination inducing compound was no longer available. The germination inducing compound appears to be heat resistant, since heating of supernatant of non-exposed Caco-2 cells did not reduce the germination inducing potential of the supernatant. The compound will therefore not be a large biological molecule, like a protein, but rather a small molecule. Induction of germination does not appear to be a property of epithelial cells in general, since spores adhered to HEp-2 cells, but were not induced to germinate. The experiments with differentiated Caco-2 cells, and all the controls, were carried out in cell culture medium. Such medium is very rich, i.e. it contains a broad spectrum of compounds, including salts, amino acids and vitamins. The germination inducing properties of several compounds, such as alanine and inosine, have been described (Preston and Douthit, 1988). Recent investigations have shown the germination inducing properties of various other compounds such as glutamine and adenosine (Hornstra et al., 2004). The culture medium for Caco-2 cells, and the experimental medium used for the adhesion experiments, both contain glutamine. But despite the presence of glutamine, spores could not germinate. There may be two explanations for this phenomenon. First, the concentration of glutamine in the experimental medium, being circa 6 mM, may be too low. And second, for the induction of germination more than one compound might be necessary, and besides glutamine no other compound is present in the experimental medium. The differentiated Caco-2 cells appear to produce either a compound that can induce germination by itself or supplement the amount of glutamine to a level necessary for germination. Further investigations to the nature of the germination inducing compound produced by differentiated Caco-2 cells are therefore most interesting. However, it has to be confirmed that small intetinal epithelial cells also induce germination of spores of B. cereus . The relevance of the induction of germination by differentiated Caco-2 cells can, for the time being, only be speculated on. It is known that spores contain several receptors for germination (Shibata et al., 1986). In our studies we found that some strains did not show induction of germination by differentiated Caco-2 cells. Maybe spores of these strains lack one or more receptors, making them unable to germinate under conditions as posed in the in vitro differentiated Caco-2 system. However, we used this system to study adhesion to the small intestinal epithelium, in the absence of intestinal fluid after feeding, i.e. in the absence of bile salts, pancreatic proteolytic activity, and food constituents. Therefore, it is not the best way to investigate the assumption that the presence of germination receptors, or rather the absence, may discriminate between hazardous and non-hazardous strains. Also, the strains that were used for these investigations do not permit further speculation into this subject. Although some of the strains derive from possible food outbreaks, it is not certain that they were indeed the organisms at fault for the symptoms.

page 42 of 86 RIVM report 250912003
Therefore, further research to investigate the contribution of germination receptors to the pathogenesis of B. cereus is recommended.
4.5 Conclusions Differentiated Caco-2 cells were used to mimic the epithelium of the small intestine, in order to study the interaction between B. cereus and the small intestinal epithelium. Our studies demonstrate that:
− Both spores and vegetative cells show adherence to the differentiated Caco-2 cells. − No invasion of B. cereus cells in differentiated Caco-2 cells was observed. − Differentiated Caco-2 cells excrete a compound that is able to induce germination of
spores from 8 out of 12 B. cereus strains. The compound is readily absorbed or neutralized by the spores, is heat stable, and apparently not commonly produced by epithelial cells.
RIVM report 250912003 page 43 of 86
5. General discussion and conclusion From the two types of food borne disease caused by B. cereus, the incidence of the toxico-infection or diarrhoeal syndrome is difficult to estimate. Important reasons are the relative mild symptoms and the short duration of these symptoms, as a result of which few patients seek medical assistance. Risk assessment might offer an alternative method to estimate incidence of this disease. For this, information is necessary on the prevalence of the organism and on the factors influencing the onset of disease. Especially some factors influencing the latter have been assessed in this report: factors regarding the organism itself, and factors regarding the environment (= gastro-intestinal tract) where the disease takes place. B. cereus is an organism with very divergent properties. Growth may occur over a wide range of pH and temperature (Kramer and Gilbert, 1989), inactivation of the spores appears to be dependant on the growth temperature profile (see chapter 1 of this report). In other words, the onset of disease depends strongly on the type of B. cereus that is ingested with the food. The data for determination of growth temperature profiles were obtained by techniques using artificial culture media. From these data can be seen that the discrimination between psychrotrophic and mesophilic strains is not black and white. We also determined the generation times and lag phases for a number of strains in simulated intestinal fluid. Whereas these results appear to be more straightforward, the discriminative potential of the simulated intestinal fluid seems to be better than that of artificial culture media. Also, simulated conditions resemble the in vivo situation more closely, and are therefore more suitable for studying the pathogenesis. Moreover, results from simulated conditions may improve the quality of models mimicking the pathogenesis. This statement is supported by the difference in survival of Salmonella on carrot and in culture media during heating processes. Where Salmonella in culture media die readily with increasing heat, on carrot slices the Salmonella survives longer (DiPersio et al., 2005). Similar results are found with Campylobacter, readily killed in culture media and much more difficult to kill when adhered to chicken meat (De Jonge, unpublished results ). The pathogenesis of the diarrhoeal syndrome is as follows. B. cereus is ingested with contaminated food, passes the stomach and reaches the small intestine. There, spores of B. cereus will germinate to become vegetative cells that will grow and produce enterotoxins. The enterotoxins, finally, affect the epithelium resulting in diarrhoea. B. cereus can be ingested as spores and as vegetative cells. The final outcome, the diarrhoeal syndrome, is not influenced by the type of cell. For steps in between ingestion and disease, the type of cells may be of importance. We have shown that spores will hardly be affected by the low pH of the stomach, while vegetative cells are dependant on the value of the pH (chapter 2 of this report).
page 44 of 86 RIVM report 250912003
Although the onset of the diarrhoeal syndrome has been characterized earlier as being caused by enterotoxins without any direct interaction of the organism with the host (Granum et al., 1995), interaction between the epithelium of the small intestine and B. cereus cells may influence the outcome of the ingestion of the organism. Moreover, ingestion simulations after modeling the various steps of diarrhoeal syndrome indicate that adhesion is an essential step in the pathogenesis. No adhesion would mean that B. cereus would flush out of the small intestine without causing any disease (Pielaat et al., 2005). Moreover, enterotoxins are readily inactivated in simulated intestinal fluid. Since these enterotoxins cause the symptoms of the diarrhoeal syndrome, close proximity of B. cereus to the small intestinal epithelium is a prerogative for the onset of this disease (Wijnands et al., in preparation c). Therefore, adhesion is not only necessary for B. cereus to stay long enough in the small intestine to grow to sufficient numbers, but also to ensure that the enterotoxins are produced close enough to the epithelium to prevent inactivation. Not only adhesion of B. cereus to the epithelial cells seems to play a role, the epithelial cells of the small intestine are even able to induce germination of ingested spores (chapter 3 of this report). The investigations described in this report contribute to a better understanding of the pathogenesis of the diarrhoeal syndrome. Together with other factors, such as prevalence and dose-response relationship, the risk for diarrhoeal disease can be better estimated, and with that a better estimation of the incidence of the syndrome can be given.

RIVM report 250912003 page 45 of 86
References Agata, N., Ohta, M., Mori, M. and Isobe, M., 1995. A novel dodecadepsipeptide, cereulide, is an emetic toxin of Bacillus cereus. FEMS Microbiology Letters, 17-20.
Andersson, A., Granum, P. E. and Ronner, U., 1998. The adhesion of Bacillus cereus spores to epithelial cells might be an additional virulence mechanism. International Journal of Food Microbiology 39[1-2], 93-99.
Anonymous, 1995. In United States Pharmacopeia - National Formulation USP 23/NF 18 pp. 2053. Rockville, MD: United States Pharmacopeial Convention Inc.
Belaiche, J. 2000. Pathophysiology of acute infectious diarrhea. Acta Endoscopica 30[3], 177-184.
Bolton, A.J., Osborne, M.P. and Stephen, J., 2000. Comparative study of the invasiveness of Salmonella serotypes Typhimurium, Choleraesuis and Dublin for Caco-2 cells, HEp-2 cells and rabbit ileal epithelis. Journal of Medical Microbiology 49, 503-511.
Cooper, I., Lord, T. and Tice, P., 1995. Hydrolysis studies in simulated gastrointestinal fluids. Food Additives and Contaminants 12, 769-777.
Daffonchio, D., Borin, S., Consolandi, A., Mora, D., Manachini, P.L. and Sorlini, C., 1998. 16S-23S rRNA internal transcribed spacers as molecular markers for the species of the 16S rRNA group I of the genus Bacillus. FEMS Microbiology Letters 163, 229-236.
De Jonge, R., Takumi, K., Ritmeester, W.S. and Van Leusden, F.M., 2003. The adaptive response of Escherichia coli O157 in an environment with changing pH. Journal of Applied Microbiology 94, 555-560.
De Wit, M.A.S., Koopmans, M.P.G., Kortbeek, L.M., Wannet, W.J.B., Vinjé, J., van Leusden, F., Bartelds, A.I.M. and van Duynhoven, Y.T.H.P., 2001. Sensor, a population-based cohort study on gastroenteritis in the Netherlands: incidence and etiology. American Journal of Epidemiology 154, 666-674.
DiPersio, P.A., Yoon, Y., Sofos, J.N. and Kendall, P.A., 2005. Inactivation of Salmonella during drying and storage of carrot slices prepared using commonly recommended methods. Journal of Food Science 70, 230-235.
Dressman, J. B., Berardi, R. R., Dermentzoglou, L. C., Russell, T. L., Schmaltz, S. P., Barnett, J. L. and Jarvenpaa, K. M., 1990. Upper gastrointestinal (GI) pH in young, healthy men and women. Pharmaceutical Research 7[7], 756-761.
Dufrenne, J., Bijwaard, M., te Giffel, M., Beumer, R. and Notermans, S., 1995. Characteristics of some psychrotrophic Bacillus cereus isolates. International Journal of Food Microbiology 27[2-3], 175-83.
Dufrenne, J., Tatini, S. and Notermans, S., 1994. Stability of spores of Bacillus cereus stored on silicagel. International Journal of Food Microbiology 23, 111-6.
page 46 of 86 RIVM report 250912003
Duizer, E., 1999. Permeability and modulation of the intestinal epithelial barrier in vitro. Wageningen, the Netherlands., Agricultural University Wageningen.
Duynhoven, Y.T.H.P. van, Boer, I.M. de and Broek, M.J.M. van den, 2005. Registratie van voedselinfecties en -vergiftigingen onderzocht bij de Inspectie voor de Gezondheidszorg en Voedsel en Waren Autoriteit, 2004. RIVM rapport 330010003 .
Faille, C., Jullien, C., Fontaine, F., Bello-Fontaine, M.N., Slomianny, C. and Benezech, T., 2002. Adhesion of Bacillus cereus spores and Escherichia coli cells to inert surfaces: role of surface hydrophobicity. Canadian Journal of Microbiology 48, 728-738.
Granum, P.E., 1994. Bacillus cereus and its toxins. Journal of Bacteriology Symposium Supplement 76, 61S-66S.
Granum, P.E., Brynestad, S., O' Sullivan, K. and Nissen, H., 1993. Enterotoxin from Bacillus cereus: production and biochemical characterization. Netherlands Milk and Dairy Journal 47, 63-70.
Granum, P. E., Tomas, J. M. and Alouf, J. E., 1995. A survey of bacterial toxins involved in food poisoning: a suggestion for bacterial food poisoning toxin nomenclature. International Journal of Food Microbiology 28[2], 129-44.
Guyton, A. C. and Hall, J. E., 1996. Textbook of Medical Physiology. Philadelphia (USA): W.B.Saunders Company.
Helgason, E., Okstad, O.A., Caugant, D.A., Johansen, H.A., Fouet, A., Mock, M., Hegna, I. and Kolsto, A.-B., 2000. Bacillus anthracis, Bacillus cereus, and Bacillus thuringiensis - One species on the basis of genetic evidence. Applied and Environmental Microbiology 66, 2627-2630.
Holbrook, R. and Anderson, J.M., 1980. An improved selective and diagnostic medium for the isolation and enumeration of Bacillus cereus in foods. Canadian Journal of Microbiology 26, 753-759.
Hornstra, L.M., de Vries, Y.P., de Vos, W. and Abee, T., 2004. Characterization of the germinant receptors in Bacillus cereus ATCC 14579. In preparation.
Jaradat, Z.W. and Bhunia, A.K., 2003. Adhesion, invasion, and translocation characteristics of Listeria monocytogenes sertypes in Caco-2 cell and mouse models. Applied and Environmental Microbiology 69, 3640-3645.
Kramer, J. M. and Gilbert, R. J., 1989. Bacillus cereus and other Bacillus species. In Foodborne bacterial pathogens ed. Doyle, M.P. pp. 21-70. New York: Marcel Dekker Inc.
Longland, R.C., Shilling, W.H. and Gangolli, S.D., 1977. The hydrolysis of flavouring esters by artificial gastrointestinal juices and rat tissue preparations. Toxicology 8, 197-204.
Marieb, E., 1998. Human Anatomy and Physiology. Menlo Park, CA, USA: The Benjamin/Cummings Publishing Company, Inc.
RIVM report 250912003 page 47 of 86
Minnaard, J., Lievin-Le Moal, V., Coconnier, M.-H., Servin, A.L. and Pérez,, P.F. 2004. Disassembly of F-actin cytoskeleton after interaction of Bacillus cereus with fully differentiated human intestinal Caco-2 cells. Infection and Immunity 72, 3106-3112.
C. L. Moffett, D. F., Moffett, S. B., and Schauf, C. L., 1993. Human Physiology. Foundations and frontiers. St. Louis, USA, Mosby-Year Book, Inc.
Morita, H., He, F., Fuse, T., Ouwehand, A.C., Hashimoto, H., Hosoda, M., Mizumachi, K. and Kurisaki, J., 2002. Adhesion of lactic acid bacteria to Caco-2 cells and their effect on cytokine secretion. Microbiology and Immunology 46, 293-297.
Mossel, D.A.A., Koopman, M.J. and Jongerius, E., 1967. Enumeration of Bacillus cereus in foods. Applied Microbiology 15, 650-653.
Peng, J. S., Tsai, W. C. and Chou, C. C., 2001. Surface characteristics of Bacillus cereus and its adhesion to stainless steel. International Journal of Food Microbiology 65[1-2], 105-111.
Pielaat, A., Wijnands, L. M., Takumi, K., Nauta, M. J. and Van Leusden, F. M., 2005. The fate of Bacillus cereus in the gastro-intestinal tract. RIVM Report 250912005.
Preston, R.A. and Douthit, H.A., 1988. Functional relationships between L- and D-alanine, inosine and NH4Cl during germination of spores of Bacillus cereus T. Journal of General Microbiology 134, 3001-10.
Rönner, U., Husmark, U. and Henriksson, A., 1990. Adhesion of Bacillus spores in relation to hydrophobicity. Journal of Applied Bacteriology 69[4], 550-6.
Rotard, W., Christmann, W., Knoth, W. and Mailahn, W., 1995. Bestimmung der resorptionsverfügbaren PCDD/PCDF aus Kieselrot. Zeitschrift für Umweltchemie und Ökotoxikologie 7, 3-9.
Russell, T. L., Berardi, R. R., Barnett, J. L., Dermentzoglou, L. C., Jarvenpaa, K. M., Schmaltz, S. P. and Dressman, J. B., 1993. Upper gastrointestinal ph in seventy-nine healthy, elderly, north american men and women. Pharmaceutical Research 10[2], 187-196.
Shibata, H., Ohnishi, N., Takeda, K., Fukunaga, H., Shimamura, K., Yasunobu, E., Tani, I. and Hashimoto, T., 1986. Germination of Bacillus cereus spores induced by purine ribosides and their analogs: effects of modification of base and sugar moieties of purine nucleosides on germination-inducing activity. Canadian Journal of Microbiology 32[2], 186-9.
Stetten, F. v., Francis, K. P., Lechner, S., Neuhaus, K. and Scherer, S., 1998. Rapid discrimination of psychrotolerant and mesophilic strains of the Bacillus cereus group by PCR targeting of 16S rDNA. Journal of Microbiological Methods 34[2], 99-106.
Wijnands, L.M., Dufrenne, J.B., Rombouts, F.M. and van Leusden, F.M., (In preparation a). Prevalence of potentially pathogenic Bacillus cereus in food commodities in the Netherlands.
Wijnands, L.M., Pielaat, A., Dufrenne, J.B., Zwietering, M.H. and van Leusden, F.M., (In preparation b). Quantification of the number of vegetative cells of Bacillus cereus passing through the stomach.

page 48 of 86 RIVM report 250912003
Wijnands, L. M., Abee, T., Zwietering, N. H., van Leusden, F.M., (In preparation c). Investigations into adherence, enterotoxin production and enterotoxin activity in relation to the diarrhoeal syndrome by Bacillus cereus.
RIVM report 250912003 page 49 of 86
Appendix 1 Simulated gastric and intestinal fluid Simulated gastric fluid (SGF) 1) Materials
• Sodiumchloride, Merck • Sodiumdihydrogenphosphate, Merck • Potassiumchloride, Merck • Calciumchloride, Merck • 1M and 6M hydrochloride, Merck • sterile distilled water • glucose, Merck • glucuronic acid, Fluka • urea, BioRad • glucosamin hydrochloride, Calbiochem • bovine serum albumin, Roche • pepsin, Merck • mucin, Sigma
2) Inorganic component:
a) 7.85 ml sodiumchloride solution (175.3 g/l) b) 1.5 ml sodiumdihydrogenphosphate solution (88.8 g/l) c) 4.6 ml potassiumchloride solution (89.6 g/l) d) 9 ml calciumchloride solution (22.2 g/l, freshly prepared) e) 5.0 ml ammoniumchloride solution (30.6 g/l) f) Set the pH at the desired value with hydrochloride solution (1M and/or 6M dependent
on pH) g) Add sterile distilled water till a volume of 250 ml
3) Organic component a) 5.0 ml glucose solution (65 g/l) b) 5.0 ml glucuronic acid solution (2 g/l) c) 1.7 ml urea solution (25 g/l) d) 5.0 ml glucosamin hydrochloride solution 33 g/l) e) add sterile distilled water till 250 ml
4) Total gastric fluid a) Mix 250 ml inorganic component with 250 ml organic component b) Check the pH and adjust if necessary. c) Add 0.5 g bovine serum albumin and dissolve completely d) Add 0.5 g pepsin (dependent on the experiment)
Add 1.5 g mucin and dissolve completely

page 50 of 86 RIVM report 250912003
Simulated intestinal fluid (SIF) 1) Materials
a) Sodiumchloride, Merck b) Sodiumhydrogencarbonate, Merck c) Potassiumdihydrogenphosphate, Merck d) Potassiumchloride, Merck e) Magnesiumchloride, Merck f) Calciumchloride, Merck g) Urea, BioRad h) Sterile distilled water i) Bovine serum albumin, Roche j) Lipase, Sigma k) Pancreatin, Merck l) Bile salts, Sigma
2) Composition simulated intestinal fluid
Mix the following ingredients a) 20 ml sodiumchloride solution (175.3 g/l) b) 20 ml sodiumhydrogencarbonate solution (84.7 g/l) c) 5 ml potassiumdihydrogenphosphate solution (88.8 g/l) d) 3.15 ml potassiumchloride solution (89.6 g/l) e) 4.5 ml calciumchloride solution (22.2 g/l, freshly prepared) f) 5 ml magnesiumchloride solution (5 g/l) g) 2 ml urea solution (25 g/l) h) Add sterile distilled water to a final volume of 500 ml i) Add 0.5 g bovine serum albumin j) Measure and register the pH k) Filter sterilize the solution l) Divide the solution in two equal portions m) Add to each portion 0.125 g lipase
3) Composition simulated intestinal fluid with pancreatin
a) Add to one of the portion simulated intestinal fluid 0.75 g pancreatin
RIVM report 250912003 page 51 of 86
4) Composition of bile solution a) Mix the following ingredients b) 7.5 ml sodiumchloride solution (175.3 g/l) c) 17.1 m sodiumhydrogencarbonate solution (84.7 g/l) d) 2.5 ml calciumchloride solution (22.2 g/l) e) 1.03 potassiumchloride solution (88.8 g/l) f) 2.5 ml urea solution (25 g/l) g) 0.45 g bovine serum albumin h) Set the pH of the solution to 8.0 using 1N hydrochloric acid i) Filter sterilize the solution j) Add 1.5 g bile salts k) Add sterile distilled water to a final volume of 250 ml
5) Composition of simulated intestinal fluid with bile salts
a) Mix 162 ml simulated intestinal fluid with 54 g bile solution 6) Composition of complete simulated intestinal fluid (basic solution with pancreatin and
bile) Mix 162 ml simulated intestinal solution with pancreatin with 54 ml bile solution

page 52 of 86 RIVM report 250912003

RIVM report 250912003 page 53 of 86
Appendix 2 Characteristics of Bacillus cereus
Tables and Figures Table A.2.1. Strains and origin (abbreviations are explained in the “Materials and Methods”
section of chapter 1).
Strain Original number OriginPAL 1 9900325-3 Sensor projectPAL 2 9901672 Sensor projectPAL 3 9901909-1 Sensor projectPAL 4 9901909-2 Sensor projectPAL 5 9902169-2 Sensor projectPAL 6 9902187 Sensor projectPAL 7 9902187-1 Sensor projectPAL 8 9902195 Sensor projectPAL 9 9902196 Sensor project
PAL 10 9902632 Sensor projectPAL 11 9902651 Sensor projectPAL 12 9902679 Sensor projectPAL 13 9902891 Sensor projectPAL 14 9902900 Sensor projectPAL 15 9902965 Sensor projectPAL 16 9903009 Sensor projectPAL 17 9903073-2 Sensor projectPAL 18 9903295-4 Sensor projectPAL 19 P21S INRA AvignonPAL 20 (AV)TZ 415 INRA AvignonPAL 21 (AV)Z 421 INRA AvignonPAL 22 Z4222 INRA AvignonPAL 23 L2104 INRA AvignonPAL 24 CIP05127 INRA AvignonPAL 25 1143 NCTCPAL 26 1145 NCTCPAL 27 B4ac DSMZPAL 28 1230-88 NVH

page 54 of 86 RIVM report 250912003
Table A.2.2. Growth characteristics at 10°C determined by OD 600 measurement Generation time and lag phase in hours
Strain
gen. time lag phase gen. time lag phase gen. time lag phasePAL 1 n.d. n.d. n.d. n.d.PAL 2 28.50 66.00 26.70 59.20 27.60 62.60PAL 3 64.10 106.00 61.90 96.60 63.00 101.30PAL 4 49.50 93.00 22.40 59.00 36.00 76.00PAL 5 n.d. n.d. n.d. n.d.PAL 6 43.30 65.60 63.00 52.90 53.20 59.30PAL 7 20.80 50.00 18.70 44.90 19.80 47.50PAL 8 45.00 130.40 inf. inf. 45.00 130.40PAL 9 n.d. n.d. n.d. n.d.
PAL 10 52.50 136.70 56.80 137.20 54.70 137.00PAL 11 36.90 94.60 31.10 81.90 34.00 88.30PAL 12 36.90 59.80 18.70 44.00 27.80 51.90PAL 13 n.d. n.d. n.d. n.d.PAL 14 n.d. n.d. n.d. n.d.PAL 15 20.20 68.00 18.10 61.50 19.20 64.80PAL 16 n.d. n.d. n.d. n.d.PAL 17 47.80 97.10 45.90 96.10 46.90 96.60PAL 18 18.30 45.70 23.40 45.10 20.90 45.40PAL 19 51.70 103.60 38.90 87.20 45.30 95.40PAL 20 27.30 53.60 75.30 74.20 51.30 63.90PAL 21 n.d. n.d. n.d. n.d.PAL 22 31.50 56.60 84.50 77.60 58.00 67.10PAL 23 61.30 132.90 59.20 128.20 60.00 130.60PAL 24 n.d. n.d. n.d. n.d.PAL 25 36.30 107.30 36.30 100.70 36.30 104.00PAL 26 n.d. n.d. n.d. n.d.PAL 27 37.30 87.00 23.30 67.70 30.30 77.40PAL 28 32.90 75.10 53.70 95.50 43.30 85.30
n.d. = not able to determine generation times or lag phases reliablyinf. = not able to determne generation time or lag phase due to infection
Gen. Time Lag phase95% confidence interval 33.26 - 47.58 67.65 - 93.95
10oC Mean at 10oC10oC
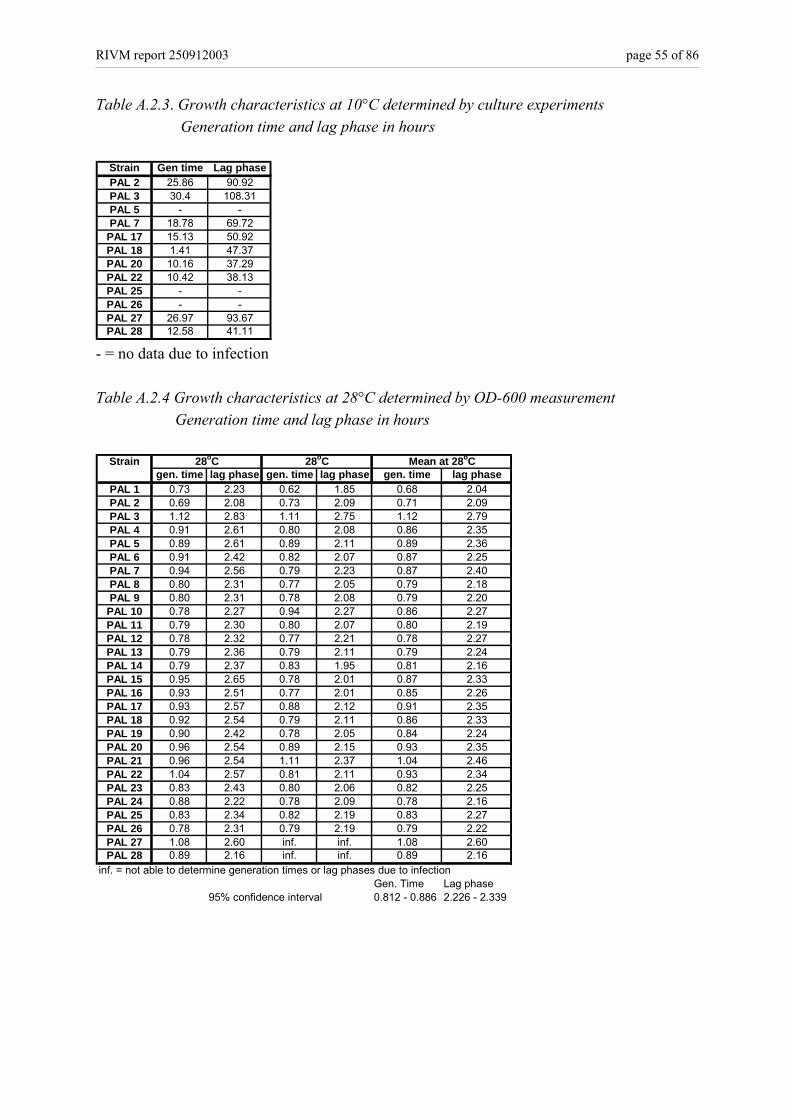
RIVM report 250912003 page 55 of 86
Table A.2.3. Growth characteristics at 10°C determined by culture experiments Generation time and lag phase in hours
Strain Gen time Lag phasePAL 2 25.86 90.92PAL 3 30.4 108.31PAL 5 - -PAL 7 18.78 69.72
PAL 17 15.13 50.92PAL 18 1.41 47.37PAL 20 10.16 37.29PAL 22 10.42 38.13PAL 25 - -PAL 26 - -PAL 27 26.97 93.67PAL 28 12.58 41.11
- = no data due to infection Table A.2.4 Growth characteristics at 28°C determined by OD-600 measurement
Generation time and lag phase in hours
Straingen. time lag phase gen. time lag phase gen. time lag phase
PAL 1 0.73 2.23 0.62 1.85 0.68 2.04PAL 2 0.69 2.08 0.73 2.09 0.71 2.09PAL 3 1.12 2.83 1.11 2.75 1.12 2.79PAL 4 0.91 2.61 0.80 2.08 0.86 2.35PAL 5 0.89 2.61 0.89 2.11 0.89 2.36PAL 6 0.91 2.42 0.82 2.07 0.87 2.25PAL 7 0.94 2.56 0.79 2.23 0.87 2.40PAL 8 0.80 2.31 0.77 2.05 0.79 2.18PAL 9 0.80 2.31 0.78 2.08 0.79 2.20
PAL 10 0.78 2.27 0.94 2.27 0.86 2.27PAL 11 0.79 2.30 0.80 2.07 0.80 2.19PAL 12 0.78 2.32 0.77 2.21 0.78 2.27PAL 13 0.79 2.36 0.79 2.11 0.79 2.24PAL 14 0.79 2.37 0.83 1.95 0.81 2.16PAL 15 0.95 2.65 0.78 2.01 0.87 2.33PAL 16 0.93 2.51 0.77 2.01 0.85 2.26PAL 17 0.93 2.57 0.88 2.12 0.91 2.35PAL 18 0.92 2.54 0.79 2.11 0.86 2.33PAL 19 0.90 2.42 0.78 2.05 0.84 2.24PAL 20 0.96 2.54 0.89 2.15 0.93 2.35PAL 21 0.96 2.54 1.11 2.37 1.04 2.46PAL 22 1.04 2.57 0.81 2.11 0.93 2.34PAL 23 0.83 2.43 0.80 2.06 0.82 2.25PAL 24 0.88 2.22 0.78 2.09 0.78 2.16PAL 25 0.83 2.34 0.82 2.19 0.83 2.27PAL 26 0.78 2.31 0.79 2.19 0.79 2.22PAL 27 1.08 2.60 inf. inf. 1.08 2.60PAL 28 0.89 2.16 inf. inf. 0.89 2.16
inf. = not able to determine generation times or lag phases due to infectionGen. Time Lag phase
95% confidence interval 0.812 - 0.886 2.226 - 2.339
28oC Mean at 28oC28oC
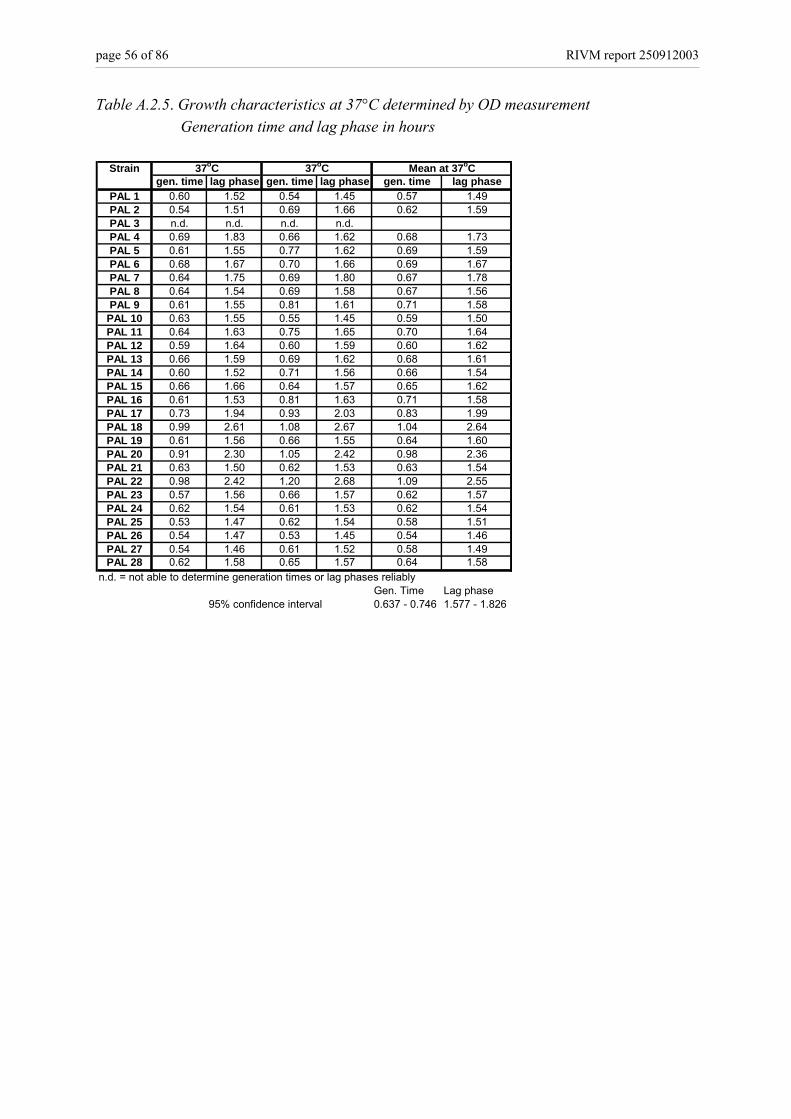
page 56 of 86 RIVM report 250912003
Table A.2.5. Growth characteristics at 37°C determined by OD measurement Generation time and lag phase in hours
Strain
gen. time lag phase gen. time lag phase gen. time lag phasePAL 1 0.60 1.52 0.54 1.45 0.57 1.49PAL 2 0.54 1.51 0.69 1.66 0.62 1.59PAL 3 n.d. n.d. n.d. n.d.PAL 4 0.69 1.83 0.66 1.62 0.68 1.73PAL 5 0.61 1.55 0.77 1.62 0.69 1.59PAL 6 0.68 1.67 0.70 1.66 0.69 1.67PAL 7 0.64 1.75 0.69 1.80 0.67 1.78PAL 8 0.64 1.54 0.69 1.58 0.67 1.56PAL 9 0.61 1.55 0.81 1.61 0.71 1.58
PAL 10 0.63 1.55 0.55 1.45 0.59 1.50PAL 11 0.64 1.63 0.75 1.65 0.70 1.64PAL 12 0.59 1.64 0.60 1.59 0.60 1.62PAL 13 0.66 1.59 0.69 1.62 0.68 1.61PAL 14 0.60 1.52 0.71 1.56 0.66 1.54PAL 15 0.66 1.66 0.64 1.57 0.65 1.62PAL 16 0.61 1.53 0.81 1.63 0.71 1.58PAL 17 0.73 1.94 0.93 2.03 0.83 1.99PAL 18 0.99 2.61 1.08 2.67 1.04 2.64PAL 19 0.61 1.56 0.66 1.55 0.64 1.60PAL 20 0.91 2.30 1.05 2.42 0.98 2.36PAL 21 0.63 1.50 0.62 1.53 0.63 1.54PAL 22 0.98 2.42 1.20 2.68 1.09 2.55PAL 23 0.57 1.56 0.66 1.57 0.62 1.57PAL 24 0.62 1.54 0.61 1.53 0.62 1.54PAL 25 0.53 1.47 0.62 1.54 0.58 1.51PAL 26 0.54 1.47 0.53 1.45 0.54 1.46PAL 27 0.54 1.46 0.61 1.52 0.58 1.49PAL 28 0.62 1.58 0.65 1.57 0.64 1.58
n.d. = not able to determine generation times or lag phases reliablyGen. Time Lag phase
95% confidence interval 0.637 - 0.746 1.577 - 1.826
37oC Mean at 37oC37oC
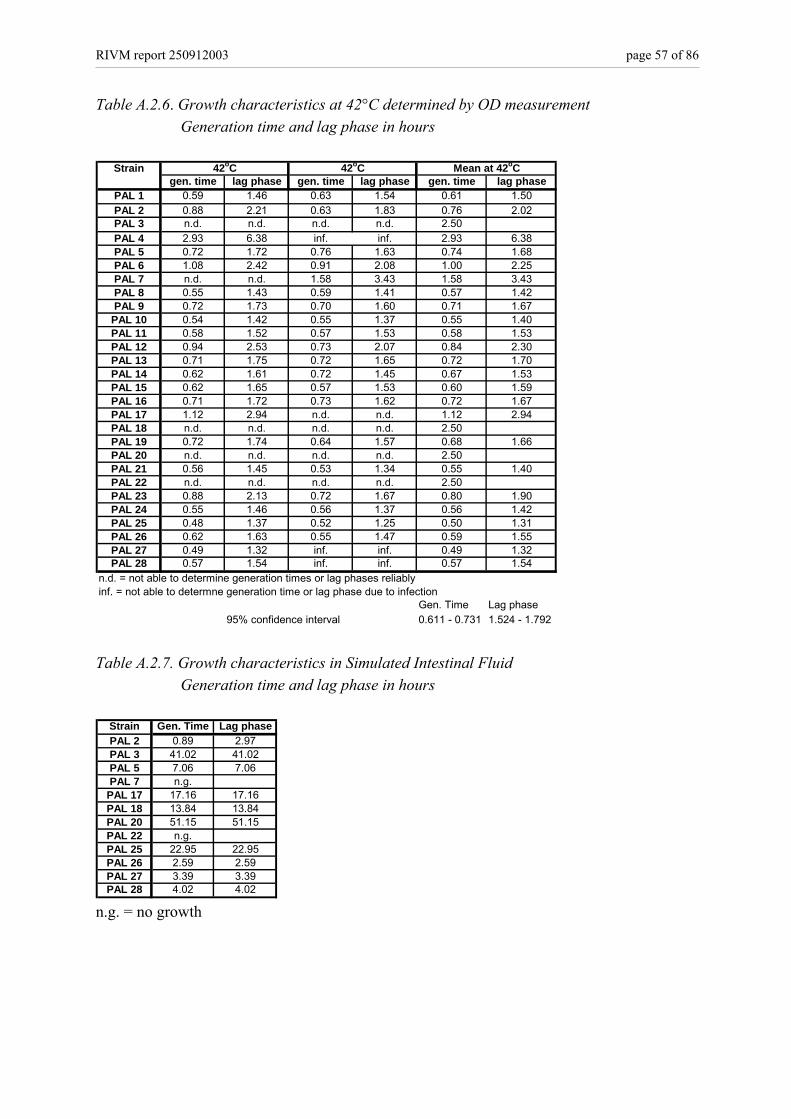
RIVM report 250912003 page 57 of 86
Table A.2.6. Growth characteristics at 42°C determined by OD measurement Generation time and lag phase in hours
Strain
gen. time lag phase gen. time lag phase gen. time lag phasePAL 1 0.59 1.46 0.63 1.54 0.61 1.50PAL 2 0.88 2.21 0.63 1.83 0.76 2.02PAL 3 n.d. n.d. n.d. n.d. 2.50PAL 4 2.93 6.38 inf. inf. 2.93 6.38PAL 5 0.72 1.72 0.76 1.63 0.74 1.68PAL 6 1.08 2.42 0.91 2.08 1.00 2.25PAL 7 n.d. n.d. 1.58 3.43 1.58 3.43PAL 8 0.55 1.43 0.59 1.41 0.57 1.42PAL 9 0.72 1.73 0.70 1.60 0.71 1.67
PAL 10 0.54 1.42 0.55 1.37 0.55 1.40PAL 11 0.58 1.52 0.57 1.53 0.58 1.53PAL 12 0.94 2.53 0.73 2.07 0.84 2.30PAL 13 0.71 1.75 0.72 1.65 0.72 1.70PAL 14 0.62 1.61 0.72 1.45 0.67 1.53PAL 15 0.62 1.65 0.57 1.53 0.60 1.59PAL 16 0.71 1.72 0.73 1.62 0.72 1.67PAL 17 1.12 2.94 n.d. n.d. 1.12 2.94PAL 18 n.d. n.d. n.d. n.d. 2.50PAL 19 0.72 1.74 0.64 1.57 0.68 1.66PAL 20 n.d. n.d. n.d. n.d. 2.50PAL 21 0.56 1.45 0.53 1.34 0.55 1.40PAL 22 n.d. n.d. n.d. n.d. 2.50PAL 23 0.88 2.13 0.72 1.67 0.80 1.90PAL 24 0.55 1.46 0.56 1.37 0.56 1.42PAL 25 0.48 1.37 0.52 1.25 0.50 1.31PAL 26 0.62 1.63 0.55 1.47 0.59 1.55PAL 27 0.49 1.32 inf. inf. 0.49 1.32PAL 28 0.57 1.54 inf. inf. 0.57 1.54
n.d. = not able to determine generation times or lag phases reliablyinf. = not able to determne generation time or lag phase due to infection
Gen. Time Lag phase95% confidence interval 0.611 - 0.731 1.524 - 1.792
42oC Mean at 42oC42oC
Table A.2.7. Growth characteristics in Simulated Intestinal Fluid
Generation time and lag phase in hours
Strain Gen. Time Lag phasePAL 2 0.89 2.97PAL 3 41.02 41.02PAL 5 7.06 7.06PAL 7 n.g.
PAL 17 17.16 17.16PAL 18 13.84 13.84PAL 20 51.15 51.15PAL 22 n.g.PAL 25 22.95 22.95PAL 26 2.59 2.59PAL 27 3.39 3.39PAL 28 4.02 4.02
n.g. = no growth
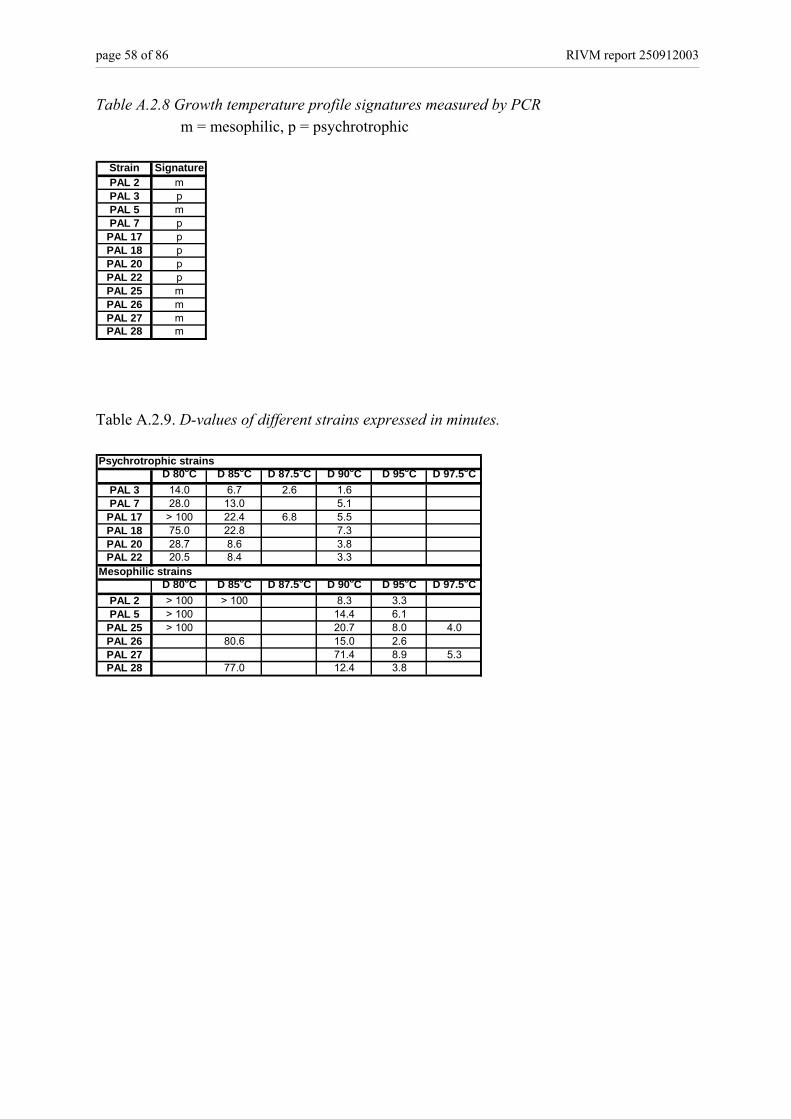
page 58 of 86 RIVM report 250912003
Table A.2.8 Growth temperature profile signatures measured by PCR m = mesophilic, p = psychrotrophic
Strain SignaturePAL 2 mPAL 3 pPAL 5 mPAL 7 p
PAL 17 pPAL 18 pPAL 20 pPAL 22 pPAL 25 mPAL 26 mPAL 27 mPAL 28 m
Table A.2.9. D-values of different strains expressed in minutes.
D 80oC D 85oC D 87.5oC D 90oC D 95oC D 97.5oCPAL 3 14.0 6.7 2.6 1.6PAL 7 28.0 13.0 5.1
PAL 17 > 100 22.4 6.8 5.5PAL 18 75.0 22.8 7.3PAL 20 28.7 8.6 3.8PAL 22 20.5 8.4 3.3
D 80oC D 85oC D 87.5oC D 90oC D 95oC D 97.5oCPAL 2 > 100 > 100 8.3 3.3PAL 5 > 100 14.4 6.1
PAL 25 > 100 20.7 8.0 4.0PAL 26 80.6 15.0 2.6PAL 27 71.4 8.9 5.3PAL 28 77.0 12.4 3.8
Psychrotrophic strains
Mesophilic strains
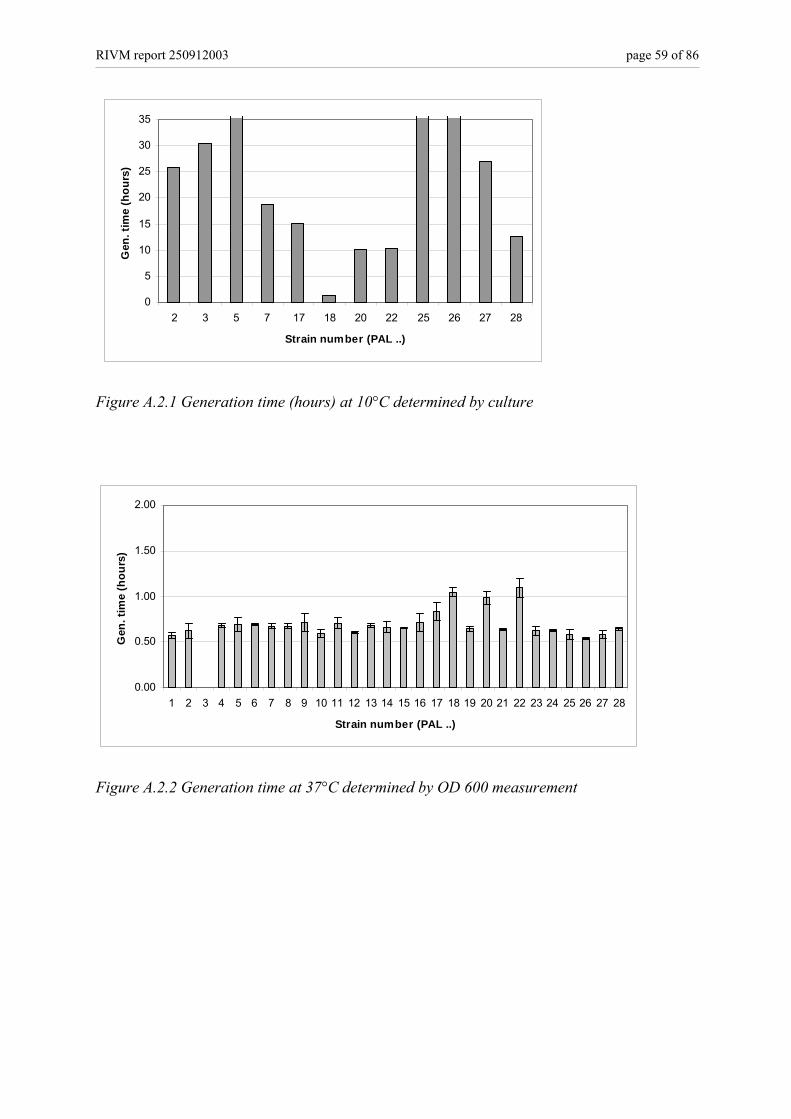
RIVM report 250912003 page 59 of 86
0
5
10
15
20
25
30
35
2 3 5 7 17 18 20 22 25 26 27 28
Strain number (PAL ..)
Gen
. tim
e (h
ours
)
Figure A.2.1 Generation time (hours) at 10°C determined by culture
0.00
0.50
1.00
1.50
2.00
1 2 3 4 5 6 7 8 9 10 11 12 13 14 15 16 17 18 19 20 21 22 23 24 25 26 27 28
Strain number (PAL ..)
Gen
. tim
e (h
ours
)
Figure A.2.2 Generation time at 37°C determined by OD 600 measurement

page 60 of 86 RIVM report 250912003
0.00
0.50
1.00
1.50
2.00
1 2 3 4 5 6 7 8 9 10 11 12 13 14 15 16 17 18 19 20 21 22 23 24 25 26 27 28
Strain number (PAL ..)
Gen
. tim
e (h
ours
)
Figure A.2.3 Generation time at 42°C determined by OD 600 measurement
0
2
4
6
8
10
2 3 5 7 17 18 20 22 25 26 27 28
Strain number (PAL ..)
Gen
. tim
e (h
ours
)
Figure A.2.4 Generation times (hours) in Simulated Intestinal Fluid at 37°C
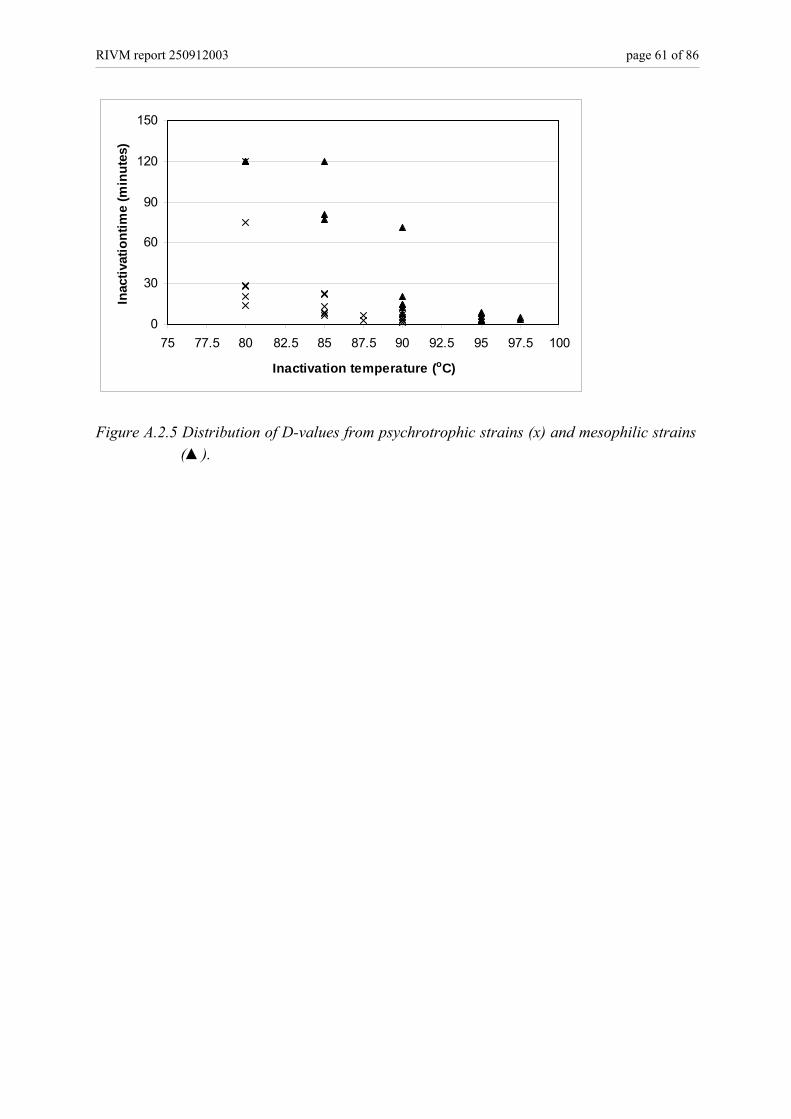
RIVM report 250912003 page 61 of 86
0
30
60
90
120
150
75 77.5 80 82.5 85 87.5 90 92.5 95 97.5 100
Inactivation temperature (oC)
Inac
tivat
iont
ime
(min
utes
)
Figure A.2.5 Distribution of D-values from psychrotrophic strains (x) and mesophilic strains
(▲).

page 62 of 86 RIVM report 250912003
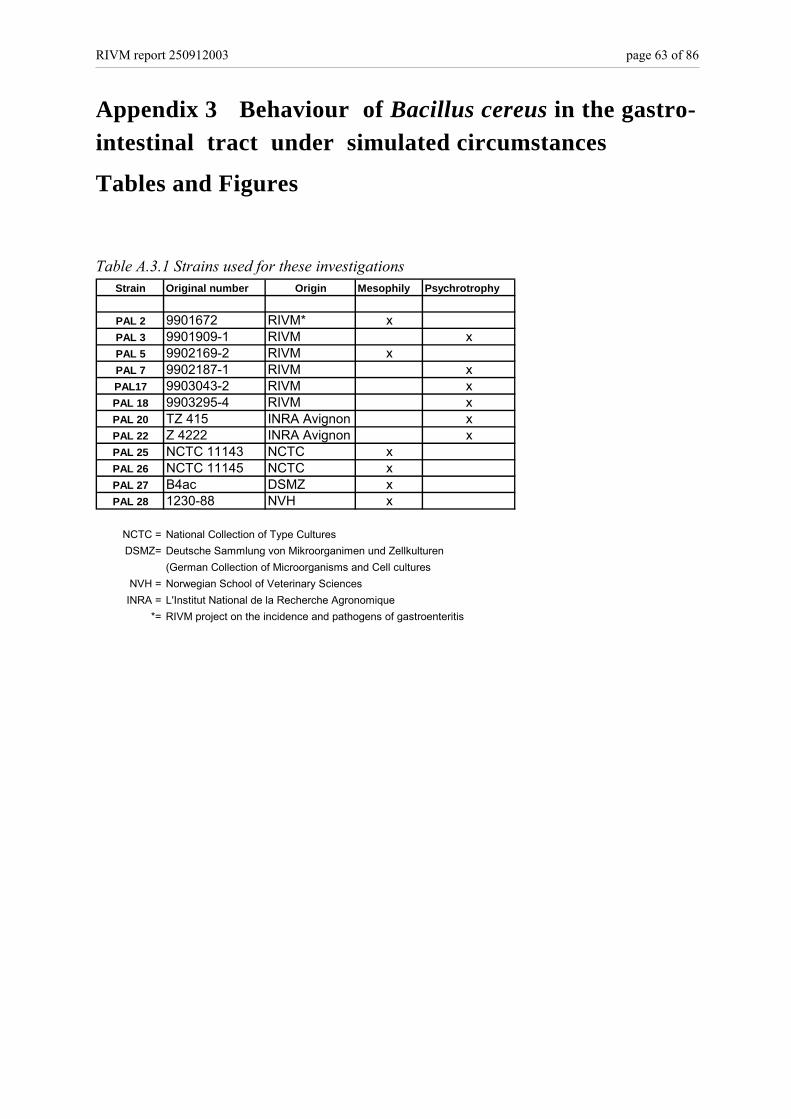
RIVM report 250912003 page 63 of 86
Appendix 3 Behaviour of Bacillus cereus in the gastro-intestinal tract under simulated circumstances
Tables and Figures Table A.3.1 Strains used for these investigations
Strain Original number Origin Mesophily Psychrotrophy
PAL 2 9901672 RIVM* xPAL 3 9901909-1 RIVM xPAL 5 9902169-2 RIVM xPAL 7 9902187-1 RIVM xPAL17 9903043-2 RIVM xPAL 18 9903295-4 RIVM xPAL 20 TZ 415 INRA Avignon xPAL 22 Z 4222 INRA Avignon xPAL 25 NCTC 11143 NCTC xPAL 26 NCTC 11145 NCTC xPAL 27 B4ac DSMZ xPAL 28 1230-88 NVH x
NCTC = National Collection of Type CulturesDSMZ= Deutsche Sammlung von Mikroorganimen und Zellkulturen
(German Collection of Microorganisms and Cell culturesNVH = Norwegian School of Veterinary Sciences
INRA = L'Institut National de la Recherche Agronomique*= RIVM project on the incidence and pathogens of gastroenteritis
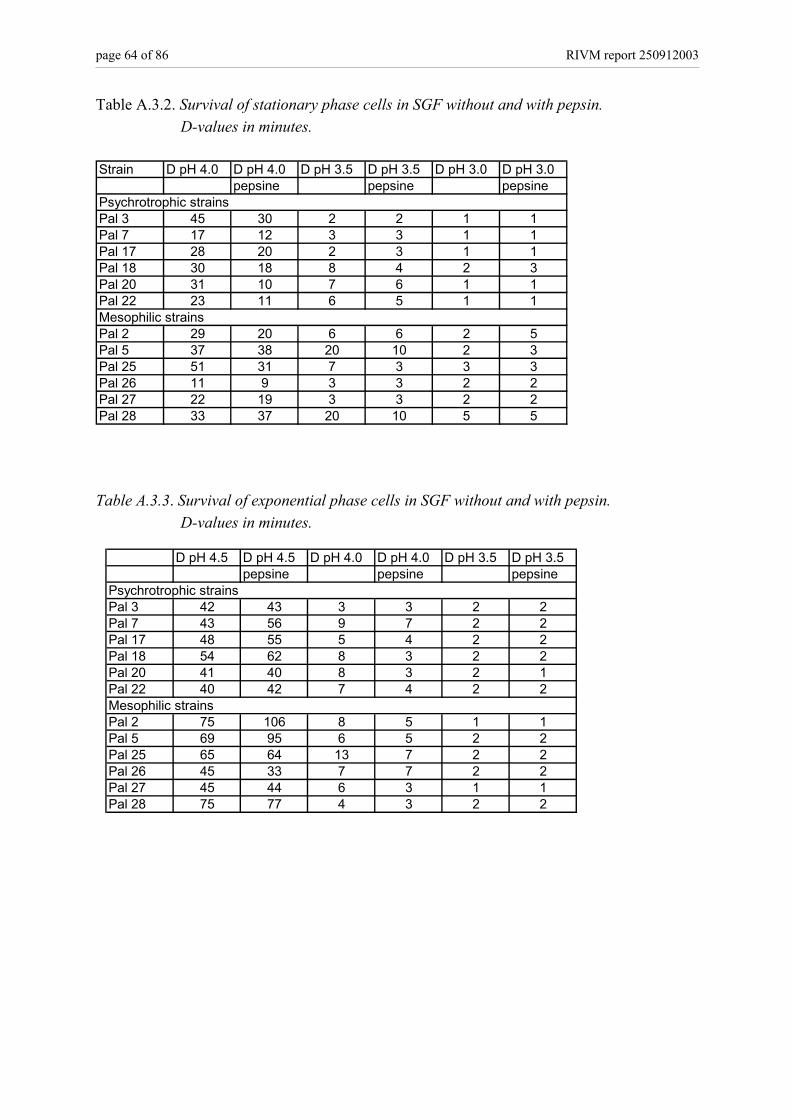
page 64 of 86 RIVM report 250912003
Table A.3.2. Survival of stationary phase cells in SGF without and with pepsin. D-values in minutes.
Strain D pH 4.0 D pH 4.0 D pH 3.5 D pH 3.5 D pH 3.0 D pH 3.0pepsine pepsine pepsine
Psychrotrophic strainsPal 3 45 30 2 2 1 1Pal 7 17 12 3 3 1 1Pal 17 28 20 2 3 1 1Pal 18 30 18 8 4 2 3Pal 20 31 10 7 6 1 1Pal 22 23 11 6 5 1 1Mesophilic strainsPal 2 29 20 6 6 2 5Pal 5 37 38 20 10 2 3Pal 25 51 31 7 3 3 3Pal 26 11 9 3 3 2 2Pal 27 22 19 3 3 2 2Pal 28 33 37 20 10 5 5 Table A.3.3. Survival of exponential phase cells in SGF without and with pepsin.
D-values in minutes.
D pH 4.5 D pH 4.5 D pH 4.0 D pH 4.0 D pH 3.5 D pH 3.5pepsine pepsine pepsine
Psychrotrophic strainsPal 3 42 43 3 3 2 2Pal 7 43 56 9 7 2 2Pal 17 48 55 5 4 2 2Pal 18 54 62 8 3 2 2Pal 20 41 40 8 3 2 1Pal 22 40 42 7 4 2 2Mesophilic strainsPal 2 75 106 8 5 1 1Pal 5 69 95 6 5 2 2Pal 25 65 64 13 7 2 2Pal 26 45 33 7 7 2 2Pal 27 45 44 6 3 1 1Pal 28 75 77 4 3 2 2
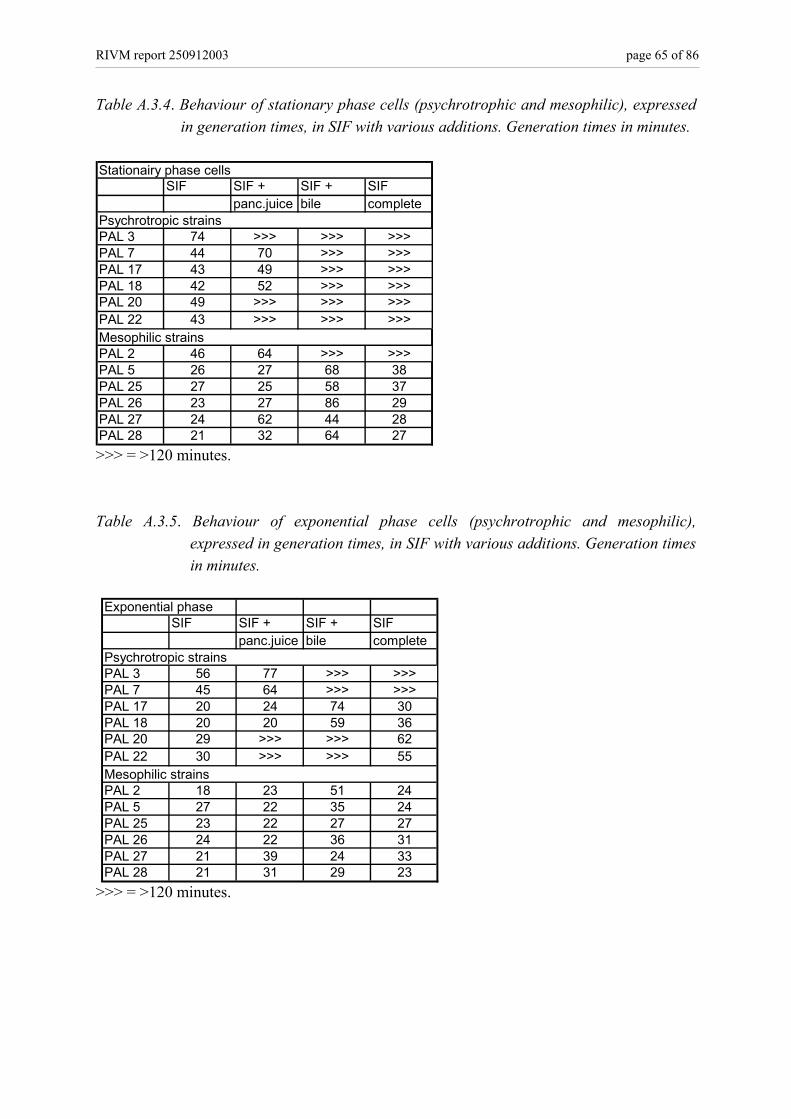
RIVM report 250912003 page 65 of 86
Table A.3.4. Behaviour of stationary phase cells (psychrotrophic and mesophilic), expressed in generation times, in SIF with various additions. Generation times in minutes.
SIF SIF + SIF + SIFpanc.juice bile complete
PAL 3 74 >>> >>> >>>PAL 7 44 70 >>> >>>PAL 17 43 49 >>> >>>PAL 18 42 52 >>> >>>PAL 20 49 >>> >>> >>>PAL 22 43 >>> >>> >>>
PAL 2 46 64 >>> >>>PAL 5 26 27 68 38PAL 25 27 25 58 37PAL 26 23 27 86 29PAL 27 24 62 44 28PAL 28 21 32 64 27
Stationairy phase cells
Mesophilic strains
Psychrotropic strains
>>> = >120 minutes. Table A.3.5. Behaviour of exponential phase cells (psychrotrophic and mesophilic),
expressed in generation times, in SIF with various additions. Generation times in minutes.
Exponential phaseSIF SIF + SIF + SIF
panc.juice bile complete
PAL 3 56 77 >>> >>>PAL 7 45 64 >>> >>>PAL 17 20 24 74 30PAL 18 20 20 59 36PAL 20 29 >>> >>> 62PAL 22 30 >>> >>> 55
PAL 2 18 23 51 24PAL 5 27 22 35 24PAL 25 23 22 27 27PAL 26 24 22 36 31PAL 27 21 39 24 33PAL 28 21 31 29 23
Psychrotropic strains
Mesophilic strains
>>> = >120 minutes.
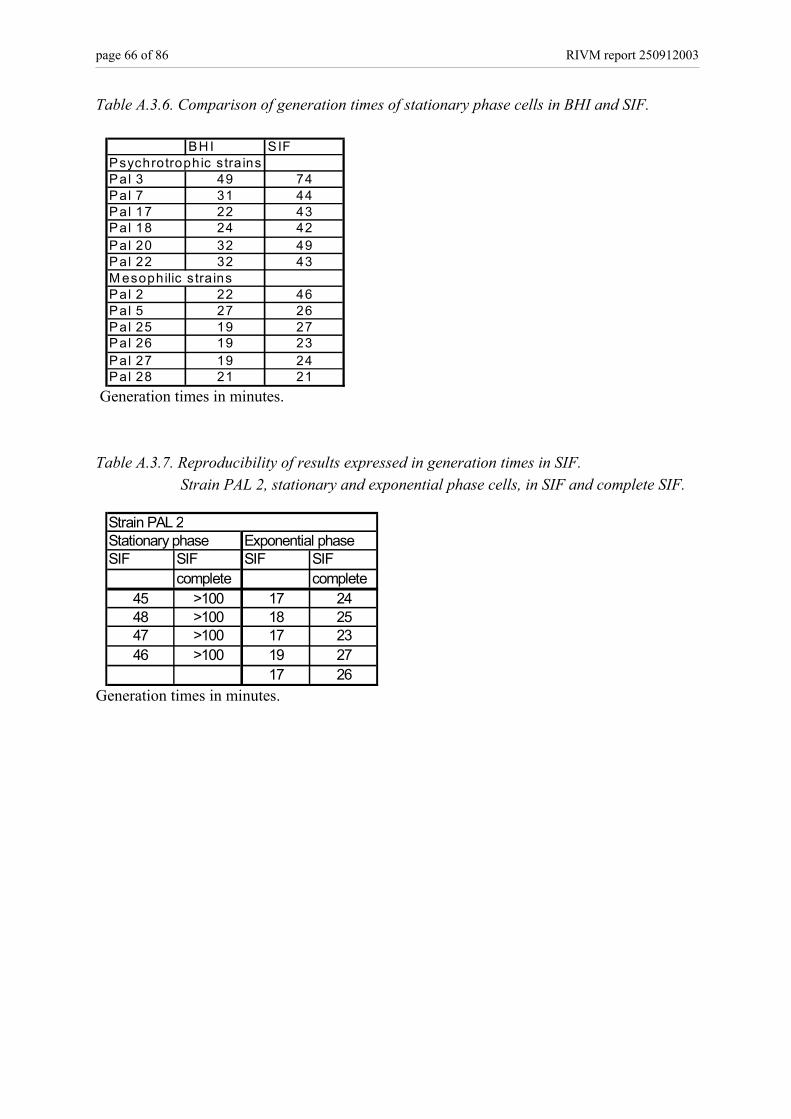
page 66 of 86 RIVM report 250912003
Table A.3.6. Comparison of generation times of stationary phase cells in BHI and SIF.
BHI SIFPsychrotrophic stra insPal 3 49 74Pal 7 31 44Pal 17 22 43Pal 18 24 42Pal 20 32 49Pal 22 32 43M esophilic s trainsPal 2 22 46Pal 5 27 26Pal 25 19 27Pal 26 19 23Pal 27 19 24Pal 28 21 21
Generation times in minutes. Table A.3.7. Reproducibility of results expressed in generation times in SIF.
Strain PAL 2, stationary and exponential phase cells, in SIF and complete SIF.
Stationary phase Exponential phaseSIF SIF SIF SIF
complete complete45 >100 17 2448 >100 18 2547 >100 17 2346 >100 19 27
17 26
Strain PAL 2
Generation times in minutes.
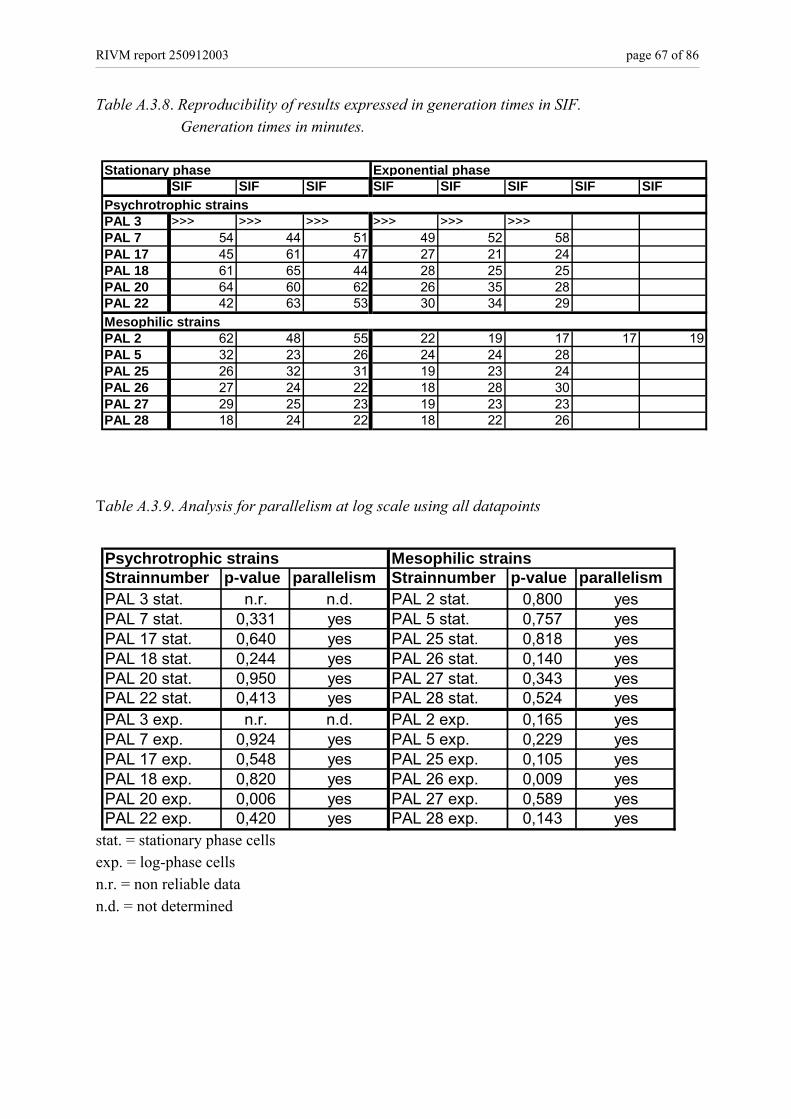
RIVM report 250912003 page 67 of 86
Table A.3.8. Reproducibility of results expressed in generation times in SIF. Generation times in minutes.
SIF SIF SIF SIF SIF SIF SIF SIF
PAL 3 >>> >>> >>> >>> >>> >>>PAL 7 54 44 51 49 52 58PAL 17 45 61 47 27 21 24PAL 18 61 65 44 28 25 25PAL 20 64 60 62 26 35 28PAL 22 42 63 53 30 34 29
PAL 2 62 48 55 22 19 17 17 19PAL 5 32 23 26 24 24 28PAL 25 26 32 31 19 23 24PAL 26 27 24 22 18 28 30PAL 27 29 25 23 19 23 23PAL 28 18 24 22 18 22 26
Stationary phase Exponential phase
Mesophilic strains
Psychrotrophic strains
Table A.3.9. Analysis for parallelism at log scale using all datapoints
Strainnumber p-value parallelism Strainnumber p-value parallelismPAL 3 stat. n.r. n.d. PAL 2 stat. 0,800 yesPAL 7 stat. 0,331 yes PAL 5 stat. 0,757 yesPAL 17 stat. 0,640 yes PAL 25 stat. 0,818 yesPAL 18 stat. 0,244 yes PAL 26 stat. 0,140 yesPAL 20 stat. 0,950 yes PAL 27 stat. 0,343 yesPAL 22 stat. 0,413 yes PAL 28 stat. 0,524 yesPAL 3 exp. n.r. n.d. PAL 2 exp. 0,165 yesPAL 7 exp. 0,924 yes PAL 5 exp. 0,229 yesPAL 17 exp. 0,548 yes PAL 25 exp. 0,105 yesPAL 18 exp. 0,820 yes PAL 26 exp. 0,009 yesPAL 20 exp. 0,006 yes PAL 27 exp. 0,589 yesPAL 22 exp. 0,420 yes PAL 28 exp. 0,143 yes
Mesophilic strainsPsychrotrophic strains
stat. = stationary phase cells exp. = log-phase cells n.r. = non reliable data n.d. = not determined
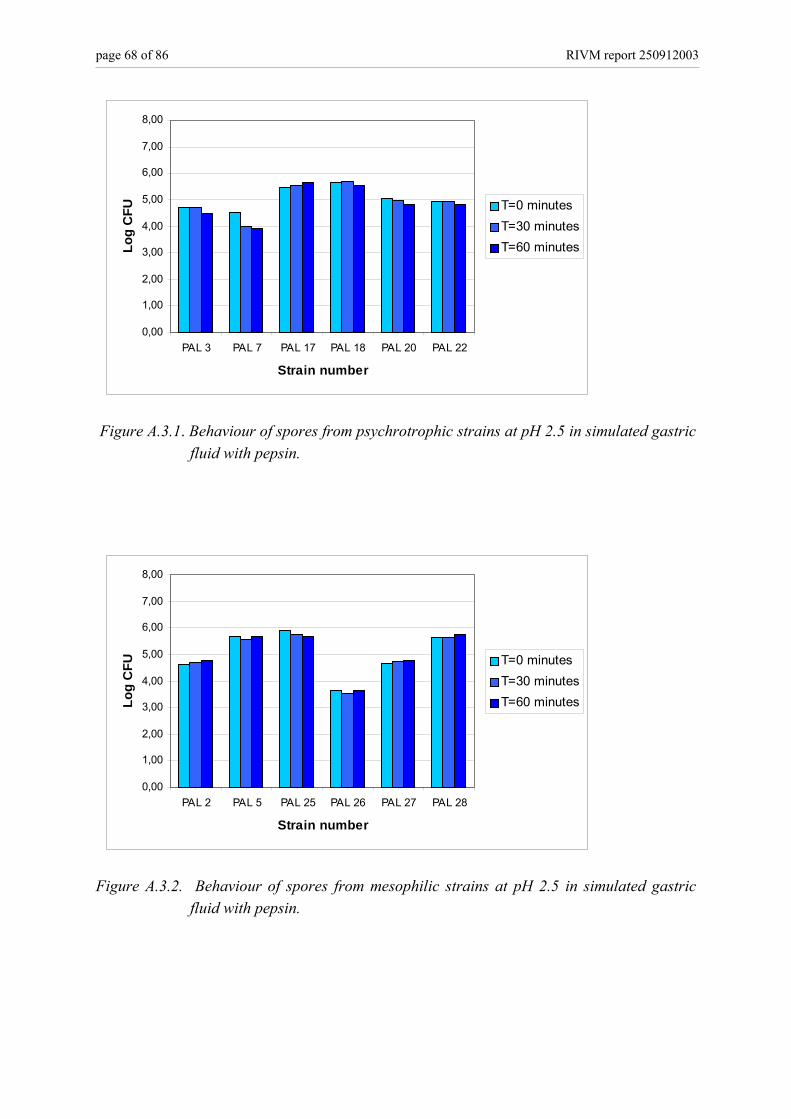
page 68 of 86 RIVM report 250912003
0,00
1,00
2,00
3,00
4,00
5,00
6,00
7,00
8,00
PAL 3 PAL 7 PAL 17 PAL 18 PAL 20 PAL 22
Strain number
Log
CFU T=0 minutes
T=30 minutesT=60 minutes
Figure A.3.1. Behaviour of spores from psychrotrophic strains at pH 2.5 in simulated gastric
fluid with pepsin.
0,00
1,00
2,00
3,00
4,00
5,00
6,00
7,00
8,00
PAL 2 PAL 5 PAL 25 PAL 26 PAL 27 PAL 28
Strain number
Log
CFU T=0 minutes
T=30 minutesT=60 minutes
Figure A.3.2. Behaviour of spores from mesophilic strains at pH 2.5 in simulated gastric
fluid with pepsin.
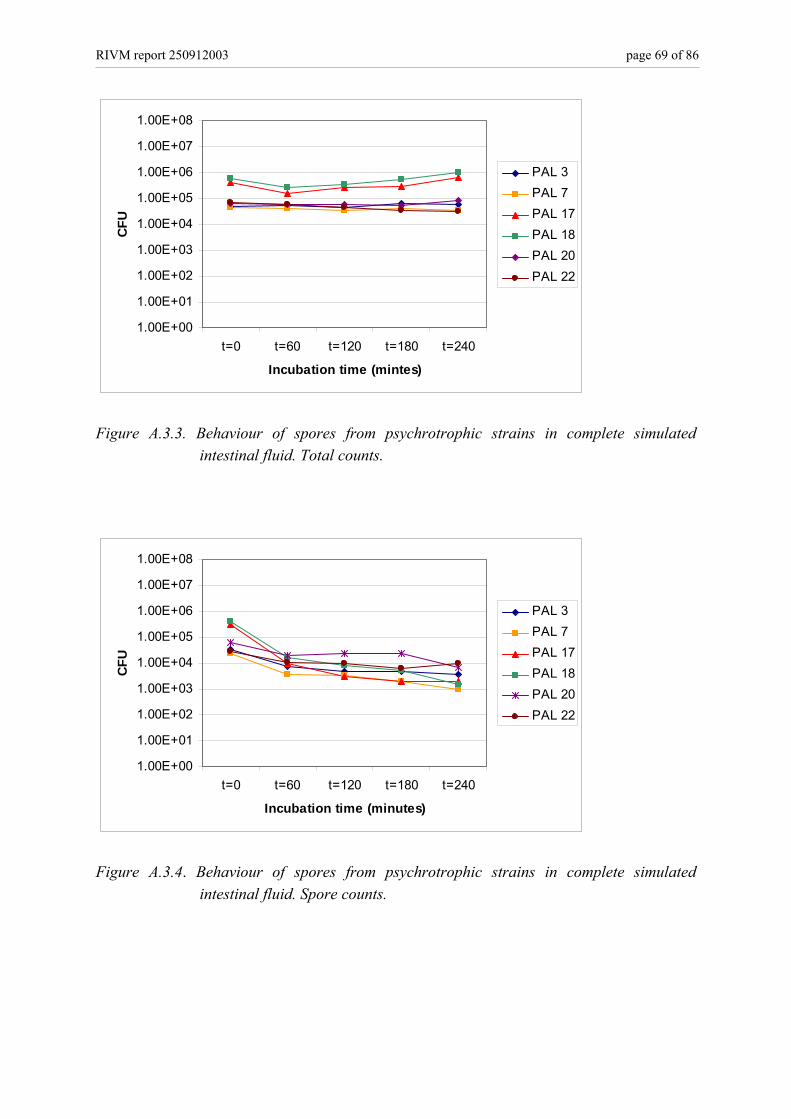
RIVM report 250912003 page 69 of 86
1.00E+00
1.00E+01
1.00E+02
1.00E+03
1.00E+04
1.00E+05
1.00E+06
1.00E+07
1.00E+08
t=0 t=60 t=120 t=180 t=240
Incubation time (mintes)
CFU
PAL 3PAL 7PAL 17PAL 18PAL 20PAL 22
Figure A.3.3. Behaviour of spores from psychrotrophic strains in complete simulated
intestinal fluid. Total counts.
1.00E+00
1.00E+01
1.00E+02
1.00E+03
1.00E+04
1.00E+05
1.00E+06
1.00E+07
1.00E+08
t=0 t=60 t=120 t=180 t=240
Incubation time (minutes)
CFU
PAL 3PAL 7PAL 17PAL 18PAL 20PAL 22
Figure A.3.4. Behaviour of spores from psychrotrophic strains in complete simulated
intestinal fluid. Spore counts.

page 70 of 86 RIVM report 250912003
1.00E+00
1.00E+01
1.00E+02
1.00E+03
1.00E+04
1.00E+05
1.00E+06
1.00E+07
1.00E+08
t=0 t=60 t=120 t=180 t=240
Incubation time (minutes)
CFU
PAL 2PAL 5PAL 25PAL 26PAL 27PAL 28
Figure A.3.5. Behaviour of spores from mesophilic strains in complete simulated intestinal
fluid. Total counts.
1.00E+00
1.00E+01
1.00E+02
1.00E+03
1.00E+04
1.00E+05
1.00E+06
1.00E+07
1.00E+08
t=0 t=60 t=120 t=180 t=240
Incubation time (minutes)
CFU
PAL 2PAL 5PAL 25PAL 26PAL 27PAL 28
Figure A.3.6. Behaviour of spores from mesophilic strains in complete simulated intestinal
fluid. Spore counts.
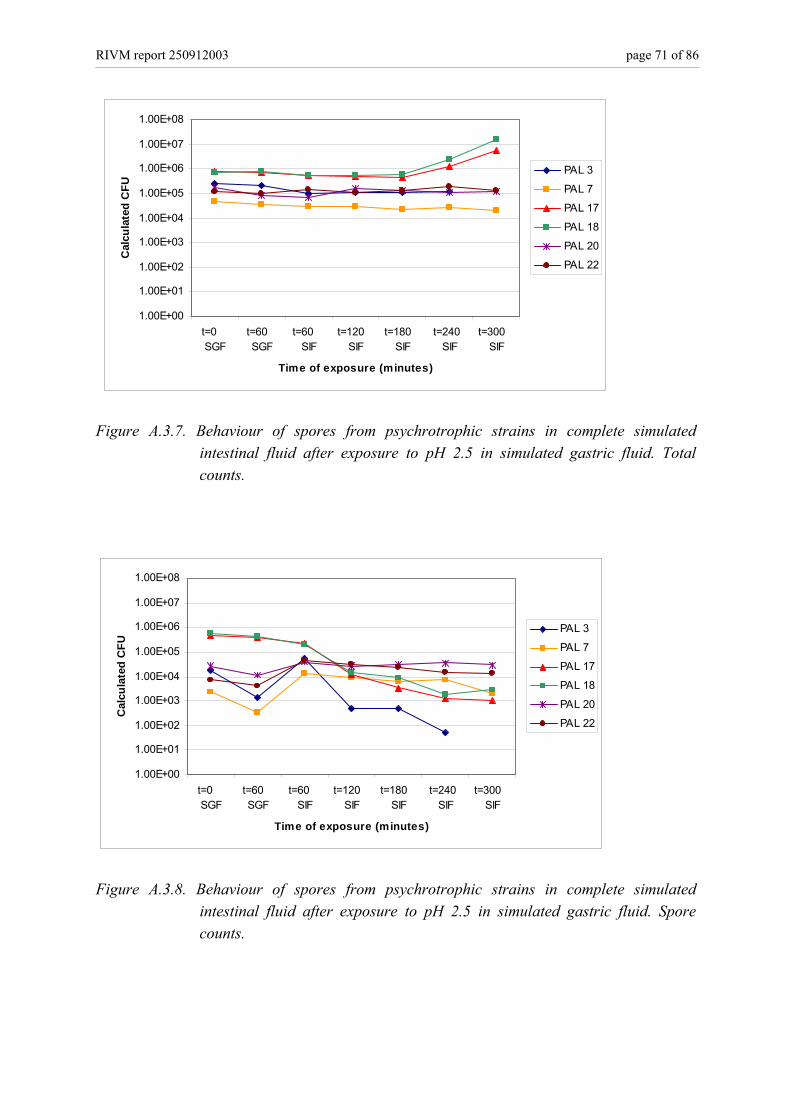
RIVM report 250912003 page 71 of 86
1.00E+00
1.00E+01
1.00E+02
1.00E+03
1.00E+04
1.00E+05
1.00E+06
1.00E+07
1.00E+08
t=0 SGF
t=60 SGF
t=60 SIF
t=120 SIF
t=180 SIF
t=240 SIF
t=300 SIF
Time of exposure (minutes)
Cal
cula
ted
CFU
PAL 3
PAL 7
PAL 17
PAL 18
PAL 20
PAL 22
Figure A.3.7. Behaviour of spores from psychrotrophic strains in complete simulated
intestinal fluid after exposure to pH 2.5 in simulated gastric fluid. Total counts.
1.00E+00
1.00E+01
1.00E+02
1.00E+03
1.00E+04
1.00E+05
1.00E+06
1.00E+07
1.00E+08
t=0 SGF
t=60 SGF
t=60 SIF
t=120 SIF
t=180 SIF
t=240 SIF
t=300 SIF
Time of exposure (minutes)
Cal
cula
ted
CFU
PAL 3
PAL 7
PAL 17
PAL 18
PAL 20
PAL 22
Figure A.3.8. Behaviour of spores from psychrotrophic strains in complete simulated
intestinal fluid after exposure to pH 2.5 in simulated gastric fluid. Spore counts.

page 72 of 86 RIVM report 250912003
1.00E+00
1.00E+01
1.00E+02
1.00E+03
1.00E+04
1.00E+05
1.00E+06
1.00E+07
1.00E+08
t=0 SGF
t=60 SGF
t=60 SIF
t=120 SIF
t=180 SIF
t=240 SIF
t=300 SIF
Time of exposure (minutes)
Cal
cula
ted
CFU
PAL 2
PAL 5
PAL 25
PAL 26
PAL 27
PAL 28
Figure A.3.9. Behaviour of spores from mesophilic strains in complete simulated intestinal
fluid after exposure to pH 2.5 in simulated gastric fluid. Total counts.
1.00E+00
1.00E+01
1.00E+02
1.00E+03
1.00E+04
1.00E+05
1.00E+06
1.00E+07
1.00E+08
t=0 SGF
t=60 SGF
t=60 SIF
t=120 SIF
t=180 SIF
t=240 SIF
t=300 SIF
Time of exposure (minutes)
Cal
cula
ted
CFU
PAL 2
PAL 5
PAL 25
PAL 26
PAL 27
PAL 28
Figure A.3.10. Behaviour of spores from mesophilic strains in complete simulated intestinal
fluid after exposure to pH 2.5 in simulated gastric fluid. Spore counts.
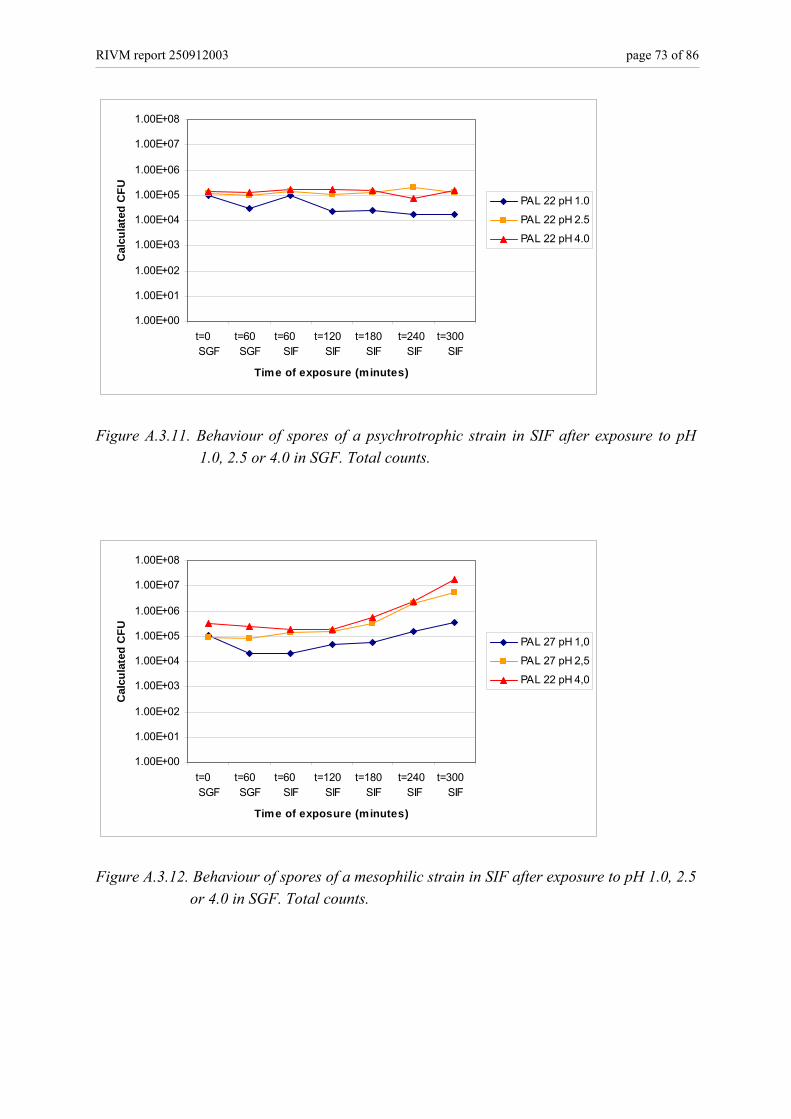
RIVM report 250912003 page 73 of 86
1.00E+00
1.00E+01
1.00E+02
1.00E+03
1.00E+04
1.00E+05
1.00E+06
1.00E+07
1.00E+08
t=0 SGF
t=60 SGF
t=60 SIF
t=120 SIF
t=180 SIF
t=240 SIF
t=300 SIF
Time of exposure (minutes)
Cal
cula
ted
CFU
PAL 22 pH 1.0
PAL 22 pH 2.5
PAL 22 pH 4.0
Figure A.3.11. Behaviour of spores of a psychrotrophic strain in SIF after exposure to pH
1.0, 2.5 or 4.0 in SGF. Total counts.
1.00E+00
1.00E+01
1.00E+02
1.00E+03
1.00E+04
1.00E+05
1.00E+06
1.00E+07
1.00E+08
t=0 SGF
t=60 SGF
t=60 SIF
t=120 SIF
t=180 SIF
t=240 SIF
t=300 SIF
Time of exposure (minutes)
Cal
cula
ted
CFU
PAL 27 pH 1,0
PAL 27 pH 2,5
PAL 22 pH 4,0
Figure A.3.12. Behaviour of spores of a mesophilic strain in SIF after exposure to pH 1.0, 2.5
or 4.0 in SGF. Total counts.
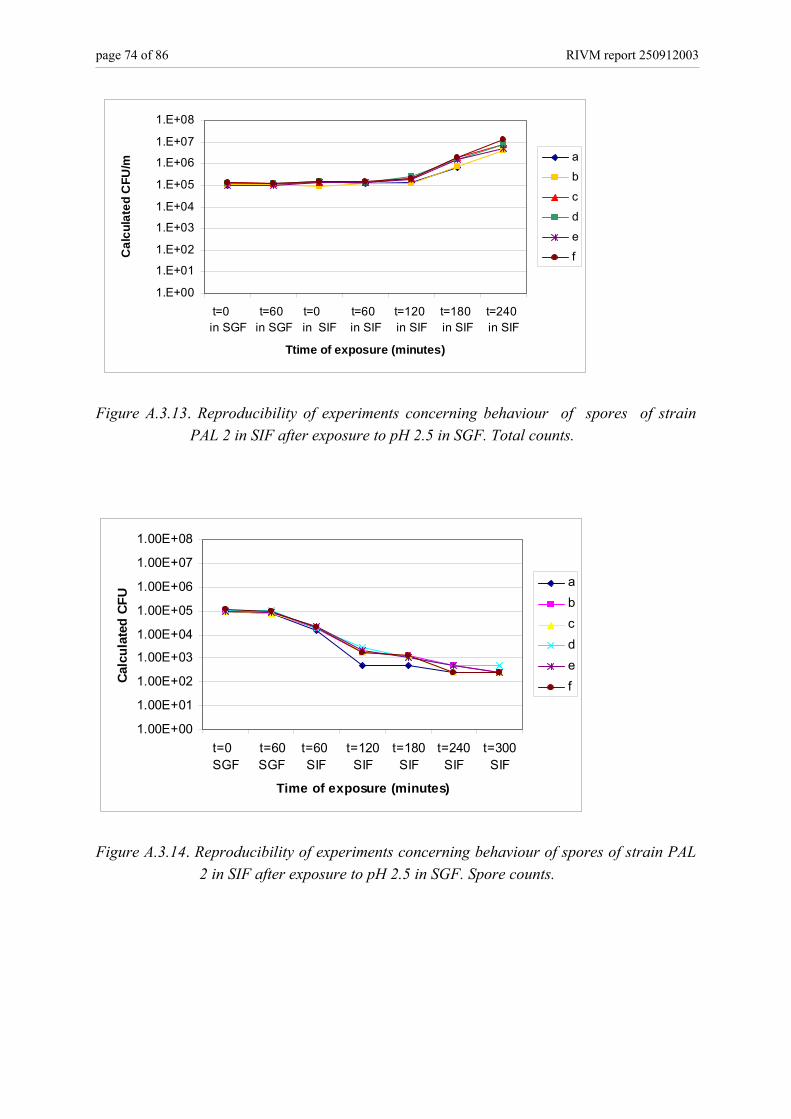
page 74 of 86 RIVM report 250912003
1.E+00
1.E+01
1.E+02
1.E+03
1.E+04
1.E+05
1.E+06
1.E+07
1.E+08
t=0 in SGF
t=60 in SGF
t=0 in SIF
t=60 in SIF
t=120 in SIF
t=180 in SIF
t=240 in SIF
Ttime of exposure (minutes)
Cal
cula
ted
CFU
/ml a
b
cd
ef
Figure A.3.13. Reproducibility of experiments concerning behaviour of spores of strain
PAL 2 in SIF after exposure to pH 2.5 in SGF. Total counts.
1.00E+00
1.00E+01
1.00E+02
1.00E+03
1.00E+04
1.00E+05
1.00E+06
1.00E+07
1.00E+08
t=0 SGF
t=60SGF
t=60 SIF
t=120SIF
t=180SIF
t=240SIF
t=300SIF
Time of exposure (minutes)
Calc
ulat
ed C
FU
abcdef
Figure A.3.14. Reproducibility of experiments concerning behaviour of spores of strain PAL
2 in SIF after exposure to pH 2.5 in SGF. Spore counts.
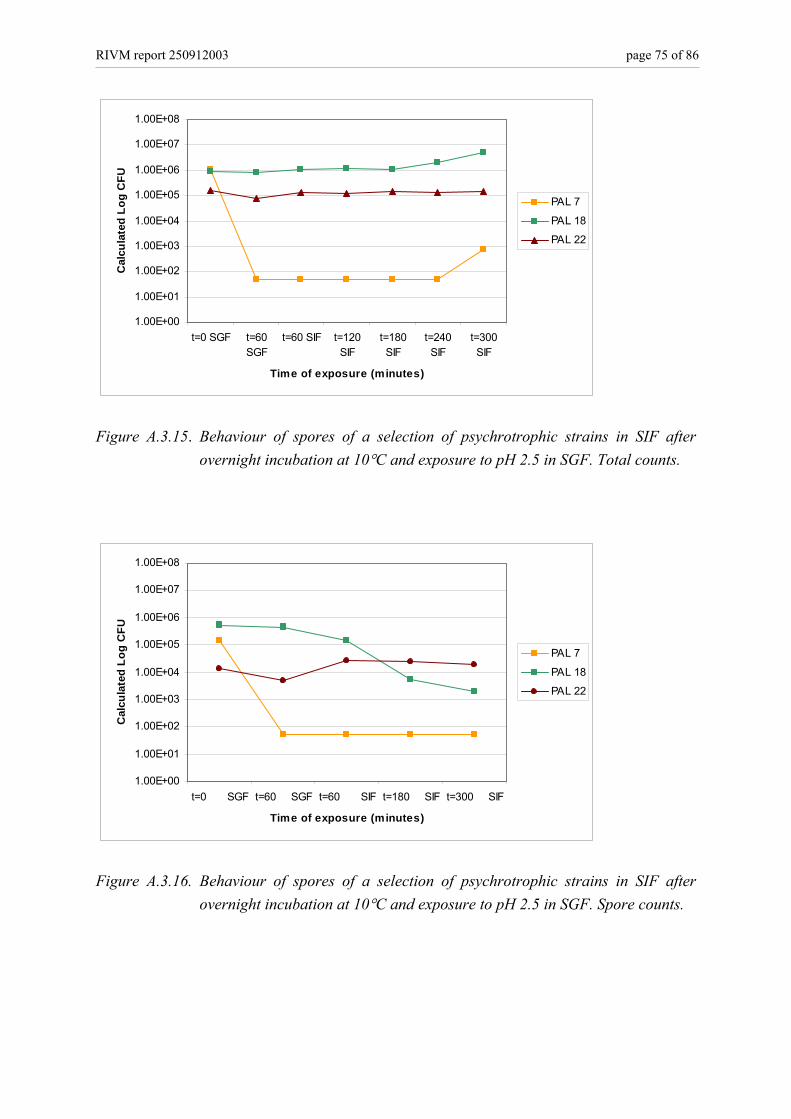
RIVM report 250912003 page 75 of 86
1.00E+00
1.00E+01
1.00E+02
1.00E+03
1.00E+04
1.00E+05
1.00E+06
1.00E+07
1.00E+08
t=0 SGF t=60SGF
t=60 SIF t=120SIF
t=180SIF
t=240SIF
t=300SIF
Time of exposure (minutes)
Cal
cula
ted
Log
CFU
PAL 7
PAL 18
PAL 22
Figure A.3.15. Behaviour of spores of a selection of psychrotrophic strains in SIF after
overnight incubation at 10°C and exposure to pH 2.5 in SGF. Total counts.
1.00E+00
1.00E+01
1.00E+02
1.00E+03
1.00E+04
1.00E+05
1.00E+06
1.00E+07
1.00E+08
t=0 SGF t=60 SGF t=60 SIF t=180 SIF t=300 SIF
Time of exposure (minutes)
Cal
cula
ted
Log
CFU
PAL 7
PAL 18
PAL 22
Figure A.3.16. Behaviour of spores of a selection of psychrotrophic strains in SIF after
overnight incubation at 10°C and exposure to pH 2.5 in SGF. Spore counts.
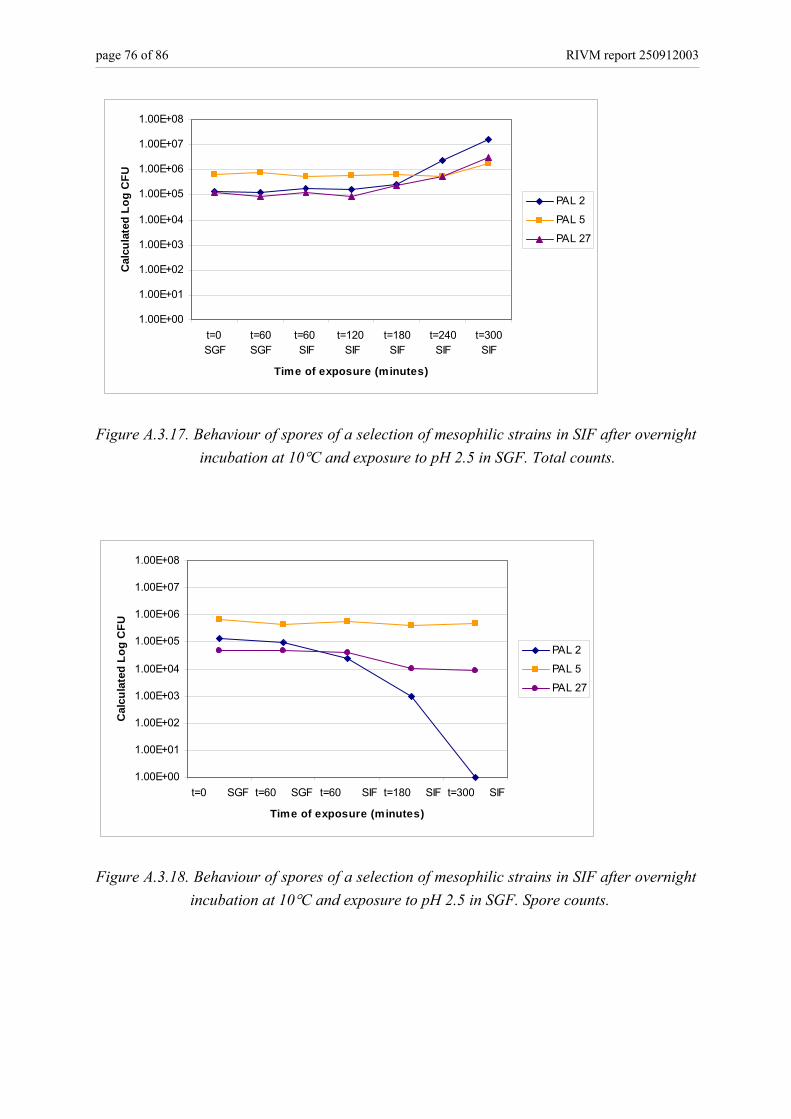
page 76 of 86 RIVM report 250912003
1.00E+00
1.00E+01
1.00E+02
1.00E+03
1.00E+04
1.00E+05
1.00E+06
1.00E+07
1.00E+08
t=0 SGF
t=60SGF
t=60 SIF
t=120 SIF
t=180SIF
t=240SIF
t=300SIF
Time of exposure (minutes)
Cal
cula
ted
Log
CFU
PAL 2
PAL 5
PAL 27
Figure A.3.17. Behaviour of spores of a selection of mesophilic strains in SIF after overnight
incubation at 10°C and exposure to pH 2.5 in SGF. Total counts.
1.00E+00
1.00E+01
1.00E+02
1.00E+03
1.00E+04
1.00E+05
1.00E+06
1.00E+07
1.00E+08
t=0 SGF t=60 SGF t=60 SIF t=180 SIF t=300 SIF
Time of exposure (minutes)
Cal
cula
ted
Log
CFU
PAL 2
PAL 5
PAL 27
Figure A.3.18. Behaviour of spores of a selection of mesophilic strains in SIF after overnight
incubation at 10°C and exposure to pH 2.5 in SGF. Spore counts.
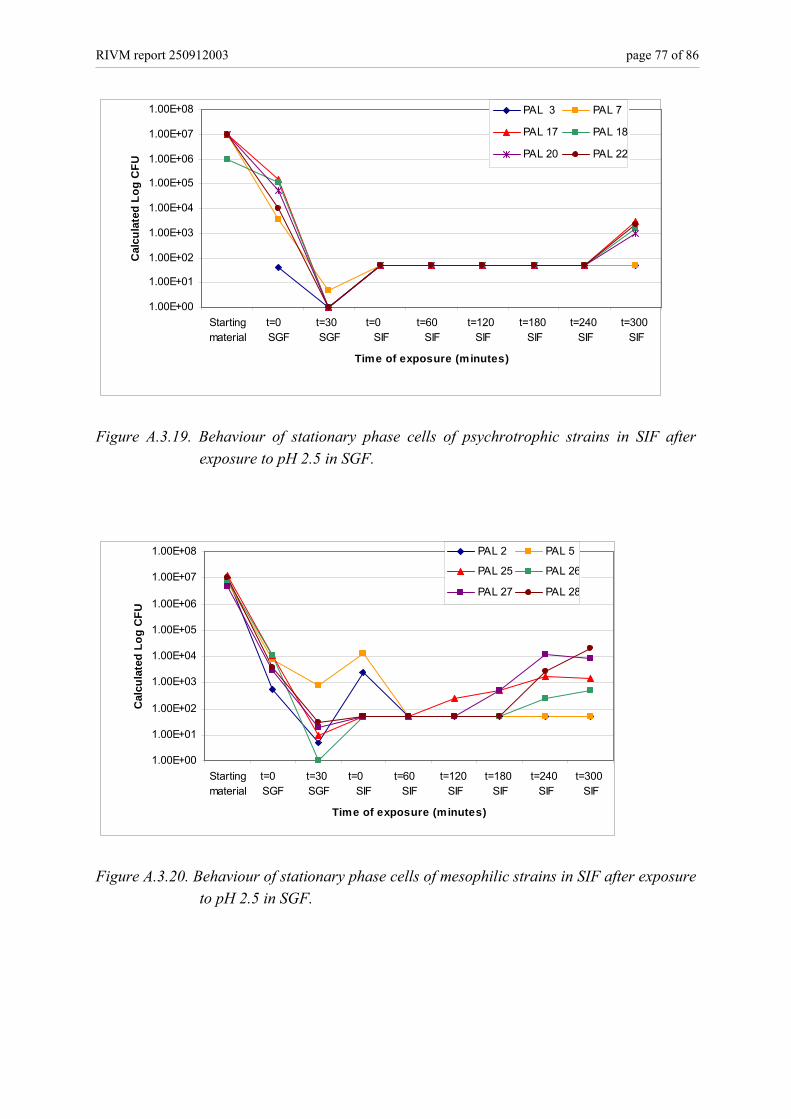
RIVM report 250912003 page 77 of 86
1.00E+00
1.00E+01
1.00E+02
1.00E+03
1.00E+04
1.00E+05
1.00E+06
1.00E+07
1.00E+08
Startingmaterial
t=0 SGF
t=30 SGF
t=0 SIF
t=60 SIF
t=120 SIF
t=180 SIF
t=240 SIF
t=300 SIF
Time of exposure (minutes)
Cal
cula
ted
Log
CFU
PAL 3 PAL 7
PAL 17 PAL 18
PAL 20 PAL 22
Figure A.3.19. Behaviour of stationary phase cells of psychrotrophic strains in SIF after
exposure to pH 2.5 in SGF.
1.00E+00
1.00E+01
1.00E+02
1.00E+03
1.00E+04
1.00E+05
1.00E+06
1.00E+07
1.00E+08
Startingmaterial
t=0 SGF
t=30 SGF
t=0 SIF
t=60 SIF
t=120 SIF
t=180 SIF
t=240 SIF
t=300 SIF
Time of exposure (minutes)
Cal
cula
ted
Log
CFU
PAL 2 PAL 5
PAL 25 PAL 26
PAL 27 PAL 28
Figure A.3.20. Behaviour of stationary phase cells of mesophilic strains in SIF after exposure
to pH 2.5 in SGF.
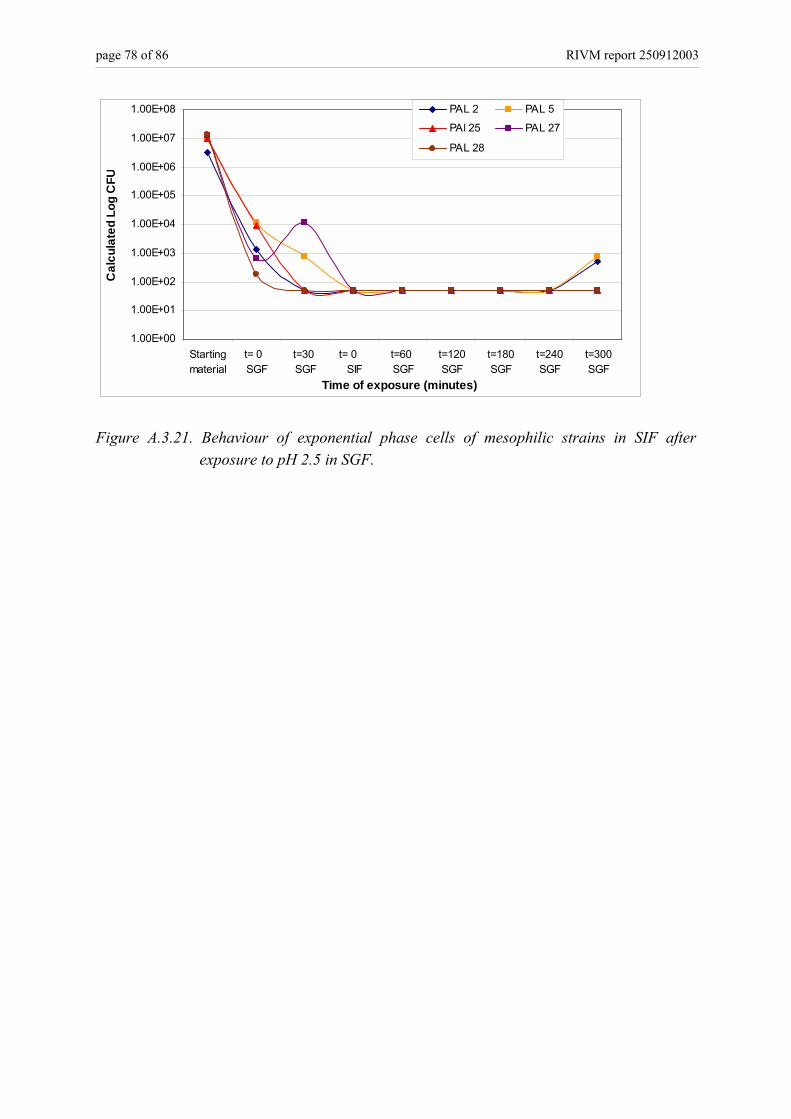
page 78 of 86 RIVM report 250912003
1.00E+00
1.00E+01
1.00E+02
1.00E+03
1.00E+04
1.00E+05
1.00E+06
1.00E+07
1.00E+08
Startingmaterial
t= 0 SGF
t=30 SGF
t= 0 SIF
t=60 SGF
t=120SGF
t=180SGF
t=240SGF
t=300SGF
Time of exposure (minutes)
Cal
cula
ted
Log
CFU
PAL 2 PAL 5
PAl 25 PAL 27
PAL 28
Figure A.3.21. Behaviour of exponential phase cells of mesophilic strains in SIF after
exposure to pH 2.5 in SGF.
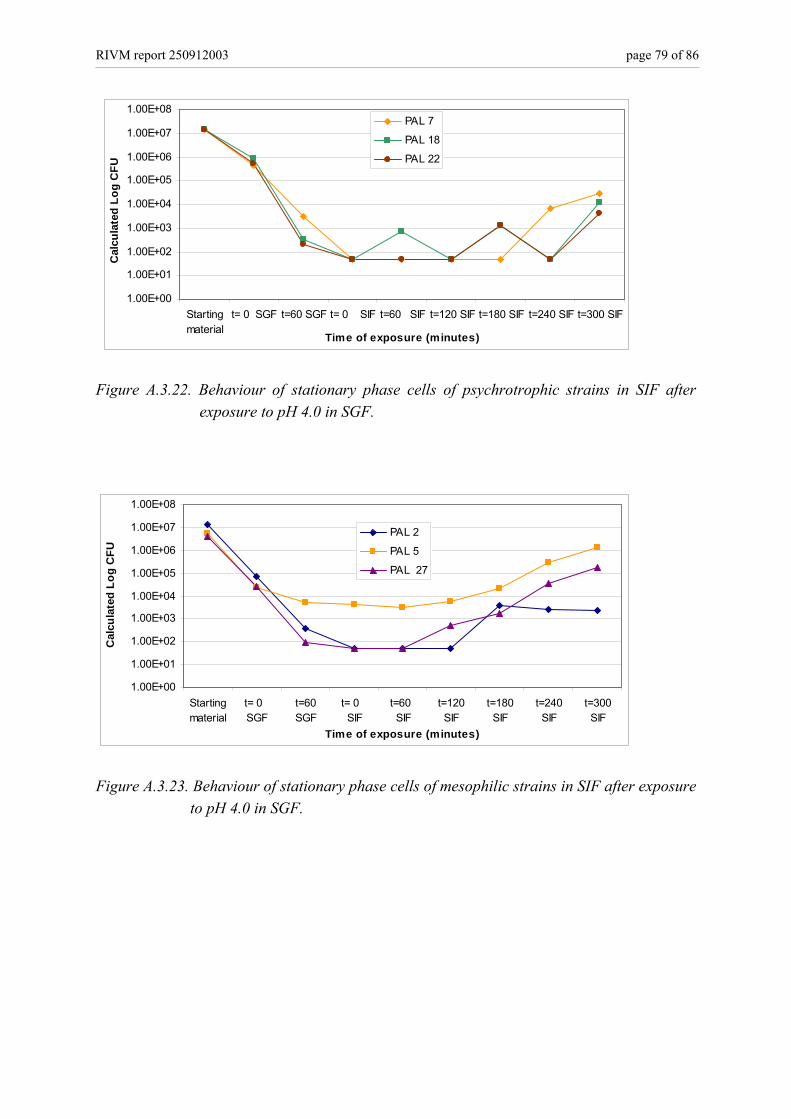
RIVM report 250912003 page 79 of 86
1.00E+00
1.00E+01
1.00E+02
1.00E+03
1.00E+04
1.00E+05
1.00E+06
1.00E+07
1.00E+08
Startingmaterial
t= 0 SGF t=60 SGF t= 0 SIF t=60 SIF t=120 SIF t=180 SIF t=240 SIF t=300 SIF
Time of exposure (minutes)
Cal
cula
ted
Log
CFU
PAL 7
PAL 18
PAL 22
Figure A.3.22. Behaviour of stationary phase cells of psychrotrophic strains in SIF after
exposure to pH 4.0 in SGF.
1.00E+00
1.00E+01
1.00E+02
1.00E+03
1.00E+04
1.00E+05
1.00E+06
1.00E+07
1.00E+08
Startingmaterial
t= 0 SGF
t=60SGF
t= 0 SIF
t=60 SIF
t=120SIF
t=180SIF
t=240SIF
t=300SIF
Time of exposure (minutes)
Cal
cula
ted
Log
CFU
PAL 2
PAL 5
PAL 27
Figure A.3.23. Behaviour of stationary phase cells of mesophilic strains in SIF after exposure
to pH 4.0 in SGF.
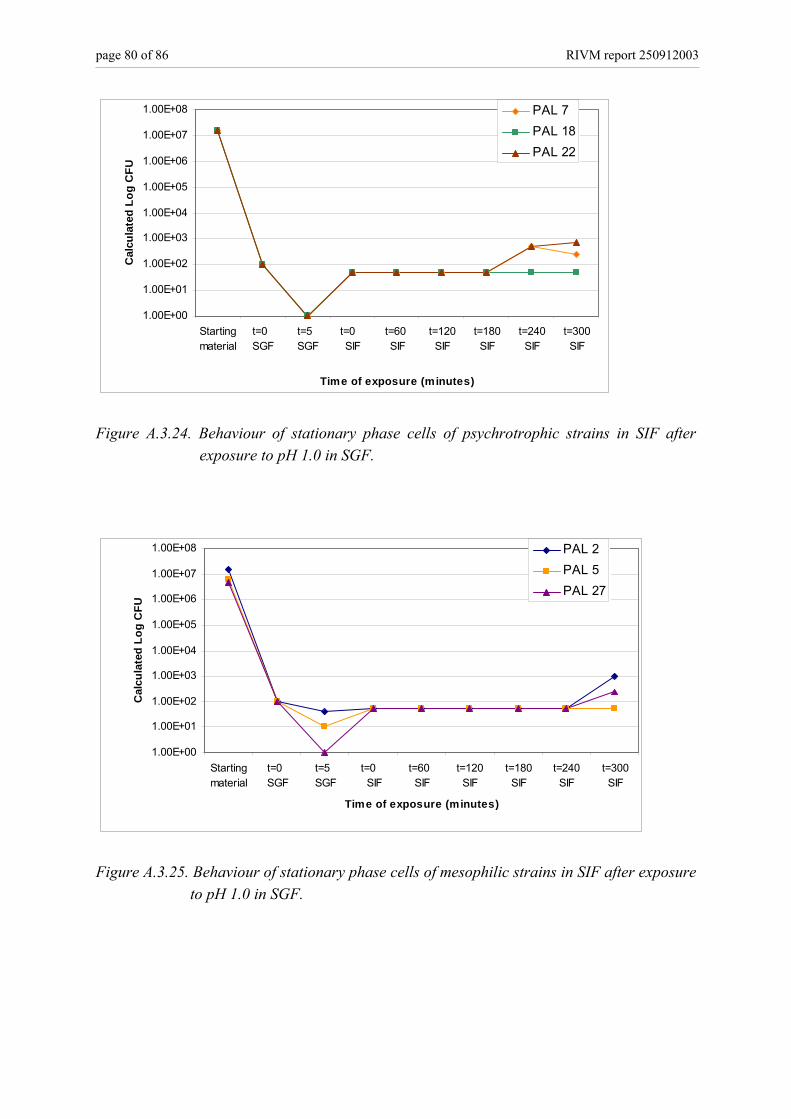
page 80 of 86 RIVM report 250912003
1.00E+00
1.00E+01
1.00E+02
1.00E+03
1.00E+04
1.00E+05
1.00E+06
1.00E+07
1.00E+08
Startingmaterial
t=0 SGF
t=5 SGF
t=0 SIF
t=60 SIF
t=120SIF
t=180SIF
t=240SIF
t=300SIF
Time of exposure (minutes)
Cal
cula
ted
Log
CFU
PAL 7PAL 18PAL 22
Figure A.3.24. Behaviour of stationary phase cells of psychrotrophic strains in SIF after
exposure to pH 1.0 in SGF.
1.00E+00
1.00E+01
1.00E+02
1.00E+03
1.00E+04
1.00E+05
1.00E+06
1.00E+07
1.00E+08
Startingmaterial
t=0 SGF
t=5 SGF
t=0 SIF
t=60 SIF
t=120SIF
t=180SIF
t=240SIF
t=300SIF
Time of exposure (minutes)
Cal
cula
ted
Log
CFU
PAL 2PAL 5PAL 27
Figure A.3.25. Behaviour of stationary phase cells of mesophilic strains in SIF after exposure
to pH 1.0 in SGF.
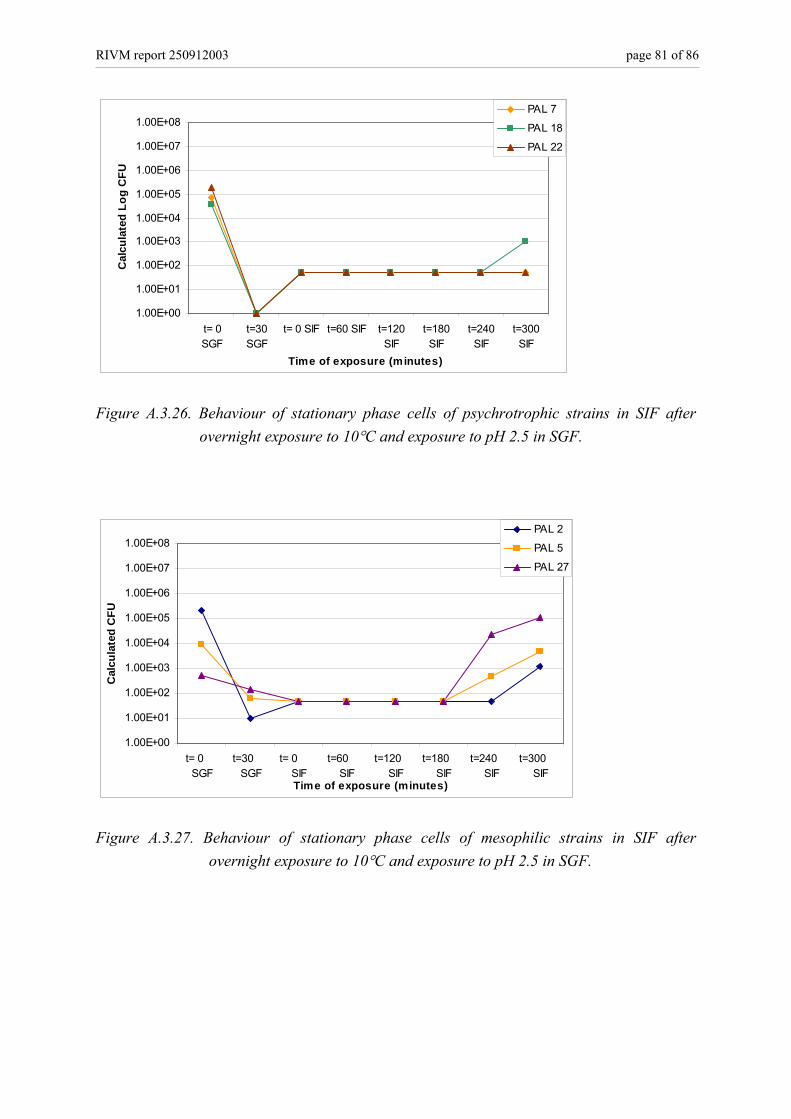
RIVM report 250912003 page 81 of 86
1.00E+00
1.00E+01
1.00E+02
1.00E+03
1.00E+04
1.00E+05
1.00E+06
1.00E+07
1.00E+08
t= 0SGF
t=30SGF
t= 0 SIF t=60 SIF t=120SIF
t=180SIF
t=240SIF
t=300SIF
Time of exposure (minutes)
Cal
cula
ted
Log
CFU
PAL 7
PAL 18
PAL 22
Figure A.3.26. Behaviour of stationary phase cells of psychrotrophic strains in SIF after
overnight exposure to 10°C and exposure to pH 2.5 in SGF.
1.00E+00
1.00E+01
1.00E+02
1.00E+03
1.00E+04
1.00E+05
1.00E+06
1.00E+07
1.00E+08
t= 0 SGF
t=30 SGF
t= 0 SIF
t=60 SIF
t=120 SIF
t=180 SIF
t=240 SIF
t=300 SIF
Time of exposure (minutes)
Cal
cula
ted
CFU
PAL 2
PAL 5
PAL 27
Figure A.3.27. Behaviour of stationary phase cells of mesophilic strains in SIF after
overnight exposure to 10°C and exposure to pH 2.5 in SGF.

page 82 of 86 RIVM report 250912003
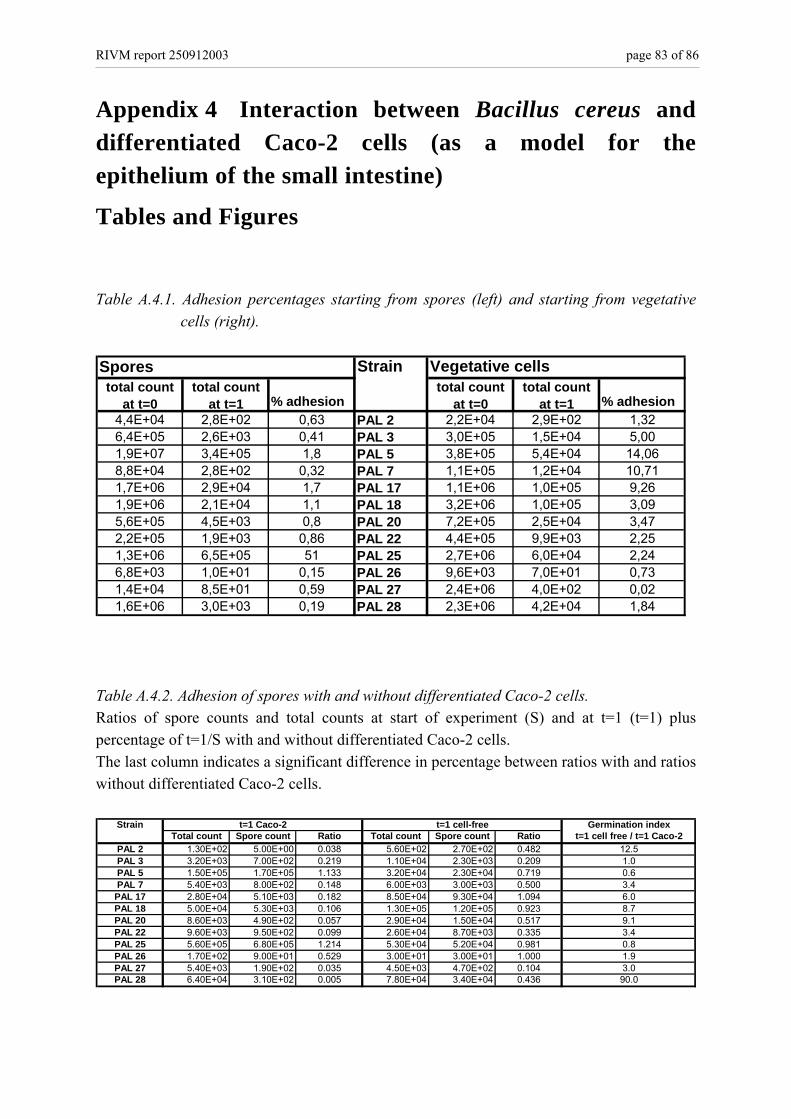
RIVM report 250912003 page 83 of 86
Appendix 4 Interaction between Bacillus cereus and differentiated Caco-2 cells (as a model for the epithelium of the small intestine)
Tables and Figures Table A.4.1. Adhesion percentages starting from spores (left) and starting from vegetative
cells (right). Spores Strain Vegetative cellstotal count
at t=0total count
at t=1 % adhesiontotal count
at t=0total count
at t=1 % adhesion4,4E+04 2,8E+02 0,63 PAL 2 2,2E+04 2,9E+02 1,326,4E+05 2,6E+03 0,41 PAL 3 3,0E+05 1,5E+04 5,001,9E+07 3,4E+05 1,8 PAL 5 3,8E+05 5,4E+04 14,068,8E+04 2,8E+02 0,32 PAL 7 1,1E+05 1,2E+04 10,711,7E+06 2,9E+04 1,7 PAL 17 1,1E+06 1,0E+05 9,261,9E+06 2,1E+04 1,1 PAL 18 3,2E+06 1,0E+05 3,095,6E+05 4,5E+03 0,8 PAL 20 7,2E+05 2,5E+04 3,472,2E+05 1,9E+03 0,86 PAL 22 4,4E+05 9,9E+03 2,251,3E+06 6,5E+05 51 PAL 25 2,7E+06 6,0E+04 2,246,8E+03 1,0E+01 0,15 PAL 26 9,6E+03 7,0E+01 0,731,4E+04 8,5E+01 0,59 PAL 27 2,4E+06 4,0E+02 0,021,6E+06 3,0E+03 0,19 PAL 28 2,3E+06 4,2E+04 1,84
Table A.4.2. Adhesion of spores with and without differentiated Caco-2 cells. Ratios of spore counts and total counts at start of experiment (S) and at t=1 (t=1) plus percentage of t=1/S with and without differentiated Caco-2 cells. The last column indicates a significant difference in percentage between ratios with and ratios without differentiated Caco-2 cells.
Strain Germination indexTotal count Spore count Ratio Total count Spore count Ratio t=1 cell free / t=1 Caco-2
PAL 2 1.30E+02 5.00E+00 0.038 5.60E+02 2.70E+02 0.482 12.5PAL 3 3.20E+03 7.00E+02 0.219 1.10E+04 2.30E+03 0.209 1.0PAL 5 1.50E+05 1.70E+05 1.133 3.20E+04 2.30E+04 0.719 0.6PAL 7 5.40E+03 8.00E+02 0.148 6.00E+03 3.00E+03 0.500 3.4
PAL 17 2.80E+04 5.10E+03 0.182 8.50E+04 9.30E+04 1.094 6.0PAL 18 5.00E+04 5.30E+03 0.106 1.30E+05 1.20E+05 0.923 8.7PAL 20 8.60E+03 4.90E+02 0.057 2.90E+04 1.50E+04 0.517 9.1PAL 22 9.60E+03 9.50E+02 0.099 2.60E+04 8.70E+03 0.335 3.4PAL 25 5.60E+05 6.80E+05 1.214 5.30E+04 5.20E+04 0.981 0.8PAL 26 1.70E+02 9.00E+01 0.529 3.00E+01 3.00E+01 1.000 1.9PAL 27 5.40E+03 1.90E+02 0.035 4.50E+03 4.70E+02 0.104 3.0PAL 28 6.40E+04 3.10E+02 0.005 7.80E+04 3.40E+04 0.436 90.0
t=1 cell-freet=1 Caco-2
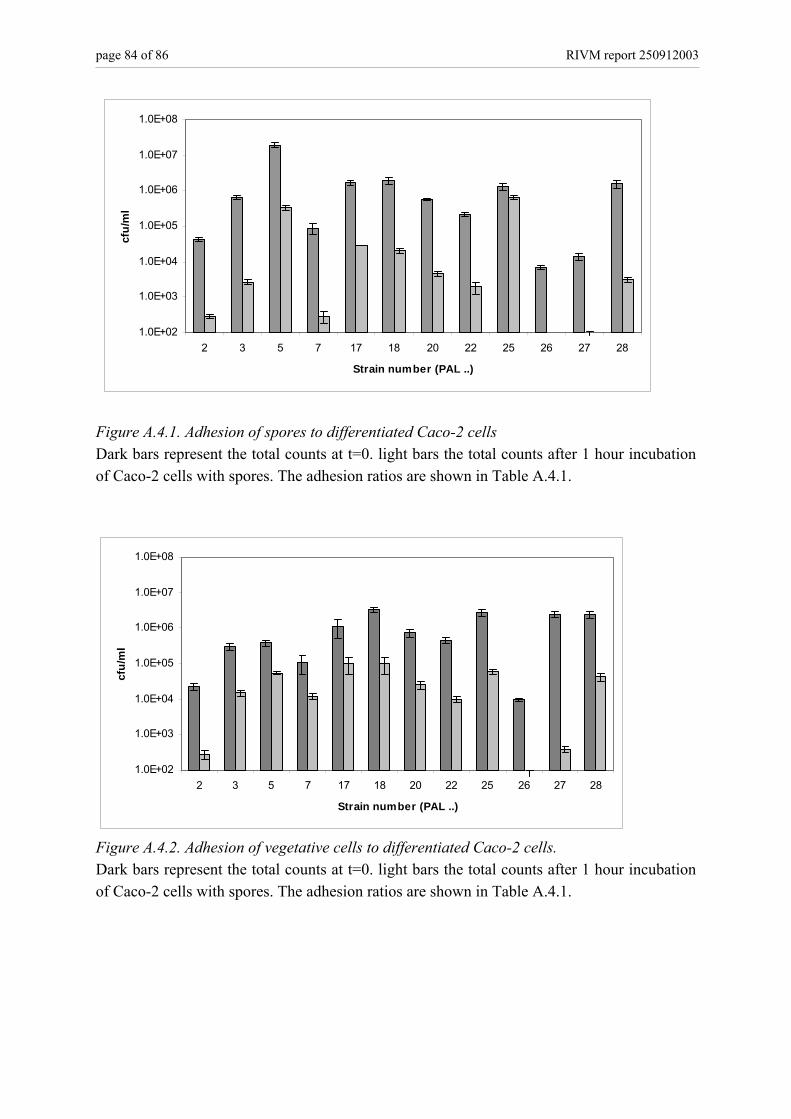
page 84 of 86 RIVM report 250912003
1.0E+02
1.0E+03
1.0E+04
1.0E+05
1.0E+06
1.0E+07
1.0E+08
2 3 5 7 17 18 20 22 25 26 27 28
Strain number (PAL ..)
cfu/
ml
Figure A.4.1. Adhesion of spores to differentiated Caco-2 cells Dark bars represent the total counts at t=0. light bars the total counts after 1 hour incubation of Caco-2 cells with spores. The adhesion ratios are shown in Table A.4.1.
1.0E+02
1.0E+03
1.0E+04
1.0E+05
1.0E+06
1.0E+07
1.0E+08
2 3 5 7 17 18 20 22 25 26 27 28
Strain number (PAL ..)
cfu/
ml
Figure A.4.2. Adhesion of vegetative cells to differentiated Caco-2 cells. Dark bars represent the total counts at t=0. light bars the total counts after 1 hour incubation of Caco-2 cells with spores. The adhesion ratios are shown in Table A.4.1.
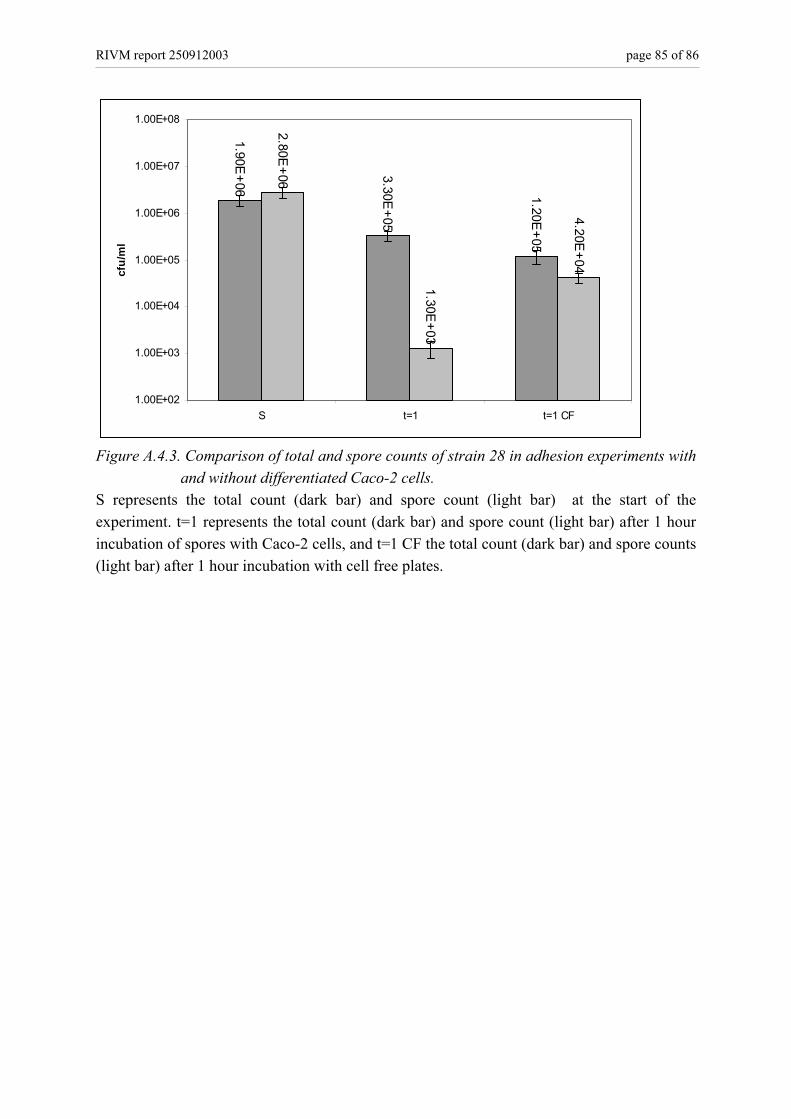
RIVM report 250912003 page 85 of 86
1.90E+06
3.30E+05
1.20E+05
2.80E+06
1.30E+03
4.20E+04
1.00E+02
1.00E+03
1.00E+04
1.00E+05
1.00E+06
1.00E+07
1.00E+08
S t=1 t=1 CF
cfu/
ml
Figure A.4.3. Comparison of total and spore counts of strain 28 in adhesion experiments with
and without differentiated Caco-2 cells. S represents the total count (dark bar) and spore count (light bar) at the start of the experiment. t=1 represents the total count (dark bar) and spore count (light bar) after 1 hour incubation of spores with Caco-2 cells, and t=1 CF the total count (dark bar) and spore counts (light bar) after 1 hour incubation with cell free plates.
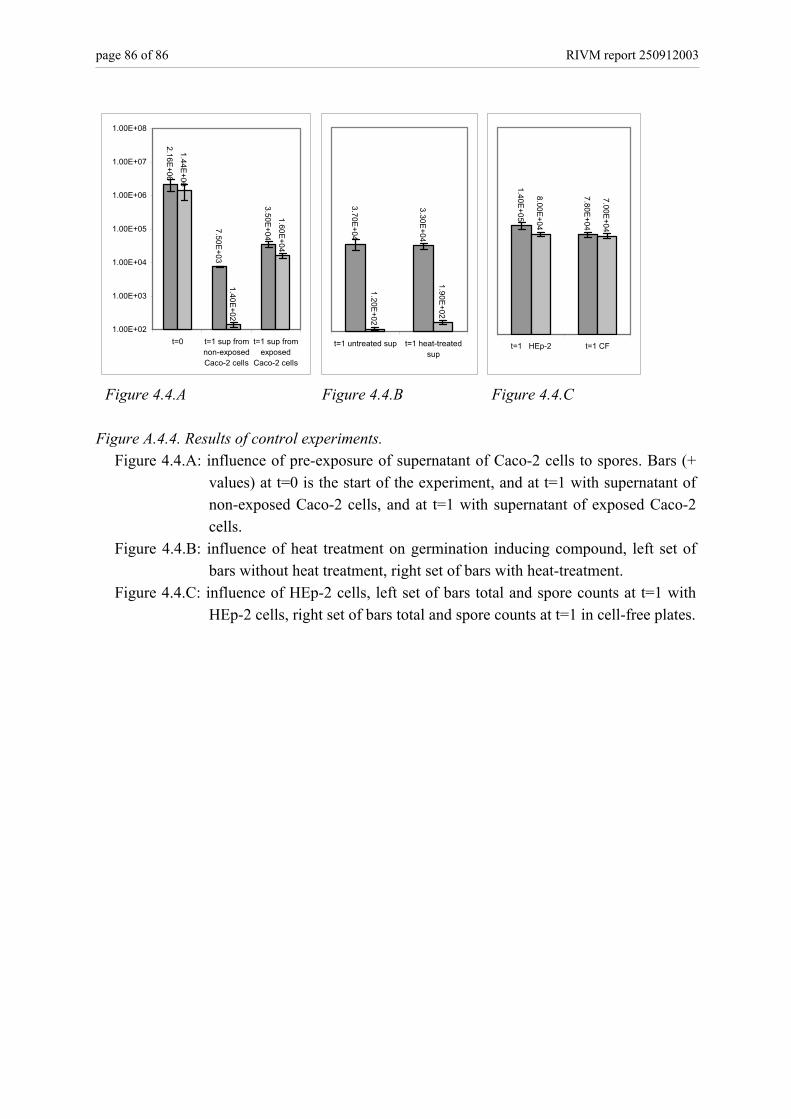
page 86 of 86 RIVM report 250912003
2.16E+06
7.50E+03
3.50E+04
1.44E+06
1.40E+02
1.60E+04
1.00E+02
1.00E+03
1.00E+04
1.00E+05
1.00E+06
1.00E+07
1.00E+08
t=0 t=1 sup fromnon-exposedCaco-2 cells
t=1 sup fromexposed
Caco-2 cells
3.70E+04
3.30E+04
1.20E+02
1.90E+02t=1 untreated sup t=1 heat-treated
sup
1.40E+05
7.80E+04
8.00E+04
7.00E+04
t=1 HEp-2 t=1 CF
Figure 4.4.A Figure 4.4.B Figure 4.4.C Figure A.4.4. Results of control experiments.
Figure 4.4.A: influence of pre-exposure of supernatant of Caco-2 cells to spores. Bars (+ values) at t=0 is the start of the experiment, and at t=1 with supernatant of non-exposed Caco-2 cells, and at t=1 with supernatant of exposed Caco-2 cells.
Figure 4.4.B: influence of heat treatment on germination inducing compound, left set of bars without heat treatment, right set of bars with heat-treatment.
Figure 4.4.C: influence of HEp-2 cells, left set of bars total and spore counts at t=1 with HEp-2 cells, right set of bars total and spore counts at t=1 in cell-free plates.