Embed Size (px)
Citation preview

Risks of Vapour-phase Herbicides in the Atmosphere on Non-target Plants
Th.A. Dueck
Note 272

Th.A. Dueck
Plant Research International B.V., WageningenNovember 2003 Note 272
Risks of Vapour-phase Herbicides in theAtmosphere on Non-target Plants

© 2003 Wageningen, Plant Research International B.V.All rights reserved. No part of this publication may be reproduced, stored in a retrieval system or transmitted, in any formor by any means, electronic, mechanical, photocopying, recording or otherwise, without the prior written permission ofPlant Research International B.V.
Plant Research International B.V.
Address : Droevendaalsesteeg 1, Wageningen, The Netherlands: P.O. Box 16, 6700 AA Wageningen, The Netherlands
Tel. : +31 317 47 70 00Fax : +31 317 41 80 94E-mail : [email protected] : http://www.plant.wur.nl

Table of contents
page
Abstract 1
1. Background 3
2. Approach 5
3. Factors determining risks of vapour-phase herbicides 7
3.1 Use of herbicides in the Netherlands 73.2 Herbicidal properties 83.3 Plant characteristics 11
4. Atmospheric concentration of herbicides 13
5. Effect concentrations of vapour phase herbicides 17
5.1 Effects of vapour phase herbicides on plants 175.2 Derivation of Effect Concentrations 205.3 Assessment of risks of vapour phase herbicides 20
6. Conclusions 25
7. References 27
Appendix I. Herbicides used in the Netherlands 2 pp.
Appendix II. Herbicides emitted in the Netherlands 2 pp.
Appendix III. Exposure risk index of herbicides used in the Netherlands 2 pp.


1
Abstract
The information on atmospheric concentrations, effects and effect concentrations of herbicides availablein the literature is very scarce. All of these three types of information were found for only threeherbicides used in the Netherlands, i.e. fluorxypyr, ethofumesate and chlorpropham. The maximummonthly mean concentrations measured in the Netherlands during 2000-2001 were 0.6 ng m-3
(fluorxypyr), 1.3 ng m-3 (ethofumesate) and 25 ng m-3 (chlorpropham). In the vicinity of fields on whichsprayed herbicides have been applied, peak concentrations can reach a factor 10-100 higher, dependingon the distance from the field edge.
Very few data on effect concentrations for herbicides were found and documented information wasfound for only 2,4-D, ethofumesate, chlorpropham and fluorxypyr. The calculated NOECs for theseherbicides were found to be 5 ng m-3 (fluorxypyr), 75 ng m-3 (ethofumesate) and 77 000 ng m-3
(chlorpropham), while that for 2,4-D is 1-100 ng m-3.
When emitted from a sprayed field at a rate of 0.01 g s-1, adverse effects due to these herbicides invapour phase may be expected to occur on non-target species at distances between 100 m and 3 kmfrom the field edge. Thus, it can be concluded that non-target plant species are at risk from these threevaporised herbicides at distances up to 3 km from sprayed fields, but knowledge on the effects andeffect concentrations of many other herbicides is still lacking.

2

3
1. Background
There is an increasing amount of concern about the possible side effects of pesticide vapours on non-target organisms. More than half of the amount of pesticides applied as crop protection measures maybe volatilised after spraying crops in the Netherlands (De Jong et al., 1995) and an estimated 2% of therecommended herbicide dose is currently being deposited on remote areas in this country (Klepper et al.,1998). Vapours of herbicides may well affect non-target plants, but data on levels of air-borne herbicidesand their effect thresholds are generally lacking.
The Health Council of the Netherlands was recently requested to review the current level of knowledgeon the atmospheric dispersion of agricultural pesticides and to make recommendations with respect toa risk evaluation of these pesticides. The resulting advisory report concluded that the risks arising frommedium-range atmospheric dispersions must be evaluated (Gezondheidsraad, 2000), and be based on acomparison between the anticipated exposure of organisms and their anticipated sensitivity. The reportalso stated that there is a lack of toxicity data for representative species.
As a direct result of that report, additional financial support was granted for the present evaluation.Within the DLO programme 359 (Emission, emission reduction methods and environmental risks ofpesticides), research in 2002 was focussed on two areas: emission during application and emission fromplant and soil surfaces after application. This report will focus on the potential risks and effects ofvaporised herbicides on non-target plants.

4

5
2. Approach
Following the application of herbicides on crops, a portion of the sprayed herbicides will be adsorbedand taken up by the plant (crop) via the cuticle. Another portion of the spray may reach the soil surfacewhere it is bound to the organic matter and broken down in time. Herbicide drift disperses and may bedeposited on (non-target) plants at short distances from the spray zone (field edge), or be transportedover longer distances depending on the wind speed and spray droplet size (the finer the spray, the largerthe distance it will be transported). However, a part of the applied herbicide will evaporate and enterthe vapour phase. The fact that herbicides can evaporate and be transported from middle to long-rangedistances from the site of application (the source) may pose a risk to non-target plants.
Herbicides may enter the vapour phase directly during and immediately following application (spraying)on a targeted crop. Later, herbicides may evaporate from plant leaf surfaces or from the soil into theatmosphere. In all cases, a certain amount of the evaporated active ingredient can affect the targetedspecies or become a potential risk to non-target plant species.
In the following report, a number of factors will be addressed that determine the potential risk vapourphase herbicides may pose towards plants, i.e. the amount of herbicide applied, herbicide-specificproperties and sensitivity of the receptor (plant species). Because insecticides and fungicides are nottargeted towards plants, only the effects of herbicides will be examined throughout this report. Theeffects of herbicides on non-target species will be limited to that of vaporised herbicides. The risks thatherbicides in vapour phase may pose for non-target plant species at middle to long-range distancesfrom the source will be addressed. The factors determining the potential risks of vapour phase herbicidesto plants will be presented and discussed. The effects of vaporised herbicides found in the literature andthrough experimental research will be assessed and an inventory of the herbicides used and their atmo-spheric concentrations in the Netherlands will be given. Finally, the effect concentrations of vapourphase herbicides reported in the literature will be addressed and evaluated with respect to risks for non-target plant species.

6

7
3. Factors determining risks of vapour-phaseherbicides
3.1 Use of herbicides in the NetherlandsThe total amount of chemical pesticides that was used in 2000 on 804,356 ha of agricultural and horti-cultural land in the Netherlands amounted to 5,346,278 kg (CBS, 1998). The majority of this amount(69%) was used on agricultural soils and 16% on flower bulbs. Herbicides comprise an important partof this amount with 2,294,502 kg being applied to agricultural soil (64%) and flower bulbs (30%). Theamounts of individual herbicides used are given in Table 1. The herbicidal nomenclature follows Anon.,(1999).
Table 1. Ranking of the top 20 herbicides used in agriculture and horticulture (kg yr-1) in the Netherlands(CBS, 1998). See also Appendix I for a more extensive list.
Herbicide kg yr-1 Herbicide kg yr-1
1 MCPA 676 348 11 chloridazon 61 9312 metamitron 155 099 12 propachlor* 61 7213 atrazine* 104 748 13 pyridate 58 5194 glyphosate 104 416 14 bentazone 54 7975 diquat dibromide 83 738 15 chlorpropham 53 0186 chlormequat (chloride) 83 117 16 ethofumesate 50 5277 metolachlor* 82 776 17 sulcotrion 37 6538 prosulfocarb 76 937 18 phenmedipham 36 2489 mecoprop-P* 75 244 19 metribuzin 30 848
10 isoproturon 65 966 20 metoxuron* 28 567
* not approved
A considerable amount of the herbicides applied to crops in the form of spray are emitted to the atmo-sphere directly above the crop and from the spray drift carried from the field by the wind. Fine spraydroplet and evaporated herbicide may be transported by the wind over middle to long distances. Driftdispersion is deposited nearer to the sprayed field than fine droplets and vaporised herbicides. A list ofthe top 20 emitted herbicides in the Netherlands in 2000 is given in Table 2. The emissions originatefrom open field agricultural/horticultural areas (cut flowers, bulbs, grassland, field crops) as well asclosed systems like glasshouses in which flowers and vegetables are grown. Relatively large amounts ofthe herbicides mecoprop-P, propachlor and metoxuron are shown to have been emitted in 2000(Anon., 2002), but these three herbicides have been since banned from use in the Netherlands.

8
Table 2. Emission of herbicides (kg yr-1) from open and closed systems calculated for MJPG 2000 (Anon., 2002).A more extensive list is given in Appendix II.
Herbicide kg y-1 Herbicide kg y-1
1 Mecoprop-P* 37951 11 Chlorpropham 88932 Propachlor* 31031 12 Metamitron 70633 MCPA 29779 13 Ethofumesate 62444 Metoxuron* 24411 14 Monolinuron 57435 Glyphosate 19320 15 Linuron 55636 2,4-D 13708 16 Pendimethalin 51787 Bentazone 13361 17 Isoproturon 50218 Chlormequat (chloride) 10830 18 Asulam 48569 Metam-natrium 9913 19 Glyphosate-trimesium 4678
10 Diquat dibromide 9498 20 Dichlobenil 4537
* not approved
The two herbicides with the highest absolute emission in 2000 were mecoprop-P and propachlor, bothof which were banned from use in the Netherlands in 2000 and 1999, respectively. The concentrationsof these herbicides emitted to the atmosphere can be thus expected to drop drastically in the comingyears.Large amounts of mineral oil are emitted annually as well (75 000 kg), but because it is largely used asan adjuvant and to a lesser extent as an insecticide, it is not included in either list.
3.2 Herbicidal propertiesThe specific characteristics of each herbicide will influence its dispersion and exposure to plants. Herb-icidal properties include, among others, molar mass, solubility in water, and vapour pressure. Anothervery important characteristic is the adjuvant added to the herbicide to facilitate uptake and effectivenessin the plant. Because all of these properties together determine the exposure of the herbicide to plantsand its potential effectiveness, it follows that a ranking of herbicidal toxicity should be possible. However,knowledge about the contribution of each property and their combination is generally lacking.
A very simple relationship for their relative toxicity might be found in the dosage advice of herbicides oncrops. The dosage (active ingredient per hectare) recommended for a particular crop (on similar groupsof weeds) might be used for a ranking of relative toxicity’s with the lowest dosage being relatively themost effective. Because only a limited number of herbicides are used to eradicate weeds in a particularcrop, such a list would be relatively short. Thus, a group of target crops were chosen in which a widerange of herbicides is presently used, fodder and forage crops. This example is given in Table 3.
9
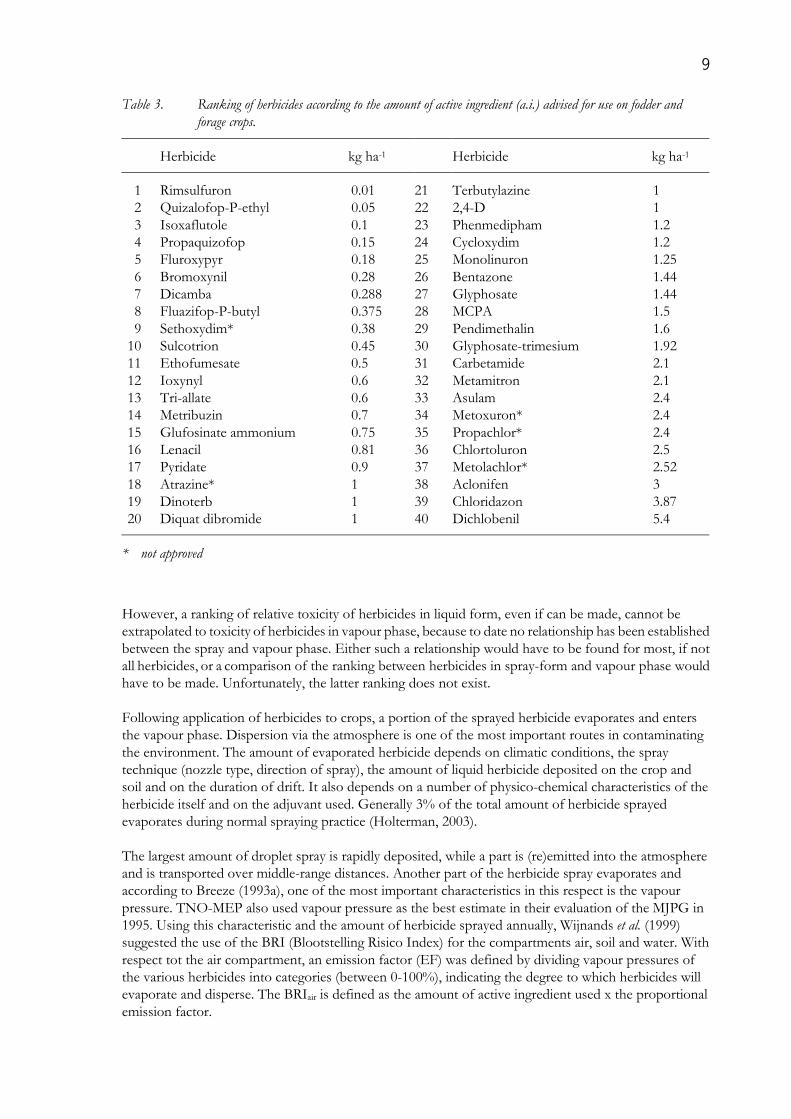
Table 3. Ranking of herbicides according to the amount of active ingredient (a.i.) advised for use on fodder andforage crops.
Herbicide kg ha-1 Herbicide kg ha-1
1 Rimsulfuron 0.01 21 Terbutylazine 12 Quizalofop-P-ethyl 0.05 22 2,4-D 13 Isoxaflutole 0.1 23 Phenmedipham 1.24 Propaquizofop 0.15 24 Cycloxydim 1.25 Fluroxypyr 0.18 25 Monolinuron 1.256 Bromoxynil 0.28 26 Bentazone 1.447 Dicamba 0.288 27 Glyphosate 1.448 Fluazifop-P-butyl 0.375 28 MCPA 1.59 Sethoxydim* 0.38 29 Pendimethalin 1.6
10 Sulcotrion 0.45 30 Glyphosate-trimesium 1.9211 Ethofumesate 0.5 31 Carbetamide 2.112 Ioxynyl 0.6 32 Metamitron 2.113 Tri-allate 0.6 33 Asulam 2.414 Metribuzin 0.7 34 Metoxuron* 2.415 Glufosinate ammonium 0.75 35 Propachlor* 2.416 Lenacil 0.81 36 Chlortoluron 2.517 Pyridate 0.9 37 Metolachlor* 2.5218 Atrazine* 1 38 Aclonifen 319 Dinoterb 1 39 Chloridazon 3.8720 Diquat dibromide 1 40 Dichlobenil 5.4
* not approved
However, a ranking of relative toxicity of herbicides in liquid form, even if can be made, cannot beextrapolated to toxicity of herbicides in vapour phase, because to date no relationship has been establishedbetween the spray and vapour phase. Either such a relationship would have to be found for most, if notall herbicides, or a comparison of the ranking between herbicides in spray-form and vapour phase wouldhave to be made. Unfortunately, the latter ranking does not exist.
Following application of herbicides to crops, a portion of the sprayed herbicide evaporates and entersthe vapour phase. Dispersion via the atmosphere is one of the most important routes in contaminatingthe environment. The amount of evaporated herbicide depends on climatic conditions, the spraytechnique (nozzle type, direction of spray), the amount of liquid herbicide deposited on the crop andsoil and on the duration of drift. It also depends on a number of physico-chemical characteristics of theherbicide itself and on the adjuvant used. Generally 3% of the total amount of herbicide sprayedevaporates during normal spraying practice (Holterman, 2003).
The largest amount of droplet spray is rapidly deposited, while a part is (re)emitted into the atmosphereand is transported over middle-range distances. Another part of the herbicide spray evaporates andaccording to Breeze (1993a), one of the most important characteristics in this respect is the vapourpressure. TNO-MEP also used vapour pressure as the best estimate in their evaluation of the MJPG in1995. Using this characteristic and the amount of herbicide sprayed annually, Wijnands et al. (1999)suggested the use of the BRI (Blootstelling Risico Index) for the compartments air, soil and water. Withrespect tot the air compartment, an emission factor (EF) was defined by dividing vapour pressures ofthe various herbicides into categories (between 0-100%), indicating the degree to which herbicides willevaporate and disperse. The BRIair is defined as the amount of active ingredient used x the proportionalemission factor.

10
BRIair = kg active ingredient * (EF/100)
This index is not a measure of the toxicity of a herbicide, but a measure of the relative risk that a herbicidewill evaporate. The relative toxicity of herbicides in vapour phase influences their risk to non-targetorganisms because they are not likely to be equally toxic. The BRI for herbicides in the Netherlands aregiven in Table 4. The BRI does not reflect the relative risk of the herbicides, but incorporates the amountsof active ingredient used (in 1998) and is thus an indication of the risk of emission to the atmosphereabove the Netherlands.
Table 4. Potential risk of the top 20 vapour phase herbicides (BRIair) per year (kg active ingredient), based on theiruse in 1998. Mechanism indicates the metabolic mode of action in the plant and if it is a systemic (S) or acontact (C) herbicide. See also Appendix III.
Herbicide BRIair Mechanism Pathway
(kg a.i.) Foliar Soil
1 Metolachlor* 29799 S, protein synthese X X2 Propachlor* 29317 S, cell division X X3 MCPA 16909 S, growth regulator X -4 Metoxuron* 11427 S, photosynthesis X X5 Chlormequat 9351 S, growth regulator X -6 Mecoprop-P* 6772 S, growth regulator X -7 Daminozide 4747 S, growth regulator X X8 Bentazone 3945 C, photosynthesis X -9 Monolinuron 3671 S, photosynthesis X X
10 Metribuzin 3239 S, photosynthesis X X11 Prosulfocarb 3077 S, fatty acid synthese - X12 Tri-allate 2983 S, fatty acid synthese - X13 Atrazine* 2619 S, photosynthesis X X14 Dinoterb 2206 C, membrane disruption X -15 Pendimethalin 1502 S, cell division - X16 2,4-D 1391 S, growth regulator X -17 Dicamba 1193 S, growth regulator X -18 Metamitron 1086 S, photosynthesis X X19 Ethofumesate 970 S, fatty acid synthese X X20 Asulam 847 S, DHP synthase X X
* not approved
Table 4 indicates that the highest risks of emission hold for metolachlor and propachlor, but that isbased on their use in 1998. They have since been banned, and their use should have drasticallydiminished since. The next group of potential emission risk herbicides are MCPA, metoxuron andchloormequat, used primarily in cereal crops, potatoes and grassland cultures and of these metoxuronhas been recently banned as well. Thus, policy makers appear to be effective in reducing the risk ofherbicidal emissions.

11
3.3 Plant characteristicsWhen considering the influence of plant characteristics on the uptake of herbicides, the role of formu-lations or adjuvants can not be omitted. Most herbicides are not readily taken up and require an adjuvantfor uptake to occur. The following however, will focus on the role of plant characteristics in herbicidal(including adjuvant) uptake.
Uptake via the roots would require deposition to the soil, transition into the liquid phase and eventuallyuptake via the roots, which can occur, but would likely require larger deposited amounts to be effective.The less lipophilic the herbicide is, the more readily it will be transported through the soil and be takenup by the roots
Vapour phase herbicides deposited on plants are most likely to be taken up via the shoots. Uptake viathe shoots or leaves depends on a number of plant characteristics. Herbicides in vapour phase aredeposited onto leaf surfaces. The total surface of plant leaves is an important factor, the larger the leafsurface relative to the soil area (leaf area index), the more herbicide can be deposited and adsorbed tothe leaf surface. Therefore, broad-leaved species, species with horizontally orientated leaves andvegetation with a high leaf area index (LAI) will run a higher risk than plants with small, verticallyorientated leaves.
Plant leaves are often covered with an epicuticular wax layer, the amount and composition of whichdiffers in a species-specific manner. The wax layer gives rise to a microstructure which affects thewettability of the foliage and thus the amount of herbicide in liquid phase taken up and its distributionover the leaf surface. Waxes with granules, rods, plates or crusts give the leaf a rough surface whichincreases deposition onto the leaf, in contrast to waxes with smooth amorphous surfaces. Lipophilicherbicides are more easily adsorbed and taken up by leaves with epicuticular wax. Also, young leaves onplants with a high growth rate are often more susceptible than older leaves because of their higherphysiological activity and higher lipid content.
Dry deposition of herbicides thus increases with increasing leaf roughness (rough structure, hairyleaves, and crinkled leaves), which also affects the uptake via stomata. This also applies in the case ofvegetation, so that more vapour phase herbicides will be adsorbed by forest trees (high degree ofroughness) than by grassland vegetations. Herbicides taken up via the stomata are potentially more toxicthan those taken up via the cuticle. Plants are able to assimilate herbicides at very low concentrations(1-10 pg l-1). The route via the stomata may be less important however, as herbicides are often not verysoluble in water Breeze (1993a; 1993b), which is a prerequisite for stomatal uptake and transport intothe leaf mesophyll cell layer.

12

13
4. Atmospheric concentration of herbicides
The concentrations of herbicides empirically measured in the atmosphere obviously depend on herbicidalproperties such as their evaporation rate, on meteorological conditions and distance from the pointsource of application. Kempenaar et al. (1998) presented a list of concentrations of herbicides from theliterature (Table 5). The findings are grouped into measurements at distances 100 m - 10 km and morethan 10 km from the source.
Peak concentrations up to 10 000 ng m-3 were recorded within a distance of 10 km, with 24 h means ofa factor 5-10 lower than the peak values. At distances exceeding 10 km from the point source, maximumconcentrations up to 10 ng m-3 were measured, a factor 10-100 higher than near sprayed fields (Baas &Bakker, 1996) It is important to realise the implications of these observations when examining thecommonly presented daily or monthly means. Mean concentrations of herbicides are likely to mask theacute toxic peak concentrations of a factor 10 higher than the 24 h mean and likely even higher than aweekly or monthly mean concentration.
In the past number of years monitoring programs have yielded additional data on the atmosphericconcentration of herbicides in the Netherlands as well. TNO-MEP has set up a monitoring campaign inthe Netherlands to monitor the atmospheric concentration and deposition of pesticides on a nationallevel. In order to accomplish this, 18 monitoring stations were established throughout the country. Thelocations were chosen such that they were not in the vicinity of a large (point) source. As a result, theseherbicide concentrations can be interpreted as the long-term mean concentration of a herbicide for aparticular location or region. Peak concentrations are likely to be masked as mentioned earlier andmight well be expected to be 10-100 times higher. Of the total number of pesticides measured on amonthly basis for the period of 2 years (2000-2001), 18 herbicides were included in the campaign, theresults of which are given in Table 6.
The 18 monitoring locations were grouped into 4 main regions in the Netherlands, entailing the northernprovinces, the central/east area, the western coastal provinces with the intensive open field cultures ofbulbs, cut flowers and vegetables, and including 2 locations in the south part of the Netherlands. Table 6gives the maximum mean monthly concentrations recorded over the 2-year period including the numberof locations at which the herbicide was measured. The month(s) in which the herbicide was measuredas well as the main crop(s) to which it was applied are given as well. Note that 6 of the herbicides havebeen banned from use during the past years and are still present in the atmosphere.
Of the 18 herbicides measured, metamitron and MCPP were never found in samples. The highestatmospheric concentrations of chlorpropham were measured in the western provinces during thewinter season, reflecting its use on the open fields of bulbs and cut flowers. High concentrations werealso recorded in the southern locations during the summer months following applications to potatoesand other field vegetables.Dichlobenil was measured throughout the whole year, except in the northern provinces. It is usedpredominantly in fruit tree cultures and on other types of tree farms.The highest concentrations of propachlor were measured in the central-eastern parts of the Netherlands,likely as a result of application to cut flowers and vegetables in those areas.Locations in the east and southern provinces also showed increased monthly mean concentrations oftriallate following its use on sugar beets and cereal grains.
The differences in the presence of the various herbicides and the season measured obviously reflecttheir regional use, but is also influenced by their use in surrounding regions. Although a part of themeasured concentrations is likely to have been transported over longer distances from other areasincluding Germany and Belgium, the largest part likely reflects use of the herbicides in that region.

14
Table 5. Vapour-phase concentrations of herbicides in ambient air, obtained from various monitoring programs. Permeasurement, the air sampling period was 24 h, and circa 500 m3 air was sampled (after Kempenaaret al., 1998).
Distance to herbicide Herbicide Concentrations Comments‡
treated fields/crops [ng m-3 air]
site indicator maximum mean
Distance: 0.1 to 10 km
1. De Zilk, Naaldwijk, trifluralin 1.6 0.3 Baas & Duyzer, 1997. Weekly and Noordwijk, 2,4-D 0.8 <0.02* observations in the autumn of the Netherlands atrazine 0.1 <0.02* 1996 on 3 sites in Zuid Holland
simazine 0.1 <0.01*mecoprop 1.3 0.03
2. Colmar, France mecoprop-P 60 22 Millet, 1994. 17 Observationsisoproturonatrazine
94
42
per chemical in Jan. - Dec.1992, detection frequencies >90%
3. California, USA bromoxynil 37 18 Baker et al., 1996. > 20 Observ.DEF 340 68 per chemical in certain periodsmolinate 1200 570 in 1987 to 1995
4. Saskatchewan,Canada
2,4-Dtri-allatetrifluralin
1350019862
???
Grover, 1989. > 100 Observ.per chemical in certain periodsin 1966 to 1982
5. North Dakota, USA trifluralin 1 ? Hawthorne et al., 1996. > 20observation
Distance: > 10 km
6. Vallombrosa, Italy dichlobenil 3.1 <2.2* Trevisan et al., 1994.trifluralin 5.6 <1.2* 20 Observations per chemicalalachlor 2.0 <1.4* in April - July 1989
7. Kitakyushu, Japan propyzamide 0.3 0.23 Haraguchi et al., 1994trifluralin 0.2 <0.1* 2 observation dates in July 1991pendimethalin
0.3 <0.2* and April 1992
simazine 0.6 0.36atrazine 0.3 0.26
8. Chesapeak Bay, USA metolachlor 5 * McConnell et al., 1995. Datafrom several stations, spring +autumn
trifluralin 5 * measurements in 1993
* no mean concentrations presented because concentrations were below the detection limit in more than 50% of the airsamples analyzed
? only peak concentrations were presented by the authors‡ for the references, see Kempenaar et al. (1998)

15
Tabl
e 6.
High
est m
ean
mon
thly
conc
entra
tion
(ng m
-3) o
f 16
vapo
ur p
hase
herb
icide
s in
ambi
ent a
ir rec
orde
d in
200
0-20
01 b
y TN
O-M
EP.
Her
bici
de#
site
sM
onth
ly h
igh
mea
n (n
g m
-3)
Mon
th(s
)Pr
imar
y ta
rget
cro
p/ re
mar
ksH
erbi
cide
# s
ites
Mon
thly
hig
h m
ean
(ng
m-3
)Mon
th(s
)Pr
imar
y ta
rget
cro
p
Reg
ion
Nor
th (4
mon
itorin
g sit
es)
Reg
ion
Eas
t (4
mon
itorin
g sit
es)
Atr
azin
e*1
0.1
Aug
corn
Atr
azin
e*-
--
corn
Ben
tazo
ne3
0.2
Apr
il-Ju
lyco
rn, g
rass
, cer
eals
Ben
tazo
ne4
0.2
July
corn
, gra
ss, c
erea
lsC
hlor
prop
ham
41.
8O
ct-J
une
pota
to, b
ulbs
, veg
etab
les
Chl
orpr
opha
m4
3.5
Oct
-Mar
chpo
tato
, bul
bs, v
eget
able
sC
hlor
idaz
on-
--
suga
rbee
t, bu
lbs
Chl
orid
azon
20.
2A
pril
suga
rbee
t, bu
lbs
Dic
hlob
enil
46.
9Ja
n-D
ec(f
ruit)
tree
sD
ichl
oben
il4
14.5
Jan-
Dec
(fru
it)tr
ees
DN
OC
*4
3.4
Aug
-Apr
il?
DN
OC
*4
2.8
Sept
-May
?E
thof
umes
ate
40.
4Ju
ly-N
ovsu
garb
eet,
gras
sE
thof
umes
ate
40.
3O
ct-N
ovsu
garb
eet,
gras
sFl
uoro
xypy
r3
0.6
Sept
-Nov
corn
, gra
ss, c
erea
lsFl
uoro
xypy
r3
0.3
Aug
-Oct
corn
, gra
ss, c
erea
lsIs
oxaf
luto
le-
0-
corn
Isox
aflu
tole
--
-co
rnM
CPA
10.
1M
aypo
tato
, gra
ss, c
erea
lsM
CPA
--
-po
tato
, gra
ss, c
erea
lsM
etol
achl
or*
10.
3M
ay-J
une
corn
Met
olac
hlor
*2
0.1
May
corn
Prop
achl
or**
44.
2M
arch
-Aug
cut f
low
ers,
vege
tabl
esPr
opac
hlor
**4
13.8
Mar
ch-A
ugcu
t flo
wer
s, ve
geta
bles
Sim
azin
e**
40.
2M
arch
nurs
ery
tree
sSi
maz
ine*
*1
0.4
Aug
nurs
ery
tree
sT
erbu
tyla
zine
20.
5Ju
lyco
rnT
erbu
tyla
zine
30.
6Ju
ne-J
uly
corn
Tria
llate
44.
3Ja
n-D
ecsu
garb
eet,
cere
als
Tria
llate
410
.8Ja
n-D
ecsu
garb
eet,
cere
als
Trif
lura
lin*
41.
3A
pril-
Aug
?T
riflu
ralin
*4
0.9
Aug
-Apr
il?
Reg
ion
Wes
t (8
mon
itorin
g sit
es)
Reg
ion
Sout
th (2
mon
itorin
g sit
es)
Atr
azin
e*2
0.1
Mar
ch-J
uly
corn
Atr
azin
e*1
0.3
Mar
chco
rnB
enta
zone
50.
2Ju
ne-J
uly
corn
, gra
ss, c
erea
lsB
enta
zone
20.
2Ju
ne-J
uly
corn
, gra
ss, c
erea
lsC
hlor
prop
ham
824
.5O
ct-A
pril
pota
to, b
ulbs
, veg
etab
les
Chl
orpr
opha
m2
9.6
June
-Jul
ypo
tato
, bul
bs, v
eget
able
sC
hlor
idaz
on1
0.2
Apr
ilsu
garb
eet,
bulb
sC
hlor
idaz
on1
0.2
Mar
chsu
garb
eet,
bulb
sD
ichl
oben
il8
18.2
Jan-
Dec
(fru
it)tr
ees
Dic
hlob
enil
29.
8Ja
n-D
ec(f
ruit)
tree
sD
NO
C*
85.
3Ju
ly-D
ec?
DN
OC
*2
3.1
July
-Apr
il?
Eth
ofum
esat
e8
0.9
June
-Nov
suga
rbee
t, gr
ass
Eth
ofum
esat
e2
1.3
June
-Dec
suga
rbee
t, gr
ass
Fluo
roxy
pyr
60.
4A
ug-O
ctco
rn, g
rass
, cer
eals
Fluo
roxy
pyr
20.
4M
arch
-Jul
yco
rn, g
rass
, cer
eals
Isox
aflu
tole
10.
4Ju
neco
rnIs
oxaf
luto
le1
0.2
Oct
corn
MC
PA1
0.4
July
pota
to, g
rass
, cer
eals
MC
PA-
--
pota
to, g
rass
, cer
eals
Met
olac
hlor
*-
--
corn
Met
olac
hlor
*2
1.5
May
-Jul
yco
rnPr
opac
hlor
**8
5.5
Mar
ch-A
ugcu
t flo
wer
s, ve
geta
bles
Prop
achl
or**
20.
7M
arch
June
cut f
low
ers,
vege
tabl
esSi
maz
ine*
*3
0.5
Mar
ch-A
pril
nurs
ery
tree
sSi
maz
ine*
*-
--
nurs
ery
tree
sT
erbu
tyla
zine
10.
6Ju
ne-J
uly
corn
Ter
buty
lazi
ne2
1.8
June
-Jul
yco
rnT
rialla
te8
2.1
Jan-
Dec
suga
rbee
t, ce
real
sT
rialla
te2
11.4
Jan-
Dec
suga
rbee
t, ce
real
sT
riflu
ralin
*8
2.4
Aug
-Apr
il?
Trif
lura
lin*
21.
7Ja
n-D
ec?
* no
t app
rove
d **
indi
cates
that
the h
erbici
de is
still
cons
idere
d ne
cessa
ry in
agr
icultu
re

16

17
5. Effect concentrations of vapour phaseherbicides
5.1 Effects of vapour phase herbicides on plantsThere is not a great deal of quantitative data available on effects and effect concentrations of vapourphase herbicides on (non-target) plants. Some experimental results of effects however, published inpeer-reviewed literature and in institutional reports are presented here below.
In an experimental study by Kempenaar et al. (1999), four common horticultural species (lettuce, kale,tomato and radish) were exposed to 11 herbicides. An equivalent amount of active ingredient of eachherbicide in flasks was brought into vapour phase by passing an air stream through the flasks and intofumigation chambers containing the 4 species. It was assumed that similar amounts of each herbicidewould evaporate and be brought into contact with the test plants. The plants were simultaneouslyexposed to each gaseous herbicide for up to 72 h and then transferred to the greenhouse where theywere observed for three weeks. The observed plant responses were foliar injury, shoot biomassproduction, mortality and reduction in light use efficiency (LUE) and are shown in Table 7.
Table 7. Mean foliar injury (%), reduction of shoot biomass (%), mortality (%) and reduction in light use efficiency(%) in four crop species after 72 h of exposure to vapours of eleven herbicides (from Kempenaar et al.,1999).
Herbicide Injury(%)
Biomass reduction(%)
Mortality(%)
LUE reduction(%)
Asulam -1 - - -Bentazone - - - -Glyphosate - - - -Metoxuron 0.4 - - 26Atrazine 0.2 - - -MCPA 2 - - -Pendimethalin 10 35 - -Diquat dibromide 50 31 - 43Metribuzin 35 72 38 90Ethofumesate 94 84 38 66Dichlobenil 88 88 63 -
1 indicates no response (injury) or no significant effect
Although equal amounts of the active ingredient were used, the atmospheric concentrations in thefumigation chambers were not measured, so it is not certain that the experimental concentrations wereactually similar in all cases.
The effects of herbicides will increase with increasing concentration and the ranking of toxic effects forthese herbicides appears to be similar for each of the chosen endpoints. At the concentrations to which theplants were exposed, visible injury was the most sensitive parameter, followed by biomass reduction andmortality. The LUE reflects the potential biomass per unit assimilated light energy, and can not be con-

18
sidered as an adequate response parameter for all herbicides, as not all affect the photosynthesis process.For those herbicides that do act directly on the photosynthesis process however, the LUE was shownin this experiment to be a good indicator of potentially adverse effects on plants (Kempenaar et al., 1999).
Only few quantitative studies on the effects of vapour phase herbicides have been performed to date.Those published were performed under controlled conditions and are shown in Table 8. Only a feweffect concentrations could be derived from these studies. For 2,4-D the concentrations at which aneffect was observed ranged from 0.3 – 10 000 ng m-3, depending on exposure duration, plant speciesand formulation. In three other single experiments, exposures to fluroxypyr, ethofumesate andchlorpropham resulted in visible injury and biomass reduction at varying concentrations. Following 48 hexposure to 5 ng m-3 fluoroxypyr, the biomass production of tomato was reduced (Breeze, 1988).
In a subsequent study, Franzaring et al. (2001) exposed 14 wild plant species to a range of chlorprophamand ethofumesate concentrations for 48 h. Vapours of ethofumesate caused injury in all higher species,in contrast to chlorpropham despite its higher concentrations in the air. Visible injury and growthreduction was observed only in the species Agrostemma githago at 77 000 ng m3 (chlorpropham), whileethofumesate caused visible injury in all 14 species at 75 ng ng m-3 and biomass reduction at 150 ng m-3.This observation indicates that chlopropham has a higher effect threshold in this experiment withyoung plants,. The effect threshold for ethofumesate (75 ng m-3) was much lower and is comparable tothat for 2,4-D. Ethofumesate adversely affected the growth of one third of the plant species tested.Apparently, herbicidal toxicity is not related to atmospheric concentration, as ethofumesate causedmore adverse effects on these plants than chlorpropham did, despite its lower concentration.
The limited amount of data gained from experiments with these herbicides indicate that effect concen-trations are in the order of 0.1 to 100 ng m-3 and depend on exposure duration, plant species andformulation.

19
Tabl
e 8.
Effe
cts o
f var
ious h
erbici
des o
n pl
ants.
Effe
ct co
ncen
tratio
ns re
flect
LO
EC
s or N
OE
Cs.
Her
bici
dePl
ant s
peci
esE
xpos
ure
(hou
r)E
.C. (
ng m
-3)
Eff
ect
Ref
eren
ce
2,4-
D b
utyl
Lettu
ce, t
omat
o72
5vi
sible
inju
ryV
an R
ensb
urg
& B
reez
e 19
90Le
ttuce
, tom
ato
24±
100
biom
ass
redu
ctio
n2,
4-D
but
ylT
omat
o5
5000
biom
ass
redu
ctio
nB
reez
e &
Wes
t 198
7a1-
210
000
alte
red
phys
iolo
gy2,
4-D
but
ylT
omat
o6
120
biom
ass
redu
ctio
nB
reez
e 19
882,
4-D
but
ylLe
ttuce
, tom
ato,
cab
bage
, bea
n, s
unflo
wer
3.5
3000
biom
ass
redu
ctio
nB
reez
e &
Wes
t 198
7b2,
4-D
iso-
octy
lLe
ttuce
720.
3vi
sible
inju
ryB
reez
e &
Van
Ren
sbur
g 19
92T
omat
o24
13vi
sible
inju
ry2,
4-D
iso-
octy
lT
omat
o24
800
alte
red
phys
iolo
gyB
reez
e &
Fow
ler 1
992
2,4-
D (a
cid)
Lettu
ce, t
omat
o72
30bi
omas
s re
duct
ion
Bre
eze
& V
an R
ensb
urg
1991
fluox
ypyr
tom
ato
485
biom
ass
redu
ctio
nB
reez
e 19
88as
ulam
Lettu
ce, t
omat
o, k
ale,
radi
sh72
no e
ffec
tK
empe
naar
et a
l. 19
99be
ntaz
one
Lettu
ce, t
omat
o, k
ale,
radi
sh72
no e
ffec
tK
empe
naar
et a
l. 19
99gl
ypho
sate
Lettu
ce, t
omat
o, k
ale,
radi
sh72
no e
ffec
tK
empe
naar
et a
l. 19
99m
etox
uron
Lettu
ce, t
omat
o, k
ale,
radi
sh72
0.4%
visi
ble
inju
ryK
empe
naar
et a
l. 19
99at
razi
neLe
ttuce
, tom
ato,
kal
e, ra
dish
24-7
20.
2% v
isibl
e in
jury
Kem
pena
ar et
al.
1999
MC
PALe
ttuce
, tom
ato,
kal
e, ra
dish
24-7
20.
7-2%
vis
ible
inju
ryK
empe
naar
et a
l. 19
99pe
ndim
etha
linLe
ttuce
, tom
ato,
kal
e, ra
dish
8-72
0.1-
10%
vis
ible
inju
ryK
empe
naar
et a
l. 19
99Le
ttuce
, tom
ato,
kal
e, ra
dish
48-7
221
-35%
bio
mas
s re
duct
ion
diqu
at d
ibro
mid
eLe
ttuce
, tom
ato,
kal
e, ra
dish
8-72
3-50
% v
isibl
e in
jury
Kem
pena
ar et
al.
1999
Lettu
ce, t
omat
o, k
ale,
radi
sh24
-72
22-3
1% b
iom
ass
redu
ctio
nm
etrib
uzin
Lettu
ce, t
omat
o, k
ale,
radi
sh8-
720.
6-35
% v
isib
le in
jury
Kem
pena
ar et
al.
1999
Lettu
ce, t
omat
o, k
ale,
radi
sh24
-72
21-7
2% b
iom
ass
redu
ctio
nLe
ttuce
, tom
ato,
kal
e, ra
dish
7238
% m
orta
lity
etho
fum
esat
eLe
ttuce
, tom
ato,
kal
e, ra
dish
8-72
2-94
% v
isibl
e in
jury
Kem
pena
ar et
al.
1999
Lettu
ce, t
omat
o, k
ale,
radi
sh8-
7215
-84%
bio
mas
s re
duct
ion
Lettu
ce, t
omat
o, k
ale,
radi
sh48
-72
25-3
8% m
orta
lity
dich
lobe
nil
Lettu
ce, t
omat
o, k
ale,
radi
sh8-
7235
-88%
visi
ble
inju
ryK
empe
naar
et a
l. 19
99Le
ttuce
, tom
ato,
kal
e, ra
dish
8-72
57-8
8% b
iom
ass
redu
ctio
nLe
ttuce
, tom
ato,
kal
e, ra
dish
24-7
213
-63%
mor
talit
ych
loro
prop
ham
Agr
ostem
ma
githa
go48
77 0
00vi
sible
eff
ects
Fran
zarin
g et
al. 2
001
etho
fum
esat
e14
wild
pla
nt s
peci
es48
184
visib
le e
ffec
ts (o
p 14
sp)
Fran
zarin
g et
al. 2
001
14 w
ild p
lant
spe
cies
4818
4bi
omas
s re
duct
ion
(5 s
p)

20
5.2 Derivation of Effect ConcentrationsIf phytotoxic effects occur, dose-response relationships are often performed in order to derive limits towhich plants can be safely exposed the chemical component in question. The dose-response relationshipis initially used to derive a concentration at which the plant species tested have been found to (adversely)respond to the exposure. The plant’s response is influenced by a number of factors (see chapter 3),which determine the potential risk of a herbicide to non-target plants, usually indicated by a (no) effectconcentration. This is what we actually wish to derive, the concentration of herbicide at which thetarget (non-target plant species) undergoes (no) adverse effects. Limitations to the exposure are thusexpressed as a concentration, i.e. the lowest observed effective concentration (LOEC) usually for short-term exposures or the no-effect effective concentration (NOEC) for longer-term exposures. Limitsshould address exposure to key plant species. Usually weed species are the targeted species, but in thiscase may include non-targeted weed and crop species as well.
As mentioned earlier, the only herbicide for which a number of experimental studies have been performedthat have derived effect concentrations is 2,4-D (Breeze and co-workers from 1987-1992). For thereferences see Kempenaar et al. 1998. The lowest-observed-effect concentrations derived from thevarious experiments by Breeze et al. (Table 5) are shown in Figure 1. A power trend line was drawn toindicate the expected borderline between effective and non-effective exposure concentrations. Twoadditional points are shown indicating the atmospheric concentration of 2,4-D of 13 500 ng m-3
measured by Grover (1989), which far exceeds the effect concentration and a concentration of 0.8 ngm-3 measured by Baas & Duyzer (1997), which would not be expected to cause negatives effects.Clearly, more data is required to establish a more reliable effect concentration line.
0.1
1
10
100
1000
10000
100000
1 10 100
Time (h)
Vapo
ur c
once
ntra
tion
(ng
m-3)
Figure 1. Lowest observable effect concentrations (LOEC) for vaporised 2,4-D (from Kempenaar et al., 1998). Apower trend line indicates the relationship between exposure duration and LOEC. The two extreme 24 hmean concentrations taken from Table 5 are indicated by (from Grover, 1989) and (from Baas &Duyzer, 1997).
5.3 Assessment of risks of vapour phase herbicidesSimilar trend lines for other herbicides, even if no more reliable than that for 2,4-D, would providemore insight into vapour phase herbicidal toxicity and the assessment of risks to non-target plants.However, as they are not available, the highest observed 24 h means vapour concentrations of thevarious herbicides in Table 5 were plotted against the trend line for 2,4-D and are shown in Figure 2.The concentrations all refer to 24 h mean values and indicate that the large majority of measurements

21
taken within 10 km from the source field sprayed remain above the trendline, meaning that they exceedthe effective concentration. In the case of measured herbicide at more than 10 km from the point source,three of the six observed herbicide concentrations exceed
0.1
1
10
100
1000
10000
1 10 100
Time (h)
Vapo
ur c
once
ntra
tion
(ng
m-3)
Figure 2. The highest observed 24 h mean concentrations of various herbicides (from Table 5) on sites 0.1 – 10 km(�) or more than 10 km ( ) from sprayed fields. The power trend line indicates the relationship betweenexposure duration and the LOEC for 2,4-D. The different symbols are shown next to each other forclarity sake. (from Kempenaar et al. 1998).
0.1
1
10
100
1 10 100 1000
Time (h)
Vapo
ur c
once
ntra
tion
(ng
m-3)
Figure 3. The maximum monthly mean concentrations of herbicides measured in the Netherlands in 2000-2001(Table 6) in relation to the effect concentration for 2,4-D. The power trend line indicates the relationshipbetween exposure duration and the LOEC for 2,4-D.
the effect concentration as well. Thus, at considerable distances from fields sprayed with herbicides, apotential risk to plants is suggested.If the effect concentration for 2,4-D can be considered as an indication of general herbicide toxicity,then the limited amount of data on herbicidal vapours in general suggest a risk for plants.

22
During the years 2000 and 2001, the maximum monthly concentrations measured in the Netherlandsby TNO-MEP (see also Table 6) were plotted against the expected borderline between effective andnon-effective concentrations for 2,4-D (Fig. 3). They are given as mean monthly concentrations and fallabove the effect concentration for 2,4-D and thus suggest a risk for plants. The monthly concentrationsunder-estimate the toxicity of the herbicide vapour phase concentrations. During a month ofcumulative sampling, the peak concentrations are averaged out and the effects of short-term (hours todays) exposures are masked. However, even these maximum monthly means are well above theeffective concentration for 2,4-D, again, given that the toxicity of 2,4-D is representative for the toxicityof other herbicides.The use of the trendline for 2,4-D for other herbicides is debatable of course, but it does provide someidea of the potential toxicity of these herbicides.
When more data on effect concentrations and long-term mean atmospheric concentrations becomeavailable, another approach might be used to assess risks for plants. Given both effect concentrationsand mean atmospheric concentrations, the distance from a point source of herbicide emission (sprayedfield) might be estimated with the following principles.
Concentrations of emitted gaseous components at increasing distances from the source follow a similargeneral pattern, and this pattern is applicable to most gaseous emissions (J. Duyzer, pers. comm.). Thisrelationship holds for a known source concentration, which diminishes with increasing distance fromthe source. Figure 4 shows a hypothetical example given of a field (1 ha) from which a gaseouscomponent (herbicide) is emitted at a rate of 0.01 g s-1. This emission rate may be viewed as a worstcase example in which the total amount of evaporated herbicide is emitted at one time.
0.0000
0.0001
0.0010
0.0100
0.1000
1.0000
10.0000
100.0000
0 2000 4000 6000 8000 10000 12000
Distance (m)
Vapo
ur c
onc
(ng
m-3)
Figure 4. Atmospheric concentration of a chemical component (herbicide) emitted at 0.01 g s-1 from a 1 ha source inrelation to distance from the source.
The exposure of a herbicide in vapour phase is determined by its concentration and the duration plantsare exposed to it (exposure = c x t). Thus plants closer to the source (highest concentration) are likelyto experience the highest exposure, as can be seen in Figure 4. The concentration diminishes rapidly atfirst, and then more gradually until it reaches a long-term mean concentration. Because the emissionrates of vaporised herbicides at a point source (considering a field of 1 to possibly 10 ha as a pointsource) are often unknown, the calculation might be attempted in the other direction. As the emissionpattern is generally applicable to gaseous compounds, one might thus begin from a long-term meanconcentration and proceed towards the source. A realistic NOEC must be known in order to estimatethe distance from the source at which non-target plants are exposed to a risk of the vapour phase

23
herbicide and for a few herbicides is an (no) effect concentration known. Assuming the backgroundconcentration to have been reached at a distance of 10 km from the source, the distance at which theNOEC would be reached can be estimated from Figure 4. The results are given in Table 9.
Table 9. The distance from a source of herbicide emission (a sprayed field) at which plants might be adverselyaffected.
Herbicide NOEC(ng m-3)
Background concentration(ng m-3)
Distance from source(m)
chlorpropham 77000 25 <100ethofumesate 75 1 4002,4-D 0.1-100 0.8 500fluroxypyr 5 0.6 3000
From the scarce amount of data available it can be concluded that for the 4 herbicides given, theirpotential for adversely affecting non-target plants varies in distance from the source (a sprayed field)from less than 100 m to 3 km (Table 9). Given more data on effective concentrations and measuredatmospheric concentrations, more accurate estimations of the distance from a sprayed field at whichnon-target plant species may be at risk of injury from vapour phase herbicides may be be realised.

24

25
6. Conclusions
1. The toxicity of vapour phase herbicides cannot be directly related to their toxicity in liquid phase,nor can it be related to their rate of vaporisation.
2. Data on atmospheric concentrations, effects and effect concentrations of herbicides is very scarceand was found for only three herbicides used in the Netherlands, i.e. fluorxypyr, ethofumesate andchlorpropham.
3. NOECs have been calculated for fluorxypyr (5 ng m-3), ethofumesate (75 ng m-3) andchlorpropham (77 000 ng m-3), while that for 2,4-D ranges from 1-100 ng m-3.
4. Non-target plant species are expected to be at risk from vaporised herbicides at distances up to3 km from sprayed fields.

26

27
7. References
Anonymous, 1999.Gewasbeschermingsgids. Plantenziektenkundige Dienst, Wageningen.
Anonymous, 2002.Emissie-evaluatie MJP-G 2000. Achtergronden en berekeningen van emissies vangewasbeschermingsmiddelen. (D.S. De Nie, redactie). RIVM rapport 716601004. Bilthoven. 159p.
Baas, J. & D.J. Bakker, 1996.Blootstelling aan pesticiden. TNO-MEP rapport R96/313. TNO-Milieu, Energie enProcesinnovatie, Apeldoorn
Baas, J. & J.H. Duyzer, 1997.Pesticidenconcentraties in lucht en regenwater. TNO-MEP rapport R97/113, Apeldoorn.
Breeze, V.G. & C.J. West, 1987a.Long-term and short-term effects of vapor of the herbicide 2,4-D butyl on the growth of tomatoplants. Weed Res. 27:13-21.
Breeze, V.G.& A.T. Fowler, 1992.Antagonistic effects of simultaneous exposure to sulphur dioxide gas and vapour of the herbicide2,4-D iso-octyl on the carbon exchange of tomato and field bean plants. New Phytol. 120:389-396.
Breeze, V.G.& C.J. West, 1987b.Effects of 2,4-D butyl on the growth of six crop species. Ann. Appl. Biol. 111:185-191.
Breeze, V.G.& E. van Rensburg, E. 1991.Vapour of the free acid of the herbicide 2,4-D is toxic to tomato and lettuce plants. Environ.Pollut. 72:259-267.
Breeze, V.G.& E. van Rensburg, E. 1992.Uptake of the herbicide (14C) 2,4-D iso-octyl in the vapour phase by tomato and lettuce plantsand some effects on growth and phytotoxicity. Ann. Appl. Biol. 120: 493-500.
Breeze, V.G., 1988.Growth of tomato plants following exposure to fluorxypyr vapor. Weed Research 28:297-301.
Breeze, V.G., 1993a.Plant uptake and phytotoxicity of herbicide vapour. 8th EWRS Symposium ‘Quantitativeapproaches in weed and herbicide research and their practical application’, Braunschweig,p407-414.
Breeze, V.G., 1993b.Phytotoxicity of herbicide vapor. Rev. Environ. Contam.Toxicol. 132:29-54.
CBS, 1998.Landbouwtellingen 1998. Centraal Bureau voor de Statistiek 1998. Rijswijk. Digitaal Bestand.
CTB, 2001.College voor de Toelating van Bestrijdingsmiddelen (http://www.ctb-wageningen.nl/).
De Jong, F.M.W., E. van der Voet & K.J. Canters, 1995.Possible side effects of airborne pesticides on fungi and vascular plants in the Netherlands.Ecotoxicol. and Environ. Saf. 30:77-84.
Franzaring, J., C. Kempenaar & L.J.M. van der Eerden, 2001.Effects of vapours of chlorpropham and ethofumesate on wild plant species. Environ. Pollut.114:21-28.
Gezondheidsraad, 2000.Atmospherische verspreiding van gewasbeschermingsmiddelen: een ecologische risico-evaluatie.Gezondheidsraad publicatie nr. 2000/03, Den Haag. 88p.
Grover, R., 1989.Magnitude and source of airborne resisudes of herbicides in Saskatchewan. In: Principles of Healthand Safety in Agriculture. (J.A. Dosman & D.W. Cockcroft, eds). pp 222-225. CRC Press, Boca RaonFlorida, USA.
Holter-man, H.J., 2003.Kalibratie van het drift model IDEFICS. IMAG-rapport (in press).

28
Kempenaar, C., A.E.G. Tonneijck & L.J.M. van der Eerden, 1998.Exposure of non-target plants to pesticides: a review on atmospheric concentrations and no-effectlevels with special attention for herbicide vapours. AB-DLO nota 105, Wageningen. 19p.
Kempenaar, C., C.J. van Dijk, A.J.M. Uffing, A.E.G. Tonneijck, E.H. Nijhuis & P.J.J. Pikaar, 1999.Effects of herbicide vapours on plants. AB-DLO nota 189, Wageningen. 11p.
Klepper, O., T. Jager, T. van der Linden & R. Smit, 1998.An assessment of the effect on natural vegetations of atmospheric emissions and transport ofherbicides in the Netherlands. Internal ECO-memo 98/05, Laboratory of Ecotoxicology, RIVM,Bilthoven, The Netherlands. 34p.
Van Rensburg, E. & V.G. Breeze, 1990.Uptake and development of phytotoxicity following exposure to vapour of the herbicide 14C 2,4-D butyl by tomato and lettuce plants. Environ. Exp. Bot. 30:405-414.
Wijnands, F.G. & P. van Asperen, 1999.Milieubelasting verminderen door gerichte middelenkeuze. Emissie in beeld gebracht. PAV-Bulletin Akkerbouw, juni 1999. pp 28-37.

I - 1
Appendix I.Herbicides used in the Netherlands in 1998(CTB, 2001)

I - 2
Herbicide kg y-1 Herbicide kg y-1
1 MCPA 676348 51 trinexapac-ethyl 23542 metamitron 155099 52 lenacil 17373 atrazine* 104748 53 haloxyfop-P-methylester 16024 glyphosate 104416 54 triflusulfrron-methyl 14665 diquat dibromide 83738 55 ethephon 13606 chlormequat (chloride) 83117 56 cycloxydim 13137 metolachlor* 82776 57 chlorbromuron 12568 prosulfocarb 76937 58 clopyralid 12439 mecoprop-P* 75244 59 sethoxydim* 1214
10 isoproturon 65966 60 diflufenican 118011 chloridazon 61931 61 fluazifop-P-butyl 114212 propachlor* 61721 62 mineraal oil 109813 pyridate 58519 63 isoxaflutole 109514 bentazone 54797 64 EPTC 108115 chlorpropham 53018 65 fenoxaprop-P-ethyl 71316 ethofumesate 50527 66 prometryn 71117 sulcotrion 37653 67 dichlorprop-P 70118 phenmedipham 36248 68 dichlobenil 67819 metribuzin 30848 69 rimsulfuron 64220 metoxuron* 28567 70 quizalofop-P-ethyl 61221 maleine hydrazide 20983 71 amidosulfuron 60022 bifenox 19072 72 clodinafop-propargyl 49323 buminafos 17734 73 desmetryn 49324 DNOC* 17592 74 benazoline 27425 paraquat-dichloride 17124 75 gibberellic acid A3 21126 linuron 17023 76 cloquintocet-mexyl 12327 monolinuron 14684 77 1-nafthaleneacetic acid 9228 asulam 14121 78 gibberellic acid A4+A7 6829 fluroxypyr 14118 79 indol-3-butyric acid 3030 glyphosate-trimesium 12089 80 borax 2731 metobromuron 12085 81 3-indolylacetic acid 2432 dinoterb 11612 82 triclopyr 1733 diuron 10002 83 propaquizofop 1134 simazine* 9833 84 paclobutrazol 635 tri-allate 7851 85 bromacil 036 daminozide 7807 86 chlortoluron 037 pendimethalin 7512 87 cinidon-ethyl 038 propyzamide 6542 88 clomazone 039 ioxynyl 6396 89 cresoot/cresol 040 glufosinate-ammonium 5962 90 dimethenamide 041 bromoxynil 5179 91 ferri-phosphate 042 dicamba 4969 92 ferrosulphate 043 aclonifen 4062 93 florasulam 044 carbetamide 3670 94 imazamethabenz-methyl 045 metsulfuron-methyl 3575 95 mesotrione 046 terbutylazine 3305 96 metam-natrium 047 metazachlor 3115 97 nicosulfuron 048 2,4-D 2929 98 paraffine oil 049 amitrol 2911 99 quinmerac 050 desmedipham 2760 100 S-metolachlor 0
* not approved
II - 1
Appendix II.Herbicides emitted in the Netherlands(Anon., 2002)

II - 2
Herbicide kg y-1 Herbicide kg y-1
1 mineral oil 75024 51 glufosinate-ammonium 3382 mecoprop-P* 37951 52 cresoot/cresol 3243 propachlor* 31031 53 triclopyr 3064 MCPA 29779 54 dimethenamide 2735 metoxuron* 24411 55 carbetamide 2196 glyphosate 19320 56 nicosulfuron 2167 2,4-D 13708 57 S-metolachlor 1878 bentazone 13361 58 haloxyfop-P-methylester 1249 chlormequat (chloride) 10830 59 desmedipham 120
10 metam-natrium 9913 60 fenoxaprop-P-ethyl 7911 diquat dibromide 9498 61 clodinafop-propargyl 5612 chlorpropham 8893 62 quizalofop-P-ethyl 3413 metamitron 7063 63 isoxaflutole 2814 ethofumesate 6244 64 triflusulfuron-methyl 2615 monolinuron 5743 65 rimsulfuron 2116 linuron 5563 66 cinidon-ethyl 1517 pendimethalin 5178 67 metsulfuron-methyl 1218 isoproturon 5021 68 amidosulfuron 10.619 asulam 4856 69 1-naftyaleneacetic acid 10.420 glyphosate-trimesium 4678 70 indol-3-butyric acid 1.421 dichlobenil 4537 71 gibberellic acid A3 122 prosulfocarb 4392 72 paclobutrazol 123 bifenox 3785 73 3-indolylacetic acid 0.0424 bromoxynil 3727 74 atrazine* 025 metolachlor* 3548 75 benazoline 026 chloridazon 3459 76 bromacil 027 terbutylazine 3038 77 buminafos 028 cycloxydim 2842 78 chlorbromuron 029 dicamba 2718 79 chlortoluron 030 pyridate 2354 80 clomazone 031 sulcotrion 1882 81 desmetryn 032 maleine hydrazide 1807 82 dichlorprop-P 033 trinexapac-ethyl 1765 83 dinoterb 034 paraquat-dichloride 1763 84 diuron 035 simazine* 1607 85 DNOC* 036 ioxynyl 1567 86 EPTC 037 phenmedipham 1564 87 ferri-phosphate 038 fluroxypyr 1553 88 ferrosulphate 039 metribuzin 1285 89 gibberelllic acid A4+A7 040 amitrol 1160 90 lenacil 041 metazachlor 957 91 prometryn 042 metobromuron 920 92 propaquizofop 043 fluazifop-P-butyl 708 93 quinmerac 044 tri-allate 700 94 sethoxydim* 045 daminozide 646 95 borax46 ethephon 639 96 cloquintocet-mexyl47 clopyralid 601 97 florasulam48 propyzamide 510 98 imazamethabenz-methyl49 aclonifen 453 99 mesotrione50 diflufenican 412 100 paraffine oil
* not approved

III - 1
Appendix III.Exposure risk index (Blootstelling risicoindex, BRI) based on the amounts ofherbicides used in the Netherlands in 1998

III - 2
Herbicide kg y-1 Herbicide kg y-1
1 metolachlor* 29799 51 sethoxydim* 122 propachlor* 29317 52 carbetamide 113 MCPA 16909 53 amitrol 74 metoxuron* 11427 54 metsulfuron-methyl 75 chlormequat (chloride) 9351 55 ethephon 76 mecoprop-P* 6772 56 dichlorprop-P 47 daminozide 4747 57 diflufenican 48 bentazone 3945 58 haloxyfop-P-methylester 29 monolinuron 3671 59 rimsulfuron 210 metribuzin 3239 60 cycloxydim 111 prosulfocarb 3077 61 triclopyr 112 tri-allate 2983 62 clodinafop-propargyl 113 atrazine* 2619 63 fenoxaprop-P-ethyl 0.514 dinoterb 2206 64 desmedipham 0.415 pendimethalin 1502 65 quizalofop-P-ethyl 0.316 2,4-D 1391 66 cloquintocet-mexyl 0.117 dicamba 1193 67 benazolin 0.118 metamitron 1086 68 propaquizofop 0.019 ethofumesate 970 69 paclobutrazol 0.020 asulam 847 70 1-naftylaleneacetic acid 021 diquat dibromide 837 71 3-indolylacetic acid 022 bifenox 475 72 indol-3-butyric acid 023 linuron 426 73 amidosulfuron 024 metobromuron 302 74 borax 025 glyphosate-trimesium 290 75 bromacil 026 chloridazon 266 76 buminafos 027 terbutylazine 248 77 chlorpropham 028 ioxynyl 192 78 chlortoluron 029 glyphosate 188 79 cinidon-ethyl 030 pyridate 176 80 clomazone 031 paraquat-dichloride 171 81 cresoot/cresol 032 isoproturon 165 82 dimethenamide 033 propyzamide 164 83 DNOC* 034 aclonifen 122 84 ferri-fosphate 035 diuron 80 85 ferrosulphate 036 metazachlor 78 86 florasulam 037 bromoxynil 78 87 gibberellic acid A3 038 clopyralid 62 88 gibberellic acid A4+A7 039 simazine* 49 89 imazamethabenz-methyl 040 maleine hydrazide 47 90 isoxaflutole 041 glufosinate-ammonium 45 91 mesotrione 042 dichlobenil 43 92 metam-natrium 043 prometryn 37 93 mineraal oil 044 chlorbromuron 31 94 nicosulfuron 045 fluroxypyr 28 95 paraffine oil 046 phenmedipham 22 96 quinmerac 047 fluazifop-P-butyl 21 97 S-metolachlor 048 EPTC 19 98 sulcotrion 049 desmetryn 18 99 triflusulfuron-methyl 050 lenacil 14 100 trinexapac-ethyl 0
* not approved