Embed Size (px)
Citation preview

This work is subject to copyright. All rights are reserved, whether whole or part of the material is concerned, specifically the rights of reproduction, reprinting, re-use of illustrations and storage in data banks. No part of this publication may be reproduced without the prior permission of swissQuant Group AG, Zurich, Switzerland.
Risks Involved with Systematic Investment Strategies
Lectures in Entrepreneurial Leadership, ETH Zurich, D-MTEC, February 5, 2008Dr. Gabriel Dondi ([email protected])
SIMC

2swissQuant Group AG | www.swissquant.ch

3swissQuant Group AG | www.swissquant.ch
When developing and investing in a Systematic Investment Strategy there are particular issues that are to be addressed inaddition to the financial risk and return
For a Systematic Investment Strategy that relies on models or predefined rules and on the assessment of the market environment in order to derive investment decisions the issues are:
Robustness of the models against slow or sudden changes of the environment
Availability of measures to identify the prevailing environment and to monitor the quality of the models and their robustness in this environment
Availability of trigger levels that allow to define actions that are to be taken once these levels have been reached, before the model’s quality has become insufficient
Ability of the models themselves to identify changes in the environment and to adjust their own model parameters in case the environment has changed
A Systematic Investment Strategy needs to be consistently monitoring its environment and itself in order to be viable for the long term

4swissQuant Group AG | www.swissquant.ch
Agenda
Introduction
Preeminent risks of Systematic Investment Strategies
Challenge Loop for Systematic Investment Strategies
Implementation and Conclusion
5swissQuant Group AG | www.swissquant.ch
Definitions of a Systematic Investment Strategy
A Systematic Investment Strategy is characterised by the exclusive use and reliance on defined rule sets and/or mathematical models
The rule sets and mathematical models are designed to be employed without discretionary input by an investment manager
The Systematic Investment Strategy is generally designed to operate under certain, predefined market conditions
The robustness of the Systematic Investment Strategy is a measure for the region of the market conditions under which the strategy may operate stable
The risks involved with Systematic Investment Strategies are not only of financial nature but there are substantial additional risks

6swissQuant Group AG | www.swissquant.ch
Stylized Facts
Key Success Factors for Portfolio OptimizationAccurate measurement of idiosyncratic risks
Robust modeling of asset-dependence, also for the extreme caseAvoidance of the constraint satisfaction case
Choice of suitable risk measureAwareness of over-optimization
Risk and Performance Attribution
Equities• Volatility is dynamic
and appears in clusters
• Returns exhibit extreme-events and heavy-tails
• Correlations are dynamic
BondsThe five major risks:
• Migration and Default Risk
• Recovery Risk• Spread Risk• Liquidity Risk• Market Risk
FX• FX overlays and
alpha trading• No buy and hold• Volatility is dynamic• Trading is usually
supported by quantitative models
Hedge Funds• Large spectrum of
quantitative properties
• Time-varying exposure to traditional assets
• Key success factor: quantitative and qualitative due diligence

7swissQuant Group AG | www.swissquant.ch
The architecture for a Systematic Trading Strategy is based on independent elements performing specialised tasks, each generating a part of overall performance
Construction Loop
ReturnPredictor
e.g., AdaptiveFactorModel
ReturnPredictor
e.g., AdaptiveFactorModel
RiskPredictor
e.g.,DCC-TARCHValue-at-Risk
Expected ShortfallReturn Distributions
RiskPredictor
e.g.,DCC-TARCHValue-at-Risk
Expected ShortfallReturn Distributions
AssetAllocator
e.g., Optimizer
Trading Signal,Stop-Loss
AssetAllocator
e.g., Optimizer
Trading Signal,Stop-Loss
Information Universe
Investment Universe
Implemented trades
Data Filter
8swissQuant Group AG | www.swissquant.ch
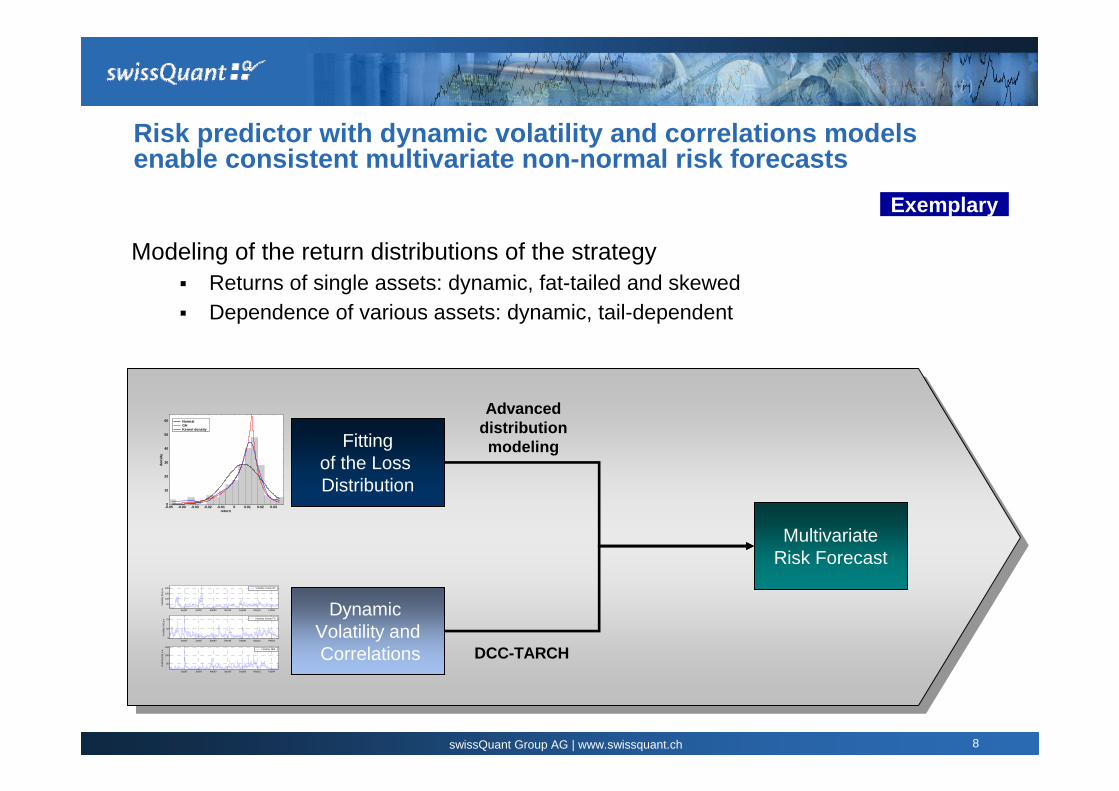
Risk predictor with dynamic volatility and correlations models enable consistent multivariate non-normal risk forecasts
Modeling of the return distributions of the strategyReturns of single assets: dynamic, fat-tailed and skewed Dependence of various assets: dynamic, tail-dependent
MultivariateRisk Forecast
Advanced distribution modeling
DCC-TARCH
-0.05 -0.04 -0.03 -0.02 -0.01 0 0.01 0.02 0.030
10
20
30
40
50
60
return
dens
ity
NormalGHKernel density
Sep87 Jun90 Mar93 Dec95 Sep98 May01 Feb04
50
100
150
200
Vol
atili
ty [%
] p.a
.
Sep87 Jun90 Mar93 Dec95 Sep98 May01 Feb045
10
15
Vol
atili
ty [%
] p.a
.
Sep87 Jun90 Mar93 Dec95 Sep98 May01 Feb04
50
100
150
Vol
atili
ty [%
] p.a
.
Volatility Crude Oil
Volatility Bonds FX
Volatility IBM
Fittingof the Loss Distribution
Dynamic Volatility andCorrelations
Exemplary
9swissQuant Group AG | www.swissquant.ch
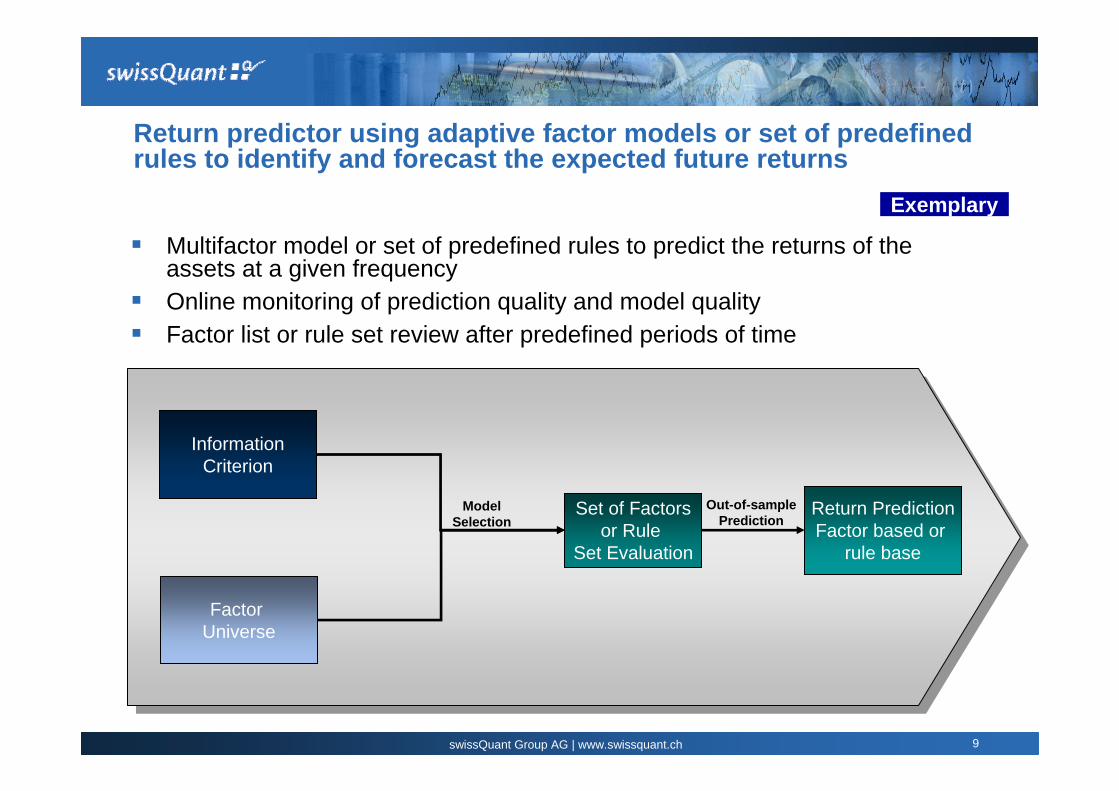
Return predictor using adaptive factor models or set of predefined rules to identify and forecast the expected future returns
Multifactor model or set of predefined rules to predict the returns of the assets at a given frequency Online monitoring of prediction quality and model qualityFactor list or rule set review after predefined periods of time
Set of Factorsor Rule
Set Evaluation
Return PredictionFactor based or
rule base
ModelSelection
InformationCriterion
Factor Universe
Out-of-samplePrediction
Exemplary

10swissQuant Group AG | www.swissquant.ch
The elements of the Systematic Investment Strategy each individually are performance generators and their individual performance is monitored against overall Strategy performance
Return predictor is measured against long only allocation in order to monitor the performance derived from correct prediction of the direction of the returns
Asset allocator is measured against equally weighted allocation in order to monitor the performance derived from correct allocation decisions
11swissQuant Group AG | www.swissquant.ch
Agenda
Introduction and Definitions
Preeminent risks of Systematic Investment Strategies
Challenge Loop for Systematic Investment Strategies
Implementation and Conclusion

12swissQuant Group AG | www.swissquant.ch
In addition to financial risks there are several risks specific to Systematic Trading Strategies that have an impact on the viability of the strategy
Preeminent risks
Model risk
Stability/Robustness risk
Solvability risk (of mathematical models)
Implementability risk
Data quality risks
Examples
Volatility model choice
Parameter significance
Optimisation outcome
Scalability and liquidity
Availability and revision of data

13swissQuant Group AG | www.swissquant.ch
Model risk is to be monitored by verification of the stylised facts on which the model is based on and by ensuring the significance of the model parameters
Example: Risk forecast is calculated by means of a Value at Risk model. If a dynamic model has been chosenwhich is based on the stylised fact of autocorrelation of squared returns the model is to be monitored
In order for the risk forecast to be valid, a significant autocorrelation of squared returns is to be measured
Once the model for the risk forecast has been fitted to the data, the model parameter’s significance is evaluated
With a validated model the risk forecast can be used
S&P500 data (1999-2007): serial correlations of squared returns
Choice of VaR Model: Standard Model vs. Dynamic for a Stock
GA FP Equity (1.1.07-19.12.07)

14swissQuant Group AG | www.swissquant.ch
Robustness of the model is to be evaluated by varying the model´s parameters and evaluating the subsequent variation in the performance of the overall strategy
0.20 0.29 0.36 0.46 0.54 0.62 0.71 0.80 0.88 0.950.20
0.29
0.36
0.46
0.54
0.62
0.71
0.80
0.88
0.95Stability Map
1
16
32
47
62
77
0.20 0.29 0.36 0.46 0.54 0.62 0.71 0.80 0.88 0.950.20
0.29
0.36
0.46
0.54
0.62
0.71
0.80
0.88
0.95Performance Map
-10
-8
-6
-4
-2
0
2
4
Example: Trend detection based on a pair of exponentiallyweighted moving averages is used to invest in the direction of the detected trend
In order for the strategy to be viable the choice of parameters of the exponentially moving averages is to be verified
a) The evaluation of the obtained performance for various pairs of parameter settings allows to identify the settings needed for highest performance (see Performance Map)
b) The stability is determined by trading off the performance of a given point and the change of performance to the neighbouring points (see Stability Map)
With a validated stability of the parameters the trend detection with exponentially weighted moving averages can be used

15swissQuant Group AG | www.swissquant.ch
Data integrity is to be monitored with regard to data availability and retrospective changes and revisions of historical data
31 2
Unreliable Data (contaminated with future information)
Mixture between contaminated and reliable data
Reliable datawindow too short to prove models with statistical significance
NA
V (0
1.07
.200
2=1)
Data integrity is particularly filtered when used for backtesting
Data integrity is monitored by the data filter on a day-to-day routine
16swissQuant Group AG | www.swissquant.ch
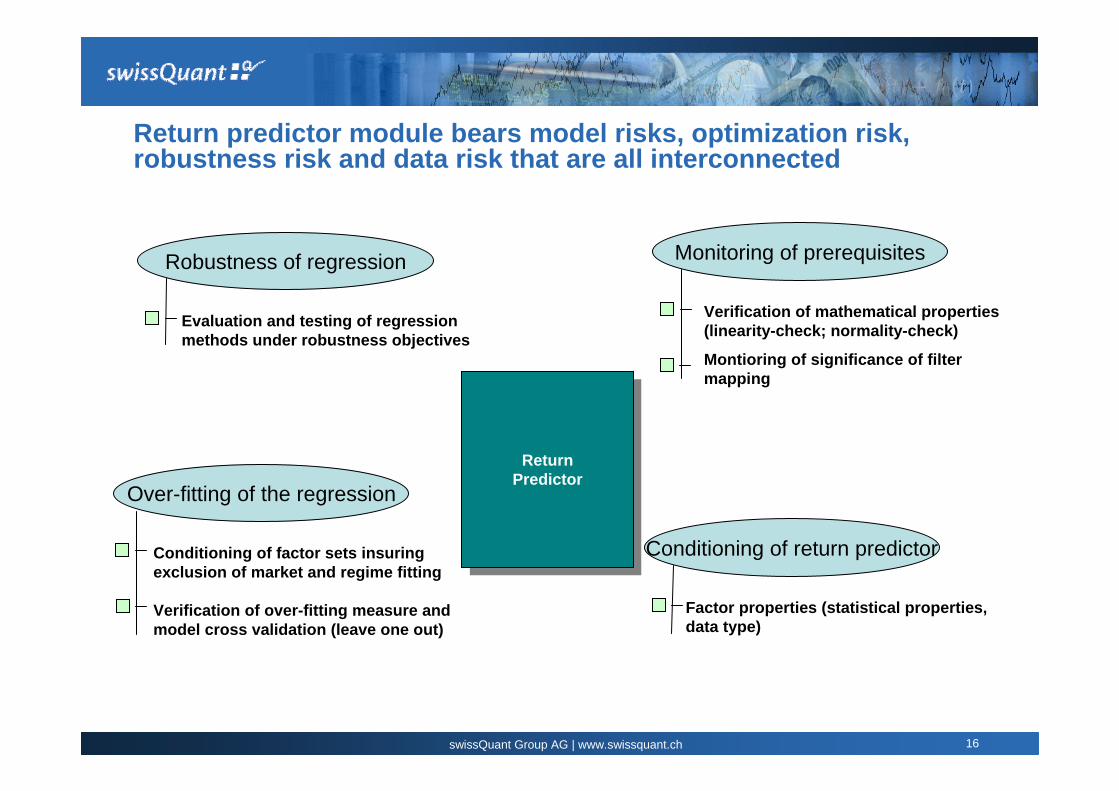
Return predictor module bears model risks, optimization risk, robustness risk and data risk that are all interconnected
ReturnPredictorReturn
Predictor
Robustness of regression
Evaluation and testing of regression methods under robustness objectives
Over-fitting of the regression
Conditioning of factor sets insuring exclusion of market and regime fitting
Verification of over-fitting measure and model cross validation (leave one out)
Monitoring of prerequisites
Verification of mathematical properties(linearity-check; normality-check)
Montioring of significance of filter mapping
Conditioning of return predictor
Factor properties (statistical properties, data type)
17swissQuant Group AG | www.swissquant.ch
Agenda
Introduction and Definitions
Preeminent risks of Systematic Investment Strategies
Challenge Loop for Systematic Investment Strategies
Implementation and Conclusion
18swissQuant Group AG | www.swissquant.ch
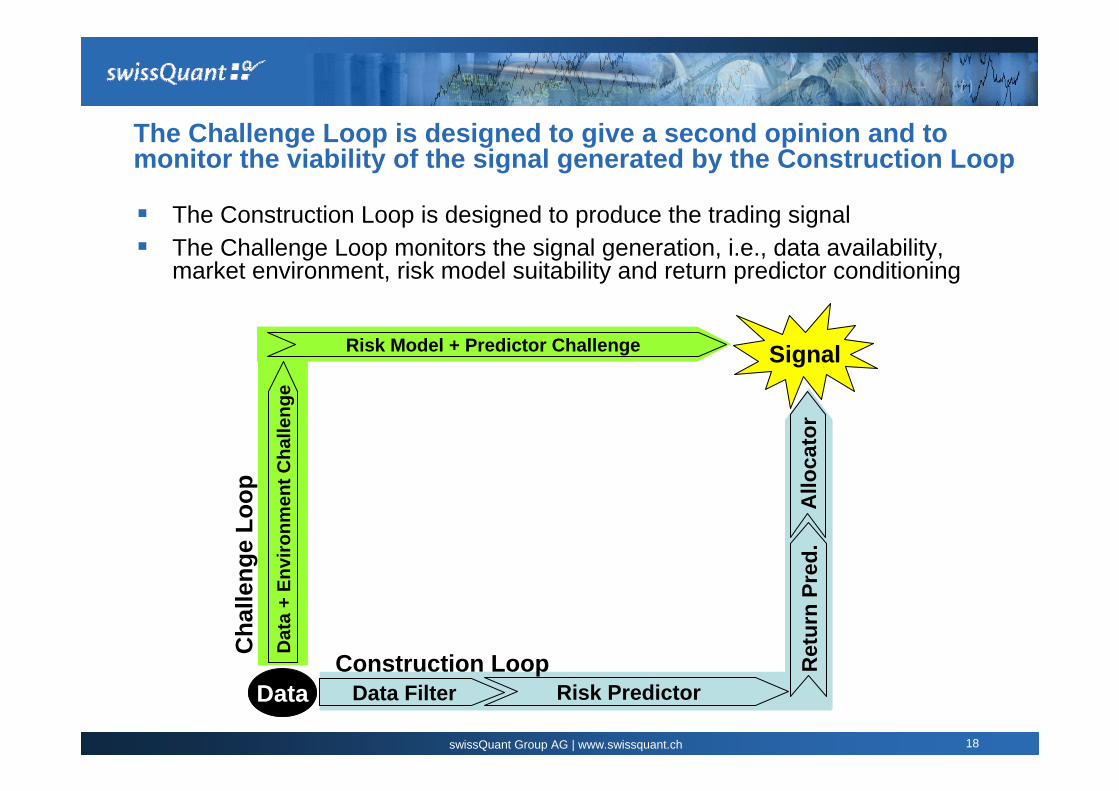
The Challenge Loop is designed to give a second opinion and to monitor the viability of the signal generated by the Construction Loop
The Construction Loop is designed to produce the trading signalThe Challenge Loop monitors the signal generation, i.e., data availability, market environment, risk model suitability and return predictor conditioning
Data Data Filter Risk Predictor
Ret
urn
Pred
.A
lloca
tor
Signal
Construction Loop
Cha
lleng
e Lo
opD
ata
+ En
viro
nmen
t Cha
lleng
e
Risk Model + Predictor Challenge
19swissQuant Group AG | www.swissquant.ch
In order to overcome the slowness of statistical measures the Challenge Loop analyses are designed to keep the time until any issues are detected a short as possible
The major issue of the Challenge Loop is instantaneous detection of data issues, model deficits or insufficient mathematical conditioning
The outcome of the model itself is to be measured with statistical measures
Statistical measures need a certain amount of data in order to be calculated, let alone be significant
In case of a model deficit there therefore may be a major time lag between it appearing and it being noticed by monitoring the outcome
Challenge loop depends on improved instantaneity of measures

20swissQuant Group AG | www.swissquant.ch
In addition to financial risks there are several risks specific to Systematic Investment Strategies that have an impact on the viability of the strategy
Challenge Loop
Allocation monitoring
Performance monitoring
Regime monitoring
Risk violation monitoring
Examples
Balanced Diversification
Balanced Perf. Contribution
Prediction quality
VaR Violation Monitoring

21swissQuant Group AG | www.swissquant.ch
Allocation and performance attribution are monitored over both, long periods and also short time horizons in order to deliver a clearer picture
For the analysis of the properties of the average allocations and the performance attribution long term and instantaneous measures are used in parallelThe instantaneous measures serve as an instant pointer to any potential model insufficiencies, the long term averages show a more stable view and therefore point to design deficits
Index 1Index 2Index 3Index 4Index 5Index 6
Example 1: Asset Allocation 1 day and average 20 days Example 2: Performance per Market Performance per Market
Inde
x 1In
dex 2
Inde
x 3In
dex 4
Inde
x 5In
dex 6
Inde
x 7

22swissQuant Group AG | www.swissquant.ch
Prediction quality measures enable monitoring of model quality and model’s ability to adapt throughout changing market regimes
30 40 50 60 70 800.005
0.01
0.015
0.02
0.025
0.03
0.035
0.04
Qd
Vola
tilitä
t
Prediction quality is lower in high volatility regimes. Visualisation of most recent outcomes of the model (orange dots) indicates the model adaptability to regime changes
High VolatilityLow Pred. Quality
Low Volatility High Pred.
Quality
90%
10%
Vola
tility
p.d
. [%
]
Prediction quality Qd [%](Qd: Percentage of correct direction predictions)
Directional quality indicates the amount of correctly predicted directions over the past number of days. Challenge Loop monitors directional quality and stops signal or prompts manager to take action if it is below target level
23swissQuant Group AG | www.swissquant.ch
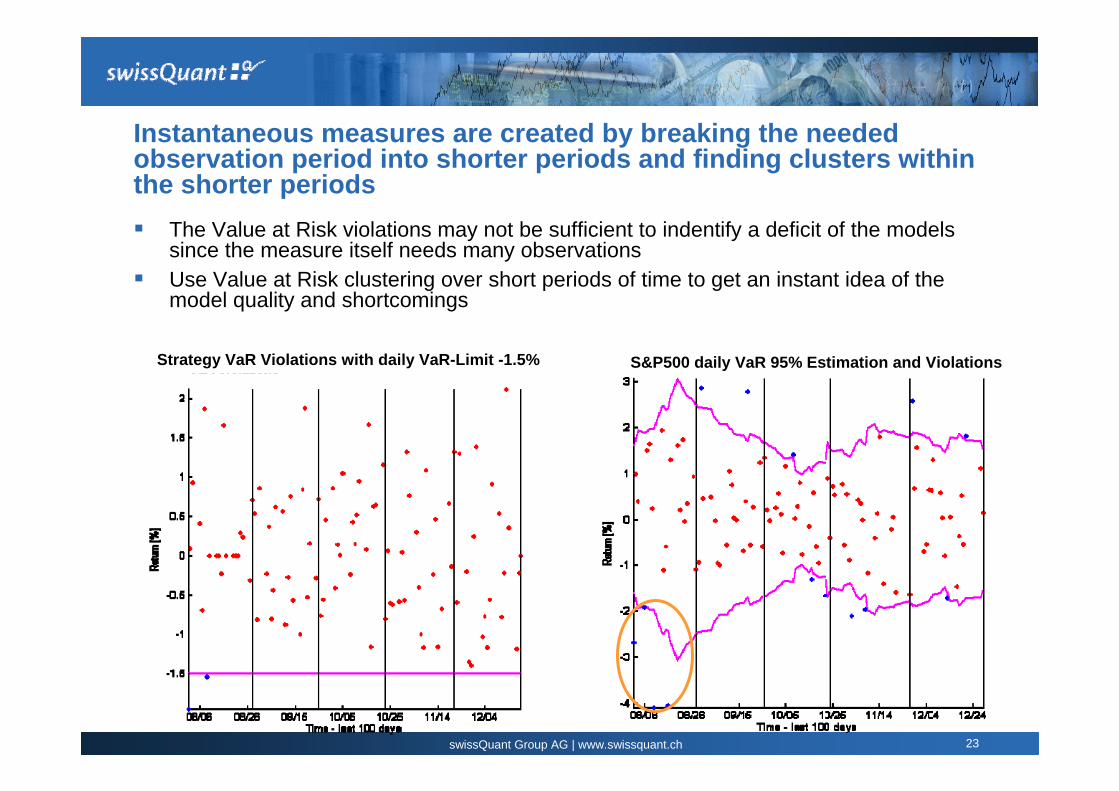
Instantaneous measures are created by breaking the needed observation period into shorter periods and finding clusters within the shorter periods
The Value at Risk violations may not be sufficient to indentify a deficit of the models since the measure itself needs many observationsUse Value at Risk clustering over short periods of time to get an instant idea of the model quality and shortcomings
Strategy VaR Violations with daily VaR-Limit -1.5% S&P500 daily VaR 95% Estimation and Violations
24swissQuant Group AG | www.swissquant.ch
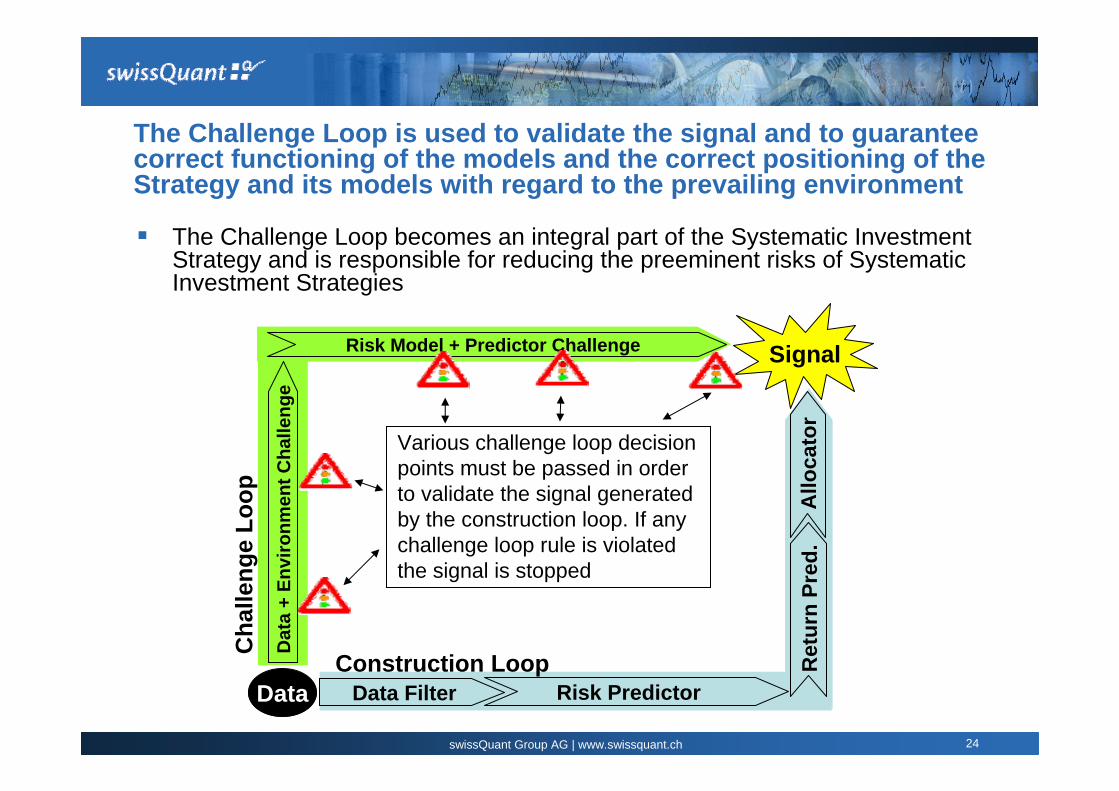
The Challenge Loop is used to validate the signal and to guarantee correct functioning of the models and the correct positioning of the Strategy and its models with regard to the prevailing environment
The Challenge Loop becomes an integral part of the Systematic Investment Strategy and is responsible for reducing the preeminent risks of Systematic Investment Strategies
Data Data Filter Risk Predictor
Ret
urn
Pred
.A
lloca
tor
Signal
Construction Loop
Cha
lleng
e Lo
opD
ata
+ En
viro
nmen
t Cha
lleng
e
Risk Model + Predictor Challenge
Various challenge loop decision points must be passed in order to validate the signal generated by the construction loop. If any challenge loop rule is violated the signal is stopped

25swissQuant Group AG | www.swissquant.ch
Agenda
Introduction and Definitions
Preeminent risks of Systematic Investment Strategies
Challenge Loop for Systematic Investment Strategies
Implementation and Conclusion

26swissQuant Group AG | www.swissquant.ch
Implementation of the Construction and Challenge Loops: Cockpit for Systematic Investment Strategies
Construction LoopCalculation of Trading Signal and Performance Monitoring
Challenge LoopModule by module check of basic assumptions and model integrity

27swissQuant Group AG | www.swissquant.ch
With the Challenge Loop the main issues of Systematic Investment Strategies relying on predefined rules and mathematical models are addressed
Robustness of the models against slow or sudden changes of the environment is monitored with robustness measures and instantaneous measures of the environment and the behaviour of the strategy in the prevailing environment
Measures to identify the prevailing environment are to be found based on the stylised facts of the models
Trigger levels are set in order for the Challenge Loop to be effective. Furthermore they are to be set to give the investment manager sufficient reaction time to take corrective measures before the Challenge Loop stops the signal from being accepted
Models using instantaneous quality measures are used to adapt as early as possible to new environments. If the model becomes invalid the signal is stopped by the Challenge Loop
The Challenge Loop is an instrument for consistently monitoring of the Systematic Investment Strategies environment and itself in order to ensure long term operation of the strategy

28swissQuant Group AG | www.swissquant.ch
Conclusions
There are several risks taken into account when using SystematicInvestment Strategies
A Systematic Investment Strategy needs an observation and challenging mechanism to identify any model outcome that was not intended
When combining the Construction Loop that derives the investment signals with an independent Challenge Loop that challenges the construction loop, the signal is verified by a second opinion before being implemented
Signal quality and confidence in the Systematic Investment Strategy is improved by systematically challenging the signal generation before implementing it
The Challenge Loop becomes an integral part of the Systematic Investment Strategy and is responsible for reducing the preeminent risks of Systematic Investment Strategies
29swissQuant Group AG | www.swissquant.ch
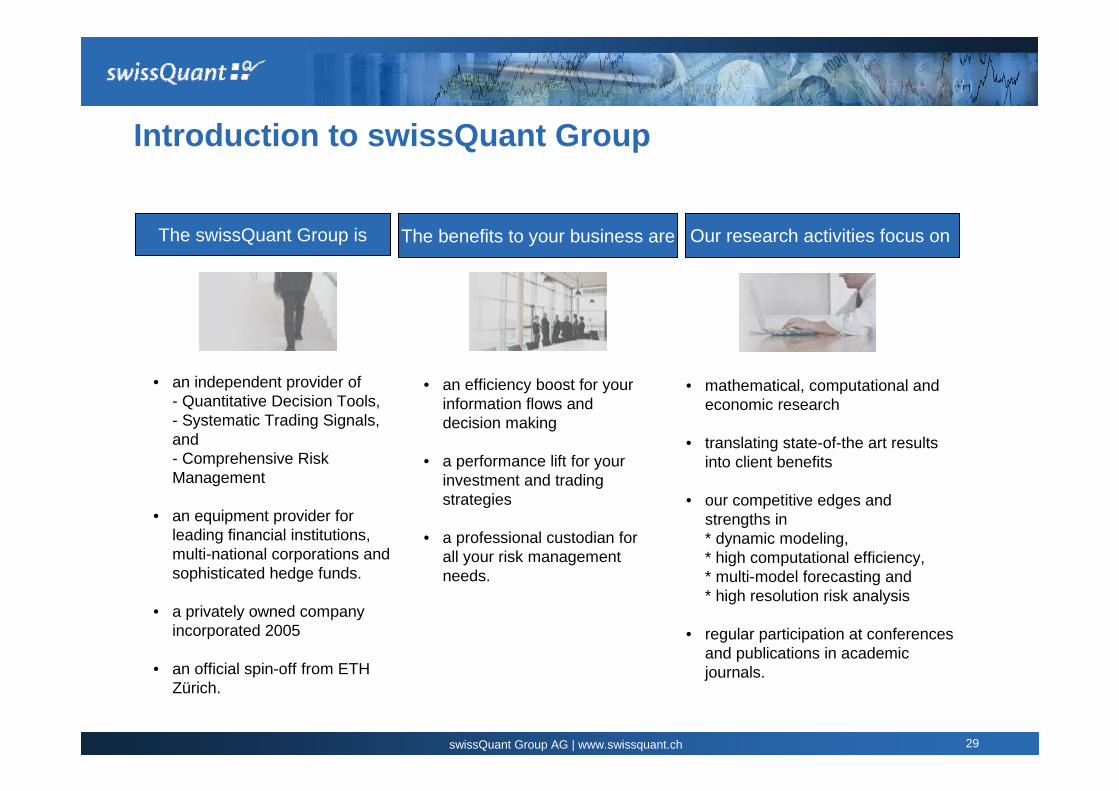
Introduction to swissQuant Group
The swissQuant Group is The benefits to your business are Our research activities focus on
• an independent provider of- Quantitative Decision Tools,- Systematic Trading Signals, and - Comprehensive Risk Management
• an equipment provider for leading financial institutions, multi-national corporations and sophisticated hedge funds.
• a privately owned company incorporated 2005
• an official spin-off from ETH Zürich.
• an efficiency boost for your information flows and decision making
• a performance lift for your investment and trading strategies
• a professional custodian for all your risk management needs.
• mathematical, computational and economic research
• translating state-of-the art results into client benefits
• our competitive edges and strengths in* dynamic modeling, * high computational efficiency, * multi-model forecasting and * high resolution risk analysis
• regular participation at conferences and publications in academic journals.

30swissQuant Group AG | www.swissquant.ch
Disclaimer
This material is provided for illustrative purposes only and should not be construed as investment advice or an offer to sell, or the solicitation of offers to buy, any security. Opinions expressed herein are current as of the date appearing in this material.
Simulated performance results have inherent limitations. Such results are hypothetical and do not represent actual trading, and therefore may not take into account material economic and market factors, such as liquidity constraints, that would impact the adviser's actual decision-making. Simulated results are also achieved through the retroactive application of a model designed with the benefit of hindsight. The results shown may reflect the reinvestment of dividends and other earnings, but may not reflect advisory fees, transaction costs, and other expenses a client would have paid, which would reduce returns. No representation is made that a client will achieve results similar to those shown. If any of the assumptions used in these examples do not prove to be true, results may vary substantially from the examples shown.
Examples are for illustrative purposes only and do not purport to show actual results. The information contained in this presentation is not intended to be used as a general guide to investing, or as a source of any specific investment recommendations, and makes no implied or express recommendations concerning the manner in which any client's account should or would be handled, as appropriate investment strategies depend upon the client's investment objectives. It is the responsibility of any person or persons in possession of this material to inform themselves of and to observe all applicable laws and regulations of any relevant jurisdiction. It should not be assumed that recommendations made in the future will be profitable or will equal the performance of the securities mentioned herein.
This presentation does not constitute an offer or solicitation to any person in any jurisdiction in which such offer or solicitation is not authorized or to any person to whom it would be unlawful to make such offer or solicitation. Prospective investors should inform themselves and take appropriate advice as to any applicable legal requirements and any applicable taxation and exchange control regulations in the countries of their citizenship, residence or domicile which might be relevant to the subscription, purchase, holding, exchange, redemption or disposal of any investments.
Past performance is not a guide to future performance and the value of investments and the income derived from those investments can go down as well as up. Future returns are not guaranteed and a loss of principal may occur.


![Systematic investment plan[1]](https://img.dokumen.tips/doc/110x75/55550e6ab4c905c35e8b542d/systematic-investment-plan1.jpg)


