Embed Size (px)
Citation preview

RISKIER BUSINESS:
WORKING TOGETHER TO UNDERSTAND
RISKS TO NATURAL CAPITAL
THE UK’S OVERSEAS LAND FOOTPRINT
SUMMARY REPORTJULY 2020 (REVISED VERSION)
RISKIER BUSINESS: THE UK’S OVERSEAS LAND FOOTPRINT EXECUTIVE SUMMARY2 3
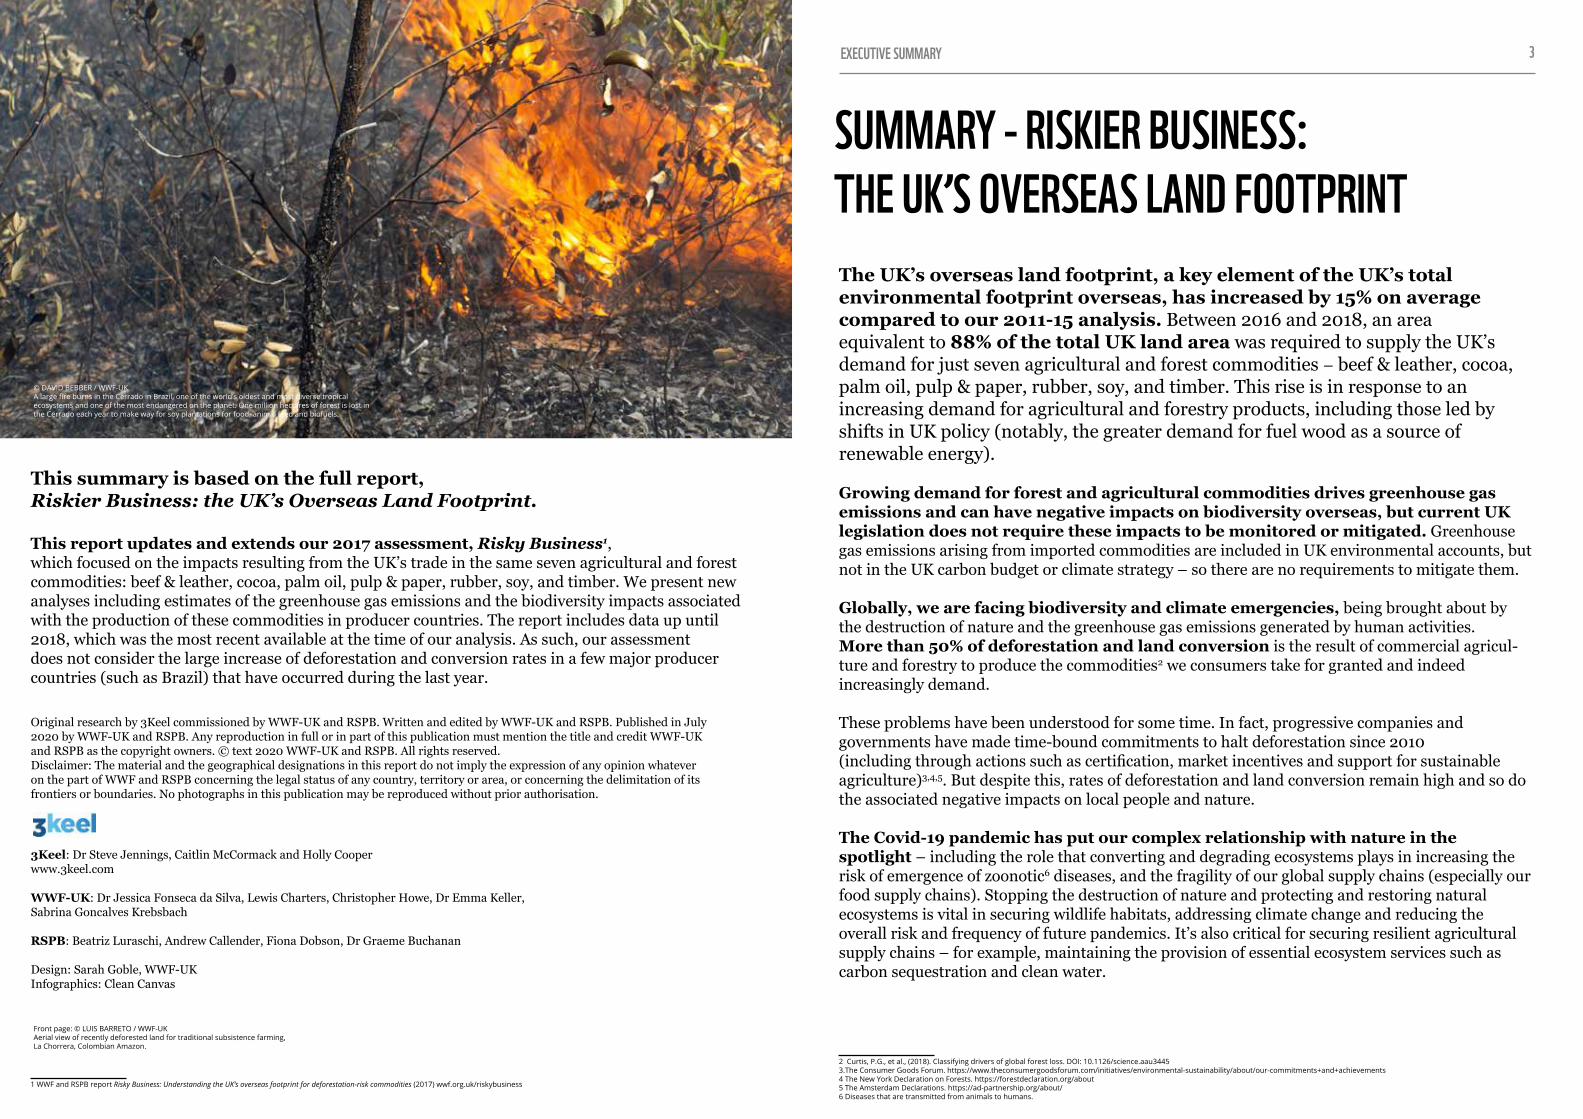
© DAVID BEBBER / WWF-UK A large fire burns in the Cerrado in Brazil, one of the world’s oldest and most diverse tropical ecosystems and one of the most endangered on the planet. One million hectares of forest is lost in the Cerrado each year to make way for soy plantations for food, animal feed and biofuels.
Front page: © LUIS BARRETO / WWF-UK Aerial view of recently deforested land for traditional subsistence farming, La Chorrera, Colombian Amazon.
Original research by 3Keel commissioned by WWF-UK and RSPB. Written and edited by WWF-UK and RSPB. Published in July 2020 by WWF-UK and RSPB. Any reproduction in full or in part of this publication must mention the title and credit WWF-UK and RSPB as the copyright owners. ©️ text 2020 WWF-UK and RSPB. All rights reserved. Disclaimer: The material and the geographical designations in this report do not imply the expression of any opinion whatever on the part of WWF and RSPB concerning the legal status of any country, territory or area, or concerning the delimitation of its frontiers or boundaries. No photographs in this publication may be reproduced without prior authorisation.
3Keel: Dr Steve Jennings, Caitlin McCormack and Holly Cooper www.3keel.com
WWF-UK: Dr Jessica Fonseca da Silva, Lewis Charters, Christopher Howe, Dr Emma Keller, Sabrina Goncalves Krebsbach
RSPB: Beatriz Luraschi, Andrew Callender, Fiona Dobson, Dr Graeme Buchanan
Design: Sarah Goble, WWF-UKInfographics: Clean Canvas
The UK’s overseas land footprint, a key element of the UK’s total environmental footprint overseas, has increased by 15% on average compared to our 2011-15 analysis. Between 2016 and 2018, an area equivalent to 88% of the total UK land area was required to supply the UK’s demand for just seven agricultural and forest commodities – beef & leather, cocoa, palm oil, pulp & paper, rubber, soy, and timber. This rise is in response to an increasing demand for agricultural and forestry products, including those led by shifts in UK policy (notably, the greater demand for fuel wood as a source of renewable energy).
Growing demand for forest and agricultural commodities drives greenhouse gas emissions and can have negative impacts on biodiversity overseas, but current UK legislation does not require these impacts to be monitored or mitigated. Greenhouse gas emissions arising from imported commodities are included in UK environmental accounts, but not in the UK carbon budget or climate strategy – so there are no requirements to mitigate them.
Globally, we are facing biodiversity and climate emergencies, being brought about by the destruction of nature and the greenhouse gas emissions generated by human activities. More than 50% of deforestation and land conversion is the result of commercial agricul-ture and forestry to produce the commodities2 we consumers take for granted and indeed increasingly demand.
These problems have been understood for some time. In fact, progressive companies and governments have made time-bound commitments to halt deforestation since 2010 (including through actions such as certification, market incentives and support for sustainable agriculture)3,4,5. But despite this, rates of deforestation and land conversion remain high and so do the associated negative impacts on local people and nature.
The Covid-19 pandemic has put our complex relationship with nature in the spotlight – including the role that converting and degrading ecosystems plays in increasing the risk of emergence of zoonotic6 diseases, and the fragility of our global supply chains (especially our food supply chains). Stopping the destruction of nature and protecting and restoring natural ecosystems is vital in securing wildlife habitats, addressing climate change and reducing the overall risk and frequency of future pandemics. It’s also critical for securing resilient agricultural supply chains – for example, maintaining the provision of essential ecosystem services such as carbon sequestration and clean water.
2 Curtis, P.G., et al., (2018). Classifying drivers of global forest loss. DOI: 10.1126/science.aau3445 3.The Consumer Goods Forum. https://www.theconsumergoodsforum.com/initiatives/environmental-sustainability/about/our-commitments+and+achievements4 The New York Declaration on Forests. https://forestdeclaration.org/about 5 The Amsterdam Declarations. https://ad-partnership.org/about/6 Diseases that are transmitted from animals to humans.
SUMMARY - RISKIER BUSINESS: THE UK’S OVERSEAS LAND FOOTPRINT
This summary is based on the full report, Riskier Business: the UK’s Overseas Land Footprint.
This report updates and extends our 2017 assessment, Risky Business1, which focused on the impacts resulting from the UK’s trade in the same seven agricultural and forest commodities: beef & leather, cocoa, palm oil, pulp & paper, rubber, soy, and timber. We present new analyses including estimates of the greenhouse gas emissions and the biodiversity impacts associated with the production of these commodities in producer countries. The report includes data up until 2018, which was the most recent available at the time of our analysis. As such, our assessment does not consider the large increase of deforestation and conversion rates in a few major producer countries (such as Brazil) that have occurred during the last year.
1 WWF and RSPB report Risky Business: Understanding the UK’s overseas footprint for deforestation-risk commodities (2017) wwf.org.uk/riskybusiness

RISKIER BUSINESS: THE UK’S OVERSEAS LAND FOOTPRINT EXECUTIVE SUMMARY4 5
KEY FINDINGSThe UK’s overseas land footprint continues to expand: between 2016 and 2018, an average annual area of 21.3 million hectares (Mha) was required to supply the UK’s demand for these seven commodities. This is an increase of 15% compared to our 2011-15 analysis. The new figure is equivalent to 88% of the UK’s total land area.
Figure 1. The UK’s average land footprint area overseas in million hectares (Mha) for the seven forest and agricultural commodities assessed, for the periods between 2011 and 2015, and
2016 and 2018.
The greenhouse gas emissions associated with the conversion of natural ecosystems and changes in land cover for the production of just four commodities7 (cocoa, palm oil, rubber and soy) amounted to an average of around 28 million tonnes of CO2 equivalent (MtCO2e) a year, between 2011 and 2018. For a sense of scale, this is 7-8% of the UK’s entire overseas carbon footprint in 20168. It is worth stressing that these overseas land-use change emissions are accounted for by the UK government, but they are not included in the UK national carbon budget or climate strategy, so there is no requirement to mitigate them.
7 Assessment could only be done for these commodities given the lack of comparable global data for calculating the GHG emissions for forest products and livestock. 8 WWF’s 2020 report Carbon Footprint - Exploring the UK’s Contribution to Climate Change found the total GHG emissions embodied in UK imports was 364 MtCO2e of a total UK carbon footprint of 801 MtCO2e in 2016; that analysis did not include emissions from land-use change (WWF, 2020). https://www.wwf.org.uk/updates/uks-carbon-footprint
Figure 2. The UK’s land footprint overseas in hectares (ha) for each of the seven commodities superimposed on the UK map for comparison. Together they amount to 88% of the UK’s land area.
CHANGE IN LAND FOOTPRINT

RISKIER BUSINESS: THE UK’S OVERSEAS LAND FOOTPRINT EXECUTIVE SUMMARY6 7
In landscapes in high risk countries that grow products exported to the UK, we counted how many species could be exposed to threats associated with commodity production and expansion. We found that UK demand for and trade in these commodities could be affecting more than 2,800 species already threatened with extinction (including orangutan populations in Sumatra and wild cat populations in South America, such as the northern tiger cat).
By far the largest of all the land footprints are those associated with both the timber commodities and those of pulp & paper imported to the UK between 2016 and 2018 (7.9 and 5.4 Mha, respectively). For timber, even though more than 80% of this land footprint is located in lower risk countries, the sheer scale concerned means that the land footprint in high and very high risk locations9 (e.g. Russia) still represents a huge area of land. As for the lower risk countries, some including the US remain a concern in terms of deforestation and habitat destruction.
TIMBER IMPORTS HAVE DOUBLED SINCE OUR PREVIOUS STUDY, MOSTLY DUE TO A 110% INCREASE IN THE IMPORTS OF FUEL WOOD, AS A RESULT OF INCREASED DEMAND FOR BIOENERGY PRODUCTION.We ranked the countries from which the UK imports directly according to their risk, using a composite of four factors: extent of tree cover loss, rate of deforestation, rule of law, and labour standards. Of the UK’s total land footprint overseas (21.3 Mha), 28% (or around 6 Mha – three times the size of Wales) is located in those countries which our assessment assigned a ‘very high’ or ‘high’ risk score. This means there is still a high risk that the commodity supply chains operating within these countries continue to be associated with deforestation, conversion of natural ecosystems and/or human rights abuses.
BETWEEN 63% AND 89% OF THE UK’S LAND FOOTPRINT OVERSEAS FOR COCOA, PALM OIL, RUBBER AND SOY IS LOCATED IN COUNTRIES CONSIDERED TO HAVE HIGH AND VERY HIGH RISK. The UK’s share of the global land footprint is sizeable for cocoa (9% of global cocoa land footprint), palm oil (5%) and pulp & paper (5%). This is especially notable considering the UK accounts for slightly less than 1% of the global population and around 2% of global gross domestic product (GDP).
9 We assigned a risk score to each UK sourcing country, based on their deforestation/conversion rates (Global Forest Watch and Food and Agriculture Organization of United Nations), labour rights (International Trade Union Confederation) and rule of law indices (World Bank). Scores varied from 0 to 12, being ≥11 ‘very high’ risk, 9-10 ‘high’ risk.
© NATUREPL.COM / EDWIN GIESBERS / WWF Orangutan baby (Pongo pygmaeus). Semengoh Nature Reserve, Sarawak, Borneo, Malaysia.
RISKIER BUSINESS: THE UK’S OVERSEAS LAND FOOTPRINT EXECUTIVE SUMMARY8 9
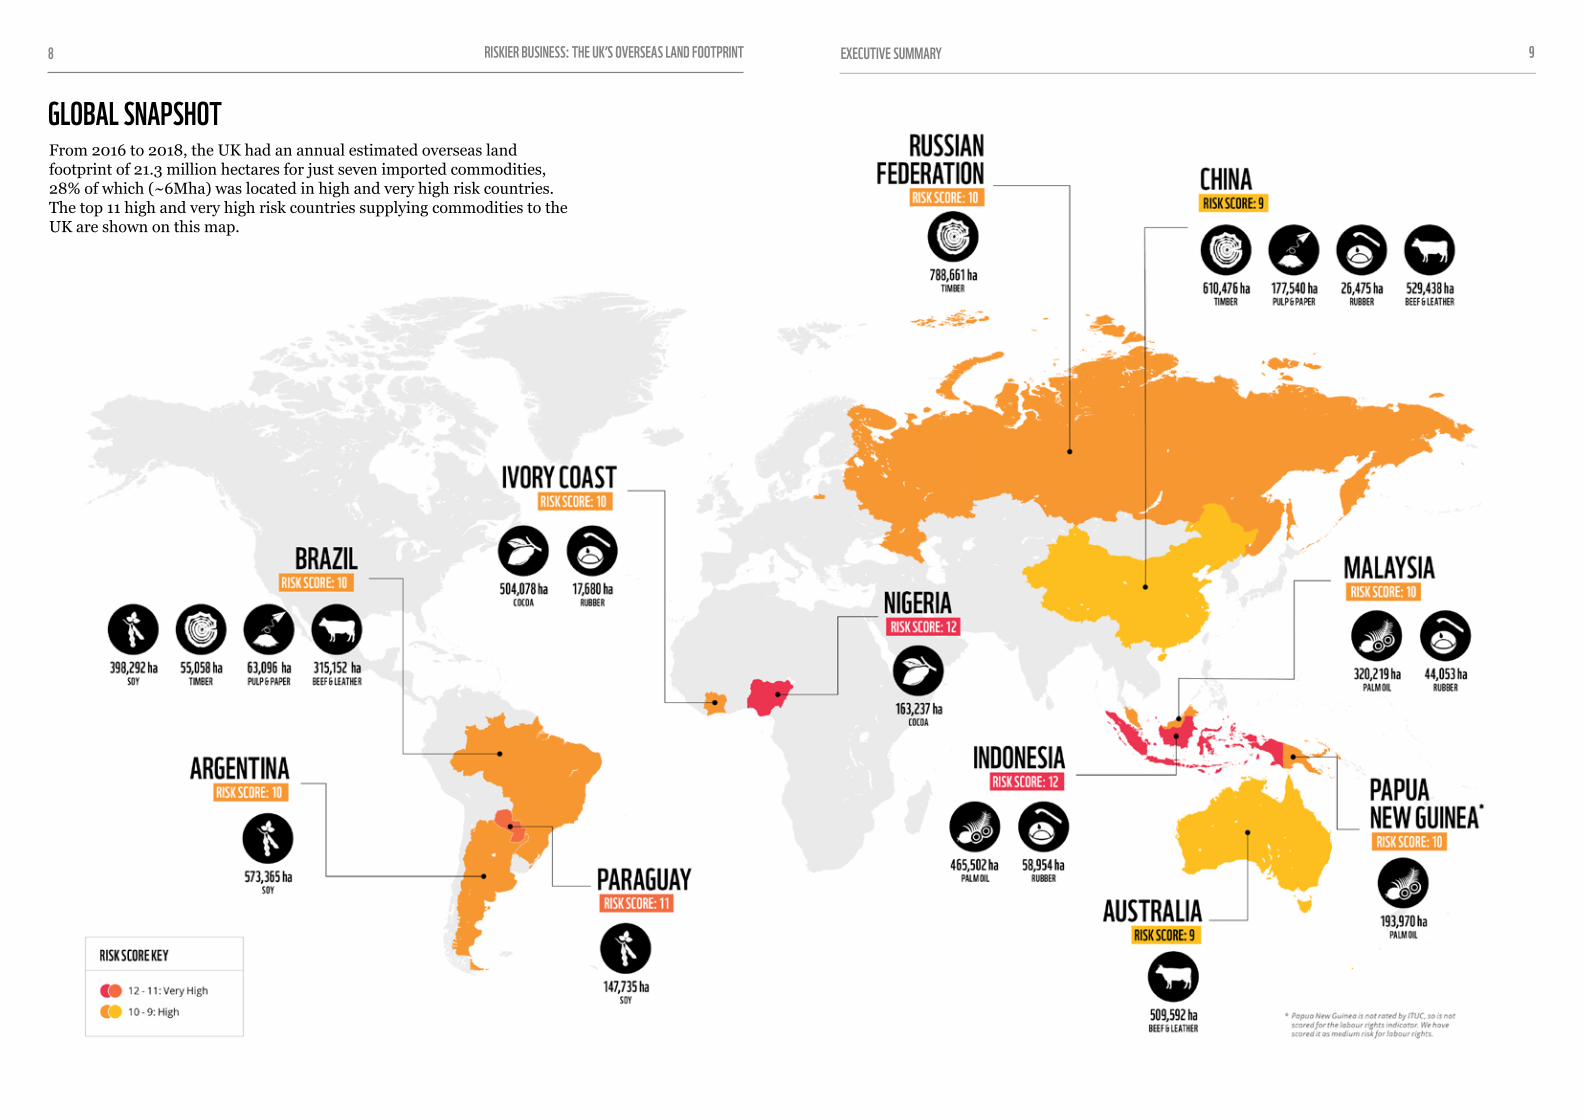
GLOBAL SNAPSHOTFrom 2016 to 2018, the UK had an annual estimated overseas land footprint of 21.3 million hectares for just seven imported commodities, 28% of which (~6Mha) was located in high and very high risk countries. The top 11 high and very high risk countries supplying commodities to the UK are shown on this map.

RISKIER BUSINESS: THE UK’S OVERSEAS LAND FOOTPRINT10
The UK, including the devolved governments, has shown willingness to take steps towards addressing its impacts overseas. This includes public recognition of the need to reduce its global footprint (for example through its 25-Year Environment Plan, the Global Resources Initiative (GRI) taskforce, the Well-being of Future Generations (Wales) Act, and the Scottish Environmental Strategy). In addition, it has undertaken work that aims to provide incentives for market demand for certified sustainable commodities and has been promoting private sector action (for example through the UK Roundtables on Sustainable Palm Oil and Soya).
We have also seen an increase in the number of commitments from the private sector to be deforestation and conversion-free, and in action towards further transparency and sustainability in supply chains. Nevertheless, despite some encouraging progress within certain commodity supply chains (e.g. palm oil) there are still substantial risks embedded within the UK’s supply chains that need to be addressed – and a large ‘implementation gap’ remains between pledges on deforestation and conversion-free supply chains and tangible progress on the ground.
Despite these worrying trends, the UK has the opportunity to demonstrate global leadership towards driving sustainability across commodity supply chains around the world. This can be achieved, especially for cocoa, palm oil, and pulp & paper supply chains, for which the UK’s share of the global land footprint is most significant (5-9%).
Our data demonstrates that the UK is heavily dependent on international supply chains to satisfy its demand for food and fibre. In addition to managing demand, this dependence could, in theory, be marginally reduced for some commodities (i.e. beef & leather, pulp & paper, and timber) by increasing production domestically. However for climatic, biological and other reasons it is not possible to grow most of them in the UK. Therefore, the UK must help to strengthen the resilience of its global supply chains and ensure they do not contribute to greenhouse gas emissions and the destruction of nature, or cause harm to people overseas.
Global traders and the financial institutions have major links with impacts on producer landscapes, so they could play a key role in bringing about changes to improve sustainability. But there are currently no incentives for doing so.
International trade that respects the environment and human rights can play a positive role in enhancing equitable global prosperity. As the UK negotiates new trade agreements, it is important to ensure that these deliver on UK commitments to support the transition to resilient, reliable and sustainable commodity supply chains that benefit people and nature.
We urge the UK, including devolved governments, businesses and financial institutions, to take bold actions to bring about the rapid transition towards greener, more sustainable and resilient supply chains.
ACHIEVING GREENER SUPPLY CHAINS
THE UK HAS THE OPPORTUNITY TO DEMONSTRATE GLOBAL LEADERSHIP TOWARDS DRIVING SUSTAINABILITY
© CHRIS J RATCLIFFE / WWF-UKYoung and mature oil palms in front of natural jungle in the state of Sabah, Borneo.WWF is supporting oil palm growers to adopt more sustainable agricultural practices and local initiatives with replanting to create wildlife corridors linking existing forests which will allow species to move more freely.

RISKIER BUSINESS: THE UK’S OVERSEAS LAND FOOTPRINT EXECUTIVE SUMMARY12 13
GOVERNMENT TO URGENTLY: • Secure high environmental and social standards and safeguards in all
future trade agreements that are in alignment with the UK’s commitments on climate, nature and people.
• Develop a post Covid-19 recovery package that ensures more sustainable and resilient supply chains.
• Establish a mandatory due diligence obligation on businesses and financial institutions, which requires them to identify, mitigate and report on risks and impacts in their supply chains or investment portfolios.10
• Implement the GRI taskforce recommendations – in particular, set a mandatory due diligence obligation, develop a sustainable action plan for commodity supply chains, set a legally binding target to halt deforestation, and develop a measuring, monitoring and reporting framework to support implementation.
• By the end of 2020, set a time-bound, legally binding target to halve the UK’s overall environmental footprint by 2030, including a sub-target to halt deforestation and conversion embedded within UK commodity supply chains as early as possible and no later than 2023.
• Push for strong action targets, in partnership with key producer and consumer countries, such as China, to protect species and habitats as part of the Post-2020 Global Biodiversity Framework under the Convention on Biological Diversity. And, as president of the next conference of parties (COP26) of the UN Framework Convention on Climate Change, scale up support for and implementation of nature-based solutions.
• Lead the way in implementing multilateral/bilateral plans to improve sustainability in at-risk11 landscapes and transform supply chains, including support through Official Development Assistance and international climate change finance.
10 The new legislative piece, the Environmental Bill, offers the right opportunity for such an obligation.11 Producer landscapes experiencing high rates of deforestation and land conversion as well as human rights issues.
RECOMMENDATIONS
WE CALL ON...
© ANDRE DIB / WWF-BRAZILSandstone formation at Chapada das Mesas in the region of Matopiba, Brazil.The Cerrado is being destroyed by unsustainable soy plantations which means many species, including giant anteaters, as well as indigenous communities, are at risk of becoming extinct. The destruction of the Cerrado will continue if we don’t start growing all soy sustainably.

RISKIER BUSINESS: THE UK’S OVERSEAS LAND FOOTPRINT EXECUTIVE SUMMARY14 15
COMPANIES TO: • Set robust policies and time-bound commitments to halt deforestation and ecosystem
conversion from supply chains aligned with the Accountability Framework initiative, and implement these as soon as possible (e.g. acting on voluntary due diligence principles).
• Report publicly on progress towards implementation of policies and commitments.
• Engage with suppliers and support implementation of policies and commitments across your entire supply chain.
• Advocate for further action among peers and wider stakeholders (e.g. government and civil society) for policies to achieve deforestation/conversion-free supply chains (e.g. supporting calls for robust environmental and social standards in trade agreements).
FINANCIAL INSTITUTIONS TO: • Set policies as well as pre-screening and monitoring systems to ensure that no lending or
investments are associated with illegal environmental or social practices, or with the destruction of nature.
• Report publicly on risks and impacts and on the progress in mitigating them; and request clients to do so.
• Understand opportunities and enable the transition to sustainable commodity production (e.g. finance sustainable agriculture practices, nature-based solutions, and support projects to improve sustainability in at risk landscapes).
CITIZENS TO:• Purchase products that meet a credible certified standard whenever possible.
• Write to your local MP, MSP, MS or MLA to support policies and legislation for greener supply chains and further transparency and scrutiny over trade deals.
• Demand greater transparency and action from your supermarket and favourite brands to ensure that the products you enjoy are not associated with deforestation, conversion or labour rights abuses.
• Eat more sustainably (e.g. consider introducing more plants into your diet, eating less meat, wasting less food and, when possible, choosing locally sourced options).
© PETER CATON / WWF-UKThe Brazilian savannah, or Cerrado, is home to thousands of species found nowhere else. But it’s disappearing faster than any other forest in the world, cleared to make way for giant industrial farms.

RISKIER BUSINESS: THE UK’S OVERSEAS LAND FOOTPRINT EXECUTIVE SUMMARY16 17
ANNEX:COMMODITY SPECIFIC HIGHLIGHTS These are highlights of the full Risker Business report, rather than a comprehensive list of all findings. Details on the methods and complete findings are provided in the full version of the report.
BEEF & LEATHER• The land required overseas to supply the UK’s demand for beef &
leather has decreased from 5.4 to 3.8 Mha since our previous analysis – a 28% decline. This decrease is mostly due to a reduction in leather imports, as well as lower beef imports from Namibia, which has a very extensive, low-productivity pasture system and therefore a large land footprint.
• Imports currently supply approximately one quarter of the volume of beef consumed within the UK; the remaining three quarters is supplied by domestic production.
• More than a third of the total UK overseas land footprint for beef & leather (around 1.4 Mha) was located in high risk countries including Australia, Brazil and China.
COCOA• The average land required overseas to supply the UK’s demand for
cocoa has increased from 884,372 hectares to nearly 1.1 Mha – an increase of 20% since our previous assessment (2011-15). This land footprint amounts to 9% of the global land footprint for cocoa.
• Almost 80% of this land footprint was located in Ivory Coast, Ghana, and Nigeria. Ivory Coast and Nigeria have very high and high risk scores, respectively.
© ANDRE DIB / WWF-BRAZILHerd of cattle on Transpantaneira highway MT-60, Pantanal. Poconé, State of Mato Grosso, Brazil.

RISKIER BUSINESS: THE UK’S OVERSEAS LAND FOOTPRINT EXECUTIVE SUMMARY18 19
PALM OIL• The land required overseas to meet the UK’s demand for palm oil between 2016 and 2018
was on average 1.1 Mha per year. This is a decrease of 5% compared to our analysis for 2011-15.
• Of the palm oil imported to the UK, 89% came from high and very high risk countries (Indonesia, Malaysia and Papua New Guinea).
• Despite progress in the certification of palm oil both globally and in the UK (around 19% of global production and 77%12 of UK’s palm oil imports are currently certified by the Roundtable on Sustainable Palm Oil as sustainably produced), rates of deforestation and conversion due to palm oil production remain to be as high. This suggests that efforts in the sector have not been enough to improve sustainability on the ground.
PULP & PAPER• Between 2016 and 2018, the land required overseas to supply the UK’s demand for pulp and
paper was on average 5.4 Mha a year – approaching three times the size of Wales. This represents an 8% increase compared to our previous analysis for 2011-15.
• The percentage of the UK’s pulp and paper land footprint located in high risk countries (Brazil and China) has reduced from 11% to 4%, but this still represents a significant area of land.
RUBBER • Between 2016 and 2018, the land required overseas to supply the UK’s demand for natural
rubber was more than 226,000 hectares per year – just under 2% of the world’s rubber land footprint.
• The UK’s natural rubber land footprint overseas has decreased by around 17% since 2011-15, as a result of a 22% decrease in the volume of rubber imported.
12 This figure is derived from Efeca’s Annual Progress Report - UK Roundtable on Sourcing Sustainable Palm Oil (2019), which focuses only on the imports of crude and refined palm oil, excluding palm ker-nel oil, solid by-products from oil extraction and palm oil embedded in imported manufactured products. Therefore, the overall percentage of certified volume is much lower: ~28% of total imported palm oil.
© HKUN LAT / WWF-MYANMARLatex being collected from a tapped rubber tree.

RISKIER BUSINESS: THE UK’S OVERSEAS LAND FOOTPRINT EXECUTIVE SUMMARY20 21
SOY • The land required overseas to meet the UK’s annual demand for soy
between 2016 and 2018 was on average 1.7 Mha, or an area approaching the size of Wales. This figure was similar to our previous study, based on 2011-15 data.
• Despite the UK now relying a little less on soy from South American countries, 65% of the soy land footprint is still located in Argentina, Brazil and Paraguay, all of which are high and very high risk countries.
• More than half (56%) of the UK’s soy imports between 2016 and 2018 were in the form of soymeal – a prime ingredient of animal feed and increasingly associated with high-protein diets. From our data, at least 75% of all imported soy is either embedded in imported meat, eggs and dairy or is used for animal feed.13
TIMBER• The land required overseas to supply the UK’s demand for timber has
increased threefold since 2011 (from 2.8 to 8.4 Mha) – an area greater than the size of Scotland.
• Around one fifth of the UK’s overseas land footprint for timber was located in high risk countries, including Brazil, China and Russia.
• Around a third of the UK’s timber imports between 2016 and 2018 were in the form of fuelwood – equivalent to 27.6 million trees14. Around 60% of this was produced in the US.
• Fuelwood is primarily used for energy generation, and demand has increased considerably – from an average of 22% of total imports to 32%. Such an increase is likely to be linked to policies aimed at increasing the share of renewable sources in the UK’s energy matrix. Though well-intended, these policies fail in sufficiently assessing the carbon impacts of biofuels.
13 Little data is available on the use of whole soybeans within the UK, but it is likely that the large majority is also used for animal feed. Thus, the percentage of all imported soy that is used for animal feed is likely to be higher, around 80-90%.14 Calculated using the average cubic metre volume (m3) of an individual Sitka spruce (Picea sitchensis), a species of tree commonly used in UK contructions. Note that this figure is illustrative only, as it is based on the average tree dimensions of a single species. The real number of trees might vary depending on the species used which varies per region.
© ANA PAULA RABELO / WWF-UKExample of raw soy product which was harvested from a sustainable farm, Cerrado.

© W
WF-U
S / RICARDO
LISBOA
An aerial photograph of the Uatum
ã Biological Reserve in the state of Amazonas in Brazil.
Uatum
ã Biological Reserve is part of the Amazon Region Protected Areas (ARPA).