Embed Size (px)
Citation preview

1
Risk review and disclosures under Basel III Framework for the period ended 31 Dec 2016
1. Backgrounds The Standard Chartered Group (SCB Group or the Group) is an international banking and financial services group particularly focused on the markets of Asia, Africa and the Middle East. Standard Chartered Bank is regulated by the Financial Conduct Authority and Prudential Regulation Authority in the United Kingdom (UK). SCB India (SCBI or the Bank) is a branch of Standard Chartered Bank UK, which is part of the SCB Group. The ultimate parent company of the Bank is Standard Chartered PLC, which is listed on the London Stock Exchange and the Stock Exchanges of Hong Kong and India. Indian branch operations are conducted in accordance with the banking license granted by the Reserve Bank of India (RBI) under the Banking Regulation Act 1949. 2. Overview The Basel Committee on Banking Supervision published a framework for International Convergence of Capital Measurement and Capital Standards (commonly referred to as Basel II), which replaced the original 1988 Basel I Accord. The RBI adopted the same in March 2008. The Basel III implementation schedule for India has commenced from 1 April 2013 and is phased in through to 31 March 2019. Accordingly, for 31 Dec 2016 reporting purposes, the Bank has calculated its Pillar 1 capital requirement based on Basel III norms. Basel II/III is structured around three “pillars” which are outlined below: Pillar 1 sets out minimum regulatory capital requirements – the minimum amount of regulatory capital
banks must hold against the risks they assume; Pillar 2 sets out the key principles for supervisory review of a bank’s risk management framework and its
capital adequacy. It sets out specific oversight responsibilities for the Board and senior management, thus reinforcing principles of internal control and other corporate governance practices; and
Pillar 3 aims to bolster market discipline through enhanced disclosure by banks. Basel II/III provides three approaches of increasing sophistication to the calculation of credit risk capital; the Standardised Approach (SA), the Foundation Internal Ratings Based Approach and the Advanced Internal Ratings Based Approach (IRB). Basel II also introduced capital requirements for operational risk (OR) for the first time. 3. DF 1 - Scope of Application Name of the head of the banking group to which the framework applies: Standard Chartered Bank India Branches DF 1 - Qualitative Disclosures 3.1. Pillar 1 The SCB Group and local management of the Indian operations recognise that Basel II/III is a driver for continuous improvement of risk management practices and believe that adoption of leading risk management practices are essential for achieving its strategic intent. Accordingly, the Group has adopted the IRB model for the measurement of credit risk covering substantial majority of the portfolio. The Group applies Internal Model Approval model for market risk capital and the Standardised Approach for determining its OR capital requirements. SCBI has adopted RBI’s prevailing Basel II/III regulations related to SA for credit and market risk and Basic Indicator Approach (BIA) for OR for computing local regulatory Pillar 1 capital.

2
Risk review and disclosures under Basel III Framework for the period ended 31 Dec 2016
3.2. Pillar 2 Pillar 2 requires banks to undertake a comprehensive assessment of their risks and to determine the appropriate amounts of capital to be held against these risks where other suitable mitigants are not available. This risk and capital assessment is commonly referred to as an Internal Capital Adequacy Assessment Process (ICAAP). The range of risks that need to be covered by the ICAAP is much broader than Pillar 1, which covers only credit risk, market risk and OR. The Group has developed an ICAAP framework which closely integrates the risk management and capital assessment processes and ensures that adequate levels of capital are maintained to support the current and projected demand for capital under expected and stressed conditions. The ICAAP framework has been designed to be applied consistently across the organisation to meet the Pillar 2 requirements of local regulators. As a branch of a foreign bank in India, the India ICAAP is largely based on the Group ICAAP framework, so as to maintain consistency in reporting of the risk and capital management aspects. However, wherever necessary, local customisation has been incorporated to align with the RBI requirements. 3.3. Pillar 3 Pillar 3 aims to provide a consistent and comprehensive disclosure framework that enhances comparability between banks and further promotes improvements in risk management practices. The Bank has implemented the requirements laid down by RBI for Pillar 3 disclosure, covering both the qualitative and quantitative items. These are also published in the Bank’s annual report and hosted on the Bank’s website. The risk related disclosures and analysis provided herein below, are primarily in the context of the disclosures required under the RBI’s Pillar 3 – Market Discipline of the Basel III Capital Regulations and are in respect of SCBI, except where required and specifically elaborated, to include other Group entities operating in India. The information provided has been reviewed by senior management and is in accordance with the guidelines prescribed by the RBI. 3.4. Accounting and Prudential Treatment / Consolidation Framework The consolidation norms for accounting are determined by the prevailing Indian Generally Accepted Accounting Principles (GAAP). The regulatory requirements are governed by RBI guidelines. The differences between consolidation for accounting purposes and regulatory purposes are mainly on account of following reasons: 1) Control over other entities to govern the financial and operating policies of the subsidiaries or joint
ventures
As per Indian GAAP, existence of control/joint control to govern the financial and operating policies of the subsidiary or joint venture is necessary for accounting consolidation. However, certain entities such as Non Banking Finance Companies (NBFC) have to be consolidated for regulatory capital adequacy purposes even where the above requirement is not fulfilled. Such cases are where the ability to control financial and operating policies of the entities legally vests with the Parent or Group entities and not with the India branch operations.
3
Risk review and disclosures under Basel III Framework for the period ended 31 Dec 2016
2) Nature of business of the entities to be consolidated
As per Indian GAAP, subsidiaries are not excluded from consolidation because of dissimilar nature of business activities between subsidiary and other entities within the Group. However, RBI regulations do not require consolidation of entities engaged in insurance business and businesses not pertaining to financial services.
3) Method of consolidation
The accounting consolidation methodology requires ‘line by line’ consolidation and elimination of all inter-group balances. However, for the purpose of regulatory consolidation under the capital adequacy framework, the risk weighted assets (RWA) and capital requirements for each entity can be computed separately by applying the Basel II/III norms as applicable for a bank and simply added together with that of the lead bank in the consolidated group. The Bank has adopted the latter approach for consolidation of entities for limited purpose of capital adequacy framework, as the accounting consolidation method is not appropriate considering the legal ownership pattern of the consolidated entities.
List of group entities considered for consolidation for regulatory purposes is summarised below:
Name Of The Entity / Country Of Incorporation
Whether The Entity Is Included Under Accounting Scope Of Consolidation (Yes / No)
Explain The Method Of Consolidation
Whether The Entity Is Included Under Regulatory Scope Of Consolidation (Yes / No)
Explain The Method Of Consolidation
Explain The Reasons For Difference In The Method Of Consolidation
Explain the reasons if consolidated under only one of the scopes of consolidation
Standard Chartered Bank India Branches
Yes Full Yes For the purpose of regulatory consolidation under the capital adequacy framework, the RWA and capital requirements for each entity can be computed separately by applying the Basel II/III norms as applicable for a bank and simply added together with that of the lead bank in the consolidated group. The Bank has adopted the latter approach for consolidation of entities for limited purpose of capital adequacy framework, as the accounting consolidation method is not appropriate considering the legal ownership pattern of the consolidated entities.
Standard Chartered Investments and Loans (India) Limited
No Not Applicable
Yes
Standard Chartered Securities (India) Limited
No Not Applicable
Yes
St. Helen’s Nominees India Private Limited
No Not Applicable
Yes

4
Risk review and disclosures under Basel III Framework for the period ended 31 Dec 2016
List of group entities in India not considered for consolidation both under the accounting and regulatory scope of consolidation:
(` in 000s) Name Of The Entity /Country Of Incorporation
Principle activity of the entity Total balance sheet equity (as stated in the accounting balance sheet of the legal entity)
% of bank’s holding in the total equity
Regulatory treatment of bank’s investments in the capital instruments of the entity
Total balance sheet assets(as stated in the accounting balance sheet of the legal entity)
Scope International Private Limited
The company renders the following services to related parties: a) Software development, maintenance & support b) Back office transaction processing and data processing of various banking transactions c) IT support d) Voice call centre services
83,120 0% Not Applicable
9,493,570
Standard Chartered Finance Limited
Marketing services of financial products of Standard Chartered Bank and its Home Assist division provides search and other property related services.
71,907 0% Not Applicable
820,703
Standard Chartered (India) Modeling And Analytics Centre Private Limited.
The company is a captive knowledge process outsourcing company which provides robust and contemporary analytical solutions to the Bank’s businesses across the globe for the purpose of risk management and capital management.
500,000 0% Not Applicable
641,192
Standard Chartered Private Equity Advisory (India) Private Limited
The company is a research unit for Merlion India Fund carrying on activities of industry research and advice by furnishing industry and market feedback.
24,000 0% Not Applicable
644,915
Note: The above data is as per latest audited results as at 31 March 2016.
DF 1 - Quantitative Disclosures List of group entities considered for regulatory consolidation: (` in 000s)
Name Of The Entity /Country Of Incorporation
Principle activity of the entity Total balance sheet equity (as stated in the accounting balance sheet of the legal entity)
Total balance sheet assets(as stated in the accounting balance sheet of the legal entity)
Standard Chartered Bank, India Branches
Banking and Financial services 74,400,742 1,306,630,243
Standard Chartered Investments and Loans (India) Limited
Financial services acceptable for NBFC,
other than accepting public deposits eg.
lending, investments, etc.
4,543,850 18,395,566
Standard Chartered Securities (India) Limited
Category I merchant banker, rendering brokering services to retail clients and depository services
2,818,557 2,479,993

5
Risk review and disclosures under Basel III Framework for the period ended 31 Dec 2016
St. Helen’s Nominees India Private Limited
Nominee business - holding shares / debentures in limited companies on behalf of SCBI and its clients. Security trusteeship business for SCBI.
100 26,041
Note: The above data is as per unaudited results as at 31 Dec 2016
The aggregate amount of capital deficiencies in all subsidiaries not included in the consolidation, i.e., that are deducted and the name(s) of such subsidiaries.
NIL
The aggregate amounts (e.g., current book value) of the bank’s total interests in insurance entities, which are risk-weighted, as well as, their name, their country of incorporation or residence, the proportion of ownership interest and, if different, the proportion of voting power in these entities. In addition, indicate the quantitative impact on regulatory capital of using this method versus using the deduction. Any restrictions or impediments on transfer of funds or regulatory capital within the banking group.
NIL As per extant RBI guidelines
4. DF 2 - Capital Adequacy
DF 2 - Qualitative Disclosures 4.1. Objectives
The Bank’s capital management approach is driven by its desire to maintain a strong capital base to support the development of its business and to meet regulatory capital requirements at all times.
4.2. Approach Strategic, business and capital plans are drawn up annually covering a one to five year horizon. The plans ensure that adequate levels of capital and an optimum mix are maintained by the Bank to support its strategy. This is integrated with the Bank’s annual planning process which takes into consideration business growth assumptions across products and the related impact on capital resources.
The capital plan takes the following into account: Regulatory capital requirements and assessment of future standards; Demand for capital due to business growth, market stresses and potential risks; and Available supply of capital and capital raising options.
The Group uses internal models and other quantitative techniques in its internal risk and capital assessment at an overall Group level. The Bank also considers additional risk types other than those considered under Pillar 1 as part of its ICAAP. Each material risk is assessed, relevant mitigants considered, and appropriate levels of capital determined.
Stress testing and scenario/sensitivity analysis are used to assess the Bank’s ability to sustain operations during periods of extreme but plausible events. They provide an insight into the potential impact of significant adverse events on the Bank’s earnings, risk profile and capital position and how these could be mitigated.
The capital that the Bank is required to hold by the RBI is mainly determined by its balance sheet, off-balance sheet and market risk positions, after applying collateral and other risk mitigants.

6
Risk review and disclosures under Basel III Framework for the period ended 31 Dec 2016
4.3. Governance The Group operates processes and controls to monitor and manage capital adequacy across the organisation. At a country level, capital is maintained on the basis of the local regulator’s requirements. It is overseen by the country Asset and Liability Committee (ALCO), which is responsible for managing the country balance sheet, capital and liquidity, with the active support and guidance from Group ALCO (GALCO), Operational Balance Sheet Committee (OBSC) and Group Treasury (GT). The responsibility of capital management has been assigned to a dedicated sub-group of ALCO, the Capital Management Forum (CMF). The capital management process is governed by the Capital Planning Framework. Suitable processes and controls are in place to monitor and manage capital adequacy and ensure compliance with local regulatory ratios in all legal entities. These processes are designed to ensure that each entity and the consolidated Bank have sufficient capital available to meet local regulatory capital requirements at all times. 4.4. Mobility of Capital Resources The Bank operates as a branch in India, hence under current RBI regulations it cannot raise capital externally. The Group’s policy in respect of profit repatriation requires that each local entity should remit its profits that are considered surplus to local regulatory minimum requirements. The amount to be remitted/injected and the mix/mode of capital (CET 1 v/s Tier 2) is determined in conjunction with GT, after taking into account local capital adequacy regulations (inclusive of any regulatory buffers), anticipated changes to those regulations, forecast organic growth and Head Office (HO) return expectations. 4.5. Capital Structure CET 1/Tier 1 capital mainly comprises of: i) Capital funds injected by HO. ii) Net profits of each year retained as per statutory norms (currently 25%). iii) Remittable net profits retained in India for meeting regulatory capital requirements. iv) Capital reserves created out of profits on account of sale of immovable properties and held to maturity
investments, as per RBI regulations. The above are not repatriable/distributable to HO as long as the Bank operates in India. Tier 2 capital mainly comprises of: i) 45% of reserve created on revaluation of immovable properties in accordance with the Indian GAAP. ii) General provisions on standard (performing) assets created as per RBI regulations. iii) Reserve created out of unrealised gain on revaluation of investments as per RBI regulations.
7
Risk review and disclosures under Basel III Framework for the period ended 31 Dec 2016
DF 2 - Quantitative Disclosures
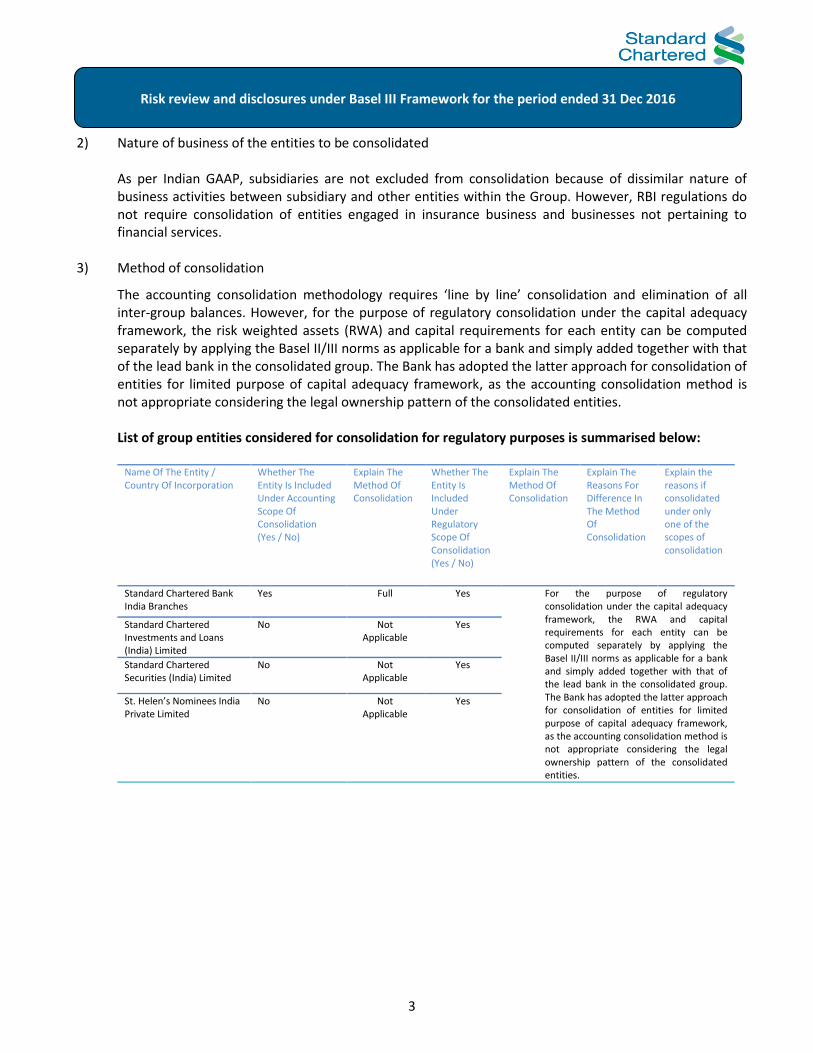
Capital and RWA Capital and risk weighted assets
As at 31 Dec 2016 (` in 000s)
Solo bank* Consolidated bank*
Tier 1 Capital : 215,346,077 225,435,825
Common Equity Tier I 215,346,077 225,435,825
Head Office Capital 74,400,742 74,400,742
Paid up capital - 7,362,507
Eligible reserves 158,294,062 160,271,869
Illiquid securities reserves (648,610) (648,610)
Intangible assets (excluding DTA) (13,259) (64,094)
Other regulatory adjustments (5,044) (5,044)
DTA deduction (Net of Benefit) (16,681,812) (15,881,544)
Additional Tier I - -
Tier 2 Capital : 10,081,945 10,131,036
Eligible revaluation reserves 2,628,842 2,628,842
General provision and other eligible reserves/provisions 7,453,103 7,502,194
Debt capital instruments eligible to be reckoned as capital funds and included in Lower Tier 2 (of which amount raised during the year Rs. Nil)
- -
Less: Amortisation of qualifying subordinated debts - -
Other regulatory adjustments - -
Total capital base 225,428,022 235,566,861
Minimum regulatory capital requirements
Credit risk 128,884,267 130,654,843
Standardised approach portfolios 99,815,806 101,377,369
Securitisation exposures 1,839,904 1,839,904
Counterparty/settlement risks 21,993,222 21,993,222
Benefit of DTA 5,235,335 5,444,348
Market risk - Standardised duration approach 9,945,228 9,948,852
Interest rate risk 9,265,201 9,265,201
Foreign exchange risk (including gold) 613,474 613,474
Equity risk 66,552 70,177
Counterparty/settlement risks - -
Operational risk - Basic indicator approach 14,142,258 14,465,058
Total minimum regulatory capital requirements 152,971,753 155,068,753
Risk weighted assets and contingents
Credit risk 1,432,047,408 1,451,720,482
Market risk (including counterparty/settlement risks) 110,502,528 110,542,798
Operational risk - Basic indicator approach 157,136,196 160,722,871
Total Risk weighted assets and contingents 1,699,686,132 1,722,986,151

8
Risk review and disclosures under Basel III Framework for the period ended 31 Dec 2016
Capital ratios
Common Equity Tier 1 capital 12.67% 13.08%
Tier 1 capital 12.67% 13.08%
Tier 2 capital 0.59% 0.59%
Total capital 13.26% 13.67%
As at 31 Dec 2015 (` in 000s)
Solo bank* Consolidated bank*
Tier 1 Capital : 195,066,345 203,541,347
Common Equity Tier I 195,066,345 203,541,347
Head Office Capital 74,400,742 74,400,742
Paid up capital - 7,362,507
Eligible reserves 155,382,592 156,634,314
Intangible assets (excluding DTA) (20,928) (42,251)
Other regulatory adjustments (2,496) (2,496)
DTA deduction (Gross) (34,693,563) (34,811,468)
Additional Tier I - -
Tier 2 Capital : 11,342,425 11,370,036
Eligible revaluation reserves 2,734,160 2,734,160
General provision and other eligible reserves/provisions 8,608,265 8,635,876
Debt capital instruments eligible to be reckoned as capital funds and included in Lower Tier 2 (of which amount raised during the year Rs. Nil)
- -
Less: Amortisation of qualifying subordinated debts - -
Other regulatory adjustments - -
Total capital base 206,408,770 214,911,383
Minimum regulatory capital requirements
Credit risk 121,484,252 122,696,062
Standardised approach portfolios 94,098,798 95,310,608
Securitisation exposures 1,844,521 1,844,521
Counterparty/settlement risks 25,540,933 25,540,933
Market risk - Standardised duration approach 9,179,255 9,182,831
Interest rate risk 8,519,511 8,519,511
Foreign exchange risk (including gold) 607,500 607,500
Equity risk 52,244 55,820
Counterparty/settlement risks - -
Operational risk - Basic indicator approach 14,123,987 14,517,417
Total minimum regulatory capital requirements 144,787,494 146,396,310
Risk weighted assets and contingents
Credit risk 1,349,825,029 1,363,289,577
Market risk (including counterparty/settlement risks) 101,991,722 102,031,456
Operational risk - Basic indicator approach 156,933,192 161,304,638
Total Risk weighted assets and contingents 1,608,749,943 1,626,625,671

9
Risk review and disclosures under Basel III Framework for the period ended 31 Dec 2016
Capital ratios
Common Equity Tier 1 capital 12.13% 12.51%
Tier 1 capital 12.13% 12.51%
Tier 2 capital 0.71% 0.70%
Total capital 12.83% 13.21%
* Solo Bank represents the main licensed bank of the Group in India and consolidated bank includes Group controlled entities operating in India and consolidated for the limited purpose of capital adequacy framework.
5. Risk Management The Bank has a strong governance culture and framework for risk management. The Bank’s risk management principles align with those established at a Group level, and are customised to meet the local regulatory requirements. One of the main risks incurred arises from extending credit to clients through trading and lending operations. Beyond credit risk, the Bank is also exposed to a range of other risk types such as market, operational, liquidity, pension, country cross border, reputational, strategic and other risks that are inherent to its strategy, product range and geographical coverage. 5.1. Risk Management Framework The Bank adds value to clients and generates returns for shareholders by taking and managing risk in line with strategy and risk appetite. Risk management is the set of end-to-end activities through which the Bank makes risk-taking decisions and controls and optimises its risk-return profile. It is a Bank-wide activity and starts right at the front-line. The management of risk lies at the heart of the Bank’s business, as a central role of the Bank is to “warehouse” risk by extending credit to selected clients and to provide products which enable clients to lay off their price and liquidity risks to the Bank. Effective risk management is a central part of the financial and operational management of the Bank and fundamental to its ability to generate profits consistently and maximise the interest of its shareholders and other stakeholders.
The foundation of all risk assessment is aligned to the Group’s Risk Management Framework (“RMF”) and governance structure which has been adopted locally. The Group’s RMF establishes common principles and standards for the management of and control of all risks, and to inform behaviour across the organisation. The core components of the RMF include its risk classifications, risk principles and standards, definitions of roles and responsibilities and governance structure. Under this framework, there are three lines of defence.
The First Line of Defence is that all employees are required to ensure the effective management of risks within the scope of their direct organisational responsibilities.
The Second Line of Defence comprises the Risk Control Owners (“RCOs”) supported by their respective control functions. They are responsible for ensuring that the residual risks within the scope of their responsibilities remain within appetite.
The Third Line of Defence comprises the independent assurance provided by the GIA function, which has no responsibilities for any of the activities it examines. GIA provides independent assurance of the effectiveness of management’s control of its own business activities (the First Line) and of the processes maintained by
10
Risk review and disclosures under Basel III Framework for the period ended 31 Dec 2016
the Risk Control Functions (the Second Line). As a result, GIA provides assurance that the overall system of control effectiveness is working as required within the RMF.
5.2. Risk Governance The Group’s committee governance structure ensures that risk-taking authority and risk management policies are cascaded down from the GALCO and Group Chief Risk Officer to the appropriate functional and divisional committees. Information regarding material risk issues and compliance with policies and standards is communicated through the business and functional committees up to the Group-level committees, as appropriate. The Country Management Team (CMT) drives and executes the business and governance agenda bringing alignment across the business and the functions so as to maximise and protect the value of the Group’s operations in India. It is responsible for the overall strategic direction of the Bank. It is chaired by Country Chief Executive Officer (CEO) and comprises senior executive members of the Bank. The following committees are the primary committees with oversight of risk and capital for the Bank:
1. ALCO – responsible for the management of capital and liquidity and the establishment of and compliance with policies relating to balance sheet management, including management of the Bank’s liquidity and capital adequacy. It includes the CEO, Chief Financial Officer (CFO), Country Chief Risk Officer (CCRO) and members from the businesses and the economist.
2. Country Risk Committee (CRC) – responsible for the effective management of risks in support of business strategy within the boundaries set by the CMT and business level risk committees. It is responsible for implementing the RMF, including assignment of the roles and responsibilities of RCOs locally. It is also responsible for ensuring that the risk exposures for all types of risks, including liquidity risk, remain within the overall risk appetite and within any specific boundaries advised by CMT and business risk committees. It includes the CEO, CCRO, CFO and members from the businesses and compliance.
Key sub-committees / forums include:
A. The Liquidity Management Forum (LMF) is a sub-group of the ALCO which manages liquidity. It includes members from Finance, Asset Liability Management (ALM) and the businesses.
B. The CMF is a sub-group of the ALCO which manages capital. It includes members from Finance, Risk and the businesses.
C. The Stress Test Forum (STF) is a sub-committee of the CRC which is responsible for reviewing the results of ongoing stress testing including for ICAAP. It includes members from the Finance and Risk functions and the Country Economist.
D. The Country Operational Risk Committee (CORC) is a sub-committee of the CRC which exercises oversight of the Bank’s OR exposures to ensure that it is aligned with the Bank’s RMF. The CORC reviews the Bank’s significant risk exposures and ensures appropriateness and adequacy of mitigating action plans.
11
Risk review and disclosures under Basel III Framework for the period ended 31 Dec 2016
E. The Credit Issues Committee (CIC) is a sub-committee of the CRC which is responsible for identifying and monitoring corporate clients which show potential signs of weakness and/or may be exposed to higher risks. The CIC reviews the existing Early Alert, Retail and Group Special Assets Management (GSAM) portfolio and new accounts presented to the committee.
5.3. The Risk function
The CCRO manages the Risk function which is independent of the businesses. The role of the Risk function is: To maintain the RMF, ensuring it remains appropriate to the Bank’s activities and is effectively
communicated and implemented across the Bank and for administering related governance and reporting processes.
To uphold the integrity of the Bank’s risk/return decisions, and in particular for ensuring that risks are properly assessed, that risk/return decisions are made transparently on the basis of this proper assessment, and are controlled in accordance with its standards and risk appetite.
To exercise direct risk control ownership for credit, market, country cross-border, liquidity and operational risk types.
The Risk function is independent of the origination, trading and sales functions to ensure that the necessary balance in risk/return decisions is not compromised by short-term pressures to generate revenues. This is particularly important given that most revenues are recognised immediately while losses arising from risk positions only manifest themselves over time. In addition, the Risk function is a centre of excellence that provides specialist capabilities of relevance to risk management processes in the wider organisation. 5.4. Risk Appetite/Tolerance The Group/Bank manages its risks to build a sustainable franchise in the interests of all stakeholders. The Group Risk Tolerance Statement is the Standard Chartered PLC’s Board of Directors’ articulation of the amount of risk that the Group is willing to take in the pursuit of its strategic goals. The Risk Tolerance benchmarks provide a lens to identify risks and concentrations that may cause the Group to exceed its risk appetite. Within the Bank, these risks and concentrations are addressed and governed by various policies and frameworks (eg. RMF, Local Lending Policy, Liquidity Risk Framework, etc) which contain specific limits and parameters (i.e., risk thresholds) to manage them. A consolidation of the key thresholds is monitored on an on-going basis through the India RMF. 5.5. Stress Testing Stress testing and scenario analysis are used to assess the Bank’s ability to maintain operations during periods of severe but plausible stress conditions and to simulate the set of feasible management mitigating actions and their impact on the Bank’s earnings, risk profile and capital position, should such conditions materialise. These conditions may arise from economic, liquidity, legal, political or physical events, or from materialisation of risks that are unique to the Bank. The stress testing framework is designed to:
12
Risk review and disclosures under Basel III Framework for the period ended 31 Dec 2016
Contribute to the setting and monitoring of the Bank’s ability to take risk; Identify the key risks to strategy, financial position and reputation; Support the development of mitigating actions and contingency plans; Ensure effective governance, processes and systems are in place to co-ordinate and integrate stress testing; Inform senior management; and Ensure adherence to regulatory requirements. A Group level equivalent of STF, led by the Risk function with participation from the businesses, Group Finance, Global Research and GT, aims to ensure that the earnings and capital implications of specific stress scenarios are fully understood allowing informed mitigation actions and construction of contingency plans. This group forum generates and considers pertinent and plausible scenarios that have the potential to adversely affect the Group/Bank’s business. The India STF leverages on work done by Group and, in addition, reviews scenarios specific to the local context, including for ICAAP. Stress tests/impact analysis done in India during 2016-17 included RBI mandated bottom-up stress test and derivatives portfolio stress test, liquidity and price risk stress tests, etc. 6. DF 3 - Credit Risk: General disclosures DF 3 - Qualitative Disclosures Credit risk is the potential for loss due to the failure of counterparty to meet its obligations to pay the Bank in accordance with agreed terms. Credit exposures may arise from both, the banking and trading books. Credit risk is managed through a framework that sets out policies and procedures covering the measurement and management of credit risk. There is a clear segregation of duties between transaction originators who are in the business units and approvers in the risk function. All credit exposure limits are approved within a defined credit approval authority framework. 6.1. Credit Policies Group-wide credit policies and standards are considered and approved by the Group Risk Committee (GRC), which also oversees the delegation of credit approval and loan impairment provisioning authorities. Policies and procedures specific to each business are established and provide the outline for how credit risk should be monitored and managed in the Bank. These Group policies/procedures are customised locally to incorporate any local regulatory and governance needs. 6.2. Credit Assessment Process
For Corporate and Institutional (C&I) Clients
A pre-sanction appraisal is carried out by the relationship manager through a Business Credit Application (BCA). BCAs are reviewed and duly approved by the credit officer based on the authority delegation given to him. Every account is graded using an alphanumeric grading system for quantifying the risks associated with the counterparty. The grading is based on a Probability of Default (PD) measure, with clients analysed against a range of quantitative and qualitative measures. The numeric grades run from 1 to 14 and some of the grades are further sub-classified A, B or C. Lower credit grades are indicative of a lower likelihood of default. Credit grades 1A to 12C are assigned to performing clients or accounts, while credit grades 13 and 14 are assigned to non-performing or defaulted clients. The Bank’s credit grades are not intended to replicate external credit grades,
13
Risk review and disclosures under Basel III Framework for the period ended 31 Dec 2016
and ratings assigned by external ratings agencies are not used in determining the Bank’s internal credit grades. Nonetheless, as the factors used to grade a borrower may be similar, a borrower’s poor external rating is kept in mind while assessing his internal credit grade. Nominal Limits, Loss Given Default (LGD), Expected Loss, Exposure At Default (EAD) and RWA are used in the assessment of individual exposures and portfolio analysis. LGD is the credit loss incurred if an obligor defaults. Nominal Limits are used in the delegation of credit approval authority and must be calculated for every transaction to determine the appropriate level of approval. In accordance with the credit authority delegation, significant exposures are reviewed and approved centrally through a credit committee. All the credit facilities are subject to an annual credit review process. The Bank’s Credit Policy, including local/governance/regulatory needs, requires strict adherence to laid down credit procedures and deviations, if any, are approved and captured through the credit appraisal process. Deviation from pre defined policy and procedures/local regulations are flagged off and approved by the relevant authority, if allowed, to ensure that deviations are justified and appropriately approved to avoid any undue loss/risk to the Bank. For Retail Clients Standard application forms are used, which are processed in central units using largely automated processes. Where appropriate to the client, product or market, a manual approval process by SCB officers is in place. Origination and approval roles are segregated. Distribution of credit products through the new business channel is governed by the New Business Management and Risk Policy and Procedures, which among other requirements, lays down policies governing recruitment, verification, training and monitoring of sales staff. Credit decisions are independent of the sales/marketing functions and there are clear and specific delegated authorities. Regular assurance reviews thru Control Self Testing/Key Control Indicators and audits ensure compliance to policy and delegated authorities. Credit grades are based on a PD calculated using IRB score models. These models are based on application and behavioural scorecards which make use of external credit bureau information as well as the Bank’s own data. In case of portfolios where such IRB models have not yet been developed, the PD is calculated using portfolio delinquency flow rates and expert judgment, where applicable. An alphanumeric grading system identical to that for C&I clients is used as an index of portfolio quality. 6.3. Credit Approval All credit approval authorities are delegated by the Group Credit Approval Committee (CAC) to individuals based on their judgment and experience and based on a risk-adjusted scale which takes account of the estimated maximum potential loss from a given client or portfolio. Credit origination and approval roles are segregated in all exposures. 6.4. Credit Monitoring The Bank monitors its credit exposures and assesses the impact of trends in the macroeconomic environment which may impact its portfolio performance. For C&I clients, clients or portfolios are placed on ‘Early Alert’ when they display signs of actual or potential weakness. For example, where there is a decline in the client’s position within the industry, financial
14
Risk review and disclosures under Basel III Framework for the period ended 31 Dec 2016
deterioration, a breach of covenants, non-performance of an obligation within the stipulated period or there are concerns relating to ownership or management. Such accounts and portfolios are subjected to a dedicated process overseen by the CIC. Client account plans, documentation for existing facilities, and credit grades are re-evaluated. In addition, remedial actions are agreed and monitored. Remedial actions include, but are not limited to, exposure reduction, security enhancement, exiting the account or immediate movement of the account into the control of GSAM, the specialist recovery unit, which is independent of the main businesses. For Retail clients, portfolio delinquency trends are monitored and reviewed at pre determined frequency. Individual client behaviour is also tracked and is considered for lending decisions. Accounts which are past due are subject to a collections process, managed independently by the Risk function. Charged-off accounts are managed by a specialist recovery team. The micro and small-sized enterprise business is managed in small businesses segment. The credit processes are refined based on exposure at risk and are managed through Programmed Lending, in line with procedures for Retail clients. The CRC is responsible for the effective management of credit risk, among other risks. 6.5. Concentration Risk Credit concentration risk can arise from pools of exposures with similar characteristics which may lead to highly correlated changes in credit quality, for example individual large exposures or significantly large groups of exposures whose likelihood of default is driven by common underlying factors. Credit concentration risk is governed by the Group’s risk tolerance framework and Local Lending Policy (LLP) / Credit Approval Document (CAD); adherence to these policies is monitored by CMT. Credit concentration risk is managed via portfolio standards and within concentration caps set for counterparties or groups of connected counterparties, and for industry sectors, credit grade bands, business segments and collateralisation for C&I clients and by products for Retail clients. Credit concentration risk is principally managed based on three components: single-name borrower exposure, industry concentrations and product concentration. For managing single-name concentrations, the Bank monitors compliance to the single and group borrower regulatory guidelines. The LLP establishes industry and credit grade concentration limits. The CMT monitors adherence to these prescribed limits. Any excesses from the ceilings prescribed in the LLP are escalated to the CCRO/CRC/CMT for approval in accordance with the delegated authorities outlined in the LLP. For Retail clients, product concentration risk is managed through portfolio management approach in order to limit concentration, reduce volatility and improve profitability. As part of this approach, the Bank monitors product concentration on a bi-monthly basis. 6.6. Risk Reporting and Measurement Risk measurement plays a central role, along with judgment and experience, in informing risk-taking and portfolio management decisions. It is a primary area for sustained investment and senior management attention. Various risk measurement systems are available to risk officers to enable them to assess and manage the credit portfolio. As the Group has adopted IRB for credit risk under Basel II/III, these include systems to calculate nominal exposure, PD, LGD and EAD on a transaction, counterparty and portfolio basis. The Group has
15
Risk review and disclosures under Basel III Framework for the period ended 31 Dec 2016
implemented a single risk reporting system to aggregate risk data. This is used to generate management information to assist business and Risk users with risk monitoring and management. A number of internal risk management reports are produced on a regular basis, providing information on; individual counterparty, counterparty group, portfolio exposure, credit grade migration, the status of accounts or portfolios showing signs of weakness or financial deterioration, models performance and updates on credit markets. IRB portfolio metrics are widely used in these reports. Regular portfolio risk reports are made available at risk committee meetings. 6.7. Problem Credit Management and Provisioning Credit monitoring is a continuous process. The frequency for each type of monitoring processes is defined. For example, excesses and past dues are reviewed on daily basis by business and credit officials. Covenants and risk triggers are normally linked to an event e.g. quarter on quarter drop in sales, exchange rate, crude prices, etc. For corporate accounts identified in risk based manner, a Quarterly Performance Review (QPR) is also carried out. Account conduct is also tracked on a monthly basis in terms of past dues, excesses, documentation, compliance with covenants and progress on exit accounts through the Account Subject To Additional Review Process (ASTAR) reporting process. Potential problem credits are identified through the credit monitoring process and reported to the CIC for additional review. In addition, portfolio level review for both C&I and Retail clients is undertaken to track portfolio performance against local underwriting standards/Group policy. Outcomes of such reviews are placed before the CRC/CMT. C&I Exposures Loans are classified as impaired and considered non-performing where analysis and review indicates that full payment of either interest or principal becomes questionable, or as soon as payment of interest or principal is 90 days or more overdue. Impaired accounts are managed by GSAM. Specific provisions are made in accordance with the Bank’s internal policy, subject to minimum provisions required under the RBI guidelines. When all sources of recovery have been exhausted and no further source of recovery is apparent, then the debt is written off by applying the impairment provision held. Retail Exposures An account is considered to be delinquent when payment is not received on the due date. For credit cards, an account is required to be considered delinquent on the payment due date upon non receipt of payment till the payment due date plus 3 grace days. For delinquency reporting purposes, the Bank follows industry standards measuring delinquency as of 1, 30, 60 and 90 days past due. Accounts that are overdue are closely monitored. Loans are classified as impaired and considered non-performing where analysis and review indicates that full payment of either interest or principal becomes questionable, or as soon as payment of interest or principal is 90 days or more overdue. The process used for raising provisions adheres to minimum provisions required under the RBI guidelines. In case of unsecured products, outstanding balances are written off at 150 days past due except discretionary lending. Unsecured products under discretionary lending are fully provided for at 90 days past due. In case of secured products like Mortgages, provision is raised after considering the realisable value of the collateral. For

16
Risk review and disclosures under Basel III Framework for the period ended 31 Dec 2016
all products there are certain accounts such as cases involving fraud and death, where the loss recognition process is accelerated. The Bank also maintains general provision as a percentage of performing standard advances and on unhedged foreign currency exposures, as prescribed by the RBI, to cover the inherent risk of losses. The credit portfolio is monitored and reported to appropriate authorities in accordance with extant Group Policies/Procedures including Monitoring and Control Policy, Credit Initiation and Approval Policy and Risk Mitigation Policy, as well as extant local regulations/guidelines prescribed from time to time by RBI, e.g. Early Recognition of Financial Distress, Prompt Steps for Resolution and Fair Recovery for Lenders- Framework for Revitalising Distressed Assets in the Economy and reporting to Central Repository of Information on Large Credits (CRILC). DF 3 - Quantitative Disclosures a) Analysis of total gross credit risk exposures; fund based and non-fund based separately
(` in 000s)
1 Excluding provision on standard assets 2 Excluding credit lines which are unconditionally cancellable at the Bank’s sole discretion or, effectively provide for automatic cancellation of credit lines due to deterioration of borrower’s creditworthiness. 3 For non-fund based exposures, credit risk exposures or, equivalents are computed as under: In case of exposures other than Fx and derivative contracts, credit equivalent is arrived at by multiplying the
underlying contract or notional principal amounts with the credit conversion factors prescribed by the RBI under the Basel II/III capital framework.
In case of Fx and derivative contracts, credit equivalents are computed using the current exposure method which includes, two steps as under:
- Computation of current credit exposure, which is sum of the positive Mark to Market (MTM) value of the outstanding contracts.
31.12.2016 31.12.2015
Inter bank exposures 16,931,537 12,678,310
Investments (HTM) - -
Advances 749,540,132 731,372,031
Total gross fund based exposures 766,471,669 744,050,341
Specific provisions / Provisions for depreciation in the value of investment1 (84,262,736) (72,278,058)
Total net fund based exposures 682,208,933 671,772,283
Fx and derivative contracts 402,568,491 345,100,813
Guarantees, acceptances, endorsements and other obligations 310,281,888 306,973,996
Other commitments and credit l ines 2 60,814,170 48,297,970
Total gross non-fund based exposures3 773,664,549 700,372,779
Specific provisions (737) (737)
Total net non fund based exposures 773,663,812 700,372,042
Nature & category of exposures Credit risk exposures
17
Risk review and disclosures under Basel III Framework for the period ended 31 Dec 2016
- Potential future credit exposure (PFE), which is determined by multiplying the notional principal amounts by the relevant ‘add-on’ factor based on tenor and type of underlying contracts.
b) Analysis of geographic distribution of exposures; fund based and non-fund based separately
As all the exposures under Para (a) above are domestic, the analysis of geographic distribution of exposures into fund and non-fund based has not been disclosed separately.
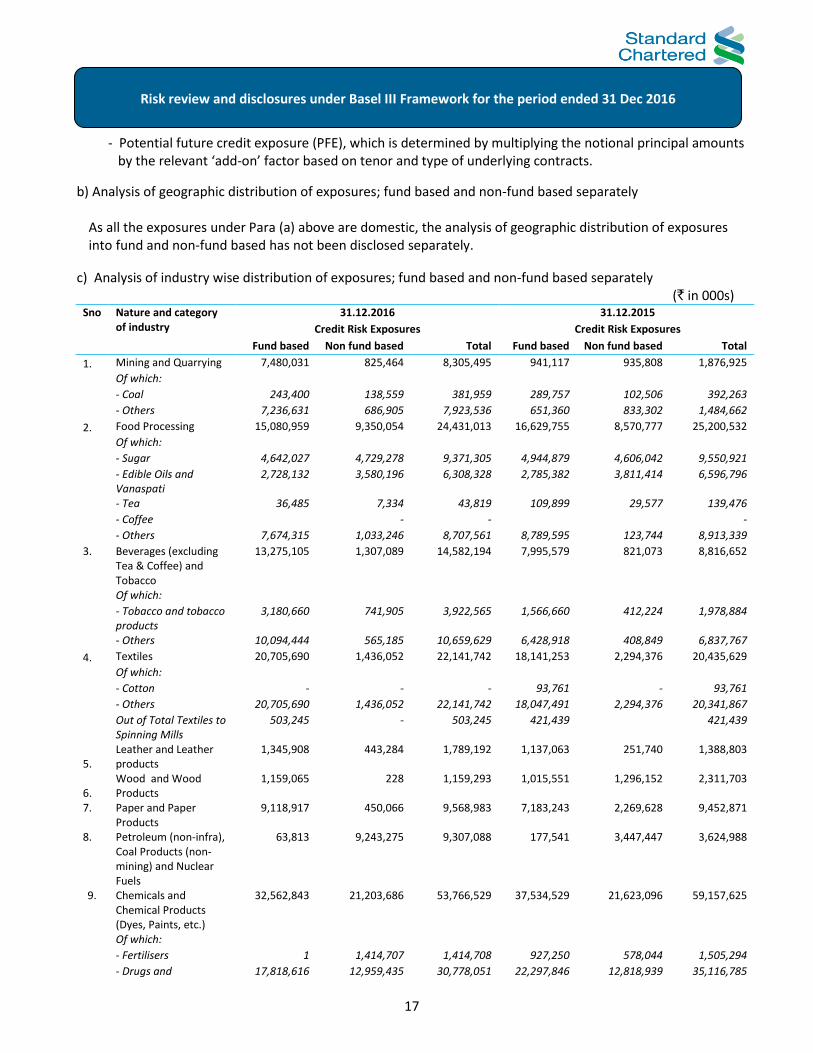
c) Analysis of industry wise distribution of exposures; fund based and non-fund based separately (` in 000s)
Sno Nature and category of industry
31.12.2016 31.12.2015
Credit Risk Exposures Credit Risk Exposures
Fund based Non fund based Total Fund based Non fund based Total
1. Mining and Quarrying 7,480,031 825,464 8,305,495 941,117 935,808 1,876,925
Of which:
- Coal 243,400 138,559 381,959 289,757 102,506 392,263
- Others 7,236,631 686,905 7,923,536 651,360 833,302 1,484,662
2. Food Processing 15,080,959 9,350,054 24,431,013 16,629,755 8,570,777 25,200,532
Of which:
- Sugar 4,642,027 4,729,278 9,371,305 4,944,879 4,606,042 9,550,921
- Edible Oils and Vanaspati
2,728,132 3,580,196 6,308,328 2,785,382 3,811,414 6,596,796
- Tea 36,485 7,334 43,819 109,899 29,577 139,476
- Coffee - - -
- Others 7,674,315 1,033,246 8,707,561 8,789,595 123,744 8,913,339
3. Beverages (excluding Tea & Coffee) and Tobacco
13,275,105 1,307,089 14,582,194 7,995,579 821,073 8,816,652
Of which:
- Tobacco and tobacco products
3,180,660 741,905 3,922,565 1,566,660 412,224 1,978,884
- Others 10,094,444 565,185 10,659,629 6,428,918 408,849 6,837,767
4. Textiles 20,705,690 1,436,052 22,141,742 18,141,253 2,294,376 20,435,629
Of which:
- Cotton - - - 93,761 - 93,761
- Others 20,705,690 1,436,052 22,141,742 18,047,491 2,294,376 20,341,867
Out of Total Textiles to Spinning Mills
503,245 - 503,245 421,439 421,439
5. Leather and Leather products
1,345,908 443,284 1,789,192 1,137,063 251,740 1,388,803
6. Wood and Wood Products
1,159,065 228 1,159,293 1,015,551 1,296,152 2,311,703
7. Paper and Paper Products
9,118,917 450,066 9,568,983 7,183,243 2,269,628 9,452,871
8. Petroleum (non-infra), Coal Products (non-mining) and Nuclear Fuels
63,813 9,243,275 9,307,088 177,541 3,447,447 3,624,988
9. Chemicals and Chemical Products (Dyes, Paints, etc.)
32,562,843 21,203,686 53,766,529 37,534,529 21,623,096 59,157,625
Of which:
- Fertilisers 1 1,414,707 1,414,708 927,250 578,044 1,505,294
- Drugs and 17,818,616 12,959,435 30,778,051 22,297,846 12,818,939 35,116,785

18
Risk review and disclosures under Basel III Framework for the period ended 31 Dec 2016
Pharmaceuticals
- Petro-chemicals (excluding under Infrastructure)
5,577,417 3,040,897 8,618,314 6,296,221 2,387,957 8,684,178
- Others 9,166,809 3,788,647 12,955,456 8,013,212 5,838,156 13,851,368
10. Rubber, Plastic and their Products
4,575,322 2,968,489 7,543,811 3,871,870 2,734,464 6,606,334
11. Glass & Glassware 1,393,145 2,075,188 3,468,333 1,548,418 1,807,256 3,355,674
12. Cement and Cement Products
13,027,839 2,564,220 15,592,059 13,985,030 1,581,748 15,566,778
13. Basic Metal and Metal Products
38,666,216 18,287,767 56,953,983 41,568,926 18,658,398 60,227,324
Of which:
- Iron and Steel 22,973,711 12,315,917 35,289,628 20,525,315 12,758,780 33,284,095
- Other Metal and Metal Products
15,692,505 5,971,850 21,664,355 21,043,611 5,899,618 26,943,229
14. All Engineering 26,182,978 33,533,569 59,716,547 29,008,191 26,515,850 55,524,041
Of which:
- Electronics 4,461,011 14,700,211 19,161,222 5,158,802 7,690,304 12,849,106
- Others 21,721,967 18,833,358 40,555,325 23,849,389 18,825,546 42,674,935
15. Vehicles, Vehicle Parts and Transport Equipments
16,072,720 7,541,071 23,613,791 20,420,968 8,479,780 28,900,748
16. Gems & Jewellery 13,641,302 4,691,756 18,333,058 21,262,769 3,642,655 24,905,424
17. Construction 8,957,172 7,622,703 16,579,875 9,086,082 10,267,200 19,353,282
18. Aviation 4,593,125 25,361,851 29,954,976 6,181,541 23,121,146 29,302,687
19. Infrastructure 49,176,426 44,418,107 93,594,533 81,034,819 38,880,372 119,915,191
Of which:
- Roads and Bridges 13,082,781 3,269,269 16,352,050 13,563,897 3,357,533 16,921,430
- Ports - -
- Inland Waterways 6,405,410 4,970,987 11,376,397 7,357,617 5,371,525 12,729,142
- Airport 221,793 764,113 985,906 229,141 735,153 964,294
- Railway Track, tunnels, viaducts, bridges
- - - - - -
- Electricity (Generation)
3,709,856 11,947,539 15,657,395 1,812,363 6,651,019 8,463,382
- Oil/Gas/Liquefied Natural Gas (LNG) storage facility
29,920 8,799 38,719 28,468 1,406 29,874
- Communication 20,990,057 10,759,998 31,750,055 53,433,224 11,691,059 65,124,283
- Other Infrastructure 4,736,608 12,697,403 17,434,011 4,610,109 11,072,677 15,682,786
20. Trading & NBFC 57,052,503 6,086,692 63,139,195 35,626,243 8,271,463 43,897,706
21. Mortgage 139,098,033 - 139,098,033 107,531,768 - 107,531,768
22. Retail Others 61,155,560 1,328,508 62,484,068 70,060,003 1,328,508 71,388,511
23. Real Estate 91,386,560 696,980 92,083,540 87,876,418 1,146,435 89,022,853
24. Other Industries 123,768,900 108,845,788 232,614,688 111,553,354 119,028,624 230,581,978
Total Gross Advances 749,540,132 310,281,888 1,059,822,019 731,372,031 306,973,996 1,038,346,026
Specific provisions (84,262,736) (737) (84,263,473) (72,278,058) (737) (72,278,795)
Total Net Advances 665,277,396 310,281,151 975,558,546 659,093,973 306,973,259 966,067,231
Total Inter-bank exposures
16,931,537 - 16,931,537 12,678,310 - 12,678,310
Total Investments (HTM)
-
-
-
-
- -

19
Risk review and disclosures under Basel III Framework for the period ended 31 Dec 2016
Fund based exposure comprises loans and advances, inter-bank exposures and HTM Investments. Non-fund based exposure comprises guarantees, acceptances, endorsements and letters of credit. d) Analysis of residual contractual maturity of assets As at 31 Dec 2016 (` in 000s)
Maturity Bucket Cash and Bank balances with
RBI
Balances with Banks and money at call
and short notice
Investments Advances Fixed Assets
Other Assets
1day (d) 4,814,787 6,426,658 109,707,432 36,996,175 - 7,422,675
2d-7d 3,514,541 46,783,748 18,231,679 26,720,920 - 4,113,891
8d - 14d 3,581,359 65,000 18,578,302 31,612,201 - 835,219
15d - 30d 3,405,108 24,000 20,660,996 42,016,894 - 3,015,936
31m - 2month (m) 3,890,212 127,000 21,033,726 49,544,430 - 30,191,069
2m - 3month (m) 3,110,654 - 19,991,696 48,005,388 - 14,028,703
3m - 6m 2,429,888 - 12,605,045 40,775,584 - 17,240,319
6m - 1year (y) 2,347,160 - 13,337,636 36,100,492 - 21,565,592
1y - 3y 9,036,606 30,130 72,849,669 145,298,493 - 38,405,008
3y - 5y 2,149 - 10,947,243 63,273,497 - 21,029,513
> 5y 211,727 - 1,232,415 144,803,335 14,069,485 53,895,888
Total 36,344,191 53,456,536 319,175,839 665,147,409 14,069,485 211,743,813
As at 31 Dec 2015 (` in 000s)
Maturity Bucket Cash and Bank balances with
RBI
Balances with Banks and money at call
and short notice
Investments Advances Fixed Assets
Other Assets
1day (d) 2,996,106 34,075,269 124,668,609 15,184,496 - 7,106,192
2d-7d 2,817,030 8,348,375 15,141,741 51,132,008 - 2,769,529
8d - 14d 3,153,033 92,500 18,800,432 62,785,367 - 874,619
15d - 30d 2,221,691 104,000 15,058,002 48,948,068 - 5,294,890
31m - 2month (m) 2,018,763 197,000 12,354,841 56,935,033 - 7,059,687
2m - 3month (m) 1,737,541 - 9,722,922 40,176,892 - 48,024,440
3m - 6m 2,541,004 - 13,657,898 63,841,078 - 1,201,955
6m - 1year (y) 3,503,464 - 20,052,379 29,792,588 - 1,466,038
1y - 3y 8,775,314 34,000 62,924,724 82,593,481 - 21,436,170
3y - 5y 18,362 - 5,459,955 73,503,638 - 15,902,816
> 5y 224,581 - 1,151,395 134,195,778 14,120,665 50,039,718
Total 30,006,889 42,851,144 298,992,898 659,088,427 14,120,665 161,176,054
The above has been prepared on similar guidelines as used for the statement of structural liquidity.
20
Risk review and disclosures under Basel III Framework for the period ended 31 Dec 2016
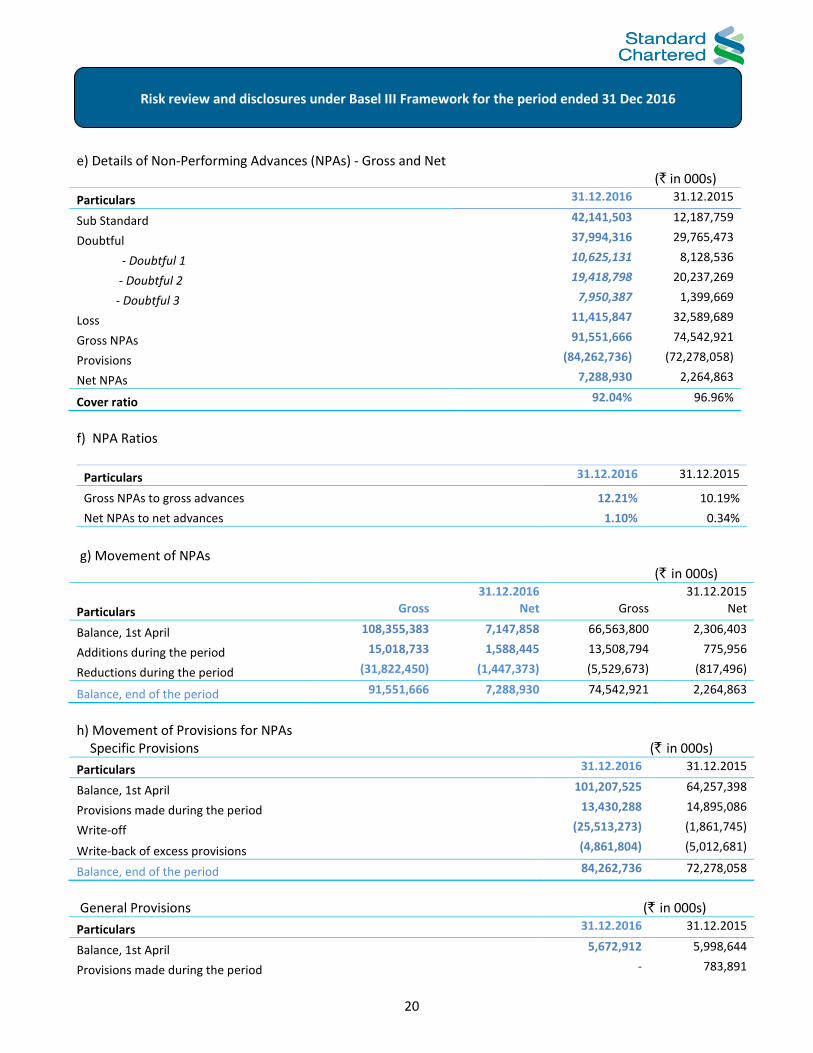
e) Details of Non-Performing Advances (NPAs) - Gross and Net (` in 000s)
Particulars 31.12.2016 31.12.2015
Sub Standard 42,141,503 12,187,759
Doubtful 37,994,316 29,765,473
- Doubtful 1 10,625,131 8,128,536
- Doubtful 2 19,418,798 20,237,269
- Doubtful 3 7,950,387 1,399,669
Loss 11,415,847 32,589,689
Gross NPAs 91,551,666 74,542,921
Provisions (84,262,736) (72,278,058)
Net NPAs 7,288,930 2,264,863
Cover ratio 92.04% 96.96%
f) NPA Ratios
Particulars 31.12.2016 31.12.2015
Gross NPAs to gross advances 12.21% 10.19%
Net NPAs to net advances 1.10% 0.34%
g) Movement of NPAs (` in 000s)
Particulars
31.12.2016 31.12.2015
Gross Net Gross Net
Balance, 1st April 108,355,383 7,147,858 66,563,800 2,306,403
Additions during the period 15,018,733 1,588,445 13,508,794 775,956
Reductions during the period (31,822,450) (1,447,373) (5,529,673) (817,496)
Balance, end of the period 91,551,666 7,288,930 74,542,921 2,264,863
h) Movement of Provisions for NPAs Specific Provisions (` in 000s)
Particulars 31.12.2016 31.12.2015
Balance, 1st April 101,207,525 64,257,398
Provisions made during the period 13,430,288 14,895,086
Write-off (25,513,273) (1,861,745)
Write-back of excess provisions (4,861,804) (5,012,681)
Balance, end of the period 84,262,736 72,278,058
General Provisions (` in 000s)
Particulars 31.12.2016 31.12.2015
Balance, 1st April 5,672,912 5,998,644
Provisions made during the period - 783,891

21
Risk review and disclosures under Basel III Framework for the period ended 31 Dec 2016
Write-off - -
Write-back of excess provisions (352,258) (352,484)
Balance, end of the period 5,320,654 6,430,051
(` in 000s) Particulars 31.12.2016 31.12.2015
Write-off that have been booked directly to the income statement 14,196 586,694
Recoveries that have been booked directly to the income statement 480,619 499,884
i) Movement of Non-Performing Investments and amount of Provisions held for Non-Performing Investments (` in 000s) Particulars 31.12.2016 31.12.2015
Balance, 1st April 2,317,508 2,130,883
Additions during the period 178,546 294,280
Reductions during the period (618,865) (124,345)
Balance, end of the period 1,877,189 2,300,818
Total provisions held at the end of the period 1,699,753 2,186,597
j) Movement of Provisions for Depreciation on Investments
(` in 000s)
Particulars 31.12.2016 31.12.2015
Balance, 1st April
2,768,067 2,662,721
Provisions made during the period
588,377 105,457
Write-off
- (21,344)
Write-back of excess provisions
(1,074,000) (220,743)
Any other adjustments, including transfer between provisions
- (111,650)
Balance, end of the period 2,282,444 2,414,440
k) NPA by Major Industries (Top 5 Industries):
(` in 000s) Industry
Name Gross NPA Specific
provisions General
Provisions Specific provision during the
current period Write-off during the
current period
31 Dec 2016 53,461,146 48,460,753 - (17,393,446) 18,786,076
31 Dec 2015 46,601,500 45,311,500 - 4,907,308 325,300

22
Risk review and disclosures under Basel III Framework for the period ended 31 Dec 2016
7. DF 4 - Credit Risk: Disclosures for portfolios subject to the standardised approach
DF 4 - Qualitative Disclosures As per the provisions of the Basel framework in India, SCBI has adopted the SA for measurement of credit risk. The risk weights applied under the SA are prescribed by the RBI and are based on the asset class to which the exposure is assigned. This approach permits use of external ratings for credit exposures to counterparties in the category of sovereigns, international banks, corporate and securitisation exposures. The specified credit rating agencies used for these types of exposures are as under:
Domestic Credit Rating Agencies International Credit Rating Agencies
Credit Rating Information Services of India Limited Standard and Poor’s ICRA Limited Moody’s India Ratings and Research Private Limited (India Ratings) Credit Analysis and Research Limited SME Rating Agency of India Limited Brickworks Ratings India Pvt. Limited
Rated facilities have generally been considered as those facilities where the Bank’s exposure has been explicitly considered; else, the exposure has been treated by the Bank as unrated. The process used to transfer public issue ratings onto comparable assets in the banking book is in accordance with the requirements laid down by RBI. DF 4 - Quantitative Disclosures Analysis of outstanding credit exposures (after considering credit risk mitigation) and credit risk by regulatory risk weight As at 31 Dec 2016 (` in 000s)
< 100% 100% > 100% Deduction
from capital
Inter bank exposures 16,931,537 - 16,931,537 16,931,537 - - -
Investments (HTM) - - - - - - -
Advances 749,540,132 (30,457,156) 719,082,976 245,715,117 349,906,270 123,461,589 -
Total fund based
exposures
766,471,669 (30,457,156) 736,014,513 262,646,654 349,906,270 123,461,589 -
Fx and derivative
contracts
402,568,491 - 402,568,491 325,907,395 43,711,438 32,949,658 -
Guarantees,Acceptances,
endorsements and other
obligations
310,281,888 (3,956,295) 306,325,593 60,215,769 100,337,299 145,772,525 -
Undrawn Commitments
and others
60,814,170 - 60,814,170 - 50,061,061 10,753,109 -
Total non fund based
exposures
773,664,549 (3,956,295) 769,708,254 386,123,164 194,109,798 189,475,292 -
Nature & category of
exposures
Total gross credit
exposure
Credit risk mitigation Net exposure (before
provision)
Credit risk weight buckets summary

23
Risk review and disclosures under Basel III Framework for the period ended 31 Dec 2016
As at 31 Dec 2015 (` in 000s)
8. DF 13 - Main Features of Regulatory Capital Instruments
As of 31 Dec 2016, there were no regulatory capital instruments issued by SCBI.
9. Leverage Ratio
The bank is required to maintain a minimum leverage ratio of 4.5%. The bank’s leverage ratio, calculated in accordance with the RBI guidelines under consolidated framework is 10.73% as of 31 Dec 2016 (Previous Year: 11.04%).
DF-18 Quantitative disclosures
Leverage ratio common disclosure as of 31 Dec 2016 (` in M)
31 Dec 2016 31 Dec 2015
Sr. No. Item Solo Consol Solo Consol
On-balance sheet exposures
1 On-balance sheet items (excluding derivatives and SFTs, but including collateral)
1,151,980 1,172,882 1,103,901 1,120,866
2 (Asset amounts deducted in determining Basel III Tier 1 capital)
(17,349) (16,599) (34,717) (34,856)
3 Total on-balance sheet exposures (excluding derivatives and SFTs) (sum of lines 1 and 2)
1,134,632 1,156,283 1,069,184 1,086,010
On-balance sheet exposures
4 Replacement cost associated with all derivatives transactions (i.e. net of eligible cash variation margin)
118,124 118,124 92,157 92,157
< 100% 100% > 100% Deduction
from capital
Inter bank exposures 12,678,310 - 12,678,310 12,678,310 - - -
Investments (HTM) - - - - - - -
Advances 731,372,031 (24,880,429) 706,491,602 229,837,016 285,632,318 191,022,268 -
Total fund based
exposures
744,050,341 (24,880,429) 719,169,912 242,515,326 285,632,318 191,022,268 -
Fx and derivative
contracts
345,100,813 - 345,100,813 248,111,748 69,469,749 27,519,316 -
Guarantees,Acceptances,
endorsements and other
obligations
306,973,996 (2,471,941) 304,502,055 78,682,759 112,824,745 112,994,551 -
Undrawn Commitments
and others
48,297,970 - 48,297,970 - 34,278,544 14,019,426 -
Total non fund based
exposures
700,372,779 (2,471,941) 697,900,838 326,794,507 216,573,038 154,533,293 -
Nature & category of
exposures
Total gross
credit
exposure
Credit risk
mitigation
Net exposure
(before
provision)
Credit risk weight buckets summary

24
Risk review and disclosures under Basel III Framework for the period ended 31 Dec 2016
5 Add-on amounts for PFE associated with all derivatives transactions
306,294 306,294 271,023 271,023
6 Gross-up for derivatives collateral provided where deducted from the balance sheet assets pursuant to the operative accounting framework
- - - -
7 (Deductions of receivables assets for cash variation margin provided in derivatives transactions)
- - - -
8 (Exempted CCP leg of client-cleared trade exposures)
(46,418) (46,418) (13,579) (13,579)
9 Adjusted effective notional amount of written credit derivatives
- - - -
10 (Adjusted effective notional offsets and add-on deductions for written credit derivatives)
- - - -
11 Total derivative exposures (sum of lines 4 to 10) 378,000 378,000 349,601 349,601
Securities financing transaction exposures
12 Gross SFT assets (with no recognition of netting), after adjusting for sale accounting transactions
36,526 36,526 16,973 16,973
13 (Netted amounts of cash payables and cash receivables of gross SFT assets)
- - (2,950) (2,950)
14 CCR exposure for SFT assets - - 9 9
15 Agent transaction exposures - - - -
16 Total securities financing transaction exposures (sum of lines 12 to 15)
36,526 36,526 14,032 14,032
Other off-balance sheet exposures
17 Off-balance sheet exposure at gross notional amount
1,277,079 1,277,079 1,196,360 1,196,610
18 (Adjustments for conversion to credit equivalent amounts)
(849,271) (849,271) (786,094) (786,294)
19 Off-balance sheet items (sum of lines 17 and 18) 427,808 427,808 410,266 410,316
Capital and total exposures
20 Tier 1 capital 204,468 214,409 195,066 205,362
21 Total exposures (sum of lines 3, 11, 16 and 19) 1,976,965 1,998,616 1,843,084 1,859,959
Leverage ratio
22 Basel III leverage ratio 10.34% 10.73% 10.58% 11.04%


![Disclosures Mar10[1] Basel 3](https://img.dokumen.tips/doc/110x75/577d365d1a28ab3a6b92e0f6/disclosures-mar101-basel-3.jpg)