Embed Size (px)
Citation preview

471 | P a g e
RISK-RETURN TRADE-OFF, VOLATILITY
BEHAVIOUR AND LEVERAGE EFFECT IN INDIAN
BANKING SECTOR
Dr. Vandana Dangi
Commerce Department, Government College, Badli, DGHE (Haryana), (India)
ABSTRACT
Indian banking sector is well known for its capital potency and financial inclusion ideology. Investors consider
this sector as an attractive and reliable investment alternative. They need to study the risk-return relationship
and volatility behaviour of Indian banking sector. The present study is an attempt to investigate the risk-return
trade-off, volatility behaviour and leverage effect in Indian banking sector indices of BSE Bankex and CNX
Bank. The daily banking sector indices for the period of January 2004 to September 2015 were taken from the
online database maintained by the Bombay Stock Exchange Ltd. and the National Stock Exchange Ltd. The data
was initially studied for stationarity with the help of Augmented Dickey–Fuller test and then studied for
autoregressive conditional heteroscedasticity with the help of Engle's ARCH test and Breush-Godfrey-Pagan
test. The results confirmed that the return series of BSE Bankex and CNX Bank are stationary. The ARCH effect
is also present in both return series. GARCH-M model was applied to study the risk-return trade-off and
EGARCH model was employed to study the leverage effect in BSE Bankex and CNX Bank return series. The test
results confirm the presence of highly persistent volatility and asymmetric leverage effect in BSE Bankex and
CNX Bank return series. But there is no evidence of risk-return relationship in both series. The conditional
variance of these returns series indicate smaller reaction to past positive shocks as compared to the negative
shocks of the equal magnitude. The estimation of impact of news on volatility is vital for investors to explore the
riskiness in their investment.
Keywords: Asymmetries, Autoregressive Conditional Heteroskedasticity, EGARCH, GARCH-M,
Risk-Return Trade-Off, Stationarity And Volatility Clustering.
I. INTRODUCTION
Indian banking sector has emerged as one of the most reliable and attractive investment avenues for investors.
The prediction of risk-return tradeoff in financial market is vital for investors. This tradeoff indicates a measure
of risk exposure in their investment. The exploration of behavior of volatility in returns is also very important
for investors. Investors need to find either the return series have symmetrical or asymmetrical response to
different kind of news. So, investors study the impact of news on volatility i.e. the leverage effect. The accurate
modeling and estimating of the variance has received a lot of attention among academicians and investors.
Engle (1982)[1] had proposed ARCH process to model time varying conditional variance by using past
disturbances. Bollerslev (1986)[2] further generalized the ARCH process. The conditional variance was

472 | P a g e
considered as a function of prior period’s squared errors and its past conditional variances. The introduction of
ARCH models by Engle and their generalization by Bollerslev had refined the approach to model the
conditional volatility that capture the stylized characteristics of the financial data in better way. Crouhy Michel
and Rockinger Michael (1997)[3] applied AT-GARCH (1,1) model to study the volatility behaviour. They
found that bad news was discounted very speedily in volatility. However, good news had a very small impact
on the volatility. Robert A. Connolly and Christopher T. Stivers (1999)[4] studied variations in the volatility
relation between the conditional variance of individual firm returns and yesterday’s market return shock by
using daily equity returns of large-capitalization firms in Japan and the U.K. They concluded that volatility
clustering is not attributable to an autocorrelated news-generation process around public information. Kaur,
Harvinder (2004)[5] employed various volatility estimators and diagnostic tests to investigate the nature and
characteristics of volatility in the Indian stock market. She found that volatility clustering, asymmetry, intra-
week and intra-year seasonality, spillover between the US and Indian markets were present in Sensex and Nifty.
Connolly, Robert A. and Stivers, Christopher Todd (2005)[6] studied volatility clustering in the daily stock
returns at index and firm level. They noticed decline in the relation between a day’s index return shock to its
next period's volatility when important macroeconomic news was released. They finally concluded
that volatility clustering was strong when there were disperse beliefs about the market's information signal.
Bhaskar Sinha (2006)[7] modelled the presence of volatility in the inter day returns in the Sensex of the
Bombay Stock Exchange and the Nifty of the National Stock Exchange. He employed asymmetric GARCH
family of models and concluded that EGARCH and GJR-GARCH model successfully explain the conditional
variance in the returns from Sensex (BSE) and Nifty (NSE) respectively. Sarangi, Sibani Prasad and Patnaik, K.
Uma Shankar (2006)[8] used family of GARCH techniques to capture time varying nature
of volatility and volatility clustering in the returns of S&P CNX Nifty, Nifty Junior and S&P 500 index. They
found that there were no significant changes in the volatility of the spot market of the S&P CNX Nifty Index
but there was change in the structure of the volatility to some extent. They also found that the new information
was assimilated into prices more rapidly than before indicating decline in the persistence of volatility in the
indexes since the inception of futures trading. Ahmed, Shahid (2007)[9] employed GARCH family models to
explore the persistence and volatility clustering in NSE Nifty and BSE Sensex. He found persistence
and volatility clustering in both indexes. He further concluded that GARCH-M performs better as compared to
alternative econometric models while forecasting returns. Bose Suchismita (2007)[10] examined the
characteristics of return volatilities in the NSE Nifty index and its futures market. She found mean reversion
and volatility clustering in both series. There was fair degree of volatility persistence in the equity market and
its future index market. Surya Bahadur G.C (2008)[11] modelled volatility of the Nepalese stock market using
daily return series from July 2003 to Feb 2009. He had applied different classes of estimators
and volatility models to understand the pattern of volatility. He found GARCH(1,1) model as the most
appropriate for volatility modelling in the Nepalese market. There was no significant asymmetry in the
conditional volatility of returns. He finally concluded that there was time-varying volatility in the Nepalese
stock market (i.e. volatility clustering) and a high persistence predictability of volatility. Thiripalraju, Dr. M.
and H., Rajesh Acharya (2010)[12] modelled the volatility of the various indices of NSE and BSE. They
found volatility clustering in the daily returns of indices of NSE and BSE. They estimated different GARCH

473 | P a g e
models for various indices of two premier Indian stock exchanges. They found that GARCH(1, 1) with MA(1)
in the mean equation fit better as compared to other models. They further concluded that there was
volatility transmission between the two markets. Ramlall Indranarain (2010)[13] studied the impact of the credit
crunch on the volatility clustering and leverage effects in major international stock markets. He studied the
impact with GARCH (1, 1), GJR and news impact curves techniques. He found that GARCH fits all the stock
markets except for SEMDEX. He found volatility clustering in NASDAQ, DJIA and HANG SENG stock
markets. He noticed leverage effects in the post crisis period only in case of emerging markets such as JSE and
SSEC. Mahmud, Mahreen and Mirza, Nawazish (2011)[14] modelled and forecasted the volatility before and
during the financial crisis in the stocks traded at the KSE (Karachi Stock Exchange). They found
volatility clustering and asymmetries in the return series. They applied GARCH family of models capability of
the EGARCH(1,1) model at forecasting for both periods lending support to the use of GARCH family of
models for emerging markets during crisis. Joshi, Prashant Mahesh and Pandya, Kiran (2012)[15]
investigated volatility in the stock markets of India and Canada by using various volatility and diagnostic tests
on daily closing price data from January 2002 to July 2009. They found conditional heteroscedasticity in both
the stock markets. Their findings revealed that the GARCH(1, 1) model successfully capture the time-
varying volatility. The persistence of volatility in Indian stock market was marginally less than Canadian stock
market. Lin, Pin-te and Fuerst, Franz (2013)[16] applied a Lagrange multiplier test for the autoregressive
conditional heteroskedasticity effects and an exponential generalized autoregressive conditional
heteroskedasticity-in-mean model to assess the similar financial characteristics of regional house prices and
stock indices in Canada. They found that volatility clustering, positive risk-return relationships and leverage
effects exist in the majority of provincial housing markets of Canada. They further concluded that volatility
behaviours differ across provinces. Moussa, Wided Ben (2014)[17] used multivariate GARCH models to
describe the risk-return relationship in the banking industry of Malaysia, Thailand, Indonesia, Korea and
Philippines. He found time-variation in volatility consistent with empirical observations. He adopted the factor
approach to incorporate intra-industry contagion within the banking sector. He concluded that the
interdependencies exist in all five countries and they are sensitive to higher size. Studies conducted on volatility
in financial markets have completely negated the volatility as a constant and unconditional statistics. They had
confirmed the presence of volatility clustering in the overall returns indices. But there is lack of exploration of
dynamics of volatility in Indian banking sector indices. The present study is an attempt to fill this lacuna by
exploring the risk-return trade-off, volatility behaviour and leverage effect in Indian banking sector.
II. OBJECTIVE OF THE STUDY
The present treatise attempts to investigate the risk-return trade-off, volatility behaviour and leverage effect in
two leading Indian banking sector indices i.e. BSE Bankex and CNX Bank of the Bombay Stock Exchange Ltd.
and the National Stock Exchange Ltd. respectively.

474 | P a g e
III. RESEARCH METHODOLOGY
3.1 Database
The daily stock price data of BSE Bankex and CNX Bank for the period of January 2004 to September 2015
have been taken from the online database maintained by the Bombay Stock Exchange Ltd. and the National
Stock Exchange Ltd. BSE Bankex indices reflect the performance of banking sector stocks listed on the Bombay
Stock Exchange Ltd. This index is based on the free float methodology of index construction. It includes the
stocks of UTI Bank Ltd, Indian Overseas Bank, Kotak Mahindra Bank, UCO Bank, Jammu & Kashmir Bank,
Centurion Bank Ltd, Vijaya Bank, Allahabad Bank Ltd, Karnataka Bank Ltd, Indusind Bank Ltd, Federal Bank
Ltd, Yes Bank Ltd, IDBI Bank Ltd and Indusind Bank Ltd. These stocks represent almost ninety percent of the
total market capitalization of all banking sector stocks in India. The other index is CNX Bank Index. It includes
twelve stocks from the banking sector that trade on the National Stock Exchange Ltd. It is comprised of the
large capitalised and most liquid Indian banking stocks. It is computed using free float market capitalization
method. The top ten constituents in the index are HDFC Bank Ltd., ICICI Bank Ltd. State Bank of India, Axis
Bank Ltd., Kotak Mahindra Bank Ltd., IndusInd Bank Ltd., Bank of Baroda, Yes Bank Ltd., Punjab National
Bank and Bank of India.
3.2 Econometric Methodology
The present study uses the log difference of closing prices of two successive periods to calculate the rate of
return as the volatility in BSE Bankex and CNX PSU indices has been estimated on return. The log difference is
expressed in percentage terms because it eases comparability. The series of both indices have been converted
into return series by applying the following formula:
(1)
where is the return for day t, is closing prices for day t, is the closing prices of previous trading day
and is natural log.
The data is initially studied for stationarity with the help of Augmented Dickey–Fuller test. The data is further
tested for autoregressive conditional heteroscedasticity with the help of Engle's ARCH test and Breush-
Godfrey-Pagan test because the ordinary least square equation may mislead in case of time varying variance.
The residuals from the ordinary least square regression equation is tested for ARCH effect to verify either the
assumption of constant variance holds good or it is time varying. GARCH-in-the-Mean Model developed by
Engle, Lilien and Robins (1987)[18] is applied to study the risk-return trade-off. This model basically allows
volatility to enter in the mean equation as an explanatory variable. But, GARCH-M model enforces a systematic
response to positive and negative shocks. So, the Nelson’s (1991)[19] Exponential Generalised Autoregressive
Conditional Heteroscedasticity (EGARCH) model which allows asymmetries is modelled to capture the
leverage effect of volatility. A peculiar point to note here is that there is no need for artificially imposing the
non-negativity constraints for the EGARCH Model parameters. The EGARCH(1,1) model is defined as
follows:
γ ( / ” (2)
Where ( ) is conditional variance
475 | P a g e
γ , and β are parameters
represents the symmetric effect i.e. GARCH effect
β measures the persistence level in conditional volatility
γ measures the leverage effect
If the value of γ = 0, then it indicates that the model is symmetric. In case γ < 0 , then good news generate less
volatility than bad news. When γ > 0 , it indicates that good news are more destabilizing than bad news.
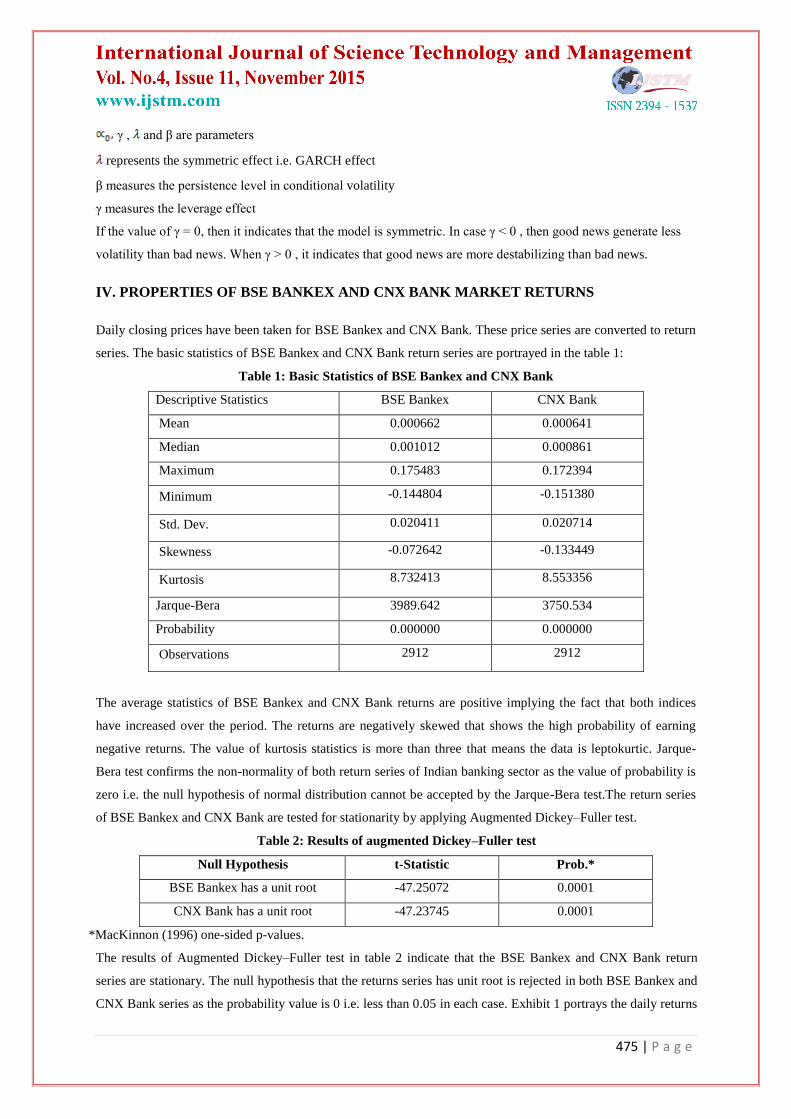
IV. PROPERTIES OF BSE BANKEX AND CNX BANK MARKET RETURNS
Daily closing prices have been taken for BSE Bankex and CNX Bank. These price series are converted to return
series. The basic statistics of BSE Bankex and CNX Bank return series are portrayed in the table 1:
Table 1: Basic Statistics of BSE Bankex and CNX Bank
Descriptive Statistics BSE Bankex CNX Bank
Mean 0.000662 0.000641
Median 0.001012 0.000861
Maximum 0.175483 0.172394
Minimum -0.144804 -0.151380
Std. Dev. 0.020411 0.020714
Skewness -0.072642 -0.133449
Kurtosis 8.732413 8.553356
Jarque-Bera 3989.642 3750.534
Probability 0.000000 0.000000
Observations 2912 2912
The average statistics of BSE Bankex and CNX Bank returns are positive implying the fact that both indices
have increased over the period. The returns are negatively skewed that shows the high probability of earning
negative returns. The value of kurtosis statistics is more than three that means the data is leptokurtic. Jarque-
Bera test confirms the non-normality of both return series of Indian banking sector as the value of probability is
zero i.e. the null hypothesis of normal distribution cannot be accepted by the Jarque-Bera test.The return series
of BSE Bankex and CNX Bank are tested for stationarity by applying Augmented Dickey–Fuller test.
Table 2: Results of augmented Dickey–Fuller test
Null Hypothesis t-Statistic Prob.*
BSE Bankex has a unit root -47.25072 0.0001
CNX Bank has a unit root -47.23745 0.0001
*MacKinnon (1996) one-sided p-values.
The results of Augmented Dickey–Fuller test in table 2 indicate that the BSE Bankex and CNX Bank return
series are stationary. The null hypothesis that the returns series has unit root is rejected in both BSE Bankex and
CNX Bank series as the probability value is 0 i.e. less than 0.05 in each case. Exhibit 1 portrays the daily returns

476 | P a g e
on BSE Bankex and CNX Bank returns series. It is clear from the visual inspection that volatility in both series
has changed over time. There are clear and distinct periods of high volatility and relative calm that suggests
volatility clustering in the BSE Bankex and CNX Bank return series.
Exhibit 1: Plot of daily returns
-.2
-.1
.0
.1
.2
04 06 08 10 12 14
BSE BANKEX RETURNS
-.2
-.1
.0
.1
.2
04 06 08 10 12 14
CNX BANK RETURNS
The estimates obtained from ordinary least square method are linear, unbiased and asymptotically normally
distributed in case of large samples but they are not as efficient as in case of other linear and unbiased estimates
in the presence of hetroscedasticity and autocorrelation. The pictorial representation of return series indicates the
clustering so Engle's ARCH test and Breush-Godfrey-Pagan test are further applied in the ARMA model to
statistically test the persistence and predictability of volatility in the Indian banking sector. The most common
Durbin Watson test to detect autocorrelation is not applicable in these autoregressive models. So, the residuals
are tested for ARCH effect and the results of the same are displayed in table 3 and 4.
Table 3: Results of Engle's ARCH test
PANEL A: BSE Bankex return series
F-statistic 187.7131 Prob. F(1, 2908) 0.0000
Obs*R-squared 176.4521 Prob. Chi-Square(1) 0.0000
PANEL B: CNX Bank return series
F-statistic 236.7408 Prob. F(1, 2908) 0.0000
Obs*R-squared 219.0692 Prob. Chi-Square(1) 0.0000

477 | P a g e
Table 4: Results of Breusch-Godfrey Serial Correlation LM Test
PANEL A: BSE Bankex return series
F-statistic 3.768889 Prob. F(2,2907) 0.0232
Obs*R-squared 7.528629 Prob. Chi-Square(2) 0.0232
PANEL B: CNX Bank return series
F-statistic 4.371873 Prob. F(2,2907) 0.0127
Obs*R-squared 8.729520 Prob. Chi-Square(2) 0.0127
Engle's ARCH test confirms the presence of conditional heteroscedasticity in the return series of BSE Bankex
and CNX Bank as the probability value is zero. The results of Breush-Godfrey-Pagan test in table 4 also confirm
that the estimated variance of the residuals is dependent on the independent variable as the probability value is
more than 0.05.
V. RISK-RETURN TRADE-OFF
The risk return trade-off is studied with the help of GARCH in the mean model (GARCH-M model). This
model allows volatility to enter in the mean equation as an explanatory variable. GARCH-M model extends the
mean equation in the following form:
(3)
g(.) can be a arbitrary function of volatility
The estimates from this model are used to examine whether risk is related significantly with return or not. The
results of GARCH-M model estimation on BSE Bankex and CNX Bank returns series are portrayed in table 5
and table 6 respectively.
Table 5: GARCH-M model estimation on BSE Bankex returns series
Dependent Variable: BANKEXR
Method: ML - ARCH (Marquardt) - Normal distribution
GARCH = C(3) + C(4)*RESID(-1)^2 + C(5)*GARCH(-1)
Variable Coefficient Std. Error z-Statistic Prob.
GARCH -0.183736 1.527769 -0.120264 0.9043
C 0.001251 0.000509 2.460489 0.0139
Variance Equation
C 7.42E-06 1.16E-06 6.389913 0.0000
RESID(-1)^2 0.087535 0.007049 12.41782 0.0000
GARCH(-1) 0.894574 0.008205 109.0218 0.0000

478 | P a g e
The coefficient of variance in the equation is negative (i.e. -0.183736) but statistically insignificant as the p
value exceeds the 0.05 and 0.10. It clearly indicates the absence of significant risk-return relationship.
Table 6: GARCH-M model estimation on CNX Bank returns series
Dependent Variable: CNXR
Method: ML - ARCH (Marquardt) - Normal distribution
GARCH = C(3) + C(4)*RESID(-1)^2 + C(5)*GARCH(-1)
Variable Coefficient Std. Error z-Statistic Prob.
GARCH 0.166771 1.547446 0.107772 0.9142
C 0.001078 0.000539 2.000134 0.0455
Variance Equation
C 6.97E-06 1.13E-06 6.192717 0.0000
RESID(-1)^2 0.081811 0.006503 12.58125 0.0000
GARCH(-1) 0.902349 0.007585 118.9696 0.0000
The coefficient of variance in the equation is positive (i.e. 0.006724) but statistically insignificant as the p value
exceeds the 0.05 and 0.10. It clearly indicates the absence of significant risk-return relationship.
VI. LEVERAGE EFFECT: ESTIMATION OF MARKET VOLATILITY IN TERMS OF
ASYMMETRICAL RESPONSE TO NEWS
The different reaction to good or bad news is known as asymmetric response to various shocks. It is also known
as leverage effect. EGARCH model is estimated on BSE Bankex and CNX Bank return series in order to test the
significance of the asymmetric effects. The leverage effect in the EGARCH model is exponential that makes the
forecast of conditional variance non negative. The estimates from EGARCH model on BSE Bankex and CNX
Bank return series are portrayed in table 7 and table 8 respectively.
Table 7: EGARCH model estimation on BSE Bankex returns series
Dependent Variable: BANKEXR
Method: ML - ARCH (Marquardt) - Normal distribution
Convergence achieved after 30 iterations
LOG(GARCH) = C(3) + C(4)*ABS(RESID(-1)/@SQRT(GARCH(-1))) + C(5)
*RESID(-1)/@SQRT(GARCH(-1)) + C(6)*LOG(GARCH(-1))
Variable Coefficient Std. Error z-Statistic Prob.
GARCH -1.229790 1.441160 -0.853333 0.3935
C 0.001185 0.000483 2.452428 0.0142
479 | P a g e
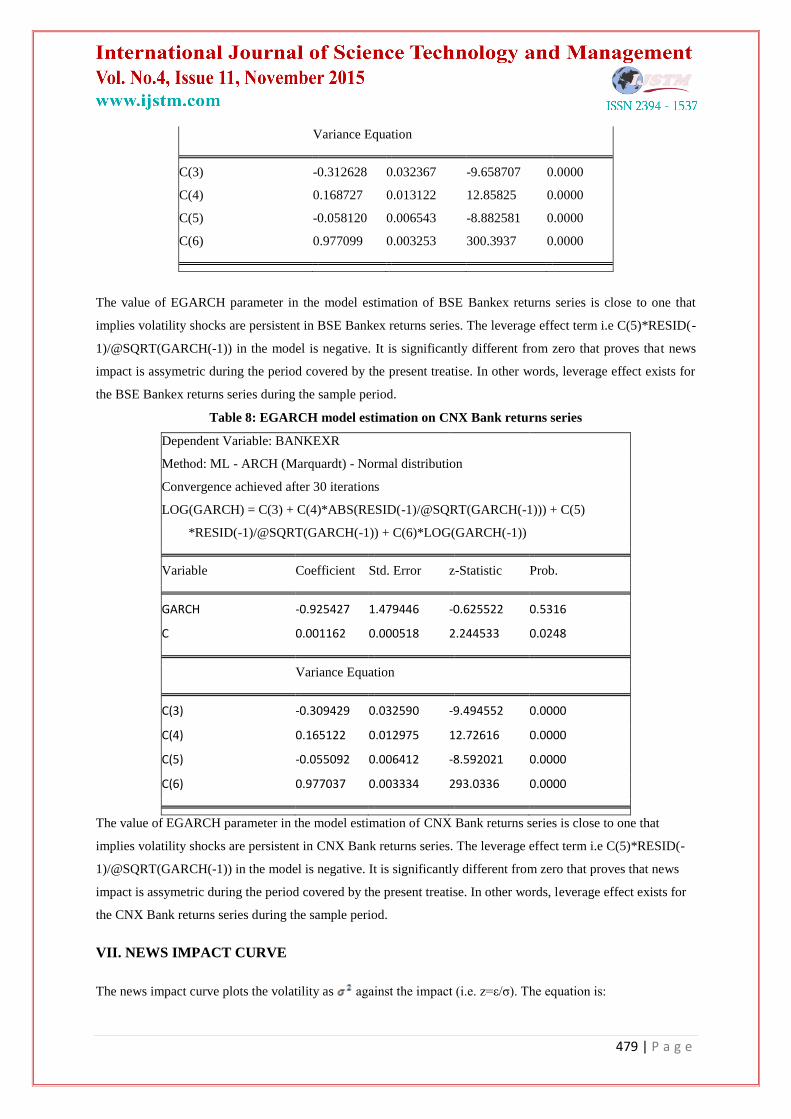
Variance Equation
C(3) -0.312628 0.032367 -9.658707 0.0000
C(4) 0.168727 0.013122 12.85825 0.0000
C(5) -0.058120 0.006543 -8.882581 0.0000
C(6) 0.977099 0.003253 300.3937 0.0000
The value of EGARCH parameter in the model estimation of BSE Bankex returns series is close to one that
implies volatility shocks are persistent in BSE Bankex returns series. The leverage effect term i.e C(5)*RESID(-
1)/@SQRT(GARCH(-1)) in the model is negative. It is significantly different from zero that proves that news
impact is assymetric during the period covered by the present treatise. In other words, leverage effect exists for
the BSE Bankex returns series during the sample period.
Table 8: EGARCH model estimation on CNX Bank returns series
Dependent Variable: BANKEXR
Method: ML - ARCH (Marquardt) - Normal distribution
Convergence achieved after 30 iterations
LOG(GARCH) = C(3) + C(4)*ABS(RESID(-1)/@SQRT(GARCH(-1))) + C(5)
*RESID(-1)/@SQRT(GARCH(-1)) + C(6)*LOG(GARCH(-1))
Variable Coefficient Std. Error z-Statistic Prob.
GARCH -0.925427 1.479446 -0.625522 0.5316
C 0.001162 0.000518 2.244533 0.0248
Variance Equation
C(3) -0.309429 0.032590 -9.494552 0.0000
C(4) 0.165122 0.012975 12.72616 0.0000
C(5) -0.055092 0.006412 -8.592021 0.0000
C(6) 0.977037 0.003334 293.0336 0.0000
The value of EGARCH parameter in the model estimation of CNX Bank returns series is close to one that
implies volatility shocks are persistent in CNX Bank returns series. The leverage effect term i.e C(5)*RESID(-
1)/@SQRT(GARCH(-1)) in the model is negative. It is significantly different from zero that proves that news
impact is assymetric during the period covered by the present treatise. In other words, leverage effect exists for
the CNX Bank returns series during the sample period.
VII. NEWS IMPACT CURVE
The news impact curve plots the volatility as against the impact (i.e. z=ε/σ). The equation is:

480 | P a g e
= ω + β (4)
The x axis of news impact curve is z series that is generated as a equispaced period between -10 and +10. The
variance series is generated that is named as SIG2. Finally, news impact curves are estimated by highlighting the
z seiesa and SIG2 series from EGARCH model fitted to the BSE Bankex and CNX Bank return series. Exhibit 9
plot the news impact curve for the BSE Bankex and CNX Bank return series.
Exhibit 9: News Impact Curve from EGARCH Estimations
0
5
10
15
20
25
30
35
40
-12 -10 -8 -6 -4 -2 0 2 4 6 8 10
Z
SIG
2
0
5
10
15
20
25
30
35
40
-12 -10 -8 -6 -4 -2 0 2 4 6 8 10
Z
SIG
2
BSE Bankex return series CNX Bank return series
The asymmetric leverage effect is clearly seen in news impact curve drawn from EGARCH model fitted to the
BSE Bankex and CNX Bank return series. The conditional variance of these returns series indicates smaller
reaction to past positive shocks as compared to the negative shocks of the equal magnitude.
VIII. DISCUSSION
The studies of Crouhy Michel and Rockinger Michael (1997)[3], Robert A. Connolly and Christopher T. Stivers
(1999)[4] and Ahmed, Shahid (2007)[9] have found that returns are negatively related with the volatility. All
studies conducted on volatility in financial markets have completely negated the volatility as constant and
unconditional statistics. The vanilla GARCH model do not allow for asymmetries. So, Nelson’s EGARCH
model was employed to study the impact of news on volatility in BSE Bankex and CNX Bank return series. It is
found that the returns tend to be more volatile in response to bad news and less volatile in response to good
news. Some of the important findings on leverage effects are as follows:
1. Good news as well as bad news affects stock market.
2. The stock return innovations have different impact on the volatility.
3. Volatility following good news is found to be lower than following bad news.
IX. CONCLUSION
The risk-return trade-off, volatility behaviour and leverage effect in Indian banking sector indices of the
Bombay Stock Exchange Ltd. and the National Stock Exchange Ltd. were studied with the help of Engle's
ARCH test, Breush-Godfrey-Pagan test, GARCH-M Model and EGARCH model. The results of the present
treatise confirm the presence of volatility clustering and asymmetric leverage effect in BSE Bankex and CNX
481 | P a g e
Bank return series. It is also found that the impact of negative news is more as compared to good news. There is
no evidence of significant risk-return relationship in BSE Bankex and CNX Bank return series. The findings of
present study may help the investors in exploring the risk exposure of their investment in India banking sector.
They may use these findings in framing their investment strategy to manage their portfolio risk in better way.
REFERENCES
[1] Engle, R.F., Autoregressive conditional heteroskedasticity with estimates of the variance of U.K.
inflation, Econometrica, 1982, 50, 98771008.
[2] Bollerslrv, T.. 1986, Generalised autoregressive conditional heteroskedasticity, Journal of Econometrics,
31, 307-327.
[3] Crouhy Michel and Rockinger Michael, Volatility Clustering, Asymmetry and Hysteresis in Stock
Returns: International Evidence, Financial Engineering and the Japanese Markets, 1997, 4(1), 1-3.
[4] Robert A. Connolly and Christopher T. Stivers, Evidence on the Economics of Equity Return Volatility
Clustering, 1999 retrieved from http://www.econometricsociety.org/meetings/wc00/pdf/1575.pdf on 11-
10-2013
[5] Kaur, Harvinder, Time Varying Volatility in the Indian Stock Market, Vikalpa, 29(4), October -
December 2004, 25-42.
[6] Connolly, Robert A. and Stivers, Christopher Todd, Macroeconomic News, Stock Turnover, and Volatility
Clustering in Daily Stock Returns, Journal of Financial Research, June 2005, 28, 235-259.
[7] Bhaskar Sinha, Modeling Stock Market Volatility in Emerging Markets: Evidence from India, The ICFAI
Institute for Management Teachers (IIMT), 2006, Working Paper Series.
[8] Sarangi, Sibani Prasad and Patnaik, K. Uma Shankar, Impact of Futures and Options on the Underlying
Market Volatility: An Empirical Study on S&P CNX Nifty Index, 10th Indian Institute of Capital Markets
Conference Paper, 2006, Retrieved from http://dx.doi.org/10.2139/ssrn.962036 on 14-10-13.
[9] Ahmed, Shahid, Volatility Clustering in Aggregate Stock Market Returns: Evidence from Indian Stock
Market, Prajnan, 2007-2008, 36(4), 307-323.
[10] Bose, Suchismita, Understanding the Volatility Characteristics and Transmission Effects in the Indian
Stock Index and Index Futures Market, ICRA Bulletin, Money & Finance, September 2007, 138-162.
[11] Surya Bahadur G.C, Volatility Analysis of Nepalese Stock Market, Journal of Nepalese Business Studies,
December 2008, 5(1), 76-84.
[12] Thiripalraju, Dr. M. and H., Rajesh Acharya, Modeling Volatility for the Indian Stock Market, The IUP
Journal of Applied Economics, January 2010, 9(1), 79-105.
[13] Ramlall Indranarain, Has the US Subprime Crisis Accentuated Volatility Clustering and Leverage Effects
in Major International Stock Markets?, International Research Journal of Finance and Economics, 2010,
39, 157-169.
[14] Mahmud, Mahreen and Mirza, Nawazish, Volatility Dynamics in an Emerging Economy: Case of Karachi
Stock Exchange”, Ekonomska istraživanja, 2011, 24(4), 51-64.
[15] Joshi, Prashant Mahesh and Pandya, Kiran, Volatility in Stock Markets of India and Canada, The IUP
Journal of Applied Economics, October 2012, 9(4), 72-79.

482 | P a g e
[16] Lin, Pin-te and Fuerst, Franz, Volatility Clustering, Risk-Return Relationship and Asymmetric Adjustment
in Canadian Housing Markets, 2013, Retrieved from http://dx.doi.org/10.2139/ssrn.2197098 on 15-10-13.
[17] Moussa, Wided Ben (2014), Bank Stock Volatility and Contagion: An Empirical Investigation with
Application of Multivariate GARCH Models, Journal of Economic Development, 39(2), 1-24.
[18] Robert F. Engle, David M. Lilien and Russell P. Robins, Estimating Time Varying Risk Premia in the
Term Structure: The Arch-M Model, Econometrica, 55(2), March 1987, 391-407
[19] Nelson, Daniel B., Conditional Heteroskedasticity in Asset Returns: A New Approach”, Econometrica,
59(2), March 1991, 347-370.


![NBER WORKING PAPER SERIES CRASH OF 87 C ......Schwert [1987] analyzes the relation of stock volatility with real and nominal macroeconomic volatility, financial leverage, stock trading](https://img.dokumen.tips/doc/110x75/60c0f0071052fd72b327a616/nber-working-paper-series-crash-of-87-c-schwert-1987-analyzes-the-relation.jpg)