Embed Size (px)
Citation preview

Risk performance of classification decisions: a
framework for posterior inference based on
empirical likelihood
Yuan Liao Wenxin Jiang
Princeton University and Northwestern University
August 22, 2011
Abstract
We consider an approximate posterior approach to making joint probabilis-
tic inference on the action and the associated risk in classification. The pos-
terior probability is based on an empirical likelihood (EL), which imposes a
moment restriction relating the action to the resulting risk, but does not oth-
erwise require a probability model for the underlying data generating process.
We illustrate with examples how this framework can be used to describe the
EL-posterior distribution of actions to take in order to achieve a low risk, or
conversely, to describe the posterior distribution of the resulting risk for a given
action. A theoretical study on the frequentist properties reveals that the EL-
posterior concentrates around the true risk-action relation with high probability
for large data size, and that the actions can be generated from this posterior to
reliably control the true resulting risk. Finally, an application to the German
credit data is presented.
1

Key words: classification, posterior consistency, EL- posterior, Bayesian empir-
ical likelihood, moment condition, partially identified models, risk
2

1 Introduction
One of the classical problems in data mining is to predict the unknown nature
of a feature, by classifying the data into subgroups. Suppose Y ∈ {0, 1} is a bi-
nary random variable to be predicted, which is associated with a vector of ran-
dom predictors X . The classification and prediction are made through a classifi-
cation rule C(X, θ) ∈ {0, 1}, which is a function of X indexed by θ, for example,
C(X, θ) = I(XT θ > 0).
One way of assessing the classification accuracy is to introduce a loss function
l(Y,C(X, θ)), and define its expectation as the risk r = E(l(Y,C(X, θ))|θ), which
is a function of θ. We will mostly focus on the classification risk r associated with
the common 0-1 loss l = |Y − C(X, θ)|. However, we will also briefly describe
how our approach can handle more general risks in Section 4. The parameter θ
now describes an action related to the classification decision C(X, θ) = I(XT θ >
0). This paper provides a new framework to describe the relation between actions
indexed by θ and their associated classification risks, which enables us to answer the
following two questions without knowing the underlying distribution of (Y,X): (i)
what kind of θ should be chosen in order to control the resulting risk, so that r ≤ r0
for a pre-determined desired level r0? (ii) What is the range of plausible values for
the classification risk r associated with any chosen classification rule θ?
Our new framework has a Bayesian flavor, and will involve deriving formally
a joint posterior distribution for the action-risk pair (θ, r), based on an observed
data set D = {(Y1, X1), ..., (Yn, Xn)} consisting of n i.i.d. (independent and identi-
cally distributed) copies of (Y,X). However, there are three distinctive features that
make our approach very different from the traditional Bayesian approach. We only
briefly explain these three differences here, and will leave the detailed discussions
in Section 2.2, after we describe the formal mathematical structure of the method in
3

Section 2.1.
A. We use the Empirical Likelihood (EL, see, e.g., Owen 1990), instead of the
true likelihood, when constructing the posterior (which will be consequently
called the EL-posterior). This way, our method inherits a major advantage of
EL, which requires only the specification of a moment condition, rather than
a full probability model for (Y,X).
B. The action parameter θ in this paper is not a parameter in the usual sense, since
it is not a functional of the data generating process, but only indexes a decision
rule to be studied by the user. This will be discussed in more detail in Section
2.2.
C. The EL-posterior is based on a moment condition that defines the risk-action
relationship:
E(l(Y,C(X, θ))|θ) = r, (1.1)
which does not identify (r, θ) to a point, but to a curve instead. Consequently,
we will show an unusual mode of posterior consistency, that with increasing
sample sizes, the posterior probability mass will not converge to a point, but
to the curve r = E(l(Y,C(X, θ))|θ) instead. This feature is similar to the
findings in the literature of Bayesian partial identification (e.g., Poirier (1998),
Moon and Schrofheide (2010), Liao and Jiang (2010), Gustafson (2010)). But
as far as we know, the current paper is the first one that proves this kind of
posterior consistency result when EL is used (instead of the usual likelihood).
Note that when an EL-posterior, which we will denote by PEL(θ, r|D), is for-
mally derived for the action-risk pair jointly, we will be able to obtain useful con-
ditional distributions. For example, Corollary 3.1 shows the following implication
of the consistency of the joint posterior PEL(θ, r|D): With a large data set D, when
4

the action parameter θ is generated from the conditional posterior PEL(θ|r ≤ r0, D)
(given that risk r is controlled to be at a certain nominal level r ≤ r0), the true ex-
pected risk El(Y,C(X, θ)) will indeed often be controlled to nearly r0 (or lower),
regardless of the true distribution of the data generating process.
The remainder of this paper is organized as follows. Section 2.1 introduces the
basic framework of the proposed EL-posterior. Section 2.2 discusses in detail the
three distinctive features of the proposed method. Section 3 presents the main theo-
retical results related to the frequentist properties of the proposed method. Section 4
comments on the possible extension to more general risk functions in data mining.
Section 5 provides a simulation example to illustrate the main results and demon-
strates how they are used in practice. Section 6 illustrates an empirical application
using the German Credit Benchmark data. Finally, Section 7 concludes with discus-
sions.
2 Empirical Likelihood Posterior Distribution
2.1 Construction of the EL-posterior
Consider the following equation
r = E[ρ(W, θ)|θ] =
∫ρ(w, θ)dPW (w), (2.1)
where θ is an auxiliary parameter which indexes a decision rule, r is the resulting
risk, andW = (Y,X) with Y ∈ {0, 1} being the label to be predicted andX being a
predictor. Here ρ(W, θ) denotes the loss function. To simplify the technical deriva-
tion and illustrate the main idea, this paper mainly considers the absolute loss func-
tion (also known as the l1 loss) ρ(W, θ) = |Y − C(X, θ)|, where C(X, θ) ∈ {0, 1}
is a classification rule that is indexed by θ. The results obtained can be naturally
5
generated to general loss functions. The probability measure PW is based on the
true distribution of W , which is unknown. We assume that θ belongs to an action
space Θ, and r ∈ [0, 1]. Therefore the parameter space for (θ, r) is Θ× [0, 1].
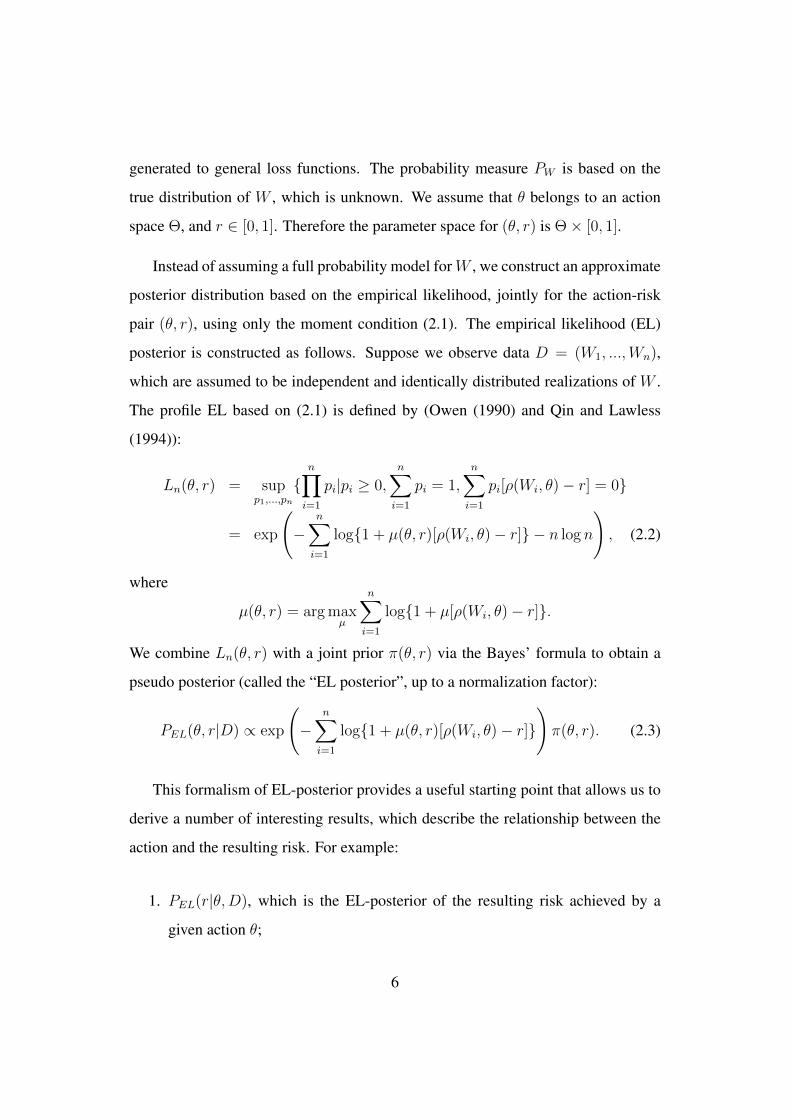
Instead of assuming a full probability model forW , we construct an approximate
posterior distribution based on the empirical likelihood, jointly for the action-risk
pair (θ, r), using only the moment condition (2.1). The empirical likelihood (EL)
posterior is constructed as follows. Suppose we observe data D = (W1, ...,Wn),
which are assumed to be independent and identically distributed realizations of W .
The profile EL based on (2.1) is defined by (Owen (1990) and Qin and Lawless
(1994)):
Ln(θ, r) = supp1,...,pn
{n∏i=1
pi|pi ≥ 0,n∑i=1
pi = 1,n∑i=1
pi[ρ(Wi, θ)− r] = 0}
= exp
(−
n∑i=1
log{1 + µ(θ, r)[ρ(Wi, θ)− r]} − n log n
), (2.2)
where
µ(θ, r) = arg maxµ
n∑i=1
log{1 + µ[ρ(Wi, θ)− r]}.
We combine Ln(θ, r) with a joint prior π(θ, r) via the Bayes’ formula to obtain a
pseudo posterior (called the “EL posterior”, up to a normalization factor):
PEL(θ, r|D) ∝ exp
(−
n∑i=1
log{1 + µ(θ, r)[ρ(Wi, θ)− r]}
)π(θ, r). (2.3)
This formalism of EL-posterior provides a useful starting point that allows us to
derive a number of interesting results, which describe the relationship between the
action and the resulting risk. For example:
1. PEL(r|θ,D), which is the EL-posterior of the resulting risk achieved by a
given action θ;
6

2. PEL(θ|r = r0, D) or PEL(θ|r ≤ r0, D), which is the EL-posterior of the
action θ needed to achieve a risk either being r0 or at most r0;
3. PEL(θ ∈ A1|r ≤ r0, D)/PEL(θ ∈ A2|r ≤ r0, D), which compares the pos-
terior probabilities of two models A1 and A2 (or two sets of actions) given
that r ≤ r0, to see which model is “more likely” (corresponding to higher
EL-posterior probability) given that r0 is achieved.
4. PEL(r|D), which is the EL-posterior of the achievable risk by all possible
actions θ proposed by π(θ).
2.2 Three distinctive features of the proposed approach
It is easy to notice that the approach proposed above has three features that are
different from most other works. First, the EL-posterior is different from com-
mon Bayesian posteriors, since it now uses EL. Second, the parameter structure
is unusual, since the action parameter is not a functional of the data generating pro-
cess. Third, the posterior distribution behaves differently from common situations
of point-identification, since it does not converge to a single point asymptotically.
We will discuss these three differences below in detail.
2.2.1 The use of EL in posterior construction
Exactly for the same reasons that EL is a valuable alternative to the usual like-
lihood for a frequentist approach, the EL-posterior is also a valuable alternative to
the usual posterior. This point is realized much less in the Bayesian world than in
the frequentist counterpart, although we believe that this situation is now changing,
largely due to recent works of, e.g., Chernozhukov and Hong (2003), Lazar (2003),
7

Ragusa (2007). When making inference of a parameter of interest appearing in a
moment condition/estimating equation, the EL-based method (whether frequentist
or Bayesian in style) has a key advantage, that its validity is roughly equivalent to
that of a semiparametric likelihood approach, but the latter would require estimat-
ing infinitely many more nuisance parameters which are not directly relevant to the
moment condition.
Recent theoretic and numeric studies suggest that the EL-posterior probability
may be regarded as an approximation to the true posterior probability, rather than just
a common-sense construction. For example, Kitamura (2001) understands EL as an
approximate likelihood based on a probability model that is closet to the true model
(in the Kullback-Leibler divergence), among all the probability models satisfying
the same defining moment condition. Lazar (2003) provides numerical evidence of
the validity of the use of EL-posterior for Bayesian inference, under the definition
of “posterior validity” proposed by Monahan and Boos (1992).
In addition, in the classification problem studied in the current paper, we will
show later that the EL-posterior (based on the same moment condition) is equiva-
lent to the so-called “Bayesian exponentially tilted empirical likelihood (BETEL)
posterior” proposed by Schennach (2005). It is shown in Schennach (2005) that the
BETEL-posterior arises naturally from a nonparametric Bayesian procedure, with
a type of noninformative prior placed on the space of distributions. Since the EL-
posterior is exactly the same as the BETEL-posterior when the moment condition
is given by E(|Y − C(X, θ)||θ) = r, Schennach (2005)’s argument provides an
additional probabilistic interpretation of the EL-posterior used in our paper 1.
In practice, the EL-posterior has been used by a number of authors in applied
1See Appendix A.3 for the definition of BETEL-posterior proposed in Schennach (2005), as well
as the proof of its equivalence to our EL-posterior in the classification problem.
8

problems., e.g., Chaudhuri and Ghosh (2010) and Rao and Wu (2010).
2.2.2 The action parameter and the prior
The action parameter θ is not a usual parameter, since it is not a functional of
the data generating process. Due to the quasi-Bayesian framework, we have the
flexibility of placing a prior π(θ, r) = π(r|θ)π(θ), in which π(θ) describes a set
of θ’s whose risk performances the decision maker would like to study, and π(r|θ)
is the prior guess of the risk once an action θ is taken. For example, suppose X
is one dimensional and a linear classification rule C(X, θ) = I(X > θ) is applied,
in which θ can be any threshold value a decision maker chooses from R. Placing
a standard normal prior on θ means that the decision maker is mostly interested in
studying the risk behavior of those θ’s that are close to zero.
The result of the proposed procedure will be relative to the given prior π(θ),
supplied by the decision maker. Given this choice π(θ), we will get an idea about
how low the risk r can be realistically achieved by this group of proposed θ’s, by
looking at P (r|D). We will also be able to know which part of the θ’s proposed by
the prior π(θ) will achieve a risk lower than some threshold value r0, by looking at
P (θ|r < r0, D). The result will be valid for any r0 that is not too much lower than
the lowest point of the support of P (r|D) (see Corollary 3.1 below).
2.2.3 Partial identification
The defining moment condition (1.1) that relates the risk r to the action θ clearly
does not identify the pair (θ, r) uniquely. It is the functional relationship r =
E(l(Y,C(X, θ))|θ) itself, rather than any single point satisfying this relation, that
is identifiable. Our theoretical result later shows that the posterior distribution will
9

not converge to a point, no matter how large the data set is. The limiting posterior
behavior is therefore more similar to the findings in the literature of partial identifi-
cation.
In recent years, partially identified models are receiving rapidly growing at-
tentions in both statistics and econometrics literatures. Manski (2007) and Tamer
(2010) both give excellent reviews and discussions of the applications of these mod-
els in social sciences. In these models, the identified region becomes the object of
interest. (See for example, Chernozhukov, Hong and Tamer (2007).) In our paper,
the identified region corresponds to the set of parameters that satisfy the moment
restriction (1.1). More recently, Liao and Jiang (2010) have studied the properties
of the posterior distribution of the parameters in a similar setting of the moment re-
striction (1.1), where they used the limited information likelihood idea (Kim 2002)
to construct the likelihood function. In this paper, we show that the EL-posterior has
similar asymptotic properties to those described in Liao and Jiang (2010). To be spe-
cific, Theorem 3.2 implies that the joint EL-posterior distribution for (θ, r), denoted
by PEL(θ, r|D), will be asymptotically supported on an arbitrarily small neighbor-
hood of the part of the curve {(θ, r) : El(Y,C(X, θ)) = r} that lies within the
support of the prior π(θ, r). So far, the consistency of the EL-posterior for partially
identified models has not been formally established, while the point identified case
was previously studied by Chernozhukov and Hong (2003). Therefore one of the
contributions of the current paper is the EL-posterior consistency for the parameters
that are only partially identified by the moment condition of the form (1.1).
10

3 Main Results
In the classification problem when ρ = |Y − C(X, θ)| and Y and C(X, θ) ∈
{0, 1}, it is straightforward to verify that the empirical likelihood and the corre-
sponding posterior distribution have explicit analytic expressions. The following
theorem states that, in the classification problem framework, the log-empirical like-
lihood function is proportional (up to the scale−n) to the Kullback-Leibler distance
between two Bernoulli distributions with success probabilities, R̂(θ) and r, respec-
tively.
Theorem 3.1. Suppose ρ = |Y − C(X, θ)|, Y and C(X, θ) ∈ {0, 1}, R̂(θ) and
r ∈ [0, 1], where R̂(θ) = 1n
∑ni=1 |Yi − C(Xi, θ)|. Then the EL-posterior in (2.3) is
given by
PEL(θ, r|D) ∝ π(θ, r) exp(−nK(R̂(θ), r)), (3.1)
where
K(p, q) =
p ln(p/q) + (1− p) ln{(1− p)/(1− q)}, if p, q ∈ (0, 1)
+∞, if p ∈ (0, 1], q = 0, or p ∈ [0, 1), q = 1
0 if q ∈ [0, 1), p = 0, or q ∈ (0, 1], p = 1.
(3.2)
Proof. See the Appendix.
As described in Section 2.2, (θ, r) is not point identified. As a result the posterior
does not degenerate to any single point asymptotically. Based on a treatment similar
to Liao and Jiang (2010), however, we can establish the posterior consistency under
partial identification, which is, as n→∞, the EL-posterior concentrates around the
region of (θ, r) that satisfy the moment condition E|Y − C(X, θ)| = r.
11

Suppose a random variable Zn = Zn(D) is a function of D. In what follows, we
write ZnPnW→ 0 if ∀ε > 0, PW (|Zn(D)| > ε)→ 0.
Theorem 3.2. Consider the classification case, when ρ(W, θ) = |Y −C(X, θ)| and
Y,C(X, θ) ∈ {0, 1}. Denote R(θ) = E[ρ(W, θ)|θ], R̂(θ) = n−1∑n
i=1 ρ(Wi, θ), and
η(θ, r) = min{R(θ), 1−R(θ), r, 1− r}. Assume the following:
(i) The prior π(|R(θ)− r| ≤ δ, η ≥ τ) > 0 for any constants δ > 0, τ ∈ (0, 1);
(ii) supθ∈Θ |R̂−R|PnW→ 0 as n→∞.
Then for any ε > 0, we have: as n→∞
PEL(R(θ)− ε ≤ r ≤ R(θ) + ε|D)PnW→ 1.
Proof. See the Appendix.
Condition (i) imposes a regularity assumption on the support of prior. Condition
(ii) requires the uniform convergence in probability of the empirical risk R̂(θ) to
the true risk R(θ). This condition holds, for example, if the class of decision rules
C = {C(X, θ) : θ ∈ Θ} has finite Vapnik-Chervonenkis dimension VC , in which
case P (supθ∈Θ |R̂(θ) − R(θ)| > ε) ≤ 8nVCe−nε2/32 (see Vapnik and Chervonenkis
(1971), and Devroye et al. (1996) chapter 12).
We give an intuitive explanation of Theorem 3.2. A generalized posterior con-
sistency theory implies that the posterior distribution should be asymptotically sup-
ported on the set of maximizers of the log-likelihood (see Chernozhukov and Hong
(2003)), which in our case, is the set of minimizers ofK(R̂(θ), r). SinceK(R̂(θ), r)
is the Kullback-Leibler distance between two Bernoulli distributions with success
probabilities R̂(θ) and r respectively, K(R̂(θ), r) is thus minimized when R̂(θ) and
r are close to each other. By the uniform convergence of R̂(θ)−R(θ), therefore, the
posterior should asymptotically concentrate around the region where R(θ) is close
12

to r. This theorem indicates that, even though the EL-posterior of the true risk R(θ)
is unknown (since it also depends on the unknown distribution PW ), we can make
inference of R(θ) based on the EL-posterior of r.
The following corollaries describe two useful implications. If we would like to
find actions to control the risk to be under r0, we can use actions generated from the
conditional posterior PEL(θ|r ≤ r0, D), which tends to generate actions that result
the risk R(θ) to be at most slightly worse than the desired level r0.
Corollary 3.1. Suppose that PEL(r ≤ r0|D) > ξ for some constant ξ > 0, then
under the regularity conditions in Theorem (3.2), for any ε > 0,
PEL(E[ρ(W, θ)|θ] ≤ r0 + ε|D, r ≤ r0)→PnW 1
as n→∞.
Proof. Denote R = E[ρ(W, θ)|θ]. Then PEL(R > r0 + ε|D, r ≤ r0) = PEL(R −
r0 > ε, r ≤ r0|D)/PEL(r ≤ r0|D) ≤ PEL(|R − r| > ε|D)ξ−1→PnW 0 due to
Theorem (3.2). Q.E.D.
Corollary 3.1 indicates the usefulness of PEL(θ|r ≤ r0, D) in controlling the
classification risk, which shows that, if the action parameters are generated from
PEL(θ|D, r ≤ r0), then with high EL-probability, the true risk E[ρ(W, θ|)θ] will be
less than r0 plus an arbitrarily small constant, where r0 is the level of the risk that
the decision makers can tolerate. In practice, once a sequence of {θi} is generated
from the distribution PEL(θ|D, r ≤ r0), we can take an action as the average of
these posterior draws. See Section 6 for the implementation in a real data example.
Define r∗ = infθ∈ΘE[ρ(W, θ)|θ], the minimal expected risk over all the actions
in Θ. The next corollary states that asymptotically, the EL-posterior distribution of
r has no support below r∗.
13
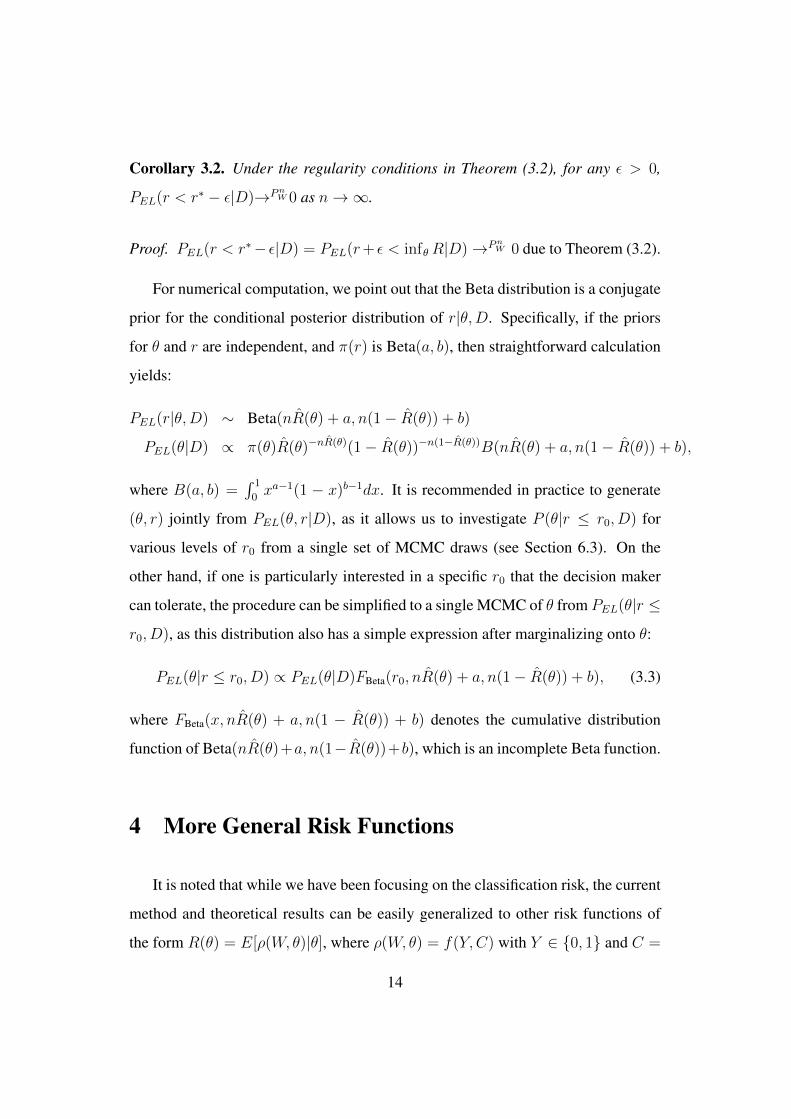
Corollary 3.2. Under the regularity conditions in Theorem (3.2), for any ε > 0,
PEL(r < r∗ − ε|D)→PnW 0 as n→∞.
Proof. PEL(r < r∗− ε|D) = PEL(r+ ε < infθ R|D)→PnW 0 due to Theorem (3.2).
For numerical computation, we point out that the Beta distribution is a conjugate
prior for the conditional posterior distribution of r|θ,D. Specifically, if the priors
for θ and r are independent, and π(r) is Beta(a, b), then straightforward calculation
yields:
PEL(r|θ,D) ∼ Beta(nR̂(θ) + a, n(1− R̂(θ)) + b)
PEL(θ|D) ∝ π(θ)R̂(θ)−nR̂(θ)(1− R̂(θ))−n(1−R̂(θ))B(nR̂(θ) + a, n(1− R̂(θ)) + b),
where B(a, b) =∫ 1
0xa−1(1 − x)b−1dx. It is recommended in practice to generate
(θ, r) jointly from PEL(θ, r|D), as it allows us to investigate P (θ|r ≤ r0, D) for
various levels of r0 from a single set of MCMC draws (see Section 6.3). On the
other hand, if one is particularly interested in a specific r0 that the decision maker
can tolerate, the procedure can be simplified to a single MCMC of θ from PEL(θ|r ≤
r0, D), as this distribution also has a simple expression after marginalizing onto θ:
PEL(θ|r ≤ r0, D) ∝ PEL(θ|D)FBeta(r0, nR̂(θ) + a, n(1− R̂(θ)) + b), (3.3)
where FBeta(x, nR̂(θ) + a, n(1 − R̂(θ)) + b) denotes the cumulative distribution
function of Beta(nR̂(θ)+a, n(1−R̂(θ))+b), which is an incomplete Beta function.
4 More General Risk Functions
It is noted that while we have been focusing on the classification risk, the current
method and theoretical results can be easily generalized to other risk functions of
the form R(θ) = E[ρ(W, θ)|θ], where ρ(W, θ) = f(Y,C) with Y ∈ {0, 1} and C =
14

C(X, θ) ∈ {0, 1}. (One simple example is a linear rule C = I(XT θ > 0) indexed
by θ.) For one example in a data mining context: A marketing effort C = I[mail]
of mailing out an advertisement with cost c = 1 will be based on X (including, e.g.,
gender, age, ethnic group, education, etc). The outcome will be Y = I[purchase]
where a purchase will lead to net income g = 100. Then one would like to maximize
the expected profit E[(gY − c)C] or minimize a risk R = constant−E[(gY − c)C].
Here up to a constant, f(Y,C) = −(gY − c)C, so that f(0, 0) = f(1, 0) = 0,
f(0, 1) = c = 1, f(1, 1) = c− g = −99. Such profit-and-loss decision matrices are
included in popular data mining software such as the SAS Enterprise Miner. We can
apply the proposed method to construct the EL-posterior distribution 2.3 jointly for
the action parameter θ and the resulting risk r.
5 A Simulated Example
Let the data be generated from the following design
Y = I(3X−ε>0),
X ∼ N(0, 1), ε ∼ N(0, 3),
whereX and ε are independent. We apply the classification ruleC(X, θ) = I(X−θ>0).
Let ρ(W, θ) = |Y − C(X, θ)|. One can then show that the expected risk is given by
R(θ) = E[ρ(W, θ)|θ] = EX{[1− Φ(√
3X)]I(X>θ) + Φ(√
3X)I(X≤θ)} (5.1)
where the expectation EX is taken with respect to the distribution of X , which is
standard normal, and Φ(.) denotes the cumulative distribution function of N(0, 1).
We generated n = 2, 000 data points (Y1, X1), ..., (Yn, Xn). The EL-posterior for
(θ, r) was constructed based on (3.1), with priors π(θ) ∼ N(0, 1), π(r) ∼ Uniform[0, 1],
and π(θ, r) = π(θ)π(r). According to Theorem 3.2, the posterior distribution should
15

concentrate around the risk curve {(θ, R(θ))}. To illustrate this, B = 10, 000
MCMC draws were then generated from the EL-posterior. In each step of the
Metropolis algorithm, we used proposal density θt ∼ N(θt−1, 0.5), and rt ∼ U [0, 1].
The first quarter of the draws were treated as the “burn-in” period and were dis-
carded.
Figure 1: Plot of R(θ) and MCMC draws
−4 −3 −2 −1 0 1 2 3 40.1
0.2
0.3
0.4
0.5
0.6
!
R(!)MCMC draws of (r,!)
The solid line in Figure 1 represents the expected risk curve R(θ) against θ,
and the dots represent the scatterplot of the MCMC draws of (θ, r). It is clearly
illustrated that the MCMC draws are clustered around the true expected curve, sup-
porting our posterior consistency result. Therefore the scatterplot of the MCMC
draws can clearly demonstrate the functional relationship of the true risk R(θ) re-
sulting from each action θ, even though the true distribution of (Y,X) is unknown
in practice.
In addition, our method also gives the posterior distribution of the action θ to
achieve a certain risk level. For example, if we want to control the classification
risk to be no greater than the 5th percentile of the posterior distribution of r, we
16

could let r0 be the 5th percentile of the MCMC draws of r, which is r0 = 0.163,
and focus on PEL(θ|D, r ≤ r0). If we want to control the classification risk to be
at the minimized empirical risk minθ R̂(θ) = 0.159, we could focus on the posterior
PEL(θ|D, r = minθ R̂(θ)). See Figure 2 as the plotted posterior densities of θ in
these two cases respectively. Both graphs demonstrate that the EL-posterior has
high density levels around zero, which is the global minimizer of R(θ) in (5.1).
Figure 2: EL-posterior densities of PEL(θ|D, r ≤ r0) and PEL(θ|D, r = minθ R̂(θ))
−2 −1.5 −1 −0.5 0 0.5 1 1.5 2!
P(! | D, r" r0)
−2 −1.5 −1 −0.5 0 0.5 1 1.5 2!
P(! | D, r= min! hat R(!))
We also plot PEL(r|D, θ = arg minθ R̂(θ)), which is the EL-posterior of the risk
given that the empirical risk minimizer is taken. The plot can be compared with the
marginal EL-posterior of r (See Figure 3), which is obtained by numerically inte-
grating out θ. While the marginal posterior PEL(r|D) is supported approximately
on [0.15, 0.5], the density is high when r is between 0.15 and 0.2. Moreover, after
conditioning on θ = arg minθ R̂(θ), the posterior of r is only supported (and has
17

very high posterior density) around [0.15, 0.2], which is a small interval containing
the minimal classification error minR(θ) = 0.1667 based on C(X, θ) = I(X−θ>0).
Figure 3 also illustrates that PEL(r|D) has not much support when r < minR(θ).
Figure 3: EL-posterior densities of PEL(r|D, θ = arg minθ R̂(θ)) and PEL(r|D)
0.1 0.15 0.2 0.25 0.3 0.35 0.4 0.45 0.5 0.55 0.6r
P(r | D, !=argmin! hat R(!))
0.1 0.15 0.2 0.25 0.3 0.35 0.4 0.45 0.5 0.55 0.6r
P(r | D)
Figure 4 plots the theoretical (expected) risk R(θi) = E(ρ(W, θ)|θ = θi) versus
the controlled levels of risk r0 = 0.2, 0.25, 0.3, ..., 0.65, where each θi is from the
MCMC draw (θi, ri), whose paired ri is less than or equal to r0. In other words, one
can think of the dots in Figure 4 with the same horizontal coordinate r0 as {R(θi)},
where {θi} are generated from the EL-posterior density PEL(θ|r ≤ r0, D). We can
see that almost all the dots are below the identical line R(θ) = r0 (with very low
percentage of exceptions). This indicates that, once the action θ is generated from
PEL(θ|r ≤ r0, D), the true risk can be effectively controlled to be no greater than
18

r0 as well. Finally, none of the elements in {R(θi)} are less than 0.166. This is
because the minimal expected risk that can be achieved by the linear classification
rule C(X, θ) = I(X≥θ) is R(0) = 0.1667.
Figure 4: Scatter plot of (R(θi), r0)
0 0.1 0.2 0.3 0.4 0.5 0.6 0.70
0.1
0.2
0.3
0.4
0.5
0.6
0.7
r0
R(!)
The dots with the same horizontal coordinate r0 represent {R(θi)} where {θi} are generated
from PEL(θ|r ≤ r0, D). When r0 ≤ 0.5, 97.3% dots are below the identical lineR(θ) = r0.
6 German Credit Data: an Empirical Application
6.1 Data set and model specification
As an empirical example, we apply the proposed Bayesian empirical likelihood
method to the credit risk classification problem, using the German Credit Bench-
mark data set provided by Asuncion and Newman (2007). The data set consists of
n =1,000 past applicants and their credit rating (GOOD or BAD), which serves as
the target variable Y . In addition, there are 24 attributes served as input variables,
which are used as the predictors X . The attributes are either ordered categorical,
such as “Credit History”, “Personal Status and Sex”, “Housing”, “Employment”, or
19

numerical, such as “Credit Duration”, “Credit Amount”, and “Age”. See Asuncion
and Newman (2007) for a complete description of the data set.
The classification rule using the jth observation is C(Xj, θ) = I(X1jθ0 + θ1 +∑24i=2Xijθi > 0). Here Xij denotes the realization of individual j on variable
Xi, i = 1, ..., 24. Note that for the purpose of normalization in regular binary re-
gression, Horowitz (1992) suggested that X1 should be a continuous variable whose
coefficient θ0 ∈ {−1,+1}. Therefore, the components of the covariates are arranged
so that X1j denotes the jth observation of “Credit Duration”, which is a continuous
variable, and it is reasonable to assume that it is related to each customer’s credit
behavior. We also included an intercept θ1. In addition, the continuous attributes
were normalized, i.e., subtracted mean and divided by the standard deviation.
For the credit classification problem, the cost matrix is given by the following
table as in West (2000):
Table 1: Cost Matrix
Classification
GOOD BAD
Target Variable GOOD 0 1
BAD 5 0
Note that the cost matrix is asymmetric, this is because the penalization for mis-
classifying a Bad target variable Y into Good should be more severe than the oppo-
site situation. Therefore the loss function is
ρ(Y,X; θ) = I(Y = Good, C(X, θ) = Bad) + 5I(Y = Bad,C(X, θ) = Good).
The method proposed in the previous sections can be applied for variable selection.
Let ψ = (ψ1, ..., ψ24) denote a vector of selection indicators such that for each i =
20

1, ..., 24, ψi = 1 if variable Xi is selected, and ψi = 0 otherwise. We then have the
selected parameters θψ = (θ1ψ1, ..., θ24ψ24). A zero component of θψ corresponds
to an unselected covariate. We set ψ1 = 1 so that the intercept θ1 is always kept
in the model. Therefore the actual classification rule based on θψ is C(Xj, θψ) =
I(θ0X1j + θ1 +∑24
i=2Xijθiψi > 0), where θ0 ∈ {−1, 1}.
The log-empirical likelihood function for (θ, r, ψ) is given by
logEL(θ, r, ψ) = −maxµ∈R
n∑i=1
log{1 + µ[ρ(Yi, Xi, θψ)− r]}.
We want to obtain an action θψ so as to achieve a low risk. Hence for a pre-
determined threshold value r0, a conditional prior is placed: π(θ, r, ψ|r ≤ r0) =
π(θ|ψ, r, r ≤ r0)π(ψ, r|r ≤ r0). It is assumed that π(θ|ψ, r, r ≤ r0) = π(θψ|ψ),
and π(ψ, r|r ≤ r0) = π(ψ)π(r|r ≤ r0), in which
π(θψ|ψ) ∼ N(0, 10I|ψ|),
π(ψ) =24∏i=2
π(ψi), π(ψi) ∼ Binomial(1, λ),
π(r|r ≤ r0) ∼ Uniform[0, r0].
where |ψ| denotes the number of nonzero components of ψ, I|ψ| denotes the |ψ|×|ψ|
identity matrix, and λ represents the prior expectation of the fraction of selected
variables, set to 0.5 in our application. Therefore we a priori expect half of the
variables to be selected. The posterior distribution is then given by
PEL(θ, ψ, r|D, r ≤ r0) ∝ EL(θ, r, ψ)e−120
∑24i=1 θ
2i ψiλ|ψ|−1(1− λ)24−|ψ|I(0 < r < r0).
6.2 Algorithm description
The Metropolis-Hastings algorithm was conducted to obtain the MCMC draws
from the posterior distribution. We use the algorithm described in Chen, Jiang and
21

Tanner (2010), in which each iteration combines BETWEEN steps that propose
changes of ψ for selecting different variables, with the WITHIN steps that propose
changes of θ once ψ is fixed. These steps are described as follows: (in the algorithm
below, denote q(θ) as the density function of N(0, 0.5).)
BETWEEN Step Update θ to θ′ with model indices changing from ψ to ψ′.
1. (Add/Delete) Randomly choose an index j ∈ {2, ..., 24}.
• If ψj = 1, propose ψ̃j = 0 and let θ̃ = θ. Let ψ̃i = ψi for i 6= j. This
proposal is accepted with probability
min
{1,PEL(θ̃, ψ̃, r|D)q(θj)
PEL(θ, ψ, r|D)
}.
• If ψj = 0, propose ψ̃j = 1, and generate θ̃j ∼ N(0, 0.5) with all remain-
ing components of θ unchanged. Let ψ̃i = ψi for i 6= j. This proposal is
accepted with probability
min
{1,
PEL(θ̃, ψ̃, r|D)
PEL(θ, ψ, r|D)q(θ̃j)
}.
2. (Swap) When 1 < |ψ̃| < 24, randomly choose two indices k, l ∈ {2, ..., 24},
such that ψ̃k = 0 and ψ̃l = 1. Propose ψ′k = 1 and ψ′l = 0, and θ′k ∼ N(0, 0.5).
This proposal is accepted with probability
min
{1,PEL(θ′, ψ′, r|D)q(θ̃l)
PEL(θ̃, ψ̃, r|D)q(θ′k)
}.
WITHIN Step Update θ′ to θ∗ with model indices fixed and with the nonzero val-
ues of θ′ changed: For each index j such that ψ′j = 1, generate θ∗j ∼ N(θ′j, 0.5).
Generate r∗ ∼ Uniform[0, c] for some c > 0. Accept θ∗ with probability
min
{1,PEL(θ∗, ψ′, r∗|D)
PEL(θ′, ψ′, r|D)
}.
22

The constant c in the WITHIN Step is chosen to be a threshold. We can simply set c
to be an upper bound of the loss function. Alternatively, it can also be a level below
which the classification error is expected to be controlled.
6.3 Implementation and results
The data set is randomly divided into two groups: training data (2/3) {(Y ti , X
ti )}nt
i=1
and validation data (1/3) {(Y vi , X
vi )}nv
i=1. To select a threshold r0, a chain Θ0 =
{θi}10,000i=1 is first generated from the prior π(θψ|ψ)π(ψ).2 In order to achieve a low
level of risk, r0 is selected as the first percentile of the empirical risk based on the
training data: let
R̂t(θ) =1
nt
nt∑i=1
ρ(Y ti , X
ti ; θ).
Set r0 to be the first percentile of {R̂t(θi) : θi ∈ Θ0}, which is 0.6882.
To generate samples from the posterior PEL(θ, ψ, r|training, r ≤ r0), the MCMC
algorithm described in the previous section is carried out for 20, 000 times based on
the training data, with the first one fifth draws treated as the “burn-in period”. We
therefore obtainB1 = 16, 000 draws of the triplet: (Θ1,R1,Ψ1) = ({θi}B1i=1, {ri}
B1i=1, {ψi}
B1i=1).
We then obtain a “good” action θ∗ from the MCMC draws, and evaluate its perfor-
mance on the validation data through the empirical risk
R̂v(θ∗) =1
nv
nv∑i=1
ρ(Y vi , X
vi ; θ∗).
The action θ∗ is obtained based on (Θ1,R1,Ψ1) via three different procedures as
described below:2Note that two chains are actually obtained, one for θ and the other for ψ. At this step we are only
interested in the chain of θ.
23

(i) Posterior mean θ∗ is the sample average of {θi : θi ∈ Θ1}, which also is an
approximation of the posterior mean E(θ|training, r ≤ r0).
(ii) Further restricted threshold First determine r∗ to be the 1st, 5th, and 10th
percentiles of {ri : ri ∈ R1} respectively. Define Θ∗1 = {θi ∈ Θ1 : ri ≤
r∗, i = 1, ..., B1}. Let θ∗ be the average of the elements in Θ∗1, which is
an approximation of E(θ|training, r ≤ r∗). Therefore instead of averaging
over all the draws in Θ1, we average actions conditioning on further restricted
threshold value r∗. This procedure gives us three different θ∗’s, corresponding
to three chosen r∗’s.
(iii) Variable selection For each ψi ∈ Ψ1, write ψi = (1, ψi2, ..., ψi,24)T . For each
j = 2, ..., 24, let P (j) = 1B1
∑ψi∈Ψ1
ψij , which calculates the sampling fre-
quency of variable j in MCMC. Let ψ∗j = I(P (j) ≥ k), for a pre-determined
value k ∈ [0.5, 1], and ψ∗ = (1, ψ∗2, ..., ψ∗24) as a new model index which
includes all the selected variables. Hence the sampling frequency of each se-
lected variable in ψ∗ is at least k, which are identified as “important variables”
by MCMC.
Now obtain a set ofB2 = 10, 000 new MCMC draws (Θ2,R2) = ({θi}B2i=1, {ri}
B2i=1)
from PEL(θψ∗, r|training, ψ∗, r ≤ r0). Repeat either part (i) or part (ii) as de-
scribed above. This procedure conducts variable selection before taking the
posterior mean.
We compare our method with the classical ERM method (empirical risk minimiza-
tion, e.g., Mohammadi and Van De Geer (2005)). The ERM action θ0 is defined
as θ0 = arg min R̂t(θ). The empirical risk on the validation data from ERM is
R̂v(θ0) = 0.6637.
Table 2 summarizes R̂v(θ∗) on the validation data when θ∗ is obtained via either
24

procedure (i) or (ii), as well as the actual values of r∗ in (ii). The initial threshold
r0 = 0.6882, which is the first percentile of R̂t(θ) when θ is generated directly from
the prior. The posterior mean E(θ|training, r ≤ r0) results in a smaller empirical
risk on the validation data than that of ERM. In addition, the performance can be
significantly improved by using E(θ|training, r ≤ r∗) when r∗ is further restricted
to be the low percentiles of the MCMC drawsR1.
Table 2: Empirical risk of θ∗ based on validation data
Posterior Mean Further Restricted Threshold
1st 5th 10th ERM
r∗ 0.6882 0.6090 0.6285 0.6384
R̂v(θ∗) 0.6456 0.6156 0.6126 0.6186 0.6637
For the Posterior Mean, θ∗ approximates E(θ|training, r ≤ 0.6882); for the Fur-
ther Restricted Threshold, θ∗ approximates E(θ|training, r ≤ r∗), where r∗ =
0.6090, 0.6285, 0.6384 are the 1st, 5th, and 10th percentiles of MCMC drawsR1 = {ri}B1i=1.
Note that the empirical risk of ERM is 0.6637 on the validation data.
For the variable selection method described in part (iii) above, it is found that in
addition to “Credit Duration”, there are other three variables selected by all the draws
in (Θ1,R1,Ψ1). We denote by M1 as the model containing these four variables
only (including Credit Duration). Meanwhile there are seven variables in total with
P (j) ≥ 0.5. The model containing these seven variables is denoted by M2. We
then generate a new set of MCMC draws ({θi}B2i=1, {ri}
B2i=1) for ψ∗ = M1, and M2
respectively, and obtain θ∗ by the Posterior Mean and Further Restricted Threshold
methods for both models. Table 3 summarizes the empirical risk on the validation
data using θ∗ obtained by variable selection.
When r∗ is as low as the first percentile of the new MCMC draws R2, the pos-
terior mean E(θ|training,M1, r ≤ r∗) performs the worst compared to alternative
25

Table 3: Empirical risk of θ∗ after variable selection
Posterior Mean Further Restricted Threshold
1st 5th 7th 10th
M1
r∗ 0.6882 0.6253 0.6372 0.6407 0.6447
R̂v(θ∗) 0.6426 0.7147 0.6156 0.6216 0.6306
M2
r∗ 0.6882 0.6182 0.6378 0.6409 0.6471
R̂v(θ∗) 0.6547 0.6577 0.6306 0.6517 0.6667
For the Posterior Mean, θ∗ approximates E(θ|training, ψ∗, r ≤ 0.6882); for the Further
Restricted Threshold, θ∗ approximates E(θ|training, ψ∗, r ≤ r∗), where ψ∗ corresponds to
M1 and M2 respectively, and r∗ is determined as the 1st, 5th, 7th and 10th percentiles of
MCMC drawsR2 = {ri}B2i=1.
methods on the validation data (R̂v = 0.7147), because the chosen threshold value
r∗ (0.6253) is too low to be realistically achieved by model M1. For M2, when r∗ is
the first percentile, the empirical risk (0.6577) is also higher than those conditioned
on the higher percentiles, which can be explained for the same reason: the threshold
0.6182 is probably not realistically achievable by M2. On the other hand, when r∗
is set to the 5th percentile, the posterior mean then performs well on the validation
data (R̂v = 0.6156 for M1 and 0.6306 for M2.) As r∗ is set to be higher percentiles,
the empirical risk gradually increases. Note that all the empirical risks are either
comparable to or better than the empirical risk of the ERM (0.6637), but simpler
models with selected variables have better interpretability of the rationale for the
credit decision in empirical applications. The selected variables in M1 and M2 are
listed in Table 4.
We would like to emphasize that although our method is specially designed to
provide a new framework to make robust inference on the risk and on the corre-
sponding actions to take, however, this real data example demonstrates that it can
26

still perform comparably or favorably relative to the classical empirical risk mini-
mization method, when it is indeed used for the purpose of risk minimization.
Table 4: List of selected variables in M1 and M2
Model Variables
M1 Duration of Credit Credit Amount
Property Age
M2 Duration of Credit Credit Amount
Liable to provide maintenance Age
Sex and Marriage Status Property
Housing
7 Conclusion
We considered an approximate joint posterior inference on the action and the
associated risk in the classification problem. We introduced a prior distribution on an
auxiliary parameter θ. Unlike a standard parameter, θ is not a functional of the data
generating process, but only indexes a decision rule to be studied by the user. Our
contribution is to provide a new framework for the posterior relationship between
the risk and actions. This framework is useful in making robust joint inference of
(θ, r) without knowing the distribution of the data generating process.
The posterior distribution is based on an empirical likelihood, which imposes a
moment restriction relating the action to the resulting risk, but does not otherwise
require a probability model for the underlying data generating process. As there
is no need to assume the true likelihood function, such an EL-posterior approach
based on a moment-condition likelihood is robust and computationally efficient. It
27

has been shown that this procedure works well when the sample size is large, since
the empirical likelihood can be interpreted as the approximation to the true underly-
ing likelihood function asymptotically. We show in the appendix that in the binary
classification problem with the absolute loss function, the EL-posterior is equiva-
lent to Schennach (2005)’s BETEL, therefore Schennach’s argument also provides
a distributional interpretation for the EL-posterior in our paper.
An important feature of our approach is that the parameters (θ, r) are not fully
identified. The posterior density therefore does not degenerate to a point probability
mass, but asymptotically concentrates around the curve {(θ, r) : E[ρ(W, θ)] = r},
as the functional relationship of (θ, r) is identified. Therefore we can generate the
desired action θ from PEL(θ|r < r0, D), given a risk r0 that the decision maker
can tolerate. We illustrated by examples how this method is used to describe the
EL-posterior of the actions to take in order to achieve a low risk, or conversely,
to describe the posterior of the resulting risk for a given action. In addition, this
approach can also be applied to variable selection.
A Appendix
A.1 Proof of Theorem 3.1
Proof. DefineL(µ) =∑n
i=1 log[1+µ(|Yi−C(Xi, θ)|−r)]. Let n1 be the number of i
such that |Yi−C(Xi, θ)| = 0, and n2 be the number of i such that |Yi−C(Xi, θ)| =
1. Note that R̂ = n−1∑n
i=1 |Yi − C(Xi, θ)| = n−1n2, and n1 + n2 = n. Since
|Yi − C(Xi, θ)| ∈ {0, 1}, we have
L(µ) =∑
i:|Yi−C(Xi,θ)|=0
log(1− µr) +∑
i:|Yi−C(Xi,θ)|=1
log(1 + µ(1− r))
= n1 log(1− µr) + n2 log(1 + µ(1− r))
28

Differentiating L(µ) and setting to zero, it is straightforward to verify that the opti-
mal µ∗ = n2−nrnr(1−r) , with maxµ L(µ) = (n− n2) log n−n2
n(1−r) + n2 log n2
nr. Replacing n2
by nR̂ yields maxµ L(µ) = nK(R̂, r). Finally, we verify that the second derivative
L′′(µ∗) = −n3(1−r)2r2n2n1
< 0 when r ∈ (0, 1). Q.E.D.
A.2 Proof of Theorem 3.2
The following lemma establishes some relationships between the expression in
the log-empirical likelihood and the square (or absolute value) distances.
Lemma A.1. For p, q ∈ [0, 1], and K(p, q) as defined in (3.2),
0.5(q − p)2 ≤ K(p, q) ≤ {min(p, q, 1− p, 1− q)}−20.5(p− q)2. (A.1)
Proof. This is straightforward by a second order Taylor expansion of − ln(1 + δ1,2),
where δ1 = q/p− 1 and δ2 = (1− q)/(1− p)− 1. Q.E.D.
Proof of Theorem 3.2
Denote R = E∗ρ(W, θ) and ∆ = supθ |R̂−R|, then
PEL[|R−r| > ε|D] ≤∫I(|R−r| > ε)I(∆ ≤ ε/2)e−nK(R̂,r)dπ/
∫e−nK(R̂,r)dπ+
I(∆ > ε/2). The numerator of the first term is less than e−nε2/8 since |R̂ − r| ≥
|R− r| −∆ > ε/2 and this implies K(R̂, r) > ε2/8 due to a previous lemma.
The denominator is bounded by∫e−nK(R̂,r)dπ ≥
∫I(|R− r| ≤ δ)I(∆ ≤ δ/2)I(η ≥ τ)e−nK(R̂,r)dπ
≥ e−n(τ−δ/2)−2(9/8)δ2π(|R − r| ≤ δ, η ≥ τ)I(∆ ≤ δ/2), where η = min(R, 1−
R, r, 1 − r) and δ and τ are some positive constants. Here we used again a pre-
vious lemma to bound K(R̂, r) ≤ {min(R̂, 1 − R̂, r, 1 − r)}−20.5(R̂ − r)2 ≤
(τ − δ/2)−20.5(R̂− r)2 ≤ (τ − δ/2)−20.5(δ + δ/2)2.
29

Combining these we obtain: the event ∆ ≤ min{δ/2, ε/2} implies the event
PEL(|R− r| > ε|D) ≤ e−nε2/8+(9n/8)(δ/(τ−δ/2))2
π(|R− r| ≤ δ, η ≥ τ).
Note that π(|R − r| ≤ δ, η ≥ τ) > 0 by assumption. Choose constants τ and δ
suitably, then the right hand side can be made arbitrarily close to zero (and expo-
nentially small in n). This happens with P nW , the probability in D being at least
P nW (∆ ≤ min{δ/2, ε/2}), which converges to 1 by assumption. Q.E.D.
A.3 Equivalence between Schennach’s BETEL and EL-Posterior
Suppose we observe i.i.d. data of D = (W1, ...,Wn). It is assumed that some
unknown parameter (θ, r) satisfies moment condition:
E(ρ(W, θ)|θ) = r.
Schennach (2005) proposed a nonparametric Bayesian procedure based on the above
moment condition to derive a moment-condition-based posterior, known as “Bayesian
exponentially tilted empirical likelihood posterior” (BETEL):
P (θ, r|D) ∝ π(θ, r)n∏i=1
wi(θ, r)
where (w1(θ, r), ..., wn(θ, r)) are the solutions to
maxw1,...,wn
{n∑i=1
−wi logwi|∑i
wi = 1,∑i
wi(ρ(Wi, θ)− r) = 0}.
Theorem A.1. Consider the classification problem ρ = |Y −C(X, θ)|, Y,C(X, θ) ∈
{0, 1} and r ∈ [0, 1]. Define the empirical risk R̂(θ) = n−1∑n
i=1 |Yi − C(Xi, θ)|.
If R̂(θ) ∈ (0, 1), then Schennach (2005)’s BETEL is equivalent to the EL-posterior
defined in Theorem 3.1.
30

Lemma A.2. The interior of the convex hull of⋃ni=1{ρ(Wi, θ) − r} contains the
origin if and only if r ∈ (0, 1) and R̂(θ) ∈ (0, 1).
Proof. First of all, note that R̂(θ) ∈ (0, 1) if and only if mini≤n ρ(Wi, θ) = 0 and
maxi≤n ρ(Wi, θ) = 1.
As ρ(W, θ) = |Y−C(X, θ)| is one-dimensional, the convex hull of⋃ni=1{ρ(Wi, θ)−
r} is an interval [mini ρ(Wi, θ)− r,maxi ρ(Wi, θ)− r], whose interior is
(mini|Yi − C(Xi, θ)| − r,max
i|Yi − C(Xi, θ)| − r)
When r ∈ (0, 1), as long as there exists a correctly classified (Yi, Xi) and at least an
incorrectly classified (Yi, Xi), mini |Yi−C(Xi, θ)| = 0, and maxi |Yi−C(Xi, θ)| =
1. Hence 0 ∈ (mini |Yi − C(Xi, θ)| − r,maxi |Yi − C(Xi, θ)| − r). This proves the
sufficiency.
On the other hand, if either maxi |Yi−C(Xi, θ)| = 0 or mini |Yi−C(Xi, θ)| = 1,
0 /∈ (mini |Yi − C(Xi, θ)| − r,maxi |Yi − C(Xi, θ)| − r). If r = {0, 1}, clearly
0 /∈ (mini |Yi − C(Xi, θ)| − r,maxi |Yi − C(Xi, θ)| − r) either. This proves the
necessity.
Proof of Theorem A.1
Proof. The proof is based on Corollary 1 of Schennach (2005). When r ∈ (0, 1) and mini |Yi−
C(Xi, θ)| = 0,maxi |Yi − C(Xi, θ)| = 1 (which implies R̂(θ) ∈ (0, 1)), by the pre-
vious lemma, the interior of the convex hull of⋃ni=1{ρ(Wi, θ) − r} contains the
origin. By Corollary 1 and expressions (9), (10) in Schennach (2005), P (θ, r|D) ∝
limm→∞ π(θ, r)∫P (D|ξm)P (ξm|θ, r)dξm can be obtained by
P (θ, r|D) ∝ π(θ, r)n∏i=1
wi(θ, r)
31

where
wi(θ, r) =exp(λ(θ, r)[ρ(Wi, θ)− r])∑ni=1 exp(λ(θ, r)[ρ(Wj, θ)− r])
λ(θ, r) = arg mint
n∑i=1
exp(t[ρ(Wi, θ)− r])
We can immediately obtain: when R̂(θ) ∈ (0, 1), λ(θ, r) = log((n1r)/(n2(1− r)))
where n1 + n2 = n, n2 = nR̂(θ). Then∏
iwi(θ, r) = exp(−nK(R̂(θ), r))n−n,
where K(, ) is given by (3.2). If r ∈ {0, 1} and R̂(θ) ∈ (0, 1), 0 is not in the
interior of convex hull of⋃ni=1{ρ(Wi, θ)− r}. By Corollary 1 of Schennach (2005),
P (θ, r|D) = 0. In this case, from (3.2), exp(−nK(R̂(θ), r)) = 0. Hence we
conclude that whenR ∈ (0, 1), P (θ, r) ∝ π(θ, r) exp(−nK(R̂(θ), r)). By Theorem
3.1, P (θ, r|D) = PEL(θ, r|D). Q.E.D.
References
[1] ASUNCION, A. and NEWMAN, D.J. (2007). UCI Machine Learning Repository
[http://www.ics.uci.edu/ mlearn/MLRepository.html]. Irvine, CA: University of
California, School of Information and Computer Science.
[2] CHAUDHURI, S. and GHOSH, M. (2010) Empirical likelihood for small area
estimation. To appear in Biometrica.
[3] CHEN, K., JIANG, W. and TANNER, M. (2010). A note on some algorithms for
the Gibbs posterior. Statistics and Probability Letters. 80 1234-1241
[4] CHERNOZHUKOV, V. and HONG, H. (2003). An MCMC approach to classical
estimation. Journal of Econometrics. 115 293-346
32

[5] CHERNOZHUKOV, V., HONG H. and TAMER E. (2007). Estimation and con-
fidence regions for parameter sets in econometric models. Econometrica. 75
1243-1284
[6] DEVROYE, G., GYORFI, L and LUGOSI, G (1996). A Probabilistic Theory of
Pattern Recognition. Springer, New York.
[7] GUSTAFSON, P. (2010). Bayesian Inference for Partially Identified Models. The
International Journal of Biostatistics, 6, Iss. 2, Article 17.
[8] HOROWITZ, J. (1992) A smoothed maximum score estimator for the binary
response model. Econometrica. 60 505-531.
[9] KIM, J. (2002). Limited information likelihood and Bayesian analysis. Journal
of Econometrics. 107 175-193.
[10] KITAMURA, Y. (2001). Asymptotic optimality of empirical likelihood for test-
ing moment restrictions. Econometrica. 69 1661-1672.
[11] LAZAR, N. (2003). Bayesian empirical likelihood. Biometrika. 90 319-326.
[12] LIAO, Y. and JIANG, W. (2010). Bayesian analysis of moment inequality mod-
els. The Annals of Statistics. 38 275-316.
[13] MANSKI, C. (2007). Identification for Prediction and Decision. Harvard Uni-
versity Press.
[14] MONAHAN, J. and BOOS, D. (1992) . Proper likelihoods for Bayesian analy-
sis. Biometrika, 79, 271278.
[15] MOHAMMADI, L. and VAN DE GEER, S. (2005) Asymptotics in empirical
risk minimization. Journal of Machine Learning Research. 6 2027-2047.
33

[16] MOON, H. and SCHORFHEIDE, F. (2010). Bayesian and Frequentist Inference
in Partially Identified Models. Manuscript. University of Southern California.
[17] OWEN, A. (1990). Empirical likelihood for confidence regions. The Annals of
Statistics. 18 90-120.
[18] POIRIER, D. (1998). Revising beliefs in nonidentified models. Econometric
Theory. 14 483-509.
[19] QIN, J. and LAWLESS, J. (1994). Empirical Likelihood and general estimating
equations. The Annals of Statistics. 22 300-325.
[20] RAGUSA, G. (2007). Bayesian Likelihoods for Moment Condition Models.
Manuscript, University of California, Irvine.
[21] RAO, N. and WU, C. (2010). Bayesian pseudo-empirical-likelihood intervals
for complex surveys. Journal of Royal Statistical Society, Ser. B. 72 533-544
[22] SCHENNACH, S. (2005). Bayesian exponentially tilted empirical likelihood
Biometrika. 92 31-46.
[23] TAMER, E. (2010). Partial identification in econometrics. Annual Review of
Economics. 2, 167-195.
[24] VAPNIK, V. and CHERVONENKIS, A. (1971). On the uniform convergence of
relative frequencies of events to their probabilities. Theory of probability and its
applications. 16 264-280
[25] WEST, D. (2000). Neural network credit scoring models. Computers and Op-
erations Research. 27 1131-1152.
34